comparison of the classificationof placeof
TRANSCRIPT

DATA ‘EVALUATION AND METHODS RESEARCHSeries 2Number 30
comparison of the
Classificationof PlaceofResidenceon Death Certificatesand Matching CensusRecordsUnited States - May - August 1960
Comparison of the classification of residence stated on the death
certificate with residence as stated on the matching census record
for selected geographic areas by age, race, and sex. Based on a sam-
ple of death certificates for deaths occurring in the United Statesduring May-August 1960, matched to 1960 census records.
DHEW Publication No. (HRA) 74-1287
U.S. DEPARTMENT OF HEALTH, EDUCATION, AND WELFAREPublic Health Service
Health Resources Administration
National Center for Health Statistics
Rockville, Maryland

Vital and Health Statistics Series 2-No. 30First issued in the Public Health Service Publication Series No. 1000
January 1969
NATIONAL CENTER FOR HEALTH STATISTICS
EDWARD B. PERRIN, Ph. D., Director
PHILIP S. LAWRENCE, SC.D., Deputy Director
GAIL F. FISHER, Director for Health Stat&ics Development
JAMES E. KELLY, D.D.S., Dental Advisor
EDWARD E. MINTY, Executive Officer
ALICE HAYWOOD, Information Officer
Vital and Health Statistics-Series 2-No. 30
DHEW Publication No. (HRA) 74-1287
Library of Gnzgress Catalog Card Number 68-62238● .

CONTENTSPage
Introduction ----------------------------------------------------------
Major Findings -------------------------------------------------------
Urban Places ---------------------------- -----------------------------
Population-Size Groups ------------------------------------------------Underenumeration in-1960 Census of Population --------- ---------------Followback Survey --------------------------------------------------
Metropolitan and Nonmetropolitan Counties for Urban and Rural Areas ------
StandardMetropolitan Statistical Areas ----------------------------------
Age by GeographicDivision ---------------------------------------------
Race by Geographic Region ---------------------------------------------
References -----------------------------------------------------------
Selected Biblio~aphy --------------------------------------------------
Detailed Tables -------------------------------------------------------
Technical Appendix------------------------------:---------------------Design of Study----------------------------------=------------------Criteria for Matching -----------------------------------------------Variances ---------------------------------------------------------Age-------------------- -------------------------------------------Race and Color -----------------------------------------------------Sex----------- ----------------------------------------------------Urban and Rural Areas ----------------------------------------------Standard Metro@itan Statistical Areas -------------------------------Metropolitan and Nonmetropolitan Counties ----------- -----------------Geographic Divisions and Regions ------------------------------------Formula for Adjusting Annual Death Rate ------------------------------Net and Gross Difference Rates --------------------------------------
1
2
2
455
6
7
9
10
11
12
13
56565757575858585959595960
...Ill

IN THIS REPORT a comparison of the classification of residence
stated on the death certificate with residence as stated on the matching
census record for selected geographic re~”ons by demographic vavia blesis ~esented.
The classification of residence information on the death certificates
corresponds closely to the vesidence on the censws records for the de-cedents whose records were matched. An inverse relationship existsbetween the size of the geo~aphic area and the degree of difference be-tween censws assignments and those by the National Center for HealthStatistics (NCHS) with differences approaching zeYo as the size of the
area increases. NCHS somewhat overstates the num bars of deaths forindividual urban places and understates those for rural areas. Towns,
townships, boroughs in Connecticut, New Jersey, and Pennsylvania,territorial annexations between 1950 and 1960, and urban j%inge aveaspresented problems to NCHS in properly allocating thevesidence of the
decedents. The poovest age agreement between the census records and
the death certificates was for the nonwhite group at ages 85-99 years inthe geographic divisions comprising the South Re@”on. The average pro-portion of vecords unmatched UMS 50 percent highs? for the nonwhite
gvoup than for the white. Both the differences by race between censusand NCHS vecords and the match statws were most favora Me for thewhite population and the ’Japanese when compared with other vacial andethnic groups. Differences by sex were negligible.
I
SYMBOLS
Category not applicable ------------------- . . .
Quantity zero ----------------------------
Net difference rate not computed if censusfrequency is the same as NCHS frequency-
1-Net difference rate not computed if either
census frequency or NCHS frequency orboth are zero -------------------------- I
Quantity more than O but less than 0.05 ----- 0.0
iv
COMPARISON OF THE
CLASSIFICATION OF PLACE OF RESIDENCE ONDEATH CERTIFICAT-- A‘ ‘- ‘ ‘ “ ‘-” 9“’ “-
CENSUS
kS AND MA I CHING
RECORDS
Mary A.
INTRODUCTION
The chief purpose of the 1960
McCarthy, Division of Vital Statistics
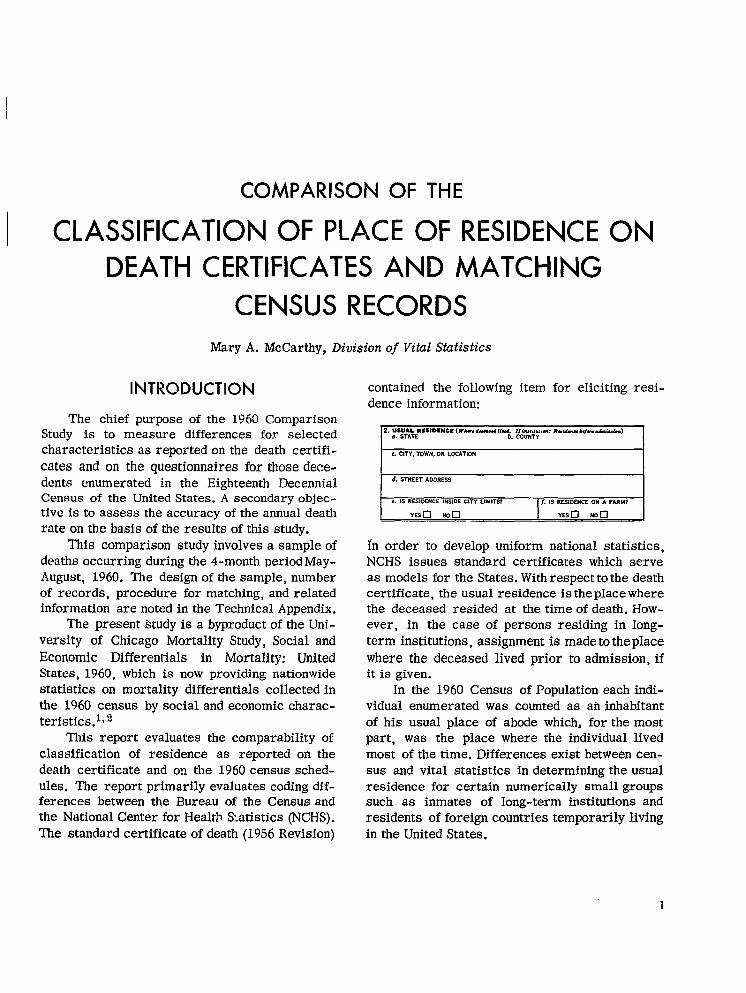
contained the following item for eliciting resi-dence information:
ComparisonStudy is to measure differences for s-electedcharacteristics as reported on the death certifi-cates and on the questionnaires for those dece-dents enumerated in the Eighteenth DecennialCensus of the United States. A secondary objec-tive is to assess the accuracy of the annual deathrate on the basis of the results of this study.
This comparison study involves a sample ofdeaths occurring during the 4-month periodMay-August, 1960. The design of the sample, numberof records, procedure for matching, and relatedinformation are noted in the Technical Appendix.
The present study is a byproduct of the Uni-versity of Chicago Mortality Study, Social andEconomic Differentials in Mortality: UnitedStates, 1960, which is now providing nationwidestatistics on mortality differentials collected inthe 1960 census by social and economic charac-teristics.ll 2
This report evaluates the comparability ofclassification of residence as reported on thedeath certificate and on the 1960 census sched-ules. The report primarily evaluates coding dif-ferences between the Bureau of the Census andthe National Center for Health Statistics (NCHS).The standard certificate of death (1956 Revision)
2. #WAL=M51MllCE ( Wk. tidlidb, l(iyi&t,m: R.dawI $@,-. hb.i.m)
C. CITY,TOWN, OR LOCATION
d. STREET ADDRESS
c IS RESIDE!(CE !NSIDE CITY LlMlT51 /. IS RESIDENCE ON A FARM7
YES!J non YEso Non
In order to develop uniform national statistics,NCHS issues standard certificates which serveas models for the States. With respect to the deathcertificate, the usual residence is the place wherethe deceased resided at the time of death. i30w-ever, in the case of persons residing in long-term institutions, assignment is made to the placewhere the deceased lived prior to admission, ifit is given.
In the 1960 Census of Population each indi-vidual enumerated was counted as an inhabitantof his usual place of abode which, for the mostpart, was the place where the individual livedmost of the time. Differences exist between cen-sus and vital statistics in determining the usualresidence for certain numerically small groupssuch as inmates of long-term institutions andresidents of foreign countries temporarily livingin the United States.
1
The residence data shown in this report weregrouped into six major categories:
(1) Urban places of 25,000 population or morein 1960
(2) Population-size groups of areas(3) Metropolitan and nonmetropolitan counties,
urban and rural areas(4) Standard metropolitan statistical areas(5) Geographic divisions(6) Geographic regions
(For definitions of these geographic areas, seethe Technical Appendix.)
MAJOR FINDINGS
The classification of residence informationon the death certificates corresponds closely tothe place of residence as stated on the censusrecords for the decedents whose records werematched. The proportion of unmatched recordswas high—23 percent.
Considerable improvement in the quality ofthe residence data has taken place since 1950.This observation is based on a comparison of theresults of this study with those for a matchedrecord study involving births for 1950.
An inverse relationship exists between thesize of the geographic area and the degree of dif-ference found between census assignments andthose by NCHS. Differences diminish as the pop-ulation size of the area increases. Compared withcensus assignments, NCHS somewhat overstatesthe numbers of deaths for individual urban placesand understates those for rural areas. A com-parison of NCHS annual data with figures tabulatedby selected State offices of vital statistics showsthe same pattern.
Towns, townships, and boroughs in Connecti-cut, New Jersey, and Pennsylvania; urban fringeareas; and territorial annexations made between1950 and 1960 presented the greatest problemsto NCHS in properly allocating the residence ofdecedents.
The poorest age agreement between thecensus records and the death certificates was forthe nonwhite group at ages 85-99 years in thegeographic divisions comprising the South Region.
For three-fifths of the 729 urban places of25,000 population or more in 1960, either no
matched deaths for nonwhite persons were re-ported or fewer than 10 deaths were reported,thereby obscuring the comparison of differencesby color.
The average proportion of records unmatchedwas 50 percent higher for nonwhite than for whitepersons. Both the net difference rates by raceand the match status were more favorable for thewhite and Japanese groups than for other racialand ethnic groups. Differences by sex werenegligible.
A followback survey involving almost 10,000decedents showed that the distribution of matchedand unmatched records by nine population-sizegroups of geographic areas was not different.However, this general finding cannot be extendedto the more detailed residence data used in thisreport.
The findings of this study on the annual deathrate are limited by the fact that a sample ofdeaths is taken only for the summer months, anddata are for a single year. Other limiting factorsare covered in the Technical Appendix. The re-sults of this study generally indicate that theannual death rate for an individual urban placeis slightly overstated.
URBAN PLACES
A frequency distribution of net differencerates for 729 urban areas with a population of25,000 or more in 1960 is shown in table 1. Netdifference rates were computed by subtractingthe number of deaths matched at the usual placeof residence according to census assignmentsfrom those by NCHS assignments, dividing by thecensus figure, and multiplying by 100. A negativerate indicates more assignments by census thanby NCHS. The group “matched at usual residence”represents those decedents who died at the placewhere they had usually resided and had beenenumerated in the 1960 Census of Population. Netdifference rates based on 100 frequencies or more(according to census designations) are shownseparately from those based on fewer than 100deaths. The reason for this separation is that thevariance would be greater for rates based onsmall frequencies. Thisrange of rates—from O
latter group has a widerto 94.9—compared with
2

the range of O to49.9for the group in which therates are based on 100 deaths or more.
The median net difference rate for the 729areas falls at 3.0 percent. Based on 100 deaths ormore, the median is 2.9, and for small frequen-cies, 3.2. The size of the difference varies in-versely with the size of the urban area. Forareas of under 100,000 population, differences ofunderstatement by NCHS exceed those of over-statement.
As indicated in table 1, most of the differ-ences are positive, This finding is consistentwith that of other independent sources used forcomparison. In a previous matched-record studyinvolving births for 1950, the results were thesame as those of this study--an overstatement ofevents in the urban areas by NCHS compared withcensus records.s
Net difference rates for deaths in 1960 andbirths in 1950 for 221 selected urban areas werereviewed. The basis for the selection of the 221areas was the number of births included in the19S0 study, namely, 100 events according to eitherthe census record or the birth record. For 66.5percent of the areas the difference was positivefor births and deaths (more assignments by NCHSthan by census). The direction of the differencesfor births and deaths for the balance of the areaswas as follows:
Direction of diffwencePercent of
totul
Both negative --------------------- 7.2One positive and one negative-- ----- 16.3Zero net difference for either births
or deaths ----------------------- 10.0
The negative differences were not concentratedin any one State but were scattered among 32 ofthe 42 States and the District of Columbia, shownin table 2. This pattern was also typical of theother types of differences shown above.
The magnitude of the difference was substan-tially less for deaths than it was for births (table2), Two factors contributed to this difference.First, the addition of the residence checkbox itemon whether the place of residence was inside oroutside the city limits on the standard certifi-cates in 1956 aided in properly allocating the
residence of persons living near cities, but out-side the corporate limits. Certificates of birthsand deaths for the majority of States contain thischeckbox item. The second factor involves themobility of persons using hospitals. There ismore likelihood of movement for the utilizationof hospitals for births than for deaths.
A comparison was made between the annualnumber of deaths by place of residence as tabu-lated by NCHS and those tabulated by the variousState offices of vital statistics. For most regis-tration areas, NCHS figures were larger than theState tabulated data.
Three-fifths of the States or registrationareas had State assigned residence codes on themj crofilm copies of the death certificates re-ceived by NCHS for 1960. It is not known if thesecodes were assigned on the basis of censustracts, street maps, or if the codes were as-signed only on the basis of the information enteredin the residence section of the certificate. NCHSused the State codes in determining its own geo-graphic codes for only four States and for selectedlocal areas and counties in 11 other States.
The findings of the 1960 Comparison Studyshow the same pattern of difference when com-paring NCHS figures with either those of the Stateor the Bureau of the Census.
The primary reasons for the differencesbetween census and NCHS figures are to be foundin the enumeration process and vital registra-tion— the former giving greater support to theaccuracy of the census figures. In the 1960 Censusof Population, geographic locations can be fixedwith a high degree of precision by the use ofstreet maps and similiar aids. The situation isvery different with respect to the vital record,however. In assigning residence codes, NCHS is,for the most part, dependent on the informationentered in the section of the vital record per-taining to usual residence. Due to the greatnumber of vital records which NCHS must code,it is not feasible to verify all addresses by meansof a census tract or street guide.
Few extreme differences between census andNCHS assignments were observed. Only 14 of the729 areas had net difference rates of 50 percentor more. With the exception of Boise City, Idaho,the remaining 13 areas had fewer than 100 deathsmatched at the usual place of residence as re-
3

ported by either census or NCHS designations.
The average number of such records for thec’ombined 14 areas was below 50.
Not all of the excess differences can be ex-plained. Generally, the areas with these extremedifferences in code assignments between censusand NCHS fell into three groups. First, towns,townships, and boroughs were difficult to identifyand code for vital statistics purposes. Almostthree-fourths of the areas with large net dif-ference rates were towns or townships in Con-necticut, New Jersey, and Pennsylvania. In eachof these areas, the numbers of assignments wereunderstated by NCHS when compared with censusnumbers. For example, the first area listed inPennsylvania was Bristol Township—an areaof 59,298 population which was classified as ur-ban by special rule. In the same county— BucksCount y--there was also the incorporated areaof Bristol borough (population of 12,364) whichNCHS also classified as u~ban. Duplication ofplace names within a county and double entriesof place names on certificates resulted in prob-lems in correctly classifying geographic areas.
The second factor relating to extreme dif-ferences may be the number of annexations be-tween the two decennial census periods. Forexample, Hayward, California, had over a 400-percent increase in population, primarily due toannexations between 1950 and 1960. Frequently,the place names of the annexed areas are reportedas the decedent’s residence and thus may be im-properly classified. Several of the areas withsubstantial net differences had large annexationsbetween 1950 and 1960.
Finally, unincorporated areas which havemailing addresses and/or place names similarto that of an adjacent urban place present acoding problem. One such example is Boise City,Idaho, which is surrounded by unincorporatedareas with place names similar to Boise Citysuch as South Boise.
The numbers of deaths matched at the usualplace of residence were tabulated by color forthe 729 urban places having 25,000 population ormore in 1960. Comparisons of net differencerates for the white and nonwhite decedents werelimited by the small frequencies for the nonwhitegroup. Almost one-third of the 729 areas had nomatched deaths assigned according to either the
census record or death record for the nonwhitegroup (table 3). Another 4 percent of the areashad no frequency according to either census as-signments or those by NCHS and with only one ortwo deaths in the alternative cell. Consequently,no net difference rate could be computed. Anadditional one-third of the areas had frequenciesof fewer than 10, Net difference rates for whiteindividuals were lower than those for the nonwhitegroup for most areas. As the number of matcheddeaths increased, the net difference rates for thenonwhite group approached those for the white.
The urban places with at least 50 nonwhitedeaths or more assigned by both census and NCHSwere concentrated in the South Region (table 4).In this region the match status for both colorgroups was least favorable. About one-fourth ofthe records in the South were not matched andthus obscured the analysis of white-nonwhite dif-ferences.
The proportions of records which were un-matched for the nonwhite group were higher thanthose for the white in 324 of the 729 areas. How-ever, for three-fourths of the 324 areas therewere fewer than 20 unmatched deaths. The un-matched proportion was higher for white thannonwhite persons in only 92 of the 729 areas. Thebalance (43 percent) had no matched and/or un-matched deaths.
It can be concluded that no judgment can bemade about the white-nonwhite differences for theunmatched group for urban areas of 25,000 popu-lation or more throughout the country because ofthe small frequencies for nonwhite deaths exceptin the South Region.
POPULATION-SIZE GROUPS
Table 5 shows the numbers of deaths matchedat the usual place of residence for urban placesgrouped by population size as of 1960. As indi-cated previously, for the less definitive popula-tion- size groups in table 1, the magnitude of thenet difference rates varies inversely with thesize of the area. This inverse relationship ismore evident from data shown in table 1, thanfrom data shown in table 5. For alltrt%an areasof 100,000 population or over and for rural areas,the net difference rates are positive, indicatingmore assignments according to the death record
4
than by the census record. For all other urbanplaces, the direction of the difference is negative.
The group, urban areas of 2,500-10,000population, had the largest net difference rate(-9.0) compared with other population-sizegroups. There are slightly over 3,000 such areasand the problem of properly identifying the resi-dence of decedents of such areas has increasedso extensively since 1960 that starting with data-year 1964 NCHS no longer separately identifiessuch places. The reason for this change wasprimarily due to the fact that mailing addressesrather than the actual residence of the decedentswere often entered on the death record.
The proportions of records which were notmatched at the usual place of residence weresimilar for the various population- size groupswith the exception of that for rural areas. Theproportion for this latter group was 26 percentand the range for the other eight groups wasfrom 20 to 22 percent. Lack of a well definedplace of residence on the vital record undoubtedlycontributed to the high proportion of unmatchedrecords for rural areas.
Data for white and nonwhite individuals arealso included in table 5. The net difference ratesby population-size groups follow the same patternfor each color group as for the total population.For most of the population-size groups in table5, the net difference rates for the white groupwere higher than those for the nonwhite. How-ever, the proportion of the records which werenot matched at the usual place of residence wasabout 50 percent greater for nonwhite than forwhite persons. For urlxm places of a combinedpopulation of 25,000 or more, the unmatchedproportion was 19 percent for the white and 30for the nonwhite group.
Underenumeration in 1960 Census
of Population
There appears to be an association betweenthe net undercount in the 1960 Census of Popu-lat ion for geographic areas grouped by populationsize and the proportion of records unmatched inthe 1960 Comparison Study. Various methodswere used in estimating the coverage errors inthe 1960 census. One method was an estimate ofhousing unit coverage errors noted in Waksbergts
paper.q ‘rhe data relate only to field enumerationerrors and not to errors resulting from FOSDICProcessing (Film Optical Sensing Device for In-put to Computer). The highest net undercountswere reported for urban places of 500,000 popu-lation or more and for areas of under 10,000population. Likewise the proportion of recordsunmatched in the 1960 Comparison Study showedsomewhat the same distribution— low proportionsof unmatched records for groups of urban placesof 10,000 to 250,000 population and high propor-tions for areas above and below these populationgroups.
Followback Survey
One method of evaluating the character ofthe unmatched group was to followback by an in-dependent survey on a sample of matched andunmatched decedents. This was done for 9,475decedents of the 340,033 included in the compar-ison study. A survey questionnaire was mailedto the 9,475 informants whose names were enteredon the death certificates. On the basis of thequestionnaires returned and after personal inter-view followups, there was over 90-percent re-sponse.
The only residence data included in both thesurvey and the 1960 Comparison Study were thosefor population- size groups of areas. Table 6shows the number and percent distribution ofdeaths by population-size groups of areas includedin both the survey and the comparison study. Thedistributions were almost identical, thereby indi-cating that the survey was representative of themajor study. The number of records matched inboth the survey and the comparison study areshown in table 7. With the exception of the cate-gory 25,000 to 50,000, the distributions of matchedevents foliowed closely those of total eventsshown in table 6. The large difference for thiscategory was the result of processing errors. his probable that an additional 300 records in thesurvey in the group “25,000 or more, but notfurther defined” should be properly classified tothe size of areas, 25,000-50,000.
Table 8 shows data for the unmatched group.The number of decedents for which there was aresponse in the followback survey is shownseparately from that for which a response was
5
not received. Since this latter group included only221 records, it is not feasible to make a judgmentabout the differences between this distributionand that representing a response in the survey.
The percentage distribution by population-size group of the unmatched decedents for whichthere was a response in the survey differed onlyslightly from the matched groups (table 7). There-fore, it is probable that the matched and unmatcheddecedents were from the same “population.” Tobe conclusive, it would be necessary to have adistribution of deaths matched in the survey onlyand coded according to the responses in the survey.This was not done, however.
METROPOLITAN ANDNONMETROPOLITAN COUNTIESFOR URBAN -AND RURAL AREAS
Net difference rates and the proportion ofrecords unmatched for the combined groups ofmetropolitan and nonmetropolitan counties arepresented in table 9. The two groups of countiesare further classified by urban and rural areasfor color-sex groups.
Metropolitan counties had smaller net dif-ference rates and lower proportions of unmatchedrecords than nonmetropolitan counties. For thelatter group of counties there were more assign-ments according to the census record, whereasfor metropolitan counties there were more assign-ments according to the death record. Consistentwith the findings noted in the previous section,NCHS classified more deaths to urban areas thanto rural. The rural areas of both types of countieshave higher proportions of unmatched recordsthan urban areas. This may be related to the factthat rural areas generally have less definitivemailing addresses than urban areas. Conse-quently, matching the census and death recordsfor individuals who had resided in these areaswas not as successful as in urban areas.
The difference between census assignmentsand those by NCHS was greatest for rural areasin metropolitan counties (table 10). Likewise, theproportion of records not matched-- 27.4—wasconsiderably higher for this geographic compo-nent than for the others shown in the table. Therural section of metropolitan counties is uniquefor several reasons. First, the rural component
of metropolitan counties as defined for vital sta-tistics includes the “urban fringe,” that is, placessurrounding large metropolitan areas. This defi-nition differs from that used by the EighteenthDecennial Census insofar as the Bureau of theCensus classifies these fringe areas as urban.This difference is necessitated by the fact thatcensus can set up one-time boundaries for un-incorporated areas for its decennial enumerations,whereas NCHS must depend upon establishedpolitical delineations for a 10-year period. Arapid growth of new fringe areas took place be-tween the two census periods— 1950 and 1960.Such areas frequently had mailing addresses ofthe adja’cent incorporated urban places, and theseaddresses were reported as the usual place ofresidence. Consequently, there were difficultiesin matching.
The second factor to adversely affect thematch status was migration. As used here, mi-gration pertains to those persons 5 years of ageand over who moved from one county to anotherbetween April 1, 1955, and April 1, 1960. Theproportion of persons who moved to differentcounties in this quinquennial period was 21.1percent for the urban fringe of metropolitan areasand only 14.0 percent for the central cities ofmetropolitan counties.5
The social and economic characteristics ofthe rural parts of metropolitan areas are verydifferent from those for rural areas in nonmet-ropolitan counties. b From one point of view, therural section of metropolitan areas is more ur-ban in character than the rural section of non-metropolitan areas.
In regard to the net difference rates and theproportions unmatched, the differential bwweenthe white and the nonwhite groups is pronounced-both measures are higher for nonwhite than forwhite persons. The contrast between the directionof the net difference rates is noteworthy. Theserates for rural areas are negative for the whitegroup and positive for the nonwhite, The individualgeographic areas which comprise the rural totalare not separately identified in coding geographicinformation on the death certificates. This detailwould be necessary to attempt to explain the dif-ferences in the rates for the white and nonwhitegroups. Rural data were reviewed for the fourgeographic regions and the differences observed
6
in the North Central Region contributed most tothe high positive net difference rate for the non-white group.
NonwhiteRegion metropolitan-rwal
net difference rate
Total ------------ 10.3
Northeast ------------ 25.9North Central -------- 57.6south ---------------- 8.0West ---------------- -13.6
(Death record is base of rate and minus signindicates more assignments by the death recordthan by the census record.)
STANDARD METROPOLITANSTATISTICAL AREAS
Table 11 shows a comparison of net differ-crtce rates for 25 standard metropolitan statistical~reils (SMSA’s) which were randomly selected,and the urban components of these same SMSAts.Here the urban components are limited to thoseplaces of 25,000 population or more in 1960since deaths for urban places below 25,000 popu-lation were not separately tabulated. All subse-quent references to these components will belimited to urban areas of 25,000 population ormore.
Data presented in this table show that the netdifference rates are, for the most part, lower forthe SMSA than for selected urban areas which area part of that SMSA. The SMSA is a county orgroup of contiguous counties and therefore in-cludes urban and rural areas. As noted in table9, NCHS data generally show an overstatementof events for urban places and an understate-ment for rural areas. As a result, the netdifference rate is low— the result of compensat-ing differences.
The SMSA’S with the highest proportion ofunmatched records were located in the SouthRegion with the West having the next highestproportion. This is not only true for the 25 SMSA’Sin table 11 but for all 201 SMSA’s (MSEA’s inNew England) and for other residence data in this
report. Both the South and the West Regions havea higher proportion of nonwhite persons thaneither the Northeast or North Central Regions.For this color group the unmatched proportionis less favorabje than that for the white group.Another factor is that migration is higher in theWest and South; therefore it is likely that theunmatched proportion would be higher in thesetwo regions than in the Northeast or the NorthCentral Regions.
The largest of the SMSA’S in table 11—Chicago, Illinois —had 22 urban components of25,000 population or more. The net differencerates for these areas ranged from O for severalcomponents to 91.4 for Oak Lawn, Illinois, butthe average was only 5.9 percent and the net dif-ference rate for the SMSA, 0.2 percent.
The number of matched deaths for SMSA~swas tabulated separately for two groups: Matchedat usual place of residence (UPOR) and matchedbut not at the usual place of residence. Thislatter group was numerically small and repre-sents those matched at the place of death (POD).The number and percentage breakdown of thenumber of records by match status areas follows:
Number Peycent
Total -------------- 532,948 100.0
Matched --------------- 420,292. 78.9UPOR --------------- 388,754 72.9POD ---------------- 31,538 5.9
Unmatched ------------- 112,656 21.1
The group matched at the place of death (POD)is different insofar as any comparison of residencecoding by census and NCHS is not applicable. Onefactor which accounts for a match at the place ofdeath rather than at the usual place of residenceis the difference between the enume~ ation processand the vital registration system. Persons resid-ing in long-term institutions were enumerated inthe census at these institutions prior to theirdeath, but the death record asks for the usualplace of residence prior to admission to the in-stitution. Therefore, the two geographic codesassigned are not the same.
The net difference rate for the total matchedgroup was 0.3 and for the two subgroups, UPORand POD, the rates were 0.0 and 4.1 (table 12).
7
The highest rates for the total group were ob-served for the three SMSA’S of Columbia, SouthCarolina; Pueblo, Colorado; and Tuscaloosa,Alabama. The high difference rates for the totalgroup were the result of matching at the place ofdeath. The distribution of net difference rates bytype of match is as follows:
Totul UPOR POD
Columbia, S.C ------ -22.3 -1.7 -77.5Pueblo, Colo -------- -30.3 -2.1 -85.7Tuscaloosa, Ala----- -37.4 - -92.5
In comparing the net difference rates bycolor only 57 SMSA’S were considered. The areaswere those to which 100 or more nonwhite deathswere assigned (table 13). Although the net differ-ence rates for the white group were higher forslightly over half of the 57 areas, the proportionunmatched was considerably higher for the non-white group (table 14). The frequency distributionof the proportion unmatched (using census as base)for the white and nonwhite groups is presentedbelow:
?%oportion wnmatched Numbev of SMSAIS
White Nonwhite
Total ------------- 57 57
10.0 -19.9 ------------- 20 120.0 -29.9 ------------- 28 2630.0 -39.9 ------------- 9 2840.0-49 .9------------- - 2
Those areas for which the net difference ratesfor the nonwhite group did exceed those for thewhite were located for the most part in the SouthRegion, where the match status was least favor-able.
one purpose of the 1960 Comparison Studywas to evaluate the effect of the findings of thisstudy on the annual death rate. The annual deathrates for SMSA’S in 1960 are published in VitalStatistics of the United States, 1960, Vol. II, PartB. The method involves the following assumptions.First, the assignment of deaths to any SMSA
made by census is presumably the “correcttffigure rather than the NCHS figure for the May-August study period. As indicated previously, thedifference between the enumeration process andvital registration gives greater support to theaccuracy of the coding of geographic locations bythe Bureau of the Census. The second assumptionis that the population enumerated as of April 1,1960, for an SMSA is “correct.” Measures ofmisstatement of residence or underenumerationfor individual SMSA’S as of April 1 have notbeen published by the Bureau of the Census.
The annual rate could be adjusted on thebasis of the findings of this study. An upper andlower range of the annual rate could be computedas indicated below.
(1)
(2)
The upper range is derived as follows:
Increase or decrease the annual number ofdeaths by the percent difference ktween cen-sus and NCHS assignments for the studyperiod for the SMSA. If the census figure islower than the NCHS figure, the annual num-ber of deaths would be reduce~ if the NCHSfigure is lower, the annual figure would beincreased.
Compute the upper range of the annual ad-justed rate using the frequency derived instep 1.
in computing the upper range of the annual ad-justed rate, all unmatched deaths are assumed tobe carrectly assigned to the SMSA. In computingthe lower range of the annual adjusted rate, allunmatched deaths are assumed to be incorrectlyassigned to the SMSA. Therefore, the range of theannual adjusted rate is determined by the un-matched deaths.
The lower range of the annual adjusted rateis computed as follows:
(1)
(2)
(3)
Follow step 1 for the upper range.
Reduce the annual number of deaths by theproportion that unmatched deaths are of totaldeaths for the study period. The figure fortotal deaths is the sum of the matched andunmatched deaths.
Compute the lower range of the annual ad-justed rate using the frequency derived instep 2.
8

It is probable that the true adjusted rate is ckserto the upper range since it is most liiely that themajority of unmatched deaths are correctly as-signed.
The formulas for computing the adjustedrates and their application for one SMSA areshown in the Technical Appendix.
AGE BY GEOGRAPHIC DIVISION
Net difference rates vary slightly among thenine geographic divisions for the total population.In five of the divisions, the highest net differencerates—all negative—were reported for the agegroup 25-34 years. (Negative indicates more as-signments by census than by NCHS to an agegroup.) For the three divisions comprising theSouth Region, maximum positive net differenceswere observed for the interval 55-64 years. Thehighest net difference rate (-5.5) in the MiddleAtlantic divisiou was reported at ages 35-44 years(table 15). Division data discussed here and re-gion data discussed in the following section areaccording to census designations. These sectionsdiffer from those appearing previously insofaras they are a comparison of age and race, re-spectively, rather than a comparison of residence.A detailed analysis of age for the United Stateshas been covered in a report in Vitul and HealthStatistics, Series 2, No. 29.6
There was only a slight difference by sex,hut a pronounced difference by color when datawere compared by age for the divisions. Net dif-ference rates for nonwhite males and femaleswere considerably higher than those for whitemales and females. The highest rates were re-ported for nonwhite individuals below 25 years ofage. However, the rates are based on extremelysmall frequencies—generally about 10 deaths—for all divisions except those in the South Region.
In addition to net difference rates, the per-cent agreement between census and NCHS assign-ments was also computed. This measure wasderived by dividing the number of matched recordsclassified by a given age group by both censusand NCHS (the common cell) by the number ofmatched records classified to that same age groupby census. As was noted for net difference rates,extensive variability was observed for the percentagreements for the nine divisk ,1s by 10-year age
groups. Generally, the poorest agreement oc-curred at 85-99 years—the age group for whichthe annual age-specific death rate is maximal.The New England Division was an exception to thepatterw the percent agreement was poorest atthe younger ages rather than the older ages. Theobservations made for the net difference rates bycolor and sex are applicable to the percent agree-ments. Nonwhite differences between census andNCHS assignments were more extreme than thosefor white decedents and these differences weregreatest in the divisions comprising the SouthRegion.
With few exceptions, the proportions of rec-ords unmatched for males and females and forwhite and nonwhite persons were highest for theage groups 15-24 and 25-34 years in the ninegeographic divisions. For the most part, theexceptions to this pattern were for the interval1-4 years of age and the proportions were basedon small frequencies.
With respect to the characteristics of ageand race, there were two phases in the 1960Comparison Study. The difference between thetwo phases of the study relares to the two-stageenumeration in the 1960 Census of Population.All matched records in stage I represent dece-dents who were in the 100-percent enumeration.Stage II includes those decedents who werematched in stage I and who also were included inthe 25-percent sample of households. With re-spect to this study and the impact on vital rates,the important distinction is that in stage II, notstated and not valid codes for the majority ofitems were allocated. The method of allocation isdescribed in the various publications relating tothe 1960 Census of Population found in the bibli-ography. It is data from stage II which are usedin computing selected vital rates.
All data by age previously discussed havebeen derived from stage I. Table 16 shows fourseries of net difference rates for white malesfor the South Atlantic Division— stage I with andwithout the “not stated and not valid” codes andstage 11 with and without the allocations of the“not stated and not valid” codes. Stage I illus-trates better than stage II the “true” comparisonbetween data derived from the census record andthose from the death record. The fact that theeffect of the allocations on most age groups was
9
to increase the disparity between age reportingon the census record and the death record hasan impact on the analysis of mortality data.
RACE BY GEOGRAPHIC REGION
Detailed data for race for the United Statesand four regions are presented in tables 17 and18. The net difference rates for each of the re-gions were less than 1 percent for the whitegroup. The direction of the difference was alwayspositive, that is, more assignments were made tothe white group by NCHS than by census (censusrecord used as base). Two factors may contributeslightly to the direction of these differences.First, the number of “race not stated and notvalid” assignments according to census tabula-tions was 3,214, compared with 22 “race notvalid” assignments according to NCHS tabulations.Therefore, the figures for the white and for thenonwhite category by census designations are be-low those by NCHS designations for the UnitedStates and each region. Second, the death recordsfor which the race was not stated were assignedto “white” in the initial coding operation in NCHS,The number of “not stated” entries is not known,but presumably the figure is small.
Not only are the net difference rates gener-ally lowest for the white group but the proportionsof unmatched deaths are lowest. The latter factorgives greater validity to the net difference ratesfor the white population.
The net difference rates for the Negro racewere higher than those for the white and weregenerally positive; the rates were less than 2percent for the LMited States and each region.However, the proportion of records unmatchedwas approximately 30 percent for the Negro race—almost 50 percent above that for the white.
The net difference rates for the Indian groupwere negative for each region and lowest in theWest where the majority of the Indian reserva-tions are located. Self-enumeration of race, whichwas introduced in the 1960 Census of Population,may contribute to the excess of census recordsover death records which were coded as Indian.The annual death rate for the Indian group was8.6 per 1,000 population in the United States for1960 compared with 13.0 in 1950. The self-enumeration procedure in the 1960 census and
changes in classification by census of personsof mixed stock of Indian and other races contrib-uted to a sharp increase in the Indian populationbetween the two census years. This artifact ob-served in the anual death rates is consistent withthe findings of this study.
With the exception of those for the West, theregional net difference rates for Chinese, Japa-nese, and Filipino are based. on such small fre-quencies as to render the rates statisticallyunreliable. The net difference rate for the Japa-nese in the West was -0.6 which was the lowestof any net difference rate for any racial categoryfor the United States or any of the four regions.The match status for this racial group— 18 per-cent— is superior to that of the other racialcategories in the West Region or in the UnitedStates as a whole. The net difference rate for theChinese is 0.9—the same as that for the whitegroup in this region. The proportion unmatchedis about the same for the two categories— 22for the white group and 23 for the Chinese. Thenet difference rates for the “other nonwhite”group showed the greatest divergence betweencensus assignments and those by NCHS. Likewisethe proportion unmatched is highest—approxi-mately 50 percent (census record used as abase).If the death record is used as a base, the equiva-lent proportion is below 30 percent because thedenominator of the proportion would be substan-tially larger. It is difficult to explain the largedifference between census assignments and thoseby NCHS for this group because it is an “all other”category. Differences may exist in interpretationbetween census and NCHS as to what should beincluded in this “all other” group.
Regional differences for each sex group wereexamined only for the white and nonwhite cate-gories since the frequencies for the racial groupswere very small. Net difference rates for femaleswere lower than those for males for each regionexcept the West.
In stage H of the 1960 Comparison Studythere were 87,905 matched records. Of thisnumber 1,145 or 1.3 percent had no entry forrace ~’not valid” included). After the 1,145 rec-ords were assigned a code for race, the assign-ments were compared with the codes for race onthe death records for those 1,145 decedents. Therewas only 20 percent agreement. The effect on the
10

comparison study was to bring into closer agree-ment the assignments of codes by census andNCHS to the white category. The reverse effectoccurred with respect to most of the nonwhiteracial groups. A comparison of the net differ-ence rates for stages I and H by race for theUnited States is shown below. (Census record isused as base and minus sign indicates more as-signments by census than by NCHS.)
Race
White---------
Nonwhite ----- -Negro ------Indian ------Japanese ---Chinese ----Filipino ----Other ------
Not stated andnot valid----
Net difference mtes fw stages:
I II
0.8 -0.4
1.1 -1.2
1.1 0.2
-9.4 -11.2
-0.9 7..5
-4.6 -2.5.0
-23.2 -33.3
-125.4 21.9
-99.3 . . .
If the annual death rates for the two groups,white and nonwhite, are evaluated in terms of thefindings noted above, the effects are negligible.However, rates for specified nonwhite racialgroups would & affected. For example, the netdifference rate for the Japanese according tostage I is -0.9 and according to stage II, +7.5.The latter net difference rate (+7.5) representsfewer allocations of “not stated” to the Japanesethan the findings of this study would warrant. Theeffect would k to overstate the published annualdeath rate for the Japanese from 5.1 per 1,000population to 5.5.
REFERENCES
lKitagawa, l?.. M., and Hauser, P. M.: Methods used ina current study of social and economic differentials in mor-tality. Emerging Techniques of Population Re se arch, Pro-
ceeding of the 1962 Annual Conference of the Milbank Mem-
morial Fund. New York. Milbank hJemorial Fund, hfar. 1967.
2Kitagawa, E. M., and Hauser, F’. hi.: Education and In-
come Differentials in Mortality, United States, 1960. Paper
presented at the annual meeting of the Copulation Associa-tion of America, New York, Apr. 29-30, 1966. Revised Mar.1967.
3Nati~nal vjtal Statistics Division: Matched record
comparison of birth certificate and census information,
United “Statee, 1950. Vital Statistics–Special Reports, Vol.
47, No. 12. Public Health Service. Washington, D.C. Mar.1962.
4Waksberg, J.: Housing unit coverage errors by type of
geographic areas, 1960 census. Memorandum No. 2. Bureau
of the Census. Unpublished data.
5U.S. Bureau of the Census: U.S. Census of Popubtion, 1960. General Social and Economic Characteristics.
UnitedSts#es Swnrnary. Final Report PC (1)-lC. Washington.
U.S. Government Printing Office, 1962.
6National Center for Health “Statistics: Comparability
of age on tbe death certificate and matching census record;
United States, May-August 1960. Vital and Health Statis-tics. PHS Pub. No. 1000+eries 2-No. 29. Public Health
Service. Washington. U.”S. Government Printing Office, June1966.
7National Office of Vital Statistics: The comparability
of reports on occupation from vital records and the 1950
census, by D. L. Kaplan, E. Parkhurst, and P. K. Whelptcm.
Vital Statistics-Special Reports. Vol. 53, No. L Z7ublicHealth Service. Washington, D.C. June 1961.
%.”s. Bureau of the Census: U.S. Census of PoprJa-
tion, 1960, Number of Inhabitants, United States Summay.
Final Report PC (1)-1A. Washhrgton. U.’S. ‘Government Print-ing Office, 1961.
9U.’S. Bureau of the Budgeti Standard Metropolitan Sta-
tistical Areas. Washington. U.”S. ‘Government Printing Office,1961.
10u;5. Bureau of the Census: U.S. census of Popub
tion, 1960, Selected Area Reports, State Economic Areae.
Final Report PC (3)-1A. Washington. U.’S. Government Print-ing Office, 1963.
11

SELECTED BIBLIOGRAPHY
Arriaga, E.: Index for the Detection of the Underregistra-
tion of Rural Deaths Due to the Inaccessibility of the Regis-tration OffIce. A paper presented at the April, 1966, annual
meeting of the Population Association of America.
Fellegi, L P.: Response variance end its estimation. J. Am.Stdtis.Assoc. 59(308} 1016-1041, Dec. 1964.
Kitagawa, E. M., and Hauser, P. M.: Educational differen-tials in mortality by cause of death, United States, 1960.
Demography, Vol. 5, No. 1, 1908. ‘
Marke, E., and Waksberg, J.: Evaluation of coverage in the
1960 Census of Population through case-by-case checking.
Proceedings of the Social Statistics Section. American Sta-tistical Association, Los Angeles, Calif., Aug. 15-18, 1966.
National Office of Vital Statistics: Coding and punching
geographic and pereonal particulars; birthe, deathe, and fetaldeathe occurring in 1960. Vital StatL?tr2s-instruction Manual,Part II, Section B and Supplements. Public Health Service.
Washington. U.S. Government Printing Office, Oct. 1960.
National Office of Vital Statistics: haterviewer’s Manual;National Morkdity Study, 1960. Washington. U.S. Government
Printing Office, Oct. 1960.
National Vital Statistics Divieion: Vital Statistics of theUnited States, 1960, Vol. I. Public Health Service. Washing-
ton. U.S. Government Printing Office, 1962.
National Vital ‘Statistics Division: Vitat Statistics of theUnited States, 1960, Vol. II, Parts A and B. Public Health
Service. Washington. U.S. Government Printing Office, 1963.
National Center for Health ‘Statistics: Vital Statistics ofthe United States, 1964, Vol. II, Part A, Section 6. Public
Health Service. Washington. U.S. Government Printing Office,1966.
Neter, J., Maynes, IL S., and Ramanathan, R.: The effectof mismatching on the measurement of responee errore. J. Am.Statis.Assoc. 60(312):1005-1027, Dec. 1965.
‘Siegel, J. S., and Zelnik, M.: An evaluation of coverage in
the 1960 Census of Population by techniques of demographic
anal ysis and by composite method e. Proceedings of the SocialStatistics Section, Am&ican Statistical Association, 1966.
Taeuber, C., and lianeen, M. H.: Self-enumeration ae acensue method. Demography 3(1):289-295, 1966.
Zelnik, M.: Errors in the 1960 census enumeration of na-
tive whites. J. Arn.Statis .Assoc. 59(306):437-459, June, 1964.
U.S. Bureau of the Census: County and City Data Book,196,??,A Statistical Abstract Supplement. Washington. U.S.Government Printing Office, 1962.
U.S. Bureau of the Census: Evaluation and Research Pro-gram of the U.S. Censuses of Population and Hawing, 1960;Record Check Studies of Poptdution Coverage. Series ER 60,No. 2. Washington, D. C., 1964.
U.S. Bureau of the Census: Evaluation and fi’eeearch Pro-gram of the U.S. Censuses of Population and Housing, 1960;the Employ erRecord Check. Series ER 60, No. 6. Washington.
U.S. Government Printing Office, 1965.
U.S. Bureau of the Census: U.S. Censuses of Populationand Housing, 1960; Principal Date-Collection Forms and Pro-cedures. Washington, D. C., 1961.
U.S. Bureau of the Census: The Post-Enumeration Suruey,1950. Bureau of the Census Technical Paper No. 4. Washing-ton, D. C., 1960.
U.S. Bureau of the Census: U.S. Census of Population,1960, Detailed Characteristics, United States Summary. Final
ReportPC(l)-ID. Washington. U.S. Government Printing Office,1963.
U.S. Bureau of the .Census: U.S. Census of Population,1960, General Population Characteristics, United State8 Sum-mary. Final Report PC(l)- lB. Washington. U.S. Government
Printing Office, 1961.
U.S. Bureau of the Censue: U.S. Census of Population,1960, Selected Area Reports, Standard Metropolitan Stati8ti-cat Areas. Final Repat PC(3)- lD. Washington. U.S. Govern-
ment Printing Office, 1963.
U.S. Bureau of the Census: U.S. Census of Population,1960, Subject Reports, Inmates of Institutions. Final Report
PC(2)-8A. Washington. U.S. Government Printing Office, 1963.
U.S. Bureau of the Census: U.S. Censue of Population, 1960,Su6ject Reports, Mobility for States and State Economic Areas.Final Report PC(2)-2B. Washington. U.S. Government Printing
Office, 1963.
U.S. Bureau of the Census: U.S. Cenwe of Population,1960, Subje d Reports, t~obility for Metropolitan ~reag. Final
Report PC(2)-2C. Washington. U.S. Government Printing Office,
1963.
000
12

DETAILED TABLES
Table 1.
2.
3.
4,
5.
6.
7.
8.
9.
10.
11.
12.
Frequency distribution of size of net difference rates based on deaths matchedat usual place of residence,for urban areas of 25,000 population or more: UnitedStates, May-August 1960---------------------------------------------------------
Net difference rates based on events matched at usual place of residence for 221selected urban areas of 25,000 population or more:united States,selected months,1950 and 1960-------------------------------------------------------------------
Distribution of nonwhite deaths matched at usual place of residence for 729 ur-ban areas of 25,000 population or more, by frequency groupings and type of dif-ference: United States, May-August 1960-----------------------------------------
Number of deaths matched at usual place of residence and net difference rates,deaths unmatched, and proportion unmatched for 89 selected urban areas of 25,000population or more, by color: United States, May-August 1960--------------------
Number of deaths matched at usual place of residence and net difference rates,by population-size group of area: United States, May-August 1960----------------
Number and percent distribution of deaths in the 1960 Comparison Study and thefollowback survey, by population-size group of area according to death recorddesignations: United States, May-August 1960------------------------------------
Number and percent distribution of deaths matched in the 1960 Cmparison Studyand the followback survey, by population-size group of area according to censusrecord designations: United States, May-August 1960-----------------------------
Number and percent distribution of unmatched deaths, for which there were re-sponse and no response in the followback survey,and unmatched deaths in the 1960Comparison Study, by population-size group of area according to death recorddesignations: United States, May-August 1960------------------------------------
Net difference rates and proportion of death records unmatched for urban andrural areas in metropolitan and nonmetropolitan counties, by color and sex:United States, May-August 1960--------------------------------------------------
Number of deaths matched at usual place of residence and not at usual place ofresidence, according to census record and death record for urban and rural areasin metropolitan and nonmetropolitan counties, by color and sex: United States,May-August 1960-----------------------------------------------------------------
Comparison of net difference rates and proportion unmatched, based on deathsmatched at usual place of residence for 25 selected standard metropolitan sta-tistical areas (sMSA’s) and urban area components of those SMSA’s: United States,May-August 1960-----------------------------------------------------------------
Number of matched deaths reporting same standard metropolitan statistical area(S14SA)on both census and death records, on census recor~~~yi ayjsgl ~~~~record only; and net difference rates for total matched,of residence, and not at usual place of residence: United States, May-August1960----------------------------------------------------------------------------
Page
15
16
19
20
23
24
24
25
25
26
29
31
13
DETAILED TABLES-Con.
Table 13. Number of matched deaths reporting same standard metropolitan statistical area(SMSA) on both census and death records, census record only, and death recordonly; and net difference rates, by color: United States, May-August 1960--------
14. Number of unmatched deaths for standard metropolitan statistical areas (SMSA’S),by color: United States, May-August 1960---------.-----------------.------------
15. Net difference rates, by color, sex, and age: United States and each geographicdivision, May-August 1960-------------------------------------------------------
16. Net difference rates for white males for stage I and stage 11, by age: SouthAtlantic Division, May-August 1960 ------------ --------- -------- ---------------- -
17. Number of matched deaths reporting same race on both census and death records,census record only, and death record only; and net and gross difference rates:United States and each region, May-August 1960----------------------------------
18. Number of matched and unmatched deaths and proportion unmatched, by race: UnitedStates and each region, May-August 1960 ------------------ ------------------ -----
Page
44
48
52
53
54
55
14

Table 1. Frequency distribution of size of net difference rates based on deaths matched at usualplace of residence,for urban areas of 25,000 population or more: United States, May-August 1960
r~enswrecord useG aa a baae.Negative indicateainureass,gnmentaby csrms than by NCHS]
Net difference rate
Total ------------------
0-0.04-----------------------0.1-4.9----------------------5.0-9.9----------------------10.0-14.9--------------------15.0-19.9--------------------20.0-24.9--------------------25.0-29.9--------------------30.0-34,9--------------------35.0-39.9--------------------40.0-44,9--------------------45.0-49.9--------------------All other--------------------
Total ------------------
0-0.04-----------------------0.1-4.9----------------------5.0-9.9----------------------10.0-14.9--------------------15.0-19.9--------------------20,0-24.9--------------------25.0-29.9--------------------30.0-34,9--------------------35.0-39.9--------------------40,0-44.9--------------------45.0-49.9--------------------50.0-54.9--------------------55.0-59.9--------------------60.0-64.9--------------------65.0-69,9--------------------70.0-74.9--------------------75.0-79.9--------------------80.0-84.9--------------------85.0-89.9--------------------90.0-94.9--------------------95.0-99.9--------------------100.0 or more ----------------
Positive difference Negative difference
Total
289
471725014
;
1
243
1
‘111.
1
Areas of:
100,000 50;:00 25,000 ‘otal
‘= ‘ore 100,000 50%00
100,000 50;:00 25,000
‘r ‘ore 100,000 50300
Based on 100 deaths or more
110 83_
. . .6810
11
1
1
1
21
...1821
Based on less than 100 deaths
21—
7831
i
1
222 114
. . .6121123331
i
i1
i
?
Areas of:
. . .
45
...385
1
1
16
...1013
i
17
. . .123
1
i
98
15
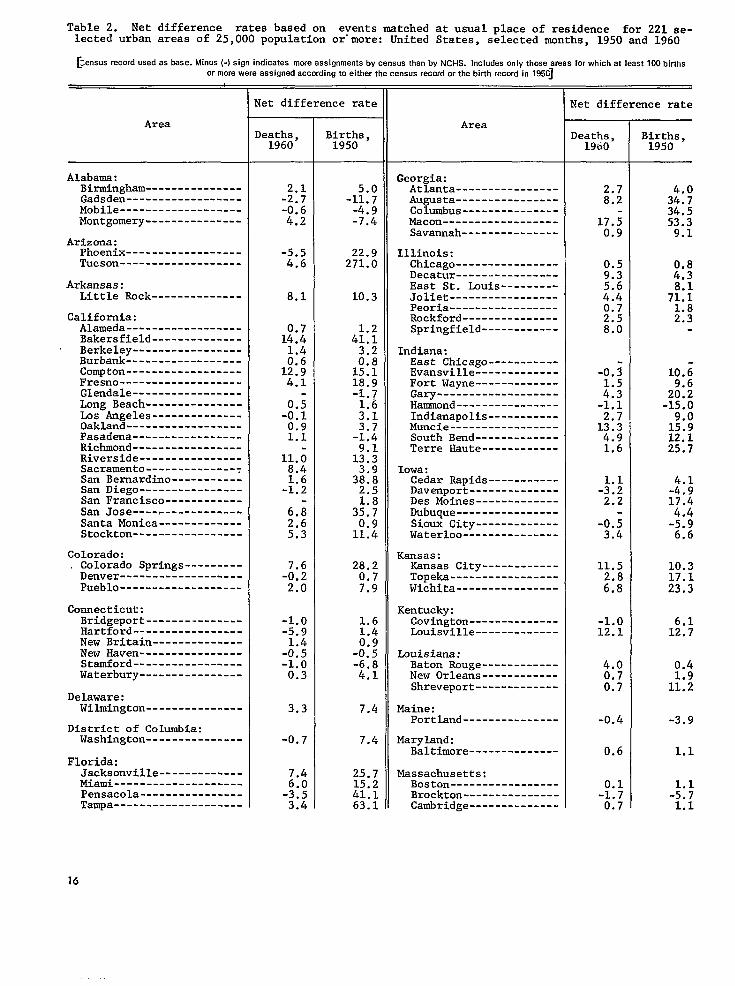
Table 2. Net difference rates based on events matched at usual place of residence for 221 se-lected urban areas of 25,000 population or’more: United States, selected Wnths, 1950 and 1960
r2enswrecordwedasbase.Minw(-)si9.indicatesmmeasskmmentsbYcensmthanbYNCHS. lncl.deso.lvthoseareaaforwhichatleastlOObirthsormorewereassignedaccordingtoeither"thecensusrecOrdorthebitihrecwd"in1950]
Area
Alabama:Birmingham ---------------Gadsden------------------Mobile -------------------Montgomery ---------------
Arizona:Phoenix------------------Tucson-------------------
Arkansas:Little Rock--------------
California:Alameda ------------------Bakersfield --------------Berkeley-----------------Burbank ------------------Compton------------------Fresno -------------------Glendale-----------------Long Beach---------------Los Angeles --------------Oakland------------------Pasadena-----------------Richmond-----------------Riverside ----------------Sacramento--------------ySan Bernardino -----------San Diego----------------San Francisco ------------San Jose-----------------Santa Monica -------------Stockton-----------------
Colorado:Colorado Springs---------Denver-------------------Pueblo-------------------
Connecticut:Bridgeport ---------------Hartford -----------------New Britain --------------??ewHaven----------------Stamford-----------------Waterbury ----------------
Delaware:Wilmington ---------------
District of Columbia:Washington ---------------
Florida:Jacksonville -------------Miami --------------------Pensacola ----------------Tampa--------------------
fet difference rate
)eaths,1960
2.1-2.7-;.;
-5.54.6
8.1
l::i
::212.94.1
-:::0.91.1
11.;8.4
-::;
;.j
5:3
-;:;2.0
-1.0-5.9
-;:;-1.00.3
3.3
-0.7
7.4
-!::3.4
Births,1950
-:$;-7:4
22.9271.0
10.3
4;:;
M15.118.9-1.7
::;
-2:
1;:;
3;::2.5
3;:;
1!::
28.20.77.9
:::
-n-6.84.1
7.4
7.4
25.715.241.163.1
Area
Georgia:Atlanta ----------------Augusta ----------------Columbus---------------Macon ------------------Savannah---------------
Illinois:Chicago----------------Decatur ----------------East St. Louis---------Joliet -----------------Peoria-----------------Rockford---------------Springfield------------
Indiana:East Chicago-----------Evansville -------------Fort Wayne -------------Gary-------------------Hammond ----------------Indianapolis-----------Muncie -----------------South Bend-------------Terre Haute------------
Iowa:Cedar Rapids-----------Davenport --------------Des Moines -------------Dubuque----------------Sioux City-------------Waterloo ---------------
Kansas:Kansas City------------Topeka -----------------Wichita ----------------
Kentucky:Covington--------------Louisville-------------
Louisiana:Baton Rouge ------------New Orleans------------Shreveport-------------
Maine:Portland---------------
Maryland:Baltimore--------------
Massachusetts:Boston-----------------Brockton---------------Cambridge--------------
Net difference rate
Deaths,19(i0
2.78.2
17.;0.9
0.5
R4.40.72.58.0
-0.;1.5
-?:?2.713.34.91.6
-::;2.2
-0.53.4
11.5
;::
-1.012.1
4.00.70.7
-0.4
0.6
-!:;0.7
Births,1950
3::?34.553.39.1
%!!
7U
;:!
10.;
2::;-15.09.015.912.125.7
-::;17.4
-::;6.6
10.317.123.3
6.112.7
0.4
1::;
-3.9
1.1
-;:+1.1
16
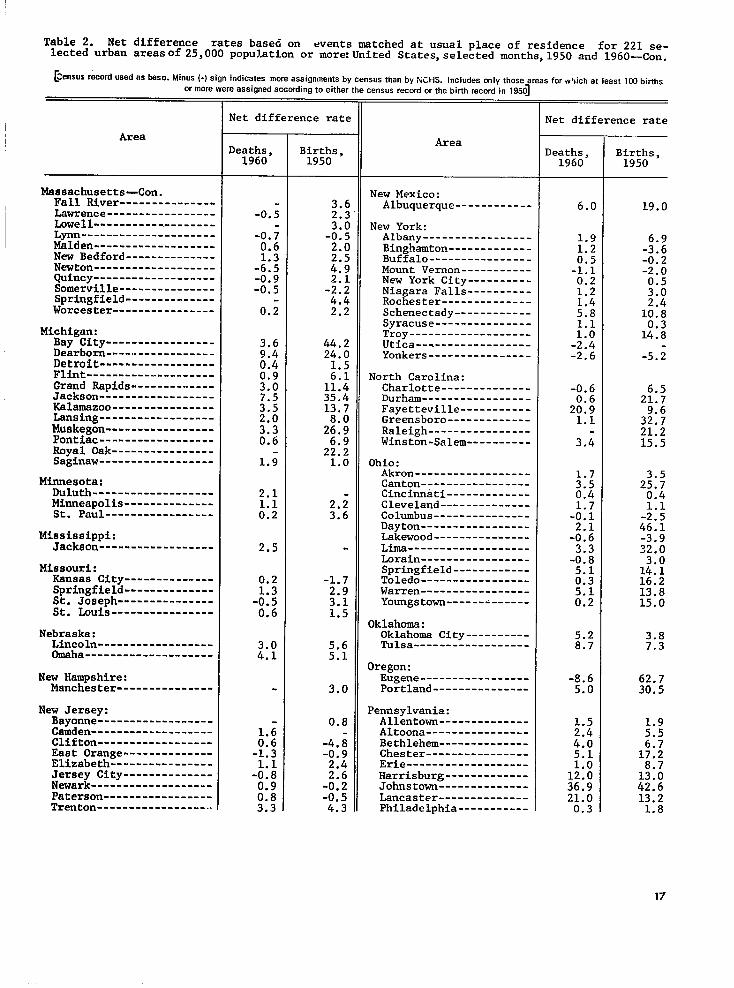
Table 2. Net difference rates base6 on events matched at usual place of residence for 221 se-lected urban areasof 25,000 population or more:United States,selected months, 1950 and 1960—Con.
[Census reccvd used os base. Minus (-) sign indicates more assignments by census than by NCHS. Includes cnly those areas for which at least 100 births
ormorewere assigned accwding toeither thecenaua r~wdorthe binh record in 195~
Area
Massachusetts-Con.Fall River---------------Lawrence-----------------Lowell--------------------
-----------------.---h%en-------------------New Bedford--------------Newton -------------------Quince-------------------Somerville---------------Springfield--------------Worcester ----------------
Michigan:Bay City-----------------Dearborn -----------------Detroit------------------Flint--------------------Grand Rapids--------------Jackson ------------------Kalamazoo ----------------Lansing ------------------~;$g -----------------
.........---------Royal Oak----------------Saginaw------------------
Minnesota:Duluth -------------------:pp:~lis --------------
. -----------------
Missouri:Kansas City--------------Springfield--------------St. Joseph ---------------St. Louis----------------
Nebraska:Lincoln------------------Omaha--------------------
New Hampshire:Manchester---------------
New Jersey:Bayonne------------------Camden-------------------Clifton------------------East Orange--------------Elizabeth----------------Jersey City--------------Newark-------------------Paterson-----------------Trenton------------------
Net difference rate
Deaths,1960
-0.5
-0.;0.6
-::;-0.9-0.5
0.2
3.69.40.40.93.0
R2.03.30.6
1.;
2.11.10.2
2.5
0.2
-::;0.6
::$(
-
::2-1.3
-:::
:::3.3
Births,1950
3.62.3
-i:!2.0
N
-;:;4.42.2
44.224.0
::;11.435.413.7
2~:~
22:21.0
2.;3.6
-1.7
$:1.5
5.65.1
3.0
0.8
-4.i-0.9
M-0.2-0.54.3
Area
New Mexico:Albuquerque ------------
New York:Albany -----------------Binghamton -------------Buffalo ----------------Mount Vernon -----------New York City---------N-iagara Falls ----------Rochester --------------Schenectady------------Syracuse---------------Troy-------------------Utica------------------Yonkers----------------
North Carolina:Charlotte --------------Durham -----------------Fayetteville -----------Greensboro -------------Raleigh ----------------Winston-Salem ----------
Ohio :Akron ------------------Canton-----------------Cincinnati-------------Cleveland --------------Columbus---------------Dayton -----------------Lakewood ---------------Lima-------------------Lorain-----------------Springfield------------Toledo-----------------Warren -----------------Youngstown -------------
Oklahoma:Oklahoma City----------Tulsa------------------
Oregon:Eugene -----------------Portland ---------------
Pennsylvania:Allentown --------------Altoona ----------------Bethlehem --------------Chester----------------Erie -------------------Harrisburg -------------Johnstown --------------Lancaster --------------Philadelphia -----------
Net difference rate
Deaths,1960
6.0
;:;
-;:;0.21.2
M1.1
-;:;-2.6
-0.6
2;:;1.1
3.;
::;0.41.7-0.1
-$:3.3-0.85.10.3
::;
5.28.7
-8.65.0
1.5
;::5.1
Ii::36.921.00.3
Births,1950
19.0
-;::-0.2-2.00.53.02.410.8
1:::
-5.;
6.521.7
3;:;21.215.5
2;:;0.4i.1-2.546.1-3.932.0
12:!16.213.815.0
3.87.3
62.730.5
::;
1%;
1;:;42.613.21.8
17
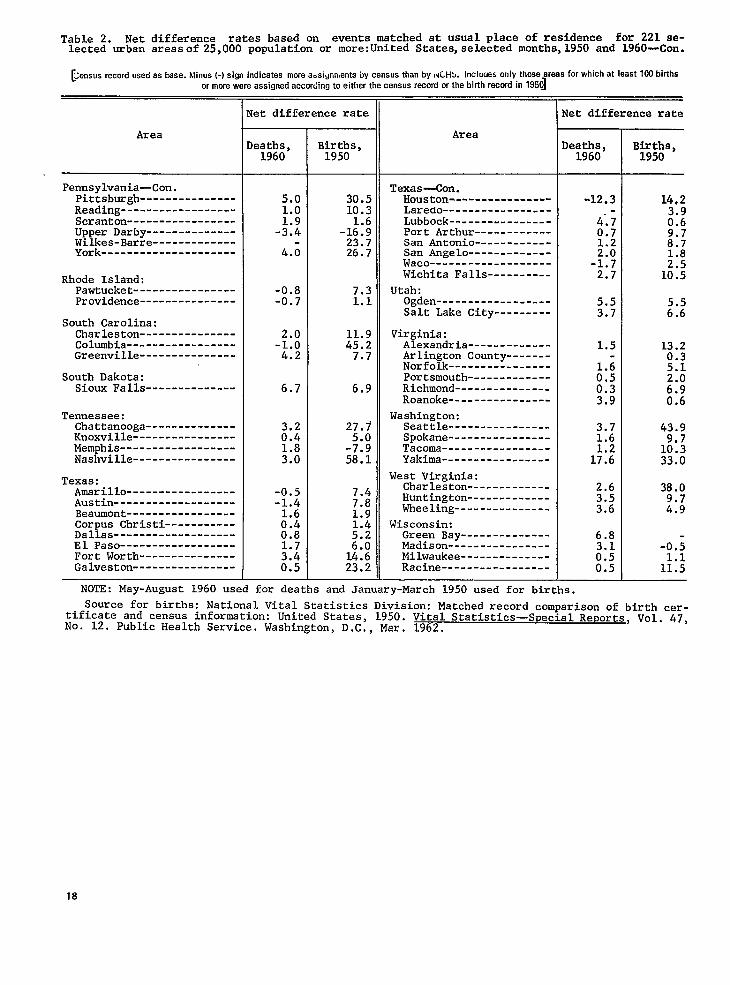
Table 2. Net difference rates based on events matched at usual place of residence for 221 se-lected urban areasof 25,000 population or more:United States,selected months,1950 and 1960-Con.
[Jensus record used aa baae. Mirws (-) sign indicates rrwxe a=aignments by census than by I.L.WL. Incl”ues only those areas for which at Ieaat 100 births
or more were assigned according to either the census record or the birth record in 195~
Area
Pennsylvania- Con.Pittsburgh---------------Reading------------------Scranton-----------------Upper Darby--------------Wilkes-Barre-------------York---------------------
Rhode Island:Pawtucket----------------Providence---------------
South Carolina:Charleston---------------Columbia-----------------Greenville---------------
South Dakota:Sioux Falls--------------
Tennessee:Chattanooga--------------Knoxville----------------Memphis------------------Nashville----------------
Texas:Amarillo-----------------Austin-------------------Beaumont-----------------Corpus Christi-----------Dallas-------------------El Paso------------------Fort Worth---------------Galveston----------------
~et difference rate
)eaths,1960
5.01.0
-H!
4.;
-0.8-0.7
2.0-1.04.2
6.7
M
M
-0.5-:.:
0:40.8
::;0.5
Births,1950
30.510.3
-1;:;23.726.7
7.31.1
11.945.27.7
6.9
2;.:
-7:958.1
N1.9
H
1:::23.2
Area
Texas-Con.Houston----------------Laredo-----------------Lubbock----------------Port Arthur------------San Antonio------------San Angelo-------------Waco-------------------Wichita Falls----------
Utah:Ogden------------------Salt Lake City---------
Virginia:Alexandria-------------Arlington County-------Norfolk----------------Portsmouth-------------Richmond---------------Roanoke----------------
Washington:Seattle----------------Spokane----------------Tacoma-----------------Yakima-----------------
West Virginia:Charleston-------------Huntington-------------Wheeling---------------
Wisconsin:Green Bay--------------Madison----------------Milwaukee--------------Racine-----------------
Net difference rate
Deaths,1960
-12.3
4;;0.71.2
-::;2.7
5.53.7
1.5
::!0.33.9
3.71,6
1;::
2,63.53.6
6.8
u0.5
NOTE: May-August 1960 used for deaths and January-March 1950 used for births.
Birr~s,
14.2
:::
::;
2:510.5
2::
13.20.35.1
::!)0.6
43.9
1?:33.0
38.0
::;
-O.;
1!:;
Source for births: National Vital Statistics Division: Matched record comparison of birth cer-tificate and census information: IJnitedStates, 1950. Vital Statistics—special Reports, Vol. 47,No. 12. Public Health Service, Washington, D.C,, Mar. 1962.
18
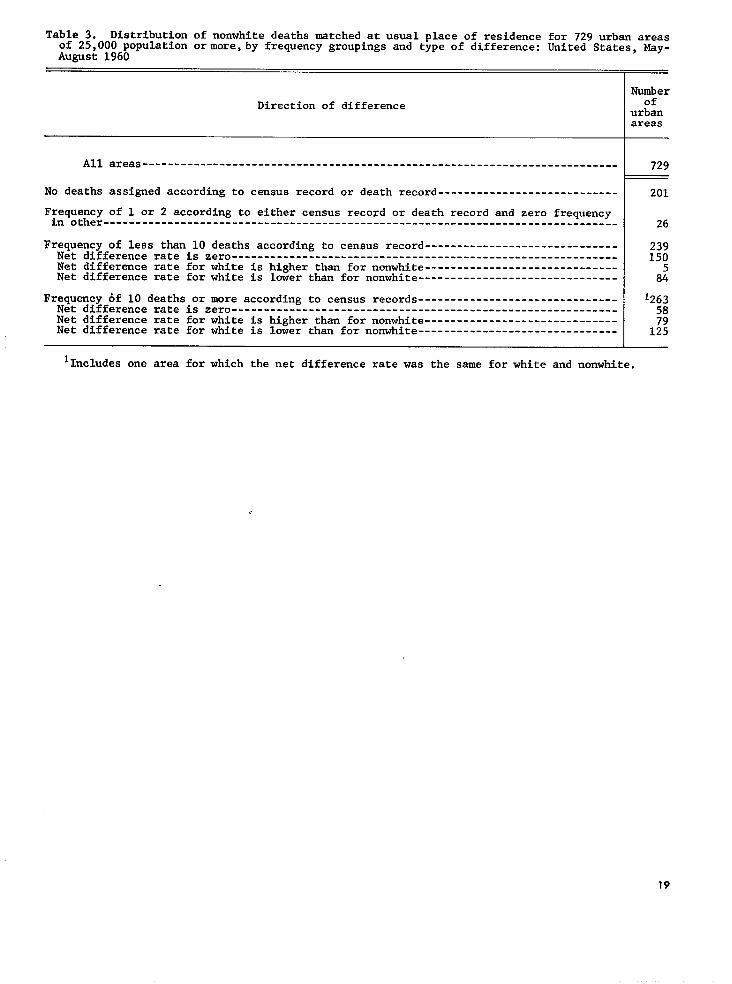
Table 3. Distribution of nonwhite deaths matched at usual place of residence for 729 urban areasof 25,000 population or more, by frequency groupings and type of difference: United States, l.fay-AUgUSt 1960
Direction of difference
All areas--------------------------------------------------------------------------
NO deaths assigned according to census record or death record----------------------------
F;;q~~c of 1 or 2 according to either census record or death record and zero frequency--------------------------------------------.-----------------------------------
Frequency of less than 10 deaths according to census record------------------------------Net difference rate is zero------------------------------------------------------------Net difference rate for white is higher than for nonwhite ------------------------------Net difference rate for white is lower than for nonwhite -------------------------------
Frequency bf 10 deaths or more according to census records-------------------------------Net difference rate is zero------------------------------------------------------------Net difference rate for white is higher than for nonwhite ------------------------------Net difference rate for white is lower than for nonwhite -------------------------------
Numberof
urbanareas
729
201
26
239150
82
126358
1;;
lIncludes one area for which the net difference rate was the same for white and nonwhite.
19

Table 4. Number of deaths matched at usual place of residence and net difference rates, deaths unmatched,and proportion unmatched for 89 selected urban areas of 25,000 population or more, by color: United States,May-August 1960
[Census record used as a base for net difference rat’ ant pmpmtion UI,IMCIWLL Min.. [-) sign inoimtes more assignments by census than by NCHS. Includes only those areasfor which at least 50 nonwhite ckaths were assigned accordin~ to either the census record or death recor~
Area
Alabama:Bessemer ------------Birmingham ----------Mobile --------------Montgomery ----------
Arkansas:Little Rock ---------
California:Los Angeles ---------Oakland -------------San DiegO -----------San Francisco -------
Colorado:Denver --------------
Delaware:Wilmington ----------
District of Columbia:Washington ----------
Florida:Jacksonville --------Miami ---------------St. Petersburg ------Tampa ---------------
Georgia:Albany --------------Atlanta -------------Augusta -------------Columbus ------------Macon ---------------Savannah ------------
Hawaii:Hilo ----------------Honolulu ------------
Illinois:Chicago -------------East St. Louis ------
Indiana:Gary ----------------Indianapolis --------
Kansas:Kansas City ---------
Kentucky:Lexington -----------Louisville ----------
Louisiana:Alexandria ----------Baton Rouge ---------Monroe --------------New Orleans ---------Shreveport ----------
Maryland:Baltimore -----------
Deaths matched at usual residenceaccording to:
Census record
White
4;:222110
171
4,975858884
2,012
1,183
254
1,070
251639720584
6;;
1:;111169
1::
8,081133
262970
237
142806
1%
1,1:!234
1,744
Nonwhite
3%120127
74
627150
lx
56
51
854
205103
1$:
4X845988152
2!:
1,64392
132239
78
2X
1%
6;;171
679
Death record
White
4%227123
189
5,021877886
2,035
1,193
262
1,064
278687751614
7;!
1::132163
1;:
8,199149
2761,017
272
182933
51177
1,1;;231
1,773
Nonwhite
51380117127
77
61814654169
53
54
863
214108
1’%
4::
%103163
2X
1,68295
137235
86
2!;
51111
6;:179
687
Netdifference rate
White
26.13.6
1:::
10.5
;.;
0:21.1
0.2
3.1
-0.6
10.8
;::5.1
u20.9-0.718.9-3.6
11.82.9
J::
N
14.8
28.215.8
10.9$;
1:5-1.3
1.7
Nonwhite
21.4
-;:;
4.1
-1.4-2.7-3.6-1.7
-0.8
5.9
1.1
;.:
-1:51,4
8.02.37.1
1$::7.2
30.227.3
2.43.3
-Y)
10.3
13.05.3
-1.92.88.7
::;
1.2
Unmatcheddeaths
Jhite
12169
:3
51
1,362257323514
230
51
260
100293135152
2;:41
;:47
4:.
?,06141
2X
67
2::
:;
2:!83
469
$onwhite
lx4555
37
305652469
24
33
358
83642556
2217434
H41
%!
,8;:
x
22
1::
2538
2;!
329
Proportionunmatched
White
34.327,324.536.4
23.0
21.523.026.820,3
16.3
16.7
19.5
28.531.415.820.7
22.224,738.033.219.021.8
15.029.9
20.323.6
14.921.1
22.0
20.225,9
40.321.025.817.226.2
21.2
Nonwhite
38.226.927.330,2
33.3
32,730.230.028.6
30.0
39.3
29.5
28.838.327.528.9
30.628.928,830.627.321.2
40.323.8
34.128.1
29.829.1
22.0
30.833.0
32.526.028.925.929.6
32.6
20

Table 4. Number of deaths matched at usual place of ]esidence and net difference rates, deakhs tmmatched,and proportion unmatched for 89 selected urban areas of 25,000 population or more by color: United States,N,iy-August 1960—Con.
[MS., rcc.rd .smi m a base for net cflfference mm and propmlmn .mtmhed. Mln.s (-) sign lnchcates more assignments by census than y NCli3. Incl.fies only those areasforwh!ch at least 50nonwhse deaths were asstgnedaccord, n~ toetthertl,e census record ordmth reccm
Area
Nossachusctts:Boston--------------
Nichigan:Elctroit-------------Flint ---------------
Mississippi:Greenville ----------Jackson -------------Vicksburg -----------
Missouri:Kansas City ---------St. Louis -----------
Nebraska:Omaha ---------------
Omaha--------------NewJersey;Atlantic City -------Jersey City ---------Newnrk --------------
New yO?Ck:
New York City -------~~ff~l~----...-.---.
North Carolina:Charlotte -----------Durham --------------Greensboro ----------Raleigh -------------Wilmington ----------Winston-Salem -------
Ohia :Akron ---------------Cincinnati ----------Cleveland -----------Columbus------------Dayton --------------Tol.cdo--------------Youngstown ----------
Oklahoma:Oklahoma City -------Tulsa ---------------
Pennsylvania:Philadelphia---------Pittsburgh ----------
South Carolina:Charles ton----------Columbia ------------Greenville ----------
Tennessee:Chattanooga ---------Knoxville -----------Memphis -------------NashviJ,le -----------
Texas:Beaumont ------------Dallas --------------Fort Worth ----------‘Galveston -----------Houston -------------San Antonio ---------Waco ----------------
Deaths matched at usual residenceaccording to:
Census record
Whitf
1,927
3,34438C
1;;31
1,1391,742
584
165767740
8,7031,520
208120114
9371
122
6021,0821,934
836529783416
546447
4,4641,551
1:;65
200215594279
163928569144
1,152925170
Nonwhite
134
88573
18;67
213514
65
::266
2,074129
13955636060
112
2:?492167127
8153
8165
1,174264
71
;;
114
4;;190
75251130
3 z9859
Death record
White
1,946
3,383387
1::31
1,1461,771
613
160761761
8,8131,559
206123117
9473
128
6161,0911,995
835549791418
581493
L,5291,639
84132
74
212221617294
172945598147
1,017940177
Nonwhite
129
89871
1::69
216513
66
58
2::
2,132116
13954625965
115
56254489173126
8352
8370
1,162281
U50
113
42:191
76247131
3X9954
Netdifference rate
White
1.0
1.21.8
6.33.7
0.61.7
5.0
-3.0-0.8
2.8
0.62.6
-1.02.52.61.12.84.9
$:
-i::3.81.00,5
6.410.3
1.55.7
6.3
13. i
6.02.83.95.4
5.5
;:!2.1
-11.7
H
Nonwhite
-3.7
-;:?
-3.21.03,0
1.4-0.2
1.5
9.4
-::;
2.8-10.1
-1.8-1.6-1.7
8.32.7
-3.42.8
-0.6
-:::2.5
-1.9
2.57.7
-1.06.4
-1.4
-;:;
-0.9-7.0
1.40.5
1.3-1.6
0.8
-1:: ;
-R
Unmatcheddeaths
White
457
66368
125412
242471
151
51153239
4,350225
73
‘&291225
12723233917913318655
201131
,235410
;:36
85
%78
3X211
3:;286
62
Nonwhite
71
34116
133214
85242
33
24
1::
1,25236
40312411
H
1:?184
46442218
4431
51888
::26
6522
17365
21137
;;161
4218
Proportionunmatched
White
19.2
16.515.2
27.328.727.9
17.521.3
20.5
23.616.624.4
18.912.9
26,018.928.323.814.517.0
17.417.714.917.620.119.211.7
26.922.7
21.720.9
24.813.235.6
29.830.618.521.8
21.625.727.119.123.223.626.7
Nonwhite
34.6
27.818.0
17.323.417,3
28.532.0
33.7
31.238.937.6
37.621.8
22.336.027.615.517.829.1
33.329.027.221.625.721.425.4
35.232.3
30,625.0
22.040.433.3
36.327.828.425.5
21.935.330.926.730.130.023.4
21

Table 4. lk~mber of deaths matched at usual place of residence and net difference rates, deaths unmatched,and proportion unmatched for 89 selected urban areas of 25,000 population or more by color: United States,May-August 1960—Con.
[3msL!s re:ord used as a base for net difference rate and proportion rematched. Minus (-) sign indicates m.xe assignments by census than by NCHS. Includes only those areasfor which at least 50 nonwhite deaths were assigned according to either the census rscom or &eath recc+~
Area
Virginia:Newport News --------Nor folk -------------Petersburg ----------Portsmouth ----------Richmond ------------
Wisconsin:Milwaukee -----------
Deaths matched at usual residenceaccording to:
Census record
Whit e
108377
1;:432
1,205
1,750
~onwhite
Death record
White
109383
1?:440
1,260
1,766
Nonwhite
7219551
1:;
60
91
Netdifference rate
White
0.91.6
2.;1.9
4.6
0.9
gonwhite
1.4
::!1.3
1.7
-1.1
Unmatcheddeaths
Nonwhite
3181;:
92
25
34
PIoportionunmatched
White
22.322.118.822.216.4
28,0
15.7
Nonwhite
30.429.922.231.633.2
29.8
27.0
22
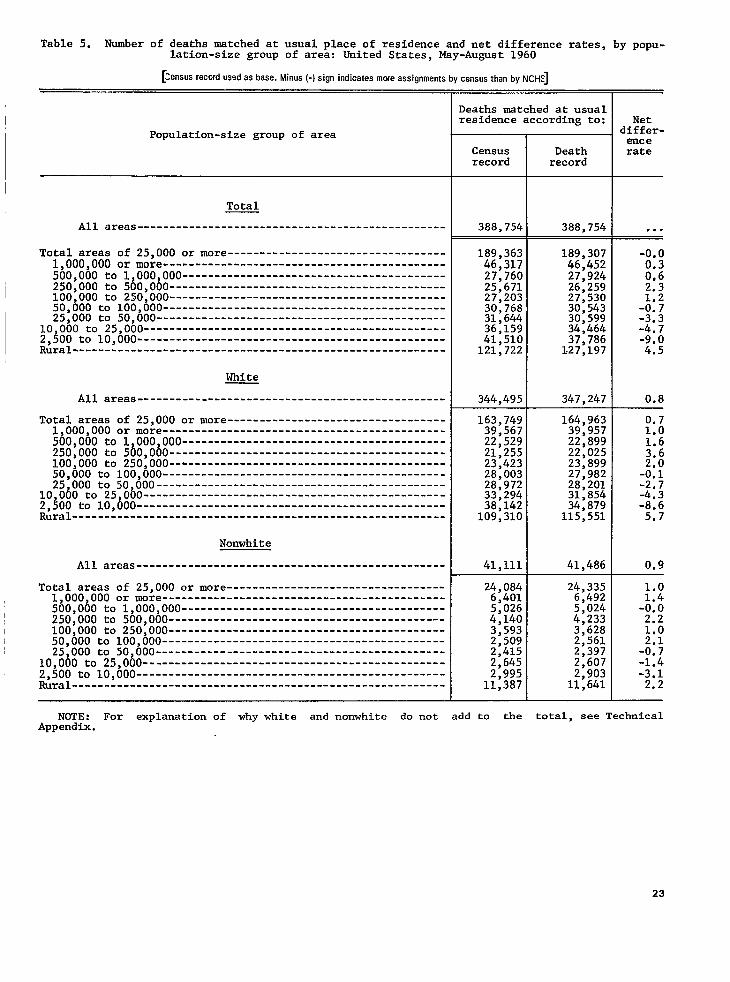
I
I Table 5. Number of deaths matched at usual place of residence and net difference rates, by popu-lation-size group of area: United States, May-August 1960
[.ensus record used as base. Minus (-) sign indicates more assignments by census than by NCHS]
Population-size group of area
Total
All areas------------------------------------------------
Total areas of 25,000 or more ----------------------------------1,000,000 or more--------------------------------------------500,000 to l,ooo,ooo-----------------------------------------250,000 to 500,000-------------------------------------------100,000 to 250,000-------------------------------------------50,000 to loo,ooo--------------------------------------------25,000 to 50,000---------------------------------------------
10 000 to 25 OOO-----------------------------------------------2,300 to lo,boo------------------------------------------------Rural----------------------------------------------------------
White
All areas------------------------------------------------
Total areas of 25,000 or more ----------------------------------1,000,000 or more --------------------------------------------500,000 to l,ooo,ooo-----------------------------------------250,000 to 500,000-------------------------------------------100,000 to 250,000-------------------------------------------50,000 to loo,ooo--------------------------------------------25,000 to 50,000---------------------------------------------
10,000 to 25,000-----------------------------------------------2,500 to 10,000------------------------------------------------Rural----------------------------------------------------------
Nonwhite
All areas------------------------------------------------
Total areas of 25,000 or more ----------------------------------1,000,000 or more --------------------------------------------500,000 to l,ooo,ooo-----------------------------------------250,000 to 500,000-------------------------------------------100,000 to 250,000-------------------------------------------50,000 to loo,ooo--------------------------------------------25,000 to 50,000---------------------------------------------
10,000 to 25,000-----------------------------------------------2,500 to lo,ooo------------------------------------------------Rural----------------------------------------------------------
Deaths matched at usualresidence according to:
Censusrecord
388,754
189,36346,31727,76025,67127,20330,76831,64436,15941,510121,722
344,495
163,74939,56722,52921,25523,42328,00328,97233,29438,142
109,310
41,111
24,0846,4015,026:,;:;
2;5092,4152,6452,995
11,387
Nom: For explanation of why white and nonwhite do not add to theAppendIx.
Deathrecord
388,754
189,30746,45227,92426,25927,53030,54330,59934,46437,786
L27,197
347,247
41,486
24,3356,4925,0244,2333,6282,5612,3972,6072,903
11,641
Netdiffer-enterate
...
-0.00.30.62.3
-k ;-3.3-4.7-;.:
.
0.8
M1.6
M-0.1-2.7-4.3-8.65.7
0.9
1.0
-:::2.21.0
-;:$-1.4-3.12.2
total, see Technical
23
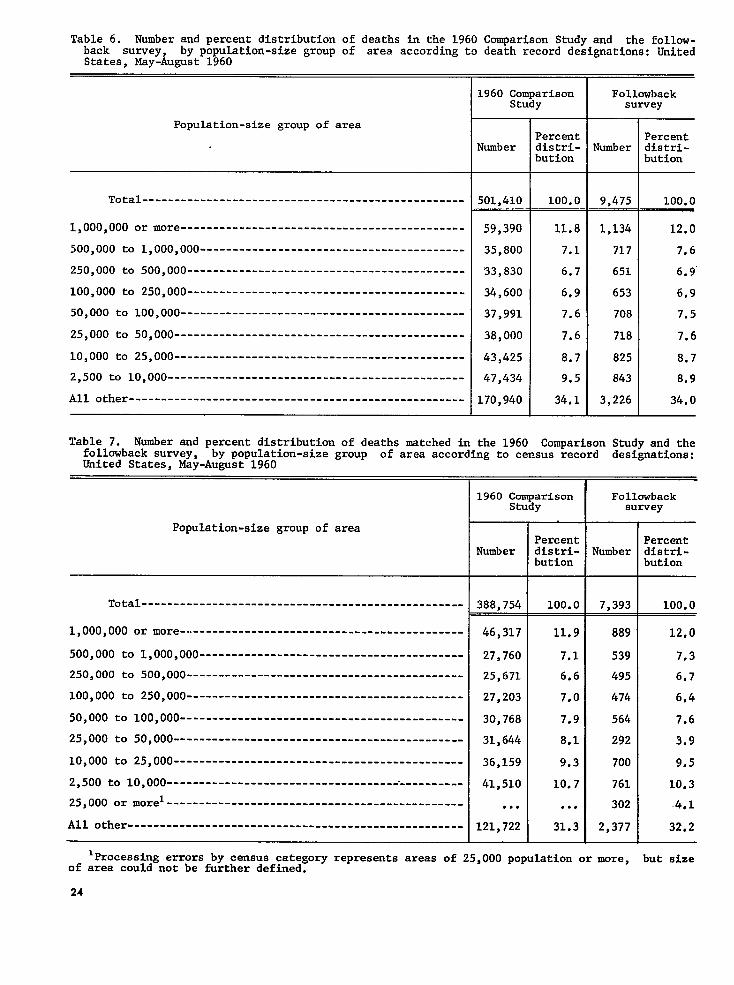
Table 6. Number and percent distributionof deaths in the 1960 ComparisonStudy and the follw-back survey, by population-sizegroup of area accordingto death record designations:UnitedStates,May-August1960
Population-sizegroup of area
Total--------------------------------------------------
1,000,000or more--------------------------------------------
500,000 to l,ooo,ooo -----------------------------------------
250,000 to 500,000 -------------------------------------------
100,000 to 250,000-------------------------------------------
50,000 to loo,ooo--------------------------------------------
25,000 to 50,000---------------------------------------------
10,000 to 25,000---------------------------------------------
2,500 to 10,000----------------------------------------------
All other----------------------------------------------------
L960 ComparisonStudy
Wmber
501,410
59,390
35,800
33,830
34,600
37,991
38,000
43,425
47,434
L70,940
?ercentlistri-)ution
100.0
11.8
7.1
6.7
6.9
7.6
7.6
8.7
9.5
34.1
Followbacksurvey
Number
9.475
1,134
717
651
653
708
718
825
843
3,226
Percentdistri-bution
100.0
12.0
7.6
6.9”
6.9
7.5
7.6
8.7
8.9
34,0
Table 7. Number and percent distributionof deaths matched in the 1960 ComparisonStudy and thefollowbacksurvey, by population-sizegroup of area accordingto census record designations:United States,May-August 1960
Population-sizegroup of area
Total--------------------------------------------------
1,000,000or more---------------------------------------------
500,000 to l,ooo,ooo-----------------------------------------
250,000 to 500,000-------------------------------------------
100,000 to 250,000-------------------------------------------
50,000 to loo,ooo--------------------------------------------
25,000 to 50,000---------------------------------------------
10,000 to 25,000---------------------------------------------
2,500 to 10,000-----------------------------------------------
25,000 or more1----------------------------------------------
All other------------------------------------------------.---
Wnnber
388,754
46,317
27,760
25,671
27,203
30,768
31,644
36,159
41,510
● .0
121,722
?ercentlistri-)ution
100.0
11.9
7.1
6.6
7.0
7,9
8.1
9.3
10.7
.*,
31.3
Followbacksurvey
Number
7,393—
889
539
495
474
564
292
700
761
302
2,377
‘ercentlistri-wtion
100.0
12.0
7.3
6.7
6.4
7.6
3,9
9.5
10.3
.4,1
32.2
lprocessingerrors by census categoryrepresentsareas of 25s000 Populationor ‘re* but sizeof area could not be further defined.
24

Table 8. Number and percent distribution of unmatched deaths, for which there were response and no responsein the followback survey, and unn=tched deathsin the 1960 COmParisOn Study,by Population-size grOuP Of areaaccordin~ to death record designations: United States, May-August 1960
Unmatched deathsin 1’360Comparison
Study
I Followback survey
No responsePopulation-size group of area
IPercentdistri-but ion
100.0
11.57.0
::;6.66.68.0
3;::
NumberPercentdistri-bution
Percent3istri-bution
NumberNumber
1
112,656
12,9387,8767,5717,0707,4487,4018,9619,648
43,743
221 100.0Total -------------------------------------------
1,000,000 or more -------------------------------------500,000 to 1,000,000 ----------------------------------250,000 to 500,000 ------------------------------------100,000 to 250,000 ------------------------------------50,000 to 100,000 -------------------------------------25,000 to 50,000 --------------------------------------10,000 to 25,000 --------------------------------------2,500 to 10,000 ---------------------------------------All other ---------------------------------------------
189127121140126127
10.26.86.5
::26.8
30341611241718
62
13.615.47.2
1:::
::;
2;:;
155164712
8.3
3%:I
Table 9. Net difference rates and proportion of death records unmatched for urban and rural areas in metro-I politan and nonmetropolitan counties, by cOlOr and sex: United States, Mey-Au@st 1960
rceath rscordused as a bass. Minus (-) sign mdrcetes more ass,gnrnents by census than by NCHS. FOr definition of areas. see Tachnical Appendix]
Propor-tion ofdeathsun -
natched
21.5
19.722.9
34.6
35.4
33.848.1
33.2
31.834.1
31.5
31.0
29.445.1
32.4
28.834.9
Propor-tion of~eathsun-
matched
Netdiffer-encerate
Netdiffer-encerate
Area, color, and sex Area, color, and sex
Total ------------------------ 21.1 White famale-Con.
Nonmetropolitan cnunties -----
Urban ----------------------------Rural ----------------------------
Nonwhite male --------------
Metropolitan counties --------
Urban ----------------------------Rural ----------------------------
Nonmetropolitan counties -----
Urban ----------------------------Rural ----------------------------
Nonwhite famale ------------
Metropolitan counties --------
Urban ----------------------------Rural ----------------------------
Nonmetropolitan counties -----
Urban ----------------------------Rural ----------------------------
. . .
0.5
2,4-0.9
...
-0.7
-2.215.0
1.1
0.32.0
...
-0.3
-1.210.0
0.4
-0.21.0
20.8
19.427.4
21.6
Metropolitan countiea ---------- -0.3
-%2
0.5
Urban ------------------------------Rural ------------------------------
Nonmetropolitan counties -------
-i;
. . .
-0.3
-%:
0.5
-::;
...
-0.3
0.6-5.0
20.022.7
21.0
20.8
19.227.4
21.2
19.822.0
20.4
19.8
18.027.8
Urban ------------------------------Rural ------------------------------
White male----------------r--
Metropolitan counties ----------
Urban ------------------------------Rural ------------------------------
Nonmetropolitan countiea -------
Urban ------------------------------Rural ------------------------------
White female -----------------
Metropolitan counties ----------
Urban ------------------------------Rural ------------------------------
NOTE : Figures with color i;dior sex not stated are included in the total, but are not shown separately.
25
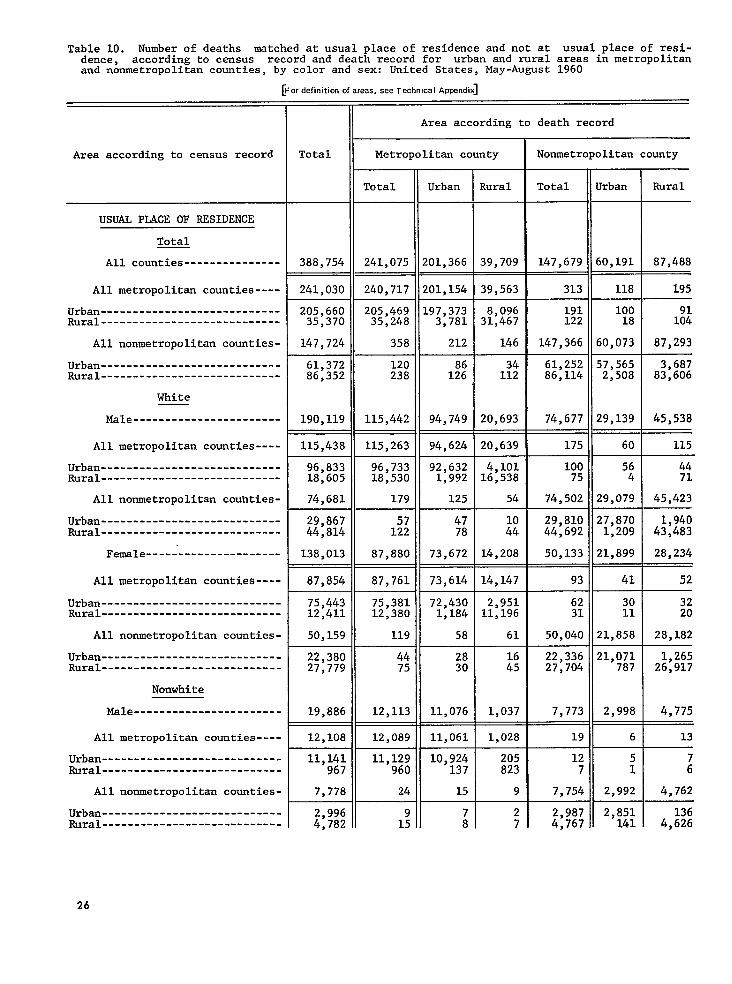
Table 10. Number of deaths matched at usual place of residence and not at usual place of resi-dence, according to census record and death record for urban and rural areas in metropolitanand nonmetropolitan counties, by color and sex: United States, May-August 1960
[For definition of areas, see Techneal Appsntiix]
Area according to census record Total
388,754
Area according to death record
Metropolitan county Nonmetropolitan county
Tota1
241,075
Urban IRural Total Urban Rura1
T!01,366 39,709
USUAL PLACE OF RESIDENCE
Total
All counties--------------- 147,679 60,191
118
87,488
195All metropolitan counties---- 241,030
205,66035,370
147,724
240,717
205,46935,248
358--t-
!f)l,154 39,563
L97,373 8,0963,781 31,467
313
191122
147,366
10018
60,073
1::87,293
Urban----------------------------Rural----------------------------
All nonmetropolitan counties- 212 I 146
61,37286,352
190,119
120238
115,442
1!2 1;;
94,749 20,693
61,25286,114
74,677
175
10075
74,502
57,5652,508
29,139
60
564
29,079
3,68783,606
45,538
115
4471
45,423
Urban----------------------------Rural----------------------------
White
Male -----------------------
All metropolitan counties---- 115,438 115,263 94,624 ]20,639
96,73318,530
179
1;;
87,880
87,761
92,632 4,1011,992 16,538
Urban----------------------------Rural----------------------------
96,83318,605
74,681
29,86744,814
138,013
87,854
---t-
125 54
4778 H
All nonmetropolitan couhties-
29,81044,692
50,133
27,8701,209
21,899
1,94043,483
28,234
Urban----------------------------Rural----------------------------
73,672 14,208Female---------------------
73,614 14,147 41
3011
21,858
52
3220
28,182
All metropolitan counties---- 93
6231
50,040
75,44312,411
50,159
72,430 2,9511,184 11,196
58 61
Urban ----------------------------Rural----------------------------
75,38112,380
119All nonmetropolitan counties-
2830 H
22,33627,704
7,773
1,26526,917
4,775
Urban ----------------------------Rural----------------------------
22,38027,779
19,886
4475
12,113
21,071787
2,998
Nonwhite
Male -----------------------
All metropolitan counties---- 12,108 12,089 19 6 13
11,141967
7,778
+
10,924 205137 823
15 9
2; 7
127
7,754
51
2,992
:
4,762
Urban----------------------------Rural----------------------------
All nonmetropolitan counties-
11,129960
24
1364,626
Urban--------------------------- -Rural----------------------------
2,9964,782
2,9874,767
2,851141
26
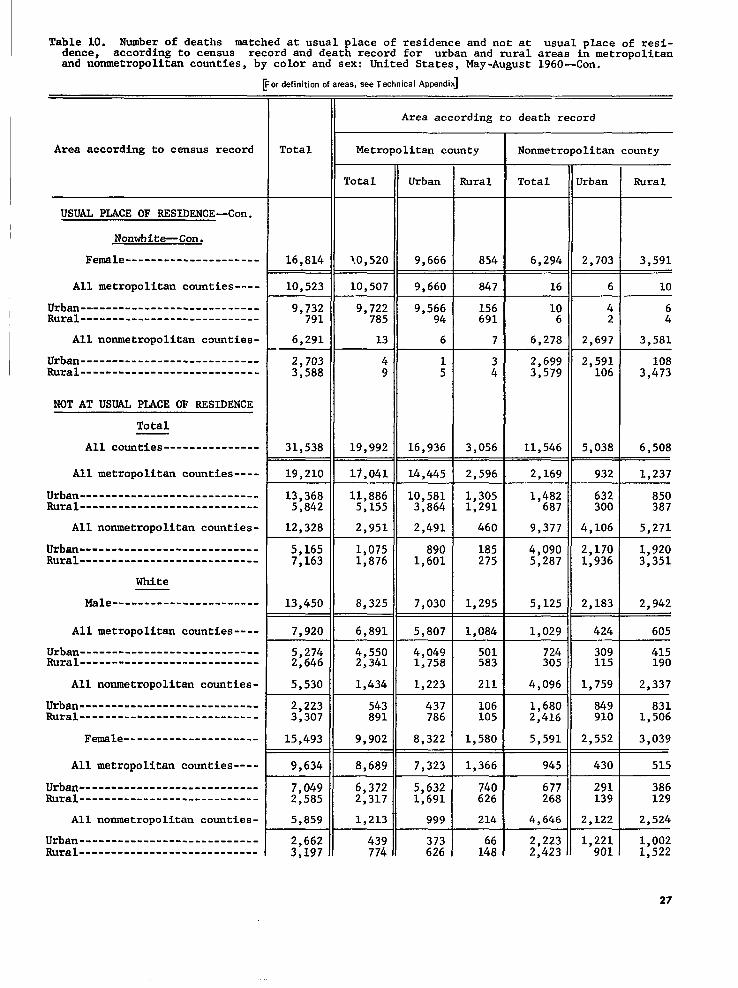
Table 10. Number of deaths matched at usual place of residenceand not at usual place of resi-dence, accordingto census record and death record for urban and rural areas in metropolitanand nonmetropolitancounties,by color and sex: United States,May-August 1960-Con.
,r definition of areas, see Tectmical Appendix]
Area according to death record
Area accordingto census record Total
16,814
Metropolitancounty Nonmetropolitancounty
Rural
854
Jrban
2,703
Total
1.0,520
Urban
9,666
Total
6,294
Rura1
3,591
USUAL PLACE OF RESIDENCE-Con.
Nonwhite-Con.
Female---------------------
All metropolitancounties---- 10,523 10,507 9,660
9,56694
6
847 16 6 10
Urban----------------------------Rural----------------------------
All nometropolitan cwnties-
9,732791
6,291.—
2,7033,588
31,538
9,722785
13
156691
7
106
6,278
42
2,697
:
3,581
Urban----------------------------Rural----------------------------
49
19,992
;
16,936
:
3,056
2,6993,579
11,546
2,591106
5,038
1083,473
6,508
NOTAT USUAL PIACE OF RESIDENCE
Total
All counties---------------
All metropolitancounties---- 19,210 17,041 14,445 2,596 2,169
1,482687
9,377
4,0905,287
5,125
1,029
932
632300
4,106
2,1701,936
2,183
1,237
Urban----------------------------Rural----------------------------
13,3685,842
12,328
5,1657,163
13,450
7,920
11,8865,155
2,951
1,0751,876
8,325
6,891
10,5813,864
2,491
8901,601
7,030
5,807
1,3051,291
46o
185275
1,295
1,084
850387
5,271
1,9203,351
2,942
All nonmetropolitancounties-
Urban----------------------------Rural----------------------------
---------------------------White
Male-----------------------
All metropolitancounties----
Urban----------------------------Rural----------------------------
424
309115
1,759
605
5,2742,646
5,530
4,5502,341
1,434
4,0491,758
1,223
501583
211
724305
4,096
415190
2,337All nonmetropolitancounties-
Urban----------------------------Rural----------------------------
2,2233,307
15,493
543891
9,902
437786
8,322
106105
1,580
1,6802,416
5,591
849910
2,552
8311,506
3,039
515
Female---------------------
All metropolitancounties---- 9,634 8,689 7,323 1,366 945 430
Urban................-----------.Rural----------------------------
All nonmetropolitancounties-
7,0492,585
5,859
6,3722,317
1,213
5,6321,691
999
740626
214
677268
4,646
291139
2,122
386129
2,524
1,0021,522
27
Urban------------------------.---Rural----------------------------
2,6623,197
439774
373626
2,2232,423
1,221901

Table 10. Number of deaths matched at usual place of residence and not at usual place of resi-dence, according to census record and death record for urban and rural areas in metropolitanand nonmetropoli.tancounties, by color and sex: Untted States, May-August 1960-Con.
~ordefiniticm of areas, see TechnicalAppendix]
Area according to death record
Area according to census record Total Metropolitan county Nonmstropolitan county
rTotal
NOT AT USUAL PLACE OFRESIDENCE-Con.
Nonwhite
Male -----------------------
All metropolitan counties----
Urban----------------------------Rural----------------------------
---------------------------Alanonmetropolitan counties-
Urban----------------------------Rural----------------------------
Female ---------------------
All metropolitan counties----
Urban----------------------------Rural----------------------------
All nonmetropolitan counties-
Urban----------------------------Rural----------------------------
}
1,273
800
467333
F473
139334
I 903
I 379206
t-
318
108210
I
886
696
428268
190
1;;
617
518
350168
99
2772
Urban Rura 1 Tota1
793 93 387
625 71 104
405220
3965
+-l-;::20 29
22 38
89 10 219
25 264 8 1%
JrbanI
Rura 1
I148 239
39 I 65
+
109 174
4267 &
1151 171
26 I 41
12 1714 24
89 ! 130
48 3341 97
NOTE : Figures with color and/or sex not stated are included in the total but are not shownseparately.
28

Table 11. Comparisonof net difference rates and proportionunmatched, based on deaths matchedat usual place of residencefor 25 selected standardmetropolitanstatisticalareas (SMSA’S)and urban area componentsof those SMSA’S:United States,May-August1960
[Urban area components are only those of 25,000 pqmlstiorr or more. For further definition of areas, see Technicsl Appendix]
Area
Albuquerque,N. Mex----------------------------------------------------Albuquerque,N. Mex--------------------------------------------------
Augusta, Ga.-S.C-------------------------------------------------------Augusta,Ga----------------------------------------------------------
Billings,Mont---------------------------------------------------------Billings,Mont-------------------------------------------------------
Chicago, Ill-----------------------------------------------------------ArlingtonHeights, Ill-----------------------------------------------Aurora, Ill----------------------------------------------------------Berwyn, Ill----------------------------------------------------------Calumet City, Ill----------------------------------------------------Chicago, Ill---------------------------------------------------------ChicagoHeights, Ill-------------------------------------------------Cicero, Ill----------------------------------------------------------Des Plaines, Ill-----------------------------------------------------Elgin, Ill-----------------------------------------------------------Elmhurst, Ill--------------------------------------------------------Evanston, Ill--------------------------------------------------------Harvey, Ill----------------------------------------------------------Highland Park, Ill---------------------------------------------------Joliet, Ill----------------------------------------------------------Maywood, Ill---------------------------------------------------------Oak Lawn, Ill--------------------------------------------------------Oak Park, Ill--------------------------------------------------------Park Forest, Ill-----------------------------------------------------Park Ridge, Ill------------------------------------------------------Skokie, Ill----------------------------------------------------------Waukegan, Ill--------------------------------------------------------Wilmette, Ill--------------------------------------------------------
Davenport-RockIsland-Moline,Iowa-Ill---------------------------------Davenport,Iowa------------------------------------------------------Moline, Ill----------------------------------------------------------Rock Island, Ill-----------------------------------------------------
El Paso, Tex-----------------------------------------------------------El Paso, Tex---------------------------------------------------------
Fort Wayne, Ind--------------------------------------------------------Fort Wayne, Ind------------------------------------------------------
Jersey City, N.J-------------------------------------------------------Btjyonne,N.J---------------------------------------------------------Hoboken,NrJ---------------------------------------------------------Jersey City, N.J-----------------------------------------------------Kearny, N.J----------------------------------------------------------North Bergen, N.J----------------------------------------------------Union City, N.J------------------------------------------------------West New York, N.J---------------------------------------------------
Laredo, Tex------------------------------------------------------------Laredo, Tex----------------------------------------------------------
Lorain-Elyria,Ohio-----------------------------------------------------Elyria, Ohio---------------------------------------------------------Lorain, Ohio---------------------------------------------------------
Net
differ-enceratel
-0.36.0
0.38.2
8.;
0.24.28.31.1
$:;
-;:;15.8-3.14.7-0.5
-::;91.40.6
-::;5.6
-1.4-3.2
-::;
3.31..7
0.21.5
O*2
-0.;-0.8-0.9
-:::
0.8
-0,3-3.0-0.8
Proportionunmatched
Censusrecordbase
31.430.6
36.132.2
31.129.3
21.332.420.0
2?::22.816.0
3::;17.714.710.9,25.615.113.213.718.620.4
!::10.719.14.3
19.120.323.99.6
28.928.7
12.512.5
17.920●025.618.911.91;.;
20:7
25.325.7
25.017.319.6
Deathrecordbase
31.429.3
36.130.5
31.127.7
21.331.518.82.720.722.81;.;
30:218.214.111.025.6;;.;
14:810.72;.;.
1:::18.34.3
19.420.822.89.7
28.228.3
12.512.3
17.920.025.719.112.012.3
2:::
25.225.7
25.117.719.7
29

Table 11. Comparison of net difference rates and proportion unmatched, based on deaths matchedat usual place of residence for 25 selected standard metropolitan statistical areas (SMSA’S)
and urban area components of those SMSA’S: United States, May-August 1960-Con.
[Urban area components are only those of 25,000 population or more. For fmther definition of areas, sae Technical Appendix]
Area
Milwaukee, Wis---------------------------------------------------------Milwaukee, Wis-------------------------------------------------------Waukesha, Wis--------------------------------------------------------Wawatosa, Wis--------------------------------------------------------West Allis, Wis------------------------------------------------------
Muncie, Ind------------------------------------------------------------Muncie, Ind----------------------------------------------------------
Nashville, Term--------------------------------------------------------Nashville, Term------------------------------------------------------
Odessa, Tex------------------------------------------------------------Odessa, Tex-.--------------------------------------------------------
Omaha, Nebr.-Iowa-------------------------.----------------------------Council Bluffs, Iowa-------------------------------------------------Omaha, Nebr----------------------------------------------------------
Racing, Wis------------------------------------------------------------Racine, Wis----------------------------------------------------------
Rockford, Ill----------------------------------------------------------Rockford, Ill--------------------------------------------------------
Salt Lake City, Utah---------------------------------------------------Salt Lake City, Utah-------------------------------------------------
Shreveport, La---------------------------------------------------------Bossier City, La-----------------------------------------------------Shreveport, La-------------------------------------------------------
Steubenville-Weirton, Ohio-W.Va----------------------------------------Steubenville, Ohio---------------------------------------------------Weirton, W.Va .-------------------------------------------------------
Tacoma, Wash -----------------------------------------------------------Tacoma, Wash ---------------------------------------------------------
Tuscaloosa, Ala--------------------------------------------------------Tuscaloosa, Ala------------------------------------------------------
Wichita Falls, Tex-------------------------------.---------------.-----Wichita Falls, Tex---------------------------------------------------
Wilkes-Barre--Hazleton, Pa---------------------------------------------Hazelton, Pa---------------------------------------------------------Wilkes-Barre, Pa-----------------------------------------------------
Youngstown-Warren, Ohio------------------------------------------------Warren, Ohio---------------------------------------------------------Youngstown, Ohio-----------------------------------------------------
Netdiffer-enceratel
0.1
-;::6.35.7
13.3
-0.33.0
1.;
2.1
4.i
0.;
-;.;.
3.;
-0.4
0.;
0.8
2.5
-0.31.2
13.;
1.92.7
-0.1
u
Proportionunmatched
:ensusrecordbase
16.6;:.;
13:07.6
;;.;.
25.523.3
29.933.1
20.1
2:::
15.412.0
18.314.2
23.720.9
31.128.927.6
24.819.932.0
28.417.9
48.146.5
24.020.0
15.113.721.3
19.918.013.5
Deathrecordbase
16.616.224.713.87.3
25.217.6
25.522.8
29.932.8
19.8
2?:!
15.412.0
18.313.9
23.720.3
:;.;
27:4
24.719.931.4
28.517.7
48.143.4
;;.:.
15.113.721.3
19.917.213.4
lCensus record used as base. Minus (-) sign indicates more assignments by census than by NCHS.
30
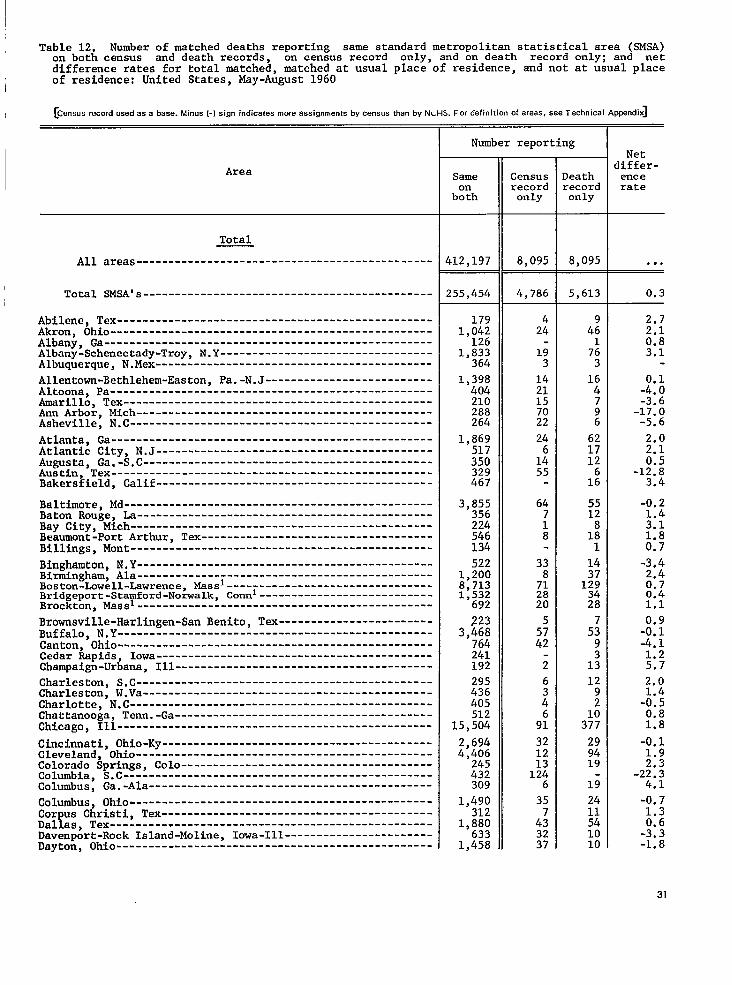
Table 12. Number of matched deaths reporting same standardmetropolitanstatisticalarea (SMSA)on both census and death records, on census record only, and on death record only; anddifferencerates for total matched, matched at usual place of residence,and not at usual place
net
of residence:United States,May-August1960
[Census record used as a base. Minus (-) sign indicates more assigmnents by census thm by NLHS. For definition of areas, see Technical Appendix]
Area
Total
All areas----------------------------------------------
Total =SA's ---------------------------------------------
Abi.lene,Tex-------------------------------------------------Akron, Ohio--------------------------------------------------Albany, Ga---------------------------------------------------Albany-Schenectady-Troy,N.Y---------------------------------Albuquerque,N.Mex-------------------------------------------
Allentown-Bethlehem-Easton,Pa.-N.J--------------------------Altoona,Pa--------------------------------------------------Amarillo,Tex------------------------------------------------Ann Arbor, Mich----------------------------------------------Asheville,N.C-----------------------------------------------
Atlanta, Ga--------------------------------------------------Atlantic City, N.J-------------------------------------------Augusta, Ga.-S.C---------------------------------------------Austin, Tex--------------------------------------------------Bakersfield,Calif-------------------------------------------
Baltimore,Md------------------------------------------------Baton Rouge, La----------------------------------------------Bay City, Mich-----------------------------------------------Beaumont-PortArthur, Tax------------------------------------Billings,Mont-----------------------------------------------
Binghamton,N.Y----------------------------------------------Birmingham,Ala----------------------------------------------Boston-tiwell-Lawrence,Massl--------------------------------Bridgeport-Stamford-Norwalk,Connl---------------------------Brockton,Masst----------------------------------------------
Brownsville-Harlingen-SanBenito, Tax------------------------Buffalo,N.Y-------------------------------------------------Canton, Ohio-------------------------------------------------Cedar Rapids, Iowa-------------------------------------------Champaign-Urbana,Ill----------------------------------------
Charleston,S.C----------------------------------------------Charleston,W.Va---------------------------------------------Charlotte,N.C-----------------------------------------------Chattanooga,Term.-Ga----------------------------------------Chicago, Ill-------------------------------------------------
Cincinnati,Ohio-Ky--------.---------------------------------Cleveland,Ohio----------------------------------------------Colorado Springs,Colo---------------------------------------Columbia,S.C------------------------------------------------Columbus,@.-Ala --------------------------------------------
Columbus,Ohio-----------------------------------------------Corpus Christi,Tex-------------------------------------------Dallas, Tex--------------------------------------------------Davenport-RockIsland-Moline,Iowa-Ill-----------------------Dayton, Ohio-------------------------------------------------
Number reporting
Same
b%h
412,197
255,454
1791,042126
1,833364
1,398404210288264
1,869517350329467
3,855356224546134
5221,2008,7131,532692
Z233,468764241192
295436405512
15,504
2,6944,406245432309
1,490312
1,880633
1,458
recordonly
8,095
4,786
2:
193
142115
;;
24
1:55
64
:8
338
;:20
5
z
i
6
:
9:
3212131246
35
4;3237
Deathrecord
only
8,095
5,613
4:1763
164
;6
62
:;616
5512
1:1
1437129
;:
5;9
1:
12
;
3%
299419
1;
2411541010
Netdiffer-enterate
.0.
0.3
2.72.10.83.1
-::;-3.6-17.0-5.6
2.0
i:;-12.83.4
-0.2
i::1.80.7
-3,42.40.70.41.1
-:::-4.11.25.7
2.0
-:::0.81.8
-0.11.9
-2;::4.1
-0.71.30.6-3.3-1.8
31

Table 12. Number of matched deaths reporting same standard metropolitan statistical area (SMSA)on both census and death records, on census record only, and on death record only; and netdifference rates for total matched, matched at usual place of residence, and not at usual placeof residence: United States, May-August 1960—Con.
&en.s.s record used as a baw. Minus (-) sign indicatesmm swig.rnents by census than by NCHS. For definition of areas, see Techn!cal Appendix]
Area
Decatur, Ill-------------------------------------------------Denver, Colo-------------------------------------------------Des Moines, Iowa---------------------------------------------Detroit, Mich ------------------------------------------------Dubuque, Iwa------------------------------------------------
Duluth-Superior, Minn.-Wis -----------------------------------Durham, N.C--------------------------------------------------El Paso, Tex---------,----------------------------------------Erie, Pa-----------------------------------------------------Eugene, Oreg-------------------------------------------------
Evansville, Ind.-Ky------------------------------------------Fall River-New Bedford, MassI --------------------------------Fargo-Moorhead, N.Dak. -Minn----------------------------------Flint, Mich --------------------------------------------------Fort Lauderdale-Hollywood, Fla-------------------------------
Fort Smith, Ark-----------------------------------------------Fort Wayne, Ind----------------------------------------------Fort Worth, Tex----------------------------------------------Fresno, Calif------------------------------------------------Gadsden, Ala -------------------------------------------------
Galveston-Texas City, Tax------------------------------------Gary-Hammond-East Chicago, .Ind-------------------------------Grand Rapids, Mich -------------------------------------------Great Falls, Mont ---------------------------------------.--.-Green Bay, Wis-----------------------------------------------
Greensboro-High Point, N.C-----------------------------------Greenville, S.C----------------------------------------------Hamilton-Middletown, Ohio------------------------------------Harrisburg,Pa-----------------------------------------------Hartford-NewBritain-Bristol,Connl--------------------------
Honolulu, &waii ---------------------------------------------Houston, Tex-------------------------------------------------Huntington-Ashland, W.Va. -Ky.-Ohio---------------------------Huntsville, Ala----------------------------------------------Indianapolis, Ind--------------------------------------------
Jackson, Mich ------------------------------------------------Jackson, Miss ------------------------------------------------Jacksonville, Fla--------------------------------------------Jersey City, N.J---------------------------------------------Johnstown, Pa------------------------------------------------
Kalamazoo, Mich ----------------------------------------------Kansas City, Mo. -Kans----------------------------------------Kenosha, Wis -------------------------------------------------Knoxville, Term----------------------------------------------Lake Charles, L“a---------------------------------------------
Lancaster,Pa------------------------------------------------Lansing,Mich ------------------------------------------------Laredo, Tex--------------------------------------------------Las Vegas, Nev-------------------------------'----------------Lawton, Okla-------------------------------------------------
Number reporting
Same
b%h
2371,942622
7,848186
741222439649238
440998170720702
;;;
1,025715150
2781,166808180253
392269400885
1,551
6021,934529144
1,673
345346839
1,865813
3222,330192622185
65656811819999
recordonly
2;
2223
161
;
19137
2:
2;1:
10
3
3;68
11
3;16
1:23
1:
2;13
2?
2926
3:
6412
1
Deathrecordonly
Net3iffer-encerate
-2.22.6
-:::
:::.
::!
-3.7
::;
-;:;
-1.50.41.3
-:::
2:;-1.7-1,61.5
-0.54.5
-i:?1.6
-:.;
-1:4-1.31,8
-::;1.1
-%{
-7.72.9
-:::3.8
-5.60.7
::;5.0
32

Table 12. Number of matched deaths reporting same standard metropolitan statistical area (SMSA)on both census and death records, on census record only, and on death record only;difference ratea for total matched, matched at usual place of residence, and not at usual place
and net
of residence: United States, May-August 1960-Con.
[Oms.mrecord used as a base, Minus (-) sign indicates more assignments by census than by NO-R. For definition of areas, sw Technical Appsndix]
Area
Lexington, Ky------------------------------------------------Lima, Ohio---------------------------------------------------Lincoln, Nebr------------------------------------------------Little Rock-North Little Rock, Ark---------------------------Lorain-Elyria, Ohio------------------------------------------
Los Angeles-Long Beach, Calif--------------------------------Louisville, Ky.-Ind------------------------------------------Lubbock, tiX-------------------------------------------------
Lynchburg, Va------------------------------------------------Macon, Ga----------------------------------------------------
Madison, Wis-------------------------------------------------Manchester, N.H1------------------------------,---------------Memphis, Term ------------------------------------------------Miami, Fla---------------------------------------------------Midland, Tex-------------------------------------------------
Milwaukee, Wis-----------------------------------------------Minneapolis-St. Paul, Mien -----------------------------------Mobile, Ala--------------------------------------------------Monroe, b---------------------------------------------------Montgomery, Ala----------------------------------------------
Muncie, Ind--------------------------------------------------Muskegon-Muskegon Heights, Mica ------------------------------Nashville, Term ----------------------------------------------Newark, N.J--------------------------------------------------New Haven-Waterbury, Connl-----------------------------------
New Orleans, La----------------------------------------------Newport News-Hampton, Va-------------------------------------New York, N.Y------------------------------------------------Norfolk-Portsmouth, Van--------------------------------------Odessa, Tex--------------------------------------------------
Ogden, Utah--------------------------------------------------Oklahoma City, Okla ------------------------------------------Omaha, Nebr.-Iowa--------------------------------------------Orlando, Fla-------------------------------------------------Paterson-Clifton-Passaic, N.J--------------------------------
Pensacola, Fla-----------------------------------------------Peoria, Ill--------------------------------------------------Philadelphia, Pa.-N.J----------------------------------------Phoenix, Ariz ------------------------------------------------Pittsburgh, Pa-----------------------------------------------
Pittsfield, Mass~--------------------------------------------Portland, Winel ---------------------------------------------Portland, Oreg.-Wash-----------------------------------------Providence, R.I1---------------------------------------------Provo-Orem, Utah---------------------------------------------
Pueblo, Colo-------------------------------------------------Racine, Wis--------------------------------------------------Raleigh, N.C-------------------------------------------------Reading, Pa--------------------------------------------------Reno, Nev----------------------------------------------------
Number reporting
Same
b=h
292228355410394
14,5831,643179215336
426450
1,2971,984
61
2,7623,207520195280
242328819
4,1631,672
2,169366
28,001974101
179915968555
2,619
306644
10,931994
6,061
418465
2,1302,012180
245320267852158
Censusrecordonly
4014213217
9037
2i16
23
2;3
2365353
16
i
1::18
2434933
5;29
42
452
:;57
611292131
108
::2921
Deathrecordonly
Netdiffer-enterate
-10.2
-:::-6.3-2.4
-H13.4-4.-2-1.4
-2.0
-H0.79.8
::2-2.5
-?::
H-5.2-0.02.5
-::;0.93.22.0
-::;
w2.2
-:::
-:::-0.0
0.92.5
;:!-14.7
-30.3-1.5-8.8-2.7-11.2
33
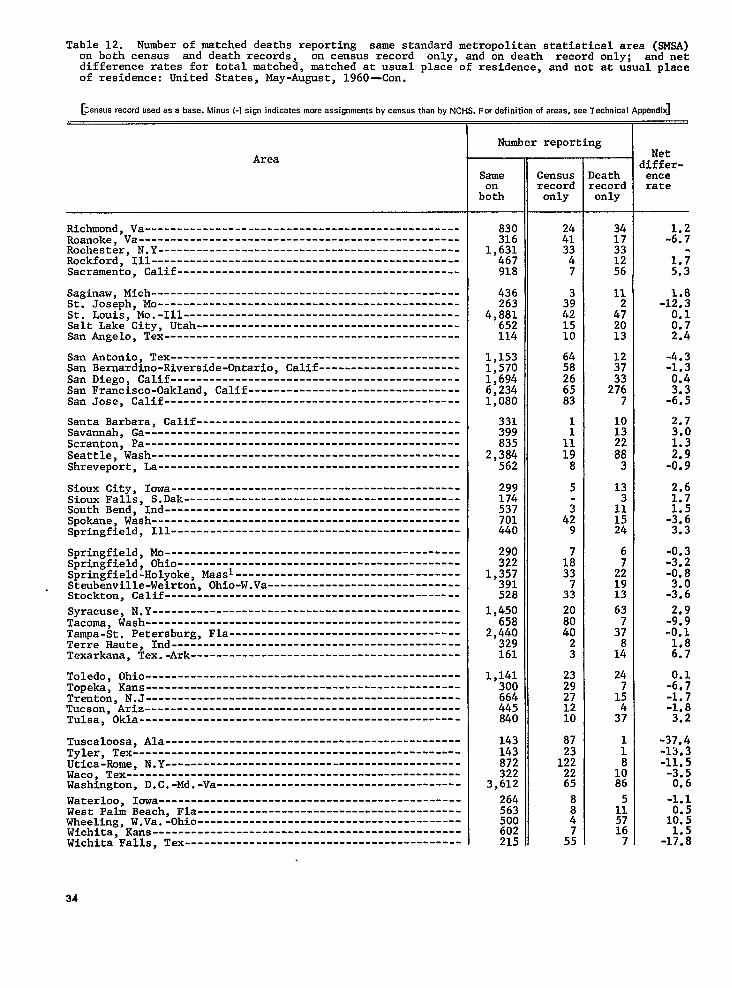
Table 12. Number of matched deaths reporting same standard metropolitan statistical area (SMSA)on both census and death records, on census record only, and on death record only; and netdifference rates for total matched, matched at usual place of residence, and not at usual placeof residence: United States, May-August, 1960-Con.
[Census recordused ass base. Minus (-) sign indicates more asaignme”ts by census than by NCHS. For definition of areas, see Technical Appendix]
Area
Richmond, Va-------------------------------------------------Roanoke, Va--------------------------------------------------Rochester, N.Y-----------------------------------------------Rockford, Ill------------------------------------------------Sacramento, Calif--------------------------------------------
Saginaw, Mich ------------------------------------------------St. Joseph, Mo-----------------------------------------------St. Louis, Mo.-Ill -------------------------------------------Salt Lake City, Utah-----------------------------------------San Angelo, Tex----------------------------------------------
San Antonio, Tex---------------------------------------------San Bernardino-Riverside-Ontario, Calif----------------------San Diego, Calif---------------------------------------------San Francisco-Oakland, Calif---------------------------------San Jose, Calif----------------------------------------------
Santa Barbara, Calif-----------------------------------------Savannah, Ga-------------------------------------------------Scranton, Pa-------------------------------------------------Seattle, Wash .........---------------------------------------Shreveport, La-----------------------------------------------
Sioux City, Iowa---------------------------------------------Sioux Falls, S.Dak-------------------------------------------South Bend, Ind----------------------------------------------Spokane, Wash ------------------------------------------------Springfield, T.ll---------------------------------------------
Springfield, MO----------------------------------------------Springfield, Ohio--------------------------------------------Springfield-Holyoke, Massl -----------------------------------Steubenville-Weirton, Ohio-W.Va------------------------------Stockton, Calif----------------------------------------------
Syracuse, N.Y------------------------------------------------Tacoma, Wash ----.--------------------------------------------Tampa-St. Petersburg, Fla------------------------------------Terre Haute, Ind---------------------------------------------Texarkana, Tex.-Ark------------------------------------------
Toledo, Ohio-------------------------------------------------Topeka, Kans -----------.-----------.-------------------------Trenton, N.J-------------------------------------------------Tucson, Ariz -------------------------------------------------Tulsa, Okla--------------------------------------------------
Tuscaloosa, Ala----------------------------------------------Tyler, Tex------------------------------------------.--------Utica-Rome, N.Y----------------------------------------------Waco, Tex----------------------------------------------------Washington, D.C.-Md.-Va--------------------------------------
Waterloo, Iwa-----------------------------------------------West Palm Beach, Fla-----------------------------------------Wheeling, W.Va. -Ohio-----------------------------------------Wichita, Kans------------------------------------------------Wichita Falls, Tex-------------------------------------------
Number reporting
Same
b%h
830316
1,631467918
436263
4,881652114
1,1531,5701,6946,2341,080
331399835
2,384562
299174537701440
290322
l,:;!
528
1,450658
2,440329161
1,141300664445840
143143872322
3,612
264563500602215
Censusrecordonly
;;3347
3
%1510
6458266583
1
1;198
5
4;
1:33
3;
20
:!
3
2329271210
87
1;;2265
:4
5;
)eath?ecordonly
341733
%
11
4;2013
1237
2%7
1013
i:
13
1:1524
6
2;1913
63
3;
1:
24
1:
3;
:81086
51157167
Netliffer-encerate
-::;
1.;5.3
-k:
M2.4
-4.3-1.30.4
-2::
2.73,01.3
-;:;
2.6
::;-;.;.
-0.3-3.2-0.8
-u
-;:;-0.1
::;
-H-1.7-1.83.2
-37.4-13.3-11● 5-3.50,6
-1.1
1?)::
-1;:2
34

Table 12. Number of watched deaths reportingon both census
same standardmetropolitanstatisticalarea (.91sA)and death records, on census record only, and on death record only;
differencerates for totalmatched,matched at usual place of residence,and not at usual placeand net
of residence:United States,May-August1960-Con.
[Censusrf!ccrd used as a base, Minus (-) sign indicates more assignments by census tl,~n by NW:. For definition of areas, see Technical Appmdix]
Area
Wilkes-Barre-Hazleton,Pa----------------------------------”-Wilmington,Del.-N.J-----------------------------------------Winston-Salem,N.C-------------------------------------------Worcester,Wssl ---------------------------------------------York, Pa-----------------------------------------------------
Youngstown-Warren,Ohio--------------------------------------All other
All
Total.
areas----------------------------------------------
Usual place of residence
areas----------------------------------------------
mM's ---------------------------------------------
Abilene, Tex-------------------------------------------------Akron, Ohio--------------------------------------------------Albany, @---------------------------------------------------Albany-Schenectady-Troy,N.Y---------------------------------Albuquerque,N.Mex-------------------------------------------
Allentown-Bethlehem-Easton,Pa.-N.J--------------------------Altoona, Pa--------------------------------------------------tirillo, Tex----------------------------------------------.,-AnnArbor, Mich.......---------------------------------------Asheville,N.C-----------------------------------------------
Atlanta, @--------------------------------------------------Atlantic City, N.J-------------------------------------------Augusta, Ga.-S.C---------------------------------------------Austin, Tex--------------------------------------------------Bakersfield,Calif-------------------------------------------
Baltimore,Md------------------------------------------------Baton Rouge, La----------------------------------------------Bay City, Mich-----------------------------------------------Beaumont-PortArthur, Tax------------------------------------Billings,Mont-----------------------------------------------
Binghamton,N.Y----------------------------------------------Birmingham,Ala----------------------------------------------Boston-Lowell-Lawrence,Massl--------------------------------Bridgeport-Stamford-Norwalk,Connl---------------------------Brockton,Massl----------------------------------------------
Brownsville-Harlingen-SanBenito, Tax------------------------Buffalo,N.Y-------------------------------------------------Canton, Ohio-------------------------------------------------Cedar Rapids, Iowa-------------------------------------------Champaign-Urbana,Ill----------------------------------------
Charleston,S.C----------------------------------------------Charleston,W.Va........-----------.......--------------------Charlotte,N.C-----------------------------------------------Chattanooga,Term.-Ga----------------------------------------Chicago, Ill-------------------------------------------------
Number reporting
Same
b~h
1,;;;
3251,652545
1,116156,743
387,763
240,397
1671,010124
1,;;:
1,330378208273257
1,802462327301460
3,581350209538133
4941,1757,8441,456619
2153,230714227180
289422394501
14,683
Censusrecordonly
H9;8
3,30;
991
633
i.
i
62
i1
61
i
2
i6
22627
142
i
!2
1;
Deathrecordonly
Netdiffer-enterate
0.10.9
-3.;4.5
-w
...
0.0
-0.;0.8
-% :
-0.4
-!:2
-0.2-0.2
-;:;●
-0.1
-;:21.1
-0.6-0.4O*(I
0.;
-0.20.40.4
-1.7
-0.;
::$
35
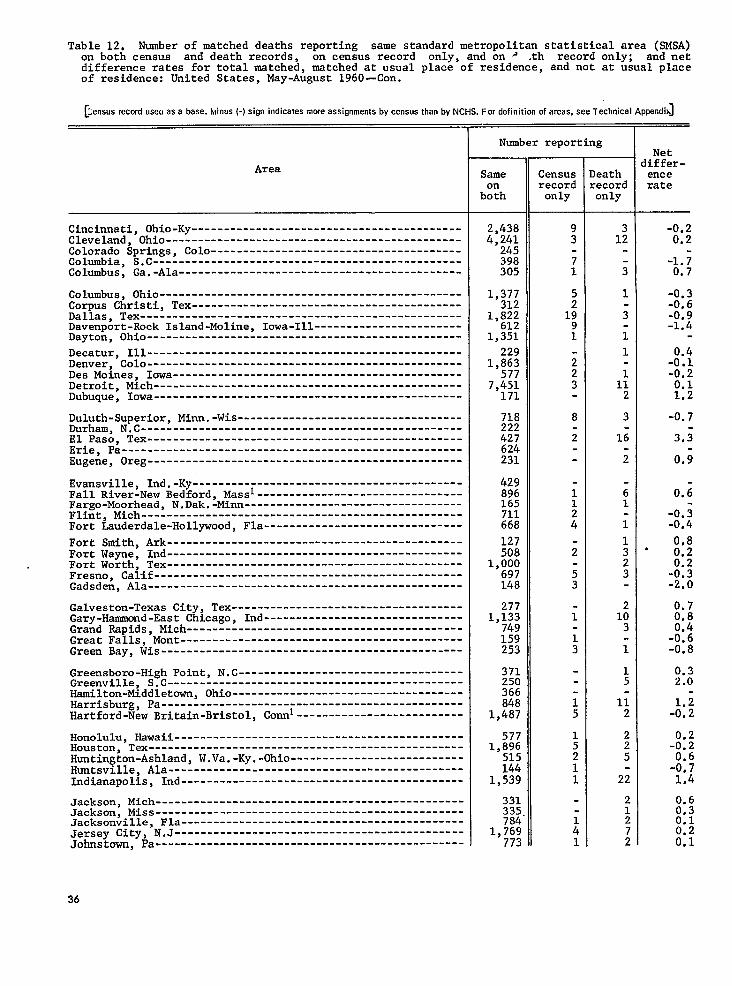
Table 12. Number of matched deaths reporting same standard metropolitan statistical area (SMSA)on both census and death records, on census record only, and on > .th record only; and netdifference rates for total matched, matched at usual place of residence, and not at usual placeof residence: United States, May-August 1960-Con.
~%sus record useu as a base. kinus (-) sign indicates more z!ss.ignnmts by census thrm by NCHS. For definition of WIX+S,see Technical Appendix]
Area
Cincinnati, Ohio-Ky------------------------------------------Cleveland, Ohio----------------------------------------------Colorado Springs, Colo---------------------------------------Columbia, S.C------------------------------------------------Columbus, Ga.-Ala--------------------------------------------
Columbus, Ohio-----------------------------------------------Corpus Christi, Tex------------------------------------------Dallas, Tex--------------------------------------------------Davenport-Rock Island-Moline, Iowa-Ill-----------------------Dayton, Ohio-------------------------------------------------
Decatur, Ill-------------------------------------------------Denver, Colo-------------------------------------------------Des Moines, Iowa---------------------------------------------Detroit, Mich ------------------------------------------------Dubuque, Iowa------------------------------------------------
Duluth-Superior, Minn.-Wis -----------------------------------Durham, N.C--------------------------------------------------El Paso, Tex-------------------------------------------------Erie, Pa-----------------------------------------------------Eugene, Oreg-------------------------------------------------
Evansville, Ind.-Ky------------------------------------------Fall River-New Bedford, MassI --------------------------------Fargo-Moorhead, N.Dak. -Minn----------------------------------Flint, Mich --------------------------------------------------Fort Lauderdale-Hollywood, Fla-------------------------------
Fort Smith, Ark----------------------------------------------Fort Wayne, Ind----------------------------------------------Fort Worth, Tex----------------------------------------------Fresno, Calif------------------------------------------------Gadsden, Ala-------------------------------------------------
Galveston-Texas City, Tax------------------------------------Gary-Hammond-East Chicago, Ind-------------------------------Grand Rapids, Mich -------------------------------------------Great Falls, Mont --------------------------------------------Green Bay, Wis-----------------------------------------------
Greensboro-High Point, N.C-----------------------------------Greenville, S.C----------------------------------------------Hamilton-Middletown, Ohio------------------------------------Harrisburg, Pa-----------------------------------------------Hartford-New Britain-Bristol, Connl--------------------------
Honolulu, &waii ---------------------------------------------Houston, Tex-------------------------------------------------Huntington-Ashland, W.Va.-Ky.-Ohio ---------------------------Huntsville, Ala----------------------------------------------Indianapolis, Ind--------------------------------------------
Jackson, Mich ------------------------------------------------Jackson, Miss ------------------------------------------------Jacksonville, Fla--------------------------------------------Jersey City, N.J---------------------------------------------Johnstown, Pa------------------------------------------------
Number reporting
Same
b%h
2,4384,241
245398305
1,377312
1,822612
1,351
2291,863
5777,451171
718222427624231
429896165711668
127508
1,000697148
2771,133
749159253
371250366848
1,487
5771,896
515144
1,539
331335784
1,769773
Censusrecordonly
)eathrecordonly
12
;
1
;
i
1
:112
3
16
;
i1
i
1323
2103
i
15
112
225
22
212
;
Net3iffer-encerate
.
-0.20.2
-1.;0.7
-0.3-0.6-0.9-1.4
-:::-0.20.11.2
-0.7
3,i
0.;
0.;
-0.;-0.4
0.80.2
-%$-2.0
0.70.8
-:::-0.8
0.32.0
-;:;
-::;
-::!1,4
0.6
::?
:;:
36

Table 12. Number of matched deaths reporting same standard metropolitan statistical area (SMSA)on both census and death records, on census recorddifference rates for total matched
only, and on death record only; and net, matched at usual place of residence, and not at usual place
of residence: United States, May-August 1960-Con.
[Census record used as a base. Min.s (-) sign indicates more assignments by census than by NCHS. For definition of areas, see Technical Appendix]
Area
Kalamazoo,Mich----------------------------------------------Kansas City, Mo.-Kans ----------------------------------------Kenosha,Wis-------------------------------------------------Knoxville, Term----------------------------------------------Lake Charles, La---------------------------------------------
Lancaster,Pa------------------------------------------------Lansing,Hich------------------------------------------------Laredo,Tex--------------------------------------------------Las Vegas, Nev-----------------------------------------------Lawton, Okla-------------------------------------------------
Lexington,Ky------------------------------------------------Li-, Ohio---------------------------------------------------Lincoln,Nebr------------------------------------------------Little Rock-NorthLittle Rock, Ark---------------------------Lorain-Elyria,Ohio------------------------------------------
Los Angeles-LongBeach, Calif--------------------------------Louisville,Ky.-Ind------------------------------------------Lubbock, Tex-------------------------------------------------Lynchburg, Va------------------------------------------------Macon, &----------------------------------------------------
Madison,Wis-------------------------------------------------Manchester;N.H1--------------------------------------------sMemphis,Tmn------------------------------------------------Miami, Fla---------------------------------------------------Midland, Tex-------------------------------------------------
Milwaukee,Wis-----------------------------------------------Minneapolis-St.Paul, Mien-----------------------------------Mobile, Ala--------------------------------------------------Monroe, b---------------------------------------------------Montgomery,Ala----------------------------------------------
Muncie, Ind--------------------------------------------------Muskegon-MuskegonHeights,Mica ------------------------------Nashville, Term----------------------------------------------Newark,N.J--------------------------------------------------New Haven-Waterbury,Connl-----------------------------------
New Orleans,La----------------------------------------------Newport News-Hampton,Va--------------------------------------New York, N,Y------------------------------------------------Norfolk-Portsmouth,Van--------------------------------------Odessa, Tex--------------------------------------------------
Ogden, Utah--------------------------------------------------OklahomaCity, Okla------------------------------------------Omaha, Nebr.-Iwa --------------------------------------------Orlando,Fla-------------------------------------------------Paterson-Clifton-Passaic,N.J--------------------------------
Pensacola,Fla-----------------------------------------------Peoria$ Ill--------------------------------------------------Philadelphia,Pa.-N.J----------------------------------------Phoenix,Ariz------------------------------------------------Pittsburgh,Pa-----------------------------------------------
Number reporting
Same
b%h
3102,238192573185
60652311819899
279215340391378
13,3211,554
179202332
391443
1,2321,916
61
2,6352,998
509194274
238320736
3,9201,610
2,104335
26,017949101
169871922523
2,529
306599
10,302955
5,645
Censusrecordonly
Deathrecordonly
Netdiffer-enterate
0.1
-1.3
0.i
4.6
-1.4
-!:?-0.3-0.3
R
-?:;0.6
U
-:::
-::i
-::;0.7
-0.;0.10.5
-0.1
-%;
;:;-0.3
-0.3-0.2-0.0
-0.;
37

Table 12. Number of matched deaths reporting same standardmetropolitanstatisticalarea (SMSA)on both census and death records, on census record only, and on death record only; and netdifferencerates for total matched,matched at usual place of residence,and not at usual placeof residence:United States,May-August 1960—Con.
[Censwrecordused as a base. Minus (-) sign indicates mwe assignments by census than by NCHS. For definition of areas, see Technical Appendix]
Area
Pittsfield,liassl--------------------------------------------Portland,~inel ---------------------------------------------Portland,Oreg.-Wash-----------------------------------------providence,R.11---------------------------.-.---------------Provo-Orem,Utah-------------------------------------.-------
Pueblo, Colo-------------------------------------------------Racine,Wis--------------------------------------------------Raleigh,N.C--.----------------------------------------------Reading,Pa--------------------------------------------------Reno, Nev----------------------------------------------------
Richmond,Va-------------------------------------------------Roanoke,Va-------------.------------------------------------Rochester,N.Y-----------------------------------------------Rockford,Ill------------------------------------------------Sacramento,Calif--------------------------------------------
Saginaw,Mich-.------------------------------------------.-.-St. Joseph,Mo-----------------------------------------------St. Louis, Mo.-Ill-------------------------------------------Salt Lake City, Utah-----------------------------------------San Angelo, Tex-------.---------------.-------------------.--
SanAntonio, Tex---------------------------------------------San Bernardino-Riverside-Ontario,Calif----------------------San Diego, Calif---------------------------------------------San Francisco-Oakland,Calif---------------------------------San Jose, Calif------7---------------------------------------
Santa Barbara, Calif-----------------------------------------Savannah,Ga-------------------------------------------------Scranton,Pa-------------------------------------------------Seattle,Wash------------------------------------------------Shreveport,La-----------------------------------------------
Sioux City, Iowa---------------------------------------------Sioux Falls, S.Dak-------------------------------------------South Bend, Ind----------------------------------------------Spokane,Wash------------------------------------------------Springfield,Ill---------------------------------------------
Springfield,Mo----------------------------------------------Springfield,Ohio--------------------------------------------Springfield-Holyoke,WSS1------------------------------------Steubenville-Weirton,Ohio-W.Va------------------------------Stockton,Calif----------------------------------------------
Syracuse,N.Y------------------------------------------------Tacoma, Wash-------------------------------------------------Tampa-St.Petersburg,Fla------------------------------------Terre Haute, Ind---------------------------------------------Texarkana,Tex.-Ark------------------------------------------
Toledo, Ohio-------------------------------------------------Topeka, Kans-------------------------------------------------Trenton,N.J-------------------------------------------------Tucson,Ariz--------------------------------------------------Tulsa, Okla--------------------------------------------------
Number reporting
Same
b%h
403459
1,9681,809168
228283266804150
814309
1,447:;;
422233
4,579613109
1,0971,4951,5715,8921,015
323390756
2,160544
269167508612434
270298
1,300383496
1,333594
2,303328154
1,074274627433823
Censusrecordonly
Deathrecordonly
Netiiffer-encerate
-0,;
-0.;-0,6
-2.1.
-oei
-0.2
-::!-0.21.1
0,2
-0,;
0.;
-0.1-0.4-0.6
-;::
-:::
-M-0.4
0.7
-0.22.1
0.40.70.20.80.2
-0.;0.2
-1,;
0.5
0.;0.50.l
38
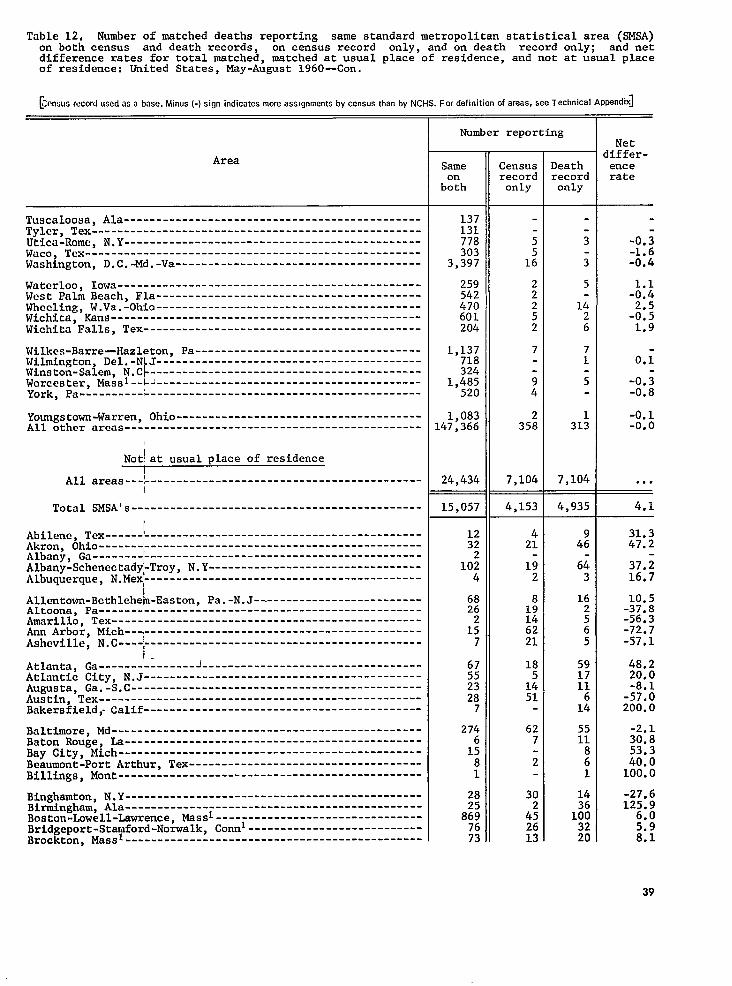
Table 12. Number of matched deaths reporting same standardmetropolitanstatisticalarea (SMSA)on both census and death records, on census record only, and on death record only; and netdifferencerates for total matched, matched at usual place of residence,and not at usual placeof residence:United States,May-August 1960-Con.
[&n~USr~~ordusedasabass.MinUS{-)ekmindicstesmore=sumrnentsbycsmwsthanW NCHS. For defi~tion of are=, =e TeCh~cal Appendix]
Area
Tuscaloosa,Ala----------------------------------------------Tyler, Tex---------------------------------------------------Utica-Rome,N.Y----------------------------------------------Waco, Tex----------------------------------------------------Washington,D.C.-Md.-Va--------------------------------------
Waterloo, Iowa-----------------------------------------------West Palm Beach, Fla-----------------------------------------Wheeling,W.Va.-Ohio-----------------------------------------Wichita, &ns------------------------------------------------Wichita Falls, Tex-------------------------------------------
Wilkes-Barre-Hazleton,Pa-----------------------------------Wilmington,Del.-N J-----------------------------------------
1Winston-Salem,N.C ------------------------------------------Worcester,Massl-- J-----------------------------------------York, Pa-----------------------------------------------------
Youngstown-Warren,Ohio--------------------------------------All other areas----------------------------------------------
Nottat usual place of residenceI
All areas-----------------------------------------------
Total WSA's ---------------------------------------------
Abilene, Tex--------------------------------------------------Akron, Ohio-------y------------------------------------------Albany, Ga---------------------------------------------------Albany-Schenectady’-Troy,N.Y---------------------------------Albuquerque,N.Mext-------------------------------------------
Allentown-Bethlehe~-Easton,Pa.-N.J--------------------------Altoona, Pa--------------------------------------------------Amarillo,Tex------------------------------------------------Ann Arbor, Mich----------------------------------------------Asheville,N.C-----------------------------------------------
Atlanta, Ga--------------------------------------------------Atlantic City, N.J-------------------------------------------Augusta, Ga.-S.C---------------------------------------------Austin, Tex--------------------------------------------------Bakersfield<Calif-------------------------------------------
Baltimore,Md------------------------------------------------Baton Rouge, La----------------------------------------------Bay City, Mich-----------------------------------------------Beaumont-PortArthur, Tax------------------------------------Billings,Mont-----------------------------------------------
Binghasnton,N.Y----------------------------------------------Birmingham,Ala----------------------------------------------Boston-Lowell-Lawrence,Massl--------------------------------Bridgeport-Stamford-Norwalk,Connl---------------------------Brockton,tiss1----------------------------------------------
Number reporting
Same
b%h
137131778303
3,397
259542470601204
1,137718324
1,485520
1,083147,366
24,434
15,057
1232
1024
6826
1;7
675523287
272
1581
28
8%7673
Censusrecordonly
;
d22252
7
i4
2358
7,104
4,153
421
1;2
819146221
1851451
627
i
30
4;
::
Deathrecordonly
4,935
4:
6i3
162565
591711614
5511
:1
14
1%3220
Netdiffer-enterate
-0.i-1.6-0.4
-;::
-;:;1.9
O.i
-0.;-0.8
-0.1-0.0
...
4.1
31.347.2
37.i16.7
10.5-37.8-56.3-72.7-57.1
48.220.0-8.1-57.0200.0
-2.130.853.340.0100.0
-27.6125.96.05.98.1
39

Table 12. Number of matched deaths reporting same standard metropolitan statistical area (SMSA)on both census and death records, on census record only, and on death record only; and netdifference rates for total matched, matched at usual place of residence, and ~ot at usual placeof residence: United States, May-August 1960-Con.
&ensus record used as a b~,e. Minus (-) sign indicates mere assignments by census than by NCFIS. For definition of areaa, see Technical Awsndt~
Area
Brownsville-Harlingen-San Benito, Tax------------------------Buffalo, N.Y-------------------------------------------------Canton, Ohio-------------------------------------------------Cedar Rapids, Iowa-------------------------------------------Champaign-Urbana, 111----------------------------------- -----
Charleston, S.C----------------------------------------------Charleston, W.Va ---------------------------------------------Charlotte, N.C------ -----------------------------------------Chattanooga, Term. .Ga~---------------------------------------Chicago, Ill-------------------------------------------------
Cincinnati, Ohio-Ky ------------------------------------------Cleveland, Ohio----------------------------------------------Colorado Springs, Colo---------------------------------------Columbia, S.C------------------------------------------------Columbus, Ga.-Ala--------------------------------------------
cOhlmbUS, Ohio -----------------------------------------------Corpus Christi, Tex------------------------------------------Dallas, Tex--------------------------------------------------Davenport-Rock Island-Moline, Iowa-Ill-----------------------Dayton, Ohio-------------------------------------------------
Decatur, Ill-------------------------------------------------Denver, Colo-------------------------------------------------Des Moines, Iowa---------------------------------------------Detroit, Mich ------------------------------------------------Dubuque, Iowa------------------------------------------------
Duluth-Superior, Minn.-Wis ---------------.-------------------Durham, N.C ------------------------.-------------------------El Paso, Tex-------------------------------------------------Erie, Pa-----------------------------------------------------Eugene, Oreg-------------------------------------------------
Evansville, Ind.-Ky------------------------------------------Fall River-New Bedford, MassI --------------------------------Fargo-Moorhead, N.Dak. -Minn----------------------------------Flint, Mich --------------------------------------------------Fort Lauderdale-Hollywood, Fla-------------------------------
Fort Smith, Ark -----------------------------------------------Fort Wayne, Ind----------------------------------------------Fort Worth, Tex----------------------------------------------Fresno, Calif------------------------------------------------Gadsden, Ala-------------------------------------------------
Galveston-Texas City, Tax------------------------------------Gary-Hammond-East Chicago, Ind-------------------------------Grand Rapids, Mich -------------------------------------------Great Falla, Mont --------------------------------------------Green Bay, Wis -----------------------------------------------
Greensboro-High Point, N.C-----------------------------------Greenville, S.C----------------------------------------------Hamilton-Middletown, Ohio------------------------------------Harrisburg, Pa-----------------------------------------------Hartford-New Britain-Bristol, Connl--------------------------
Number reporting
Same
b%h
23;501412
61411
8;;
256165
3;4
113
5i
1:;
8
Z39715
23
12257
1:$5
3:
1325182
3;5921
?;343764
Censusrecordonly
4:40
1
i
;73
23
1:LL75
30
2:
::
2:
2;23
8153
-1912-6
2;..----~5231417
3
3i55
11
3i11
~eathrecordonly
4;4212
11
!
33!
:!19
1:
H51109
6;181302
3411
2:7
1:13144
2:26103
12251;
11
8
;
H
Netdiffer-encerate
15.4
+:;
84:6
183.337.5
18.;28.9
4Hi46.2-77.5122.2
-4.9120.032.9-29.5-18.9
-7.746.537.025.5-55.3
83.91,000.0
6;:;100.0
-56.7-1.863.643.8-32.1
-60.0
3:;:47.4-44.4
225.075.8-18.3-7.7
120,0
-9.436.820.6-26.737.3
40
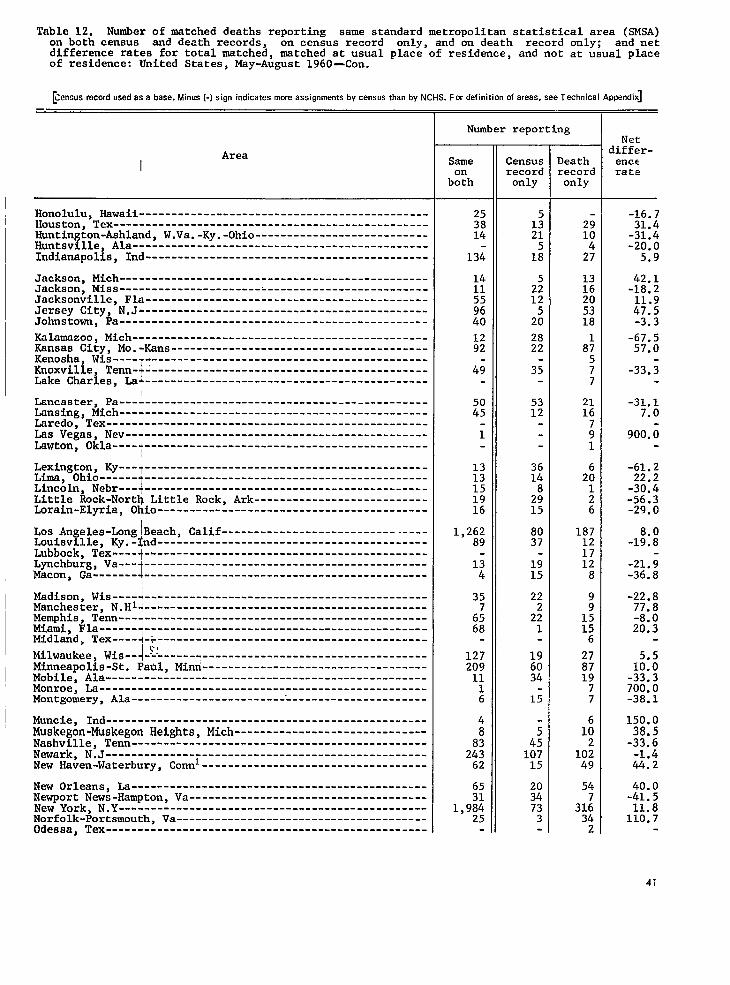
Table 12. Number of matched deaths reporting same standardmetropolitanstatisticalarea (SMSA)on both census and death records, on census record only, and on death record only; and netdifferencerates for total matched,matched at usual place of residence,and not at usual placeof residence:United States,May-August 1960-Con.
~enws record used as a base. Minus (-) sign indicates rwe asaignrnenta by census than by NCHS. For definition of areaa, see Technical Appendix]
AreaI
Honolulu,&waii ---------------------------------------------Houston,Tex-------------------------------------------------Huntington-Ashland,W.Va.-Ky.-Ohio---------------------------Huntsville,Ala----------------------------------------------Indianapolis,Ind--------------------------------------------
Jackson,Mich------------------------------------------------Jackson,Miss------------------------------------------------Jacksonville,Fla--------------------------------------------Jersey City, N.J---------------------------------------------Johnstown,Pa------------------------------------------------
Kalamazoo,Mich----------------------------------------------Kansas City, Mo.+ans----------------------------------------Kenosha,Wis-------------------------------------------------Knoxville,Term----------------------------------------------Lake Charles,Lai--------------------------------------------
Lancaster,Pa------------------------------------------------Lansing,Mich------------------------------------------------Laredo,Tex--------------------------------------------------Las Vegas, Nev-----------------------------------------------Lawton, Okla----'--------------------------------------------
TLexington,Ky---T--------------------------------------------Lima, Ohio------
1--------------------------------------------
Lincoln,Nebr---,--------------------------------------------Little Rock-Nort$Little Rock, Ark---------------------------Lorain-Elyria,Ohio------------------------------------------
Los An eles-LongBeach, Calif--------------------------------f’Louisv he, Ky.-$nd------------------------------------------
Lubbock,Tex----+--------------------------------------------Lynchburg,Va---+--------------------------------------------Macon, Ga-------4--------------------------------------------
Madison,Wis----l--------------------------------------------Manchester,N,Hl~--------------------------------------------Memphis, Tenn---:--------------------------------------------Miami, Fla---------------------------------------------------Midland, Tex----~<r------------------------------------------
Milwaukee,Wis--IJ’------------------------------------------Minneapolis-St.Patil,Mien-----------------------------------Mobile, Ala--------------------------------------------------Monroe, k---------------------------------------------------Montgomery,Ala----------------------------------------------
Muncie, Ind--------------------------------------------------Muskegon-MuskegonHeights,Mica------------------------------Nashville,Term----------------------------------------------Newark, N.J--------------------------------------------------New Haven-Waterbury,Connl-----------------------------------
New Orleans,La----------------------------------------------Newport News-Hampton,Va-------------------------------------New York, N.Y------------------------------------------------Norfolk-Portsmouth,Van--------------------------------------Odessa, Tex--------------------------------------------------
Number reporting
Same
b%h
253814
13i
141155
%
;:
4;
::
i
::151916
1,26289
134
357
%
1272091116
48
2::62
2:1,984
25
Censusrecordonly
1:21518
2:12
2:
2822
3;
?2
36148
?;
%
1915
22
2;1
196034
15
i4510715
2034733
Deathrecordonly
::
2;
1316205318
8;577
2116
;1
2:1
:
1871217128
9
1?156
27871977
1:2
10249
54
31:342
Netdiffer-encerate
-16.731.4-31.4-20.05.9
42.1-18.211.9:;.;
.
-67.557.0
-33.;
-31.17.0
900.i
-61.222.2-30.4-56.3-29.0
8.0-19.8
-21.9-36.8
-22.877.8-8.020.3
1;:;-33.3700.0-38.1
150.038.5-33.6-1.444.2
40.0-41.511.8110.7
41

Table 12. Number of matched deaths reporting same standard metropolitan statistical area (SMSA)on both census and death records, on census record only, and on death record only; and netdifference rates for total matched, matched at usual place of residence, and not at usual placeof residence: United States, May-August, 1960-Con. 71
&mus record used as a base. Minus (-) sign indicates more assignments by census than by NCHS. For &finition of areas, see Technical Appsndi~
Area
Ogden, Utah--------------------------------------------------Oklahoma City, Okla------------------------------------------Omaha, Nebr. -Iowa--------------------------------------------Orlando, Fla-------------------------------------------------Paterson-Clifton-Passaic, N.J--------------------------------
Pensacola, Fla-----------------------------------------------Peoria, Ill--------------------------------------------------Philadelphia, Pa.-N.J----------------------------------------Phoenix, Ariz ------------------------------------------------Pittsburgh, Pa-----------------------------------------------
Pittsfield, MSssl --------------------------------------------Portland, tiinel ---------------------------------------------Portland, Oreg.-Wash-----------------------------------------Providence, R.Il---------------------------------------------Provo-Orem, Utah---------------------------------------------
Pueblo, Colo-------------------------------------------------Racine, Wis--------------------------------------------------Raleigh, N.C-------------------------------------------------Reading, Pa--------------------------------------------------Reno, Nev----------------------------------------------------
Richmond, Va--J ----------------------------------------------Roanoke, Va--------------------------------------------------Rochester, N.Y-----------------------------------------------Rockford, Ill------------------------------------------------Sacramento, Calif--------------------------------------------
Saginaw, Mich ------------------------------------------------St. Joseph, Mo-----------------------------------------------St. Louis, Mo.-Ill -------------------------------------------Salt Lake City, Utah-----------------------------------------San Angelo, Tex----------------------------------------------
San Antonio, Tex---------------------------------------------San Bernardino-Riverside-Ontario, Calif----------------------San Diego, Calif---------------------------------------------San Francisco-Oakland, Calif---------------------------------San Jose, Calif----------------------------------------------
Santa Barbara, Calif-----------------------------------------Savannah, Ga-------------------------------------------------Scranton, Pa-------------------------------------------------Seattle, Wash ------------------------------------------------Shreveport, La-----------------------------------------------
Sioux City, Iowa---------------------------------------------Sioux Falls, S.Dak-------------------------------------------South Bend, Ind----------------------------------------------Spokane, Wash------------------------------------------------"Springfield, Ill---------------------------------------------
Springfield, Me----------------------------------------------Springfield, Ohio--------------------------------------------Springfield-Holyoke, Massl -----------------------------------Steubenville-Weirton, Ohio-W.Va------------------------------Stockton, Calif----------------------------------------------
Number reporting
Same Censusrecordonly
Deathrecordonly
Netdiffer-enterate
27.3-43,5
5?;
700,0-44.8
-2?:0.2
19.093.319.9
-7::;
-85.7-10.6-65.9-30.3-69.0
34.3-54.2
3;:?86.7
41.2-53.63.9
1:::
-42.9-12.211.552.1-51.I.
100.0144.4
3;::-13.0
17.142.927.6-22,040.0
-7.4-31.0-;I..;
-32:8
42

Table 12. Number of matched,deaths reporting same standardmetropolitanstatisticalarea (SMSA)on both census and death records, on census record only, and on death record only; and netdifferencerates for totalmatched,matched at usual place of residence,and not at usual placeof residence:United States,May-August1960-Con.
~ensus record used as a base, Minus (-) sign indicates mwe assignments by census than by NCHS. For definition of areas, see Technical Appendix]
IArea
Syracuse,N.Y------------------------------------------------Tacoma, Wash-------------------------------------------------Tampa-St.Petersburg,Fla------------------------------------Terre Haute, Ind---------------------------------------------Texarkana,Tex.-Ark------------------------------------------
Toledo, Ohio-------------------------------------------------Topeka, Kas-------------------------------------------------Trenton, N.J-------------------------------------------------Tucson, Ariz-------------------------------------------------Tulsa, Okla--------------------------------------------------
Tuscaloosa,Ala----------------------------------------------Tyler, Tex---------------------------------------------------Utica-Rome,N.Y---F~-----------------------------------------Waco, Tex---------,-T-----------------------------------------Washington,D.C.-Md.-Va---------------------------------------
Waterloo, Iowa---------.........-----------------------------West Palm Beach, Fla-----------------------------------------Wheeling,W.Va.-Ohio-----------------------------------------Wichita, Kans..-.7--------------------------------------------Wichita Falls, Teh-------------------------------------------
jWilkes-Barre—Ha leton, Pa-----------------------------------Wilmington,Del. N.J----------------------------------------.-Winston-Salem,N.\C-------------------------------------------Worcester,Massl~--------------------------------------------York, Pa-----------------------------------------------------
Youngstown-Warren, Ohio--------------------------------------All other areas----------------------------------------------
lMetropolitan~Stateeconomicareas.
Number reporting
Same
b%h
1176413717
6726371217
61294
2:;
2;30
1:
3138
16;25
9,3;?
Censusrecordonly
1777332
2329
;:7
8723117
i;
66
;53
1125
8;4
52,951
Deathrecordonly
60625814
19714
3;
115
i:
::141
1231
1;33
302,169
Netdiffer-enterate
32.1-50.4-4.7
200.0200.0
-4.4-40.0-20.3-43.5108.3
-92.5-62.9-53.1-:;.;
.
-54.518.5128.1400.0-81.3
2.49.5
-25.;100.0
65.8-6.3
‘- \
. .
43

Table 13. Number of matched deaths reportingsame standardmetropolitan statistical area (SMSA)on bothcensus and death records, censusrecord only, and death record only;United States,May-August 1960
snd net differencerates, by color:
~Cens.Srecordused as a base. Minus (-) sign indicates more asslgmnents by census than by NCHS. For definition of areas, see Technical +jppendn~
White Nonwhite
Number reportingNumber reportingArea Net
differ-encerste
Netdiffer-encerate
Same
b%h
Censusrecordonly
Deathrecordonly
Same
b%h
Censwrecorconly
Desthrecordonly
All areas--------------------------366.216 7,308
4,341
7,308—
5,056
42,57! 72:. . . . . .
0.4Total SMSA’S-------------------------226,877 0.: 26,521 39!
Abilene, Tax-----------------------------Akron, Ohio ------------------------------Albany, Ga-------------------------------Albany-Schenectady-Troy, N .Y-------------Albuquerque, N. Mex----------------------Allentown-Beth lehem-Easton, Pa.-N.J------
168981
1,7;?342
1,375
400195275227
1,331
443218280417
3,002
204222403132508
6788>4381,462;;:
3,272718240185176
391254376
13,4892,338
3,854235304195
1,287
2881,559617
1,285224
1,866593
6,{:$
735
2,52.11.63.1-0.:0.2
-4.0-3.3-16.3-4.52.3
-;:;-10.9
$:
:::1.0
-!:2
:::0.5
::;
-0.2-3.5
i:;3.4
-;::
i::-0.3
i::-19.4
-;:;
1.4
-::;-1.9-0.9
1.92.5
-::;.
::613;2C
i
1212
5?;
J:49
8;;
152
13:
1:
51018651133
1:;
:117
1$:132
1,853332
527
12i114191
3:;
1::13
60
1,0::
i
1.;
2.;
-12::
-6.;-22.2-11.61.4
1:$-21.9
-;:2
0.6
4.i
$:;-1.9-6.7
-%:
0.;
2.51.3
1.;1.2
1.9
-29.;
-;::
2.;
-[:;15.4
8,24.31.8
Altoona, Pa------------------------------Amarillo, Tax----------------------------Ann Arbor, Mica --------------------------Asheville,N.C---------------------------Atlsnta,Ga------------------------------
Atlantic City, N.J-----------------------Augusta, Ga.-S.C-------------------------Austin, Tax------------------------------Bakersfield, Calif -----------------------Baltimore, Ma----------------------------
Baton Rouge? Lo--------------------------Bay City, Mlch ---------------------------Beaumont-Port Arthur, Tex----------------Billings,Mont---------------------------Binghamton,N.Y--------------------------
Birmingham, Ala--------------------------Boston-Lowell-Lawrence, Maasl ------------Bridgeport- Stamford-Norwalk, Connl-------Brockton,Maaal--------------------------Brownsville-Harlingen-SanBenito,Tex----
BuffalojN.Y-----------------------------Canton,Ohio-----------------------------Cedar Rapida, Iowa-----------------------Champaign-Urbana,111--------------------Charleston,S.C--------------------------
Charleston, W. Va------------------------Charlotte, N.C---------------------------Chattanooga, Term. -Ga--------------------Chicago, Ill-----------------------------Cincinnati, Ohio-Ky ----------------------
Cleveland, Ohio --------------------------Colorado Springs, Cola -------------------Columbia, S.C----------------------------Columbus, Ga.-Ala------------------------Columbus, Ohio ---------------------------
Corpus Christi, Tax----------------------Dallas, Tax------------------------------Davenport-Rock Island-Moline, Iowa- 111---Dayton, Ohio -----------------------------Decatur, Ill------- -------------------- .-
Denver, Cola -----------------------------Des Moines, Iowa-------------------------Detroit,Mica----------------------------Dubuque,Iowa----------------------------Duluth-Superior,Minn.-Wis---------------
See footnote at end of table.44
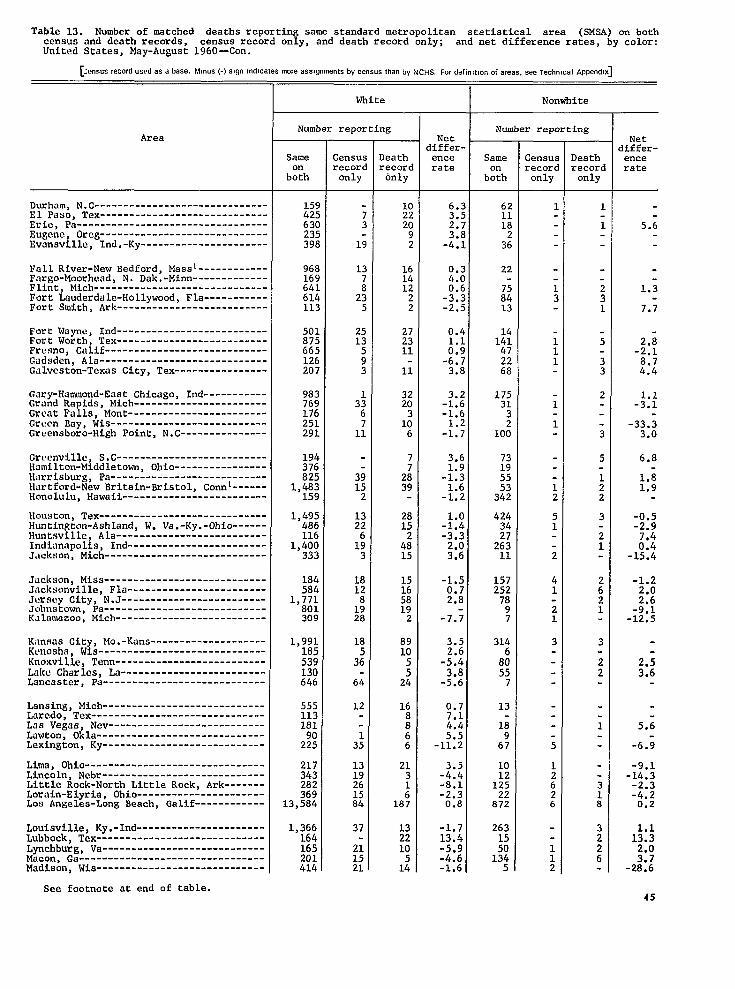
Table 13. Number of matched deathsreportingsame standardmetropolitan statistical area (SMSA)on bothcensus and death records, census record only, and death record only;United States,May-August1960—Con.
and net differencerates, by color:
[;I?.sw record used a% a bm.e. M8.us (-) SWn mdmates mm .Swqmmnts by . ..s.s than by NCHS. For defi.,tmn of areas, see Techmcal Ammndm]
Area
Durham,N. C------------------------------!?,1Paso, Tax-----------------------------Eria, Pa---------------------------------Eugene, Oreg-----------------------------Evansville,Ind.-Ky----------------------
Fall River-NewBedford,Maaal------------Fargo-Moorhead,N. Dak.-Mien-------------Flint, Mica------------------------------Fort Lauderdale-Hollywood,Fla-----------Fort Smith, Ark--------------------------
Fort Wayne, Ind--------------------------Fort Worth, Tax--------------------------Fresno, Calif----------------------------Gadsden,Ala-----------------------------Galveston-TexaaCity, Tex----------------
Gary-Hammond-EastChicago,Ind-----------Grand Rapids,Mica-----------------------Great Falls, Mont------------------------Grcwn Bay, Was---------------------------Greensboro-HighPoint,N.C---------------
Greenville,SAC--------------------------Hamilton-Middletown,Ohio----------------Harrisburg,Pa---------------------------Hartford-NewBritain-Bristol,Connl------Honolulu,Hawaii-------------------------
Houston,Tax-----------------------------Huntington-Ashland,W. Va.-Ky.-Ohio------Huntsville,Ala--------------------------Indianapolis,Ind------------------------Jackson,Mica----------------------------
Jackson,Miss----------------------------Jacksonville,Fla------------------------Jersey City, N.J-------------------------Johnstown,Pa----------------------------K~lamazoo,Mica --------------------------
Kansas City, Mo.-Kans--------------------Kenosha,Was-----------------------------Knoxville,Term--------------------------Lake Charles,La-------------------------Lancaster,Pa----------------------------
Lansing,Mica----------------------------Laredo,Tax------------------------------Las Vegas, Net---------------------------Lswton, Okra-----------------------------Lexington,Ky----------------------------
Lima, Ohio-------------------------------Lincoln,Near----------------------------Little Rock-NorthLittle Rock, Ark-------Lorain-Elyria,Ohio----------------------Los Angeles-LongBeach, Qalif------------
Louiaville,Ky.-Ind----------------------Lubbock,Tax-----------------------------Lynchburg,Va----------------------------Macon, Ga--------------------------------Madison,Wi.a-----------------------------
See footnoteat end of table.
White
Number reporting
Same
b%h
15s42:63(23:39[
96E16564]61411:
50187566212620i
983769176251291
194376825
1,483159
1,495486116
1,400333
184584
1,771801309
1,991185539130646
555113181
2;;
217343282369
13,584
1,366164165201414
Censu:recor<only
Deathrecordonly
;;2092
16141222
272311
li
3220
1:6
7
2;39
2815
4:15
:;;;
2
891:
524
16
:66
213
:187
132210
12
Netdiffer-encerate
6.:3.:2.;
-::;
0.:4.C0.6-3.2-2.:
0.41.1
j:;
3.8
-?::-1.61.2
-1.7
3.6
-i:?
-i::
-;::-3.3
:::
-1.50.72.8
-7.;
3.5
.:::
-5:6
0.7
;::5.5
-11.2
-:::-8.1-2.30.8
-1.713.4-5.9-4.6-1.6
Nonwhite
Number reporting
Same
b;h
6;111[
3:
2:
7!811:
1:4;256t
17:31
;10C
:;55
3:;
42434
2:;11
1572527897
314
8:557
13
1;
6?
10
1:$22
872
263
;;1345
Deathrecorconly
Netdiffer-encerate
5.;
1.3
7.7
-::;
:::
-;:;
-33.33.0
6.8
l.i1.9
-0.5-2.97.4
-1::2
-;.:.
-;::-12.5
2.;3.6
5.;
-6.;
-9.1-14.3-2.3-4.2
0.2
1;::
;:;-28.6
45

Table 13. Number of matched deaths reportingsame standardmetropolitan statistical area (WSA) on bothcensusand death records, censusrecord only, and death record only;United States,May-August 1960—Con.
and net differenceratea, by color:
[Census record used as a base. M!nus (-) s,~nindicatesmoveassiqnmem by ..”s.s thm by NCHS. For dafiniticm of areas, see Techmcal Append!xl
Area
Manchester,N.H--------------------------Memphis,Term----------------------------Miami.,Fla-------------------------------Midland,Tax-----------------------------Milwaukee,Was---------------------------
Minneapolis-St.Paul, Minn---------------Mobile, Ala------------------------------Monroe, La-------------------------------Montgomery,Ala--------------------------Muncie, Ind------------------------------
Muskegon-MuskegonHeights,Mich----------NashvillejTerm--------------------------Newark,N.J------------------------------New Haven-Waterbury,Connl---------------New Orleans,La--------------------------
NewportNews-Hampton,Va-----------------New York, N.Y----------------------------Norfolk-Portsmouth,Va-------------------Odeaaa,Tax------------------------------Ogden, Utah------------------------------
OklahomaCity, Okra----------------------Omaha,Nebr.-Iowa------------------------Orlando,Fla-----------------------------Pateraon-Clifton-Passaic,N..J------------Pensacola,Fla---------------------------
Peoria,111------------------------------Philadelphia,Pa.-N.J--------------------Phoenix,Aria----------------------------Pittsburgh,Pa---------------------------Pittsfield,MassI------------------------
Portland,MaineI-------------------------Portland,Oreg.-Wash---------------------Providence,R.ll-------------------------Provo-Orem,Utah-------------------------Pueblo, Cola-----------------------------
Racine,Was------------------------------Raleigh,N.C-----------------------------Reading, Pa------------------------------Reno, Net--------------------------------Richmond,Va-----------------------------
Roanoke, Va------------------------------Rochester,N.Y---------------------------Rockford, 111----------------------------Sacramento,Calif------------------------Saginaw,Mica----------------------------
St. Joseph,Me---------------------------St. Louis, Mo.-Iii-----------------------Salt Lake City, Utah---------------------San Angelo, Tax--------------------------San Antonio,Tax-------------------------
San Bernardino-Riverside-Ontario,Calif--San Diego, Calif-------------------------San Franciaco-Oakland,Calif-------------San Jose, Calif--------------------------Santa Barbara,Calif---------------------
White
Number reporting
Sameonboth
45C762
1,75157
2,659
3,113327g22?
293589
3,6741,6041,468
24425,332
658
1%
809893463
2,516229
6129,336924
5,571409
457;,;3;
‘179239
;;:
835148624
2651,588451848406
2494,125640104
1,050
1,5091,6015,7031,:;;
Censusrecorc
only
Deathrecord
only
Netdiffer-encerate
2.0-0.5
1;:;0.4
0.85.2
-::!2.7
-i:;-0.12.51.4
-8.20.92.4
M
-4.9
:::2.12.2
-6.5
-H
1.;
2.61.9
-1:::-29.2
-1.2-14.7-2.8-11.80.2
-7.0-0.11.55.82.0
-12.50.00.8
-::;
-0.80.4
-H‘2.8
Nonwhite
Number reporting
Sameonboth
Censusrecordonly
Deathrecordonly
i6
;
:
;8
2:
2:15
33
:2
1;21
i
1;
21
i
;
i5
i10
Netdiffer-encerate
-100.0-0.42.4
-1.:
-14.;
;:2
-H0.2
R
-3.1.
;::
;:;
5:11.3
-;.;.
-0.;
-z.i
-100.:-45.5
-11.13.1
4.i
-5.5
-::!1.9
-7.10.4
10.63.0
-5.11.3
-:::
See footnoteat end of table.46
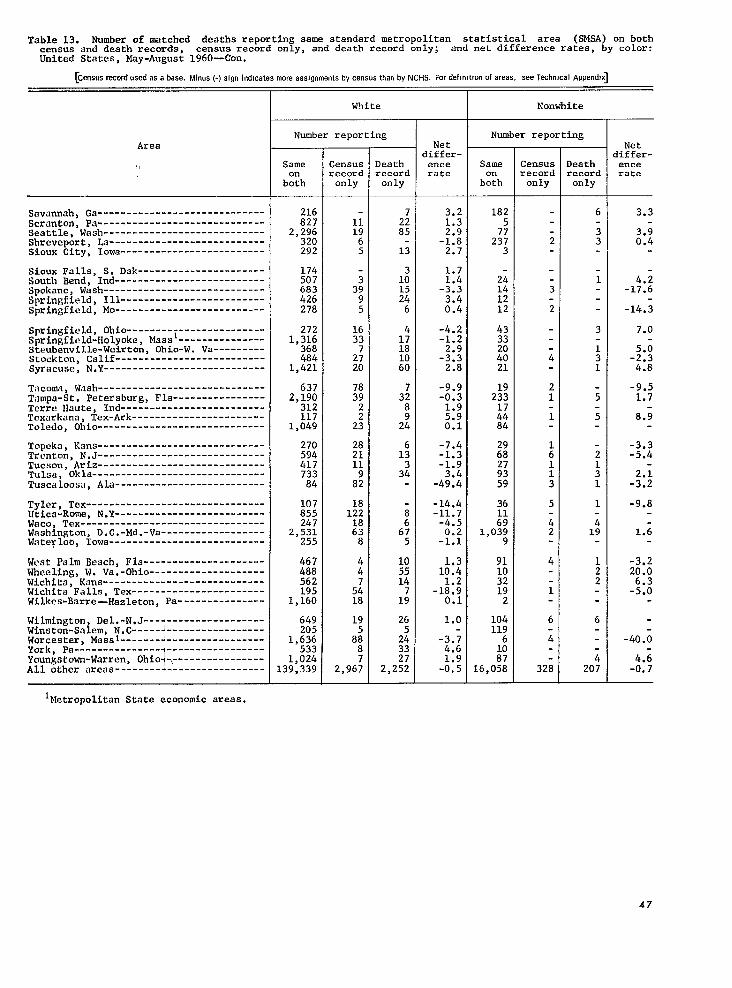
Table 13. Number of matched deaths reportingsame standardmetropolitan statistical area (SMSA)on bothcensus and death records, census record only, and death record only; and net difference rates, by color:United Statea, May-August 1960—Con.
[CmSu5~0rdu5d asabse. Min,s(-)signind!catesmoreassignmenlsbyce"s.sthanbyNCHS.Fordef!n!tlonofareas.seeTeshn,calAppend!~
Area
i,
Savannah,Ga-----------------------------Scranton,Pa-----------------------------Seattle,Wash----------------------------Shreveport,La---------------------------Sioux City, Iowa-------------------------
Sioux Falls, S. Dab----------------------South Bend, Ind--------------------------Spokane,Wuah----------------------------Springfield,Ill-------------------------Springfield,Me--------------------------
Springfield,Ohio--------i---------------Springfield-Holyeke, Masa ---------------Steubenville-Weirton,Ohio-W.Va---------Stockton,Calif--------------------------Syracuse,N.Y----------------------------
Tacoma,Wash-----------------------------Tampa-St.Petersburg,Fla----------------Terre Haute, Ind-------------------------Texarkana,Tex-Ark-----------------------Toledo, Ohio-----------------------------
Topcko,Kens-----------------------------Trenton,N.J-----------------------------Tucson,Aria-----------------------------Tulsa, Okra------------------------------Tuscaloosa,Ala--------------------------
Tyler, Tax-------------------------------Utica-Rome,N.Y--------------------------Waco, Tax--------------------------------Washington,D.C.-Md.-Va------------------Wateploo,Iowa---------------------------
West Palm Beach,Fla---------------------Wheeling,W. Vs.-Ohio--------------------Wichita,Kens----------------------------Wichita Falls, Tax-----------------------Wilkes-Barre-Hazleton, Pa---------------
Wilmington,Del.-N.J---------------------Winston-Salem,N.C-----J-----------------Worcester,Masai-------------------------York, Pa---------------Youngstown-Warren,Ohio?~,~lIzlI=~~~~==~==All other areas--------+-----------------
White
Number reporting
Same
b:h
216827
2,296320292
17450768342627’8
2721,316368484
1,421
6372,190312117
1,049
27059441773384
107855247
2,531255
467488562195
1,160
649205
1,636533
1,024139,339
Censusrecordonly
)eathrecordonly
Netdiffer-encerate
3.21.3
-:::2.7
1.71.4
-3.3
;::
-4.2-1.2
-::?2.8
-9.9-0.31.9
:::
-7.4-1.3-1.9
-4;::
-14.4-11.7-4.5
-;::
1;:2
-ii:;0.1
1.0
-3.;4.6
-;:;
Nonwhite
Number reporting
b%h
Censusrecordonly
Deathrecordonly
Net3iffer-encerate
3.3-
::?
4.i-17.6
-14.3
7.0.
-;:!4.8
-9.51.7
8.;
-3.3-5.4
-$;
-9.8
1.;
;;.:.
-;:2
-40.6
4.;-0.7
lMetxopOlitan State econOmic areas.
47
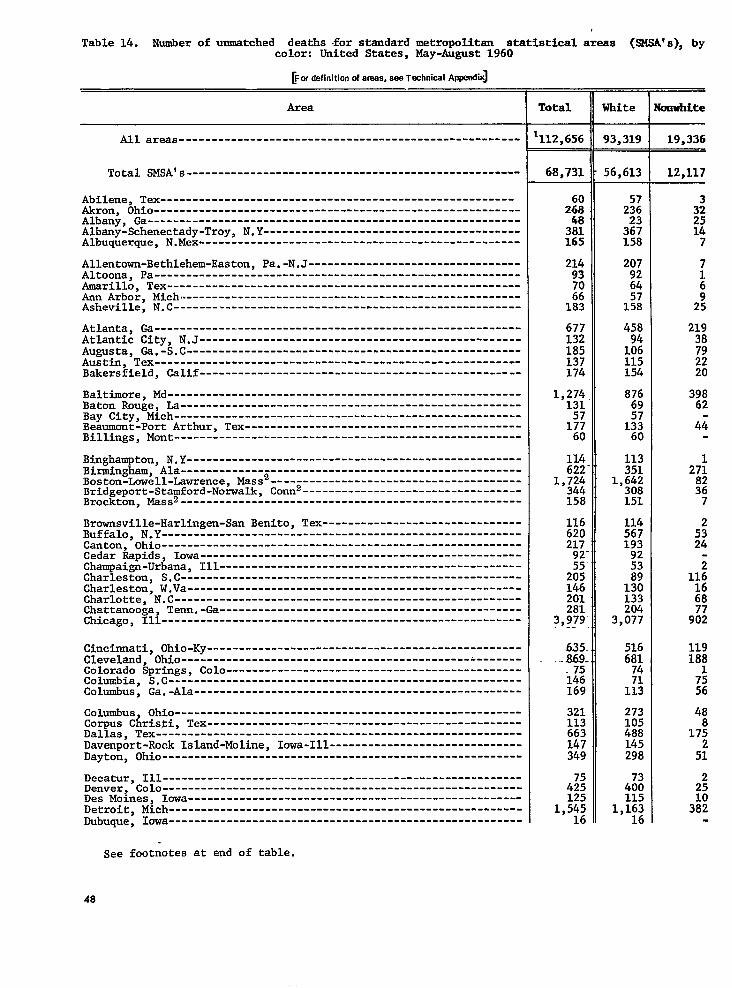
Table 14. Number of unmatched deaths for standard metrowlitan statistical areas (sMsA’s). bv-..color: United States, May-A&gust 1960
~crdefinitionofwsas,sae TschnicalAppsndix]
Area
All areas-----------------------------------------------------
Total SMSA’S----------------------------------------------------
Abilene, Tex-------------------------------------------------------Akron, Ohio---------------------------------------------------------Albany, &----------------------------------------------------------Albany-Schenectady-Troy, N.Y----------------------------------------Albuquerque, N.Flex--”-----------------------------------------------
Allentown-Bethlehem-Easton, Pa.-N.J---------------------------------Altoona, Pa---------------------------------------------------------Amarillo, Tex-------------------------------------------------------Ann Arbor, Mich=-----------------------------------------------------Asheville, N.C-------=----------------------------------------------
Atlanta, &---------------------------------------------------------Atlantic City, N.J--------------------------------------------------Augusta, Ca.-S.C----------------------------------------------------Austin, Tex---------------------------------------------------------Bakersfield, Calif--------------------------------------------------
Baltimore, Md-------------------------------------------------------Baton Rouge, k-----------------------------------------------------Bay City, Mich ------------------------------------------------------Beaumont-Port Arthur, Tex-------------------------------------------Billings, Mont ------------------------------------------------------
Binghampton, N.Y--------------------------- -------------------------Birmingham, Ala-------------;---------------------------------------Boston-Lowell-Lawrence, Mass ---------------------------------------Bridgeport-Stamford-Norwalk, Conn2----------------------------------Brockton, ~ss2-----------------------------------------------------
Brownsville-Harlingen-San Benito, Tax-------------------------------Buffalo, N.Y--------------------------------------------------------Canton, Ohio--------------------------------------------------------Cedar Rapids, Iowa-----.--------------------------------------------Champaign-Urbana, 111-----------------------------------------------Charleston, S.C-----------------------------------------------------Charleston, W.Va ----------------------------------------------------Charlotte, N.C------------------------------------------------------Chattanooga, T=n.-Ga -----------------------------------------------Chicago, Ill--------------------------------------------------------
Cincinnati, Ohio-Ky-------------------------------------------------Cleveland, Ohio---------------------------------------------`-------Colorado Springs, Colo----------------------------------------------Colunbia, S.C-------------------------------------------------------Columbus, Ga.-Ala---------------------------------------------------
Columbus, Ohio------------------------------------------------------Corpus ChrisSi, Tex-------------------------------------------------Dallas, Tex ----------------------------------------c----------------Davenport-Rock Island-Moline, Iowa-Ill------------------------------Dayton, Ohio--------------------------------------------------------
Decatur, Ill--------------------------------------------------------Denver? Colo--------------------------------------------------------Des Moznes, Ima----------------------------------------------------Detroit, Mich -------------.--------------------.-----------.--------
Dubuque, Iowa-------------------------------------------------------
Total
‘112,656
68,731
2$
3%!165
677132185137174
1,274131
1;;60
11662021792”55”205146201281
3,979-.-.
-635.- y5.
146169
321113663147349
4;;125
1,54516
White
93,319
56,613
2::
32;158
2079264
45894106115154
876695713360
113351
1,642308151
114567193925389130133204
3,077
51668174
1$
273105488145298
4;;115
1,16316
Ionuhite
19,336
12,117
3:25147
21938792220
39862
4i
27;
%7
5:24
11:1668
96;
11918:
7556
48
See footnotes at end of table.
48

Table 14. Number of unmatched deaths for standardmetropolitan statisticalareas (sMSA’s).bycolor: United States,May-A&yst 1960—Con,
[For ciefinition of areas, see Technical Appendix]
Area
Duluth-Superior,Minn.-Wis------------------------------------------Burham, N.C---------------------------------------------------------El Paso, Tex--------------------------------------------------------Erie, Pa---------
2--------------------------------------------------
Eugene, Oreg----- --------------------------------------------------
Evansville,Ind.-Ky-------------------------------------------------l?allRiver-NewBedford,Mass2---------------------------------------Fargo-Moorhead,N.Dak.-Minn-----------------------------------------Flint, Mich---------------------------------------------------------Fort Lauderdale-Hollywood,Fla--------------------------------------
Fort Smith,Ark-----------------------------------------------------Fort Wayne, Ind-----------------------------------------------------Fort Worth, Tex-----------------------------------------------------Fresno, Calif-------------------------------------------------------Gadsden,Ala--------------------------------------------------------
Galveston-TexasCity, Tex-------------------------------------------Gary-Hammond-EastChicago, Ind--------------------------------------Grand Rapids,Mich--------------------------------------------------Great Falls, Mont---------------------------------------------------Green Bay, Wis..-4-?-..-------------.--------------.----------------
Greensboro-HighPoint, N.C------------------------------------------Greenville,S.C-----------------------------------------------------Hamilton-Middletown,Ohio-------------------------------------------Harrisburg,Pa------------------------------------------------------Hartford-NewBritain-Bristol,Conn2---------------------------------
Honolulu,Hawaii----------------------------------------------------Houston, Tex--------------------------------------------------------Huntington-Ashland,W.Va.-Ky.-Ohio----------------------------------Huntsville,Ala--p--------------------------------------------------Indianapolis,Ind---------------------------------------------------
Jackson,Mich-------------------------------------------------------Jackson,Miss-------------------------------------------------------Jacksonv3.Ue,Fla
E--------------------------------------------------
Jersey City, N.J- --------------------------------------------------Johnstown,Pa----,--------------------------------------------------
1Kalamazoo,Mich-----------------------------------------------------Kansas City, Mo.-Rans-----------------------------------------------Kenosha,Wis--------------------------------------------------------Knoxville,Term-----------------------------------------------------Lake Charles,h-7--------------------------------------------------
Lancaster,Pa----i--------------------------------------------------!Lansing,Mich---- :?~-----------------------------------------------
Laredo,Tex---------------------------------------------------------Las Vegas, Nev-------------------------------------------------------Lawson, Okla--------------------------.------------------------------
Le#ng:h;; Ky-----------------------------------------------------------------------------------------------------------------
Linc&ln,Nebr-------------------------------------------------------Little Rock-NorthLittle Rock, Ark----------------------------------Lorain-Elyria,Ohio-------------------------------------------------
Los Angeles-LongBeach, Calif---------------------------------------Louisville,Ky.-Ind-------------------------------------------------Lubbock,Tex--------------------------------------------------------Lynchburg,Va-------------------------------------------------------Macon, &-----------------------------------------------------------
Total
167
1;:159117
11512064152226
67
4;:228109
1332621554969
143185
1%369
211810173106433
1;;307386122
6;:
3:;94
135159
40H;
;;
2!:127
3,5595177088
128
White
16555171156116
9711764135156
616833720595
961971494567
102140
1%345
5;:167
3:;
3970
;;;
115
5E
2ii74
134153
4010034
52
i:130119
3,189401656274
. .
Nonwhite
See footnotesat end of table.
49

Table 14. Number of unmatched deaths for standardmetropolitan statisticalareas (SMSAIS), by
color: United States,May-August 1960-con.
~:or Minition of areas, sw Technical Awendix]
Area
Madison, Wis--------------------------------------------------------Manchester,N.H2----------------------------------------------------Memphis, Tem-------------------------------------------------------Miami, Fla----------------------------------------------------------Midland, Tex--------------------------------------------------------
Milwaukee,Wis-----.------------------------.-----------------------Minneapolis-St.Paul, Minn------------------------------------------Mobile, Ala---------------.-----------------------------------------Monroe, ti----------------------------------------------------------Montgomery,Ala-----------------------------------------------------
Muncie, Ind---------------------------------------------------------Muskegon-MuskegonHeights,Mica-------------------------------------Nashville,Term-----------------------------------------------------Newark, N.J---------------------------------------------------------New Haven-Waterbury,Conn2------------------------------------------
New Orleans, h-----------------------------------------------------Newport News-Hampton,Va--------------------------------------------New York, N.Y-------------------------------------------------------Norfolk-Portsmouth,Va----------------------------------------------Odessa, Tex--------------------------------------------------------
Ogden, Utah---------------------------------------------------------Oklahoma City, Okla-------------------------------------------------Omaha, Nebr.-Iwa ---------------------------------------------------Orlando, Fla------------------------L-------------------------------Paterson-Clifton-Passaic,N.J---------------------------------------
Pensacola,Fla------------------------------------------------------Peoria, Ill---------------------------------------------------------Philadelphia,Pa.-N.J-----------------------------------------------Phoenix, Ariz-------------------------------------------------------Pittsburgh,Pa------------------------------------------------------
Pittsfield,MSSS2---------------------------------------------------Portland,tiine2----------------------------------------------------Portland, Oreg.-Wash------------------------------------------------providence,R-12--------------------------.-------------------------Provo-Orem,Utah----------------------------------------------------
Pueblo, Colo--------------------------------------------------------Racine,Wis---------------------------------------------------------Raleigh,N.C--------------------------------------------------------Reading, Pa---------------------------------------------------------Reno, Nev-------.---------------------------------------------------
Richmond,Va--------------------------------------------------------Roanoke,Va---------------------------------------------------------Rochester,N.Y------------------------------------.----y------------Rockford,Ill-------------------------------------------------------Sacramento,Calif---------------------------------------------------
Saginaw,Mich-------------------------------------------------------St. Joseph,Mo------------------------------------------------------St. Louis, Mo.-Ill--------------------------------------------------Salt Lake City, Utah------------------------------------------------SanAngelo, Tex-----------------------------------------------------
San Antonio, Tex----------------------------------------------------San Bernardino-Riverside-Ontario,Calif-----------------------------San Diego, Calif----------------------------------------------------San Francisco-Oakland,Calif----------------------------------------San Jose, Calif-----------------------------------------------------
Total
7J13238;7243[
52(79622:1O$152
8C
2;;987336
557123
17,11938943
3%233209513
140175
2,946545
1,554
6814358239130
%1,43219160
389557620
1,561314
White
1;;17C60132
49C7771346179
E173773311
315
5,7::22040
2:;199161483
94169
2,301493
1,414
6814156538030
Hl%93
2::
2;;
320
68
1,1:$18556
346522589
1,379308
Nonwhite
21712:
36
242
1,3%1693
46
64:52140
J11
4
4;53
115
430
133
See footnotesat end of table.
50

Table 14. Number of unmatched deaths for standardmetropolitan statisticalareas (sMSA’s),bycolor: United States,May-August1960-Con.
[For definition of areas, see Technical Appendix]
Area
Santa Barbara,Calif------------------------------------------------Savannah,Ga--------------------------------------------------------Scranton,Pa--------------------------------------------------------Seattle,Wash----
i
--------------------------------------------------Shreveport,La--- ,--------------------------------------------------
Sioux City, Ima----------------------------------------------------Sioux Falls, S.Dak--------------------------------------------------South Bend, Ind-----------------------------------------------------Spokane,Wash-----------------:-------------------------------------Springfield,Ill----------------------------------------------------
Springfield,Mo-----------------------------------------------------Springfield,Ohio---------------------------------------------------Springfield-Holyoke,Mass2------------------------------------------Steubenville-Weirton,Ohio-W.Va-------------------------------------Stockton,Calif-----------------------------------------------------
Syracuse,N.YI-------------------------------------------------------
Tacoma,Wash--------------------------------------------------------Tampa-St,Petersburg,Fla-------------------------------------------Terre Haute, Ind----------------------------------------------------Texarkana,Tex.-Atk-------------------------------------------------
Toledo, Ohio--------------------------------------------------------Topeka, ~ns--------------------------------------------------------Trenton,N.J--------------------------------------------------------Tucson,Ariz--------------------------------------------------------Tulsa, Okla---------------------------------------------------------
Tuscaloosa,Ala--i'-------------------------------------------------Tyler, Tex-------4~-------------------------------------------------Utica-Rome,N.Y--+--------------------------------------------------Waco, Tex--------
JG::i::::::::::::::::::::::::::::::::::::::::::::::Washington,D.C.-
Waterloo, Iwa------------------------------------------------------West Palm Beach, Fla------------------------------------------------Wheeling,W.Va.-Ohio------------------------------------------------Wichita, Kans----4--------------------------------------------------Wichita Falls, TeA--------------------------------------------------
Wilkes-Barre—Hazleton,Pa------------------------------------------Wilmington,Del.-N.J------------------------------------------------Winston-Salem,N.C--------------------------------------------------Worcester, Mss2+--------------------------------------------------York, Pa---------+--------------------------------------------------
l!---------------------------------------------
~%%’’:%-: ~1-~~:Mb----------------------------------------------
l~ncludesone machine error.
2Metropolitan state f?COIIOIUic areas.
Total
117121119803247
8238118177113
116
l%
2332375989881
303
l%202251
1181,180
l%16416465
203232146280139
27043,925
White
11470
115764126
8237102166107
11473
177116196
2212255019359
277
1:;187207
lx15815156
201179
2::133
24036,706
Nonwhite
116116
29101129
121297
58374
NOTE: For explanation of why white and nonwhite do not add to the total, see TechnicalAppendix.
51
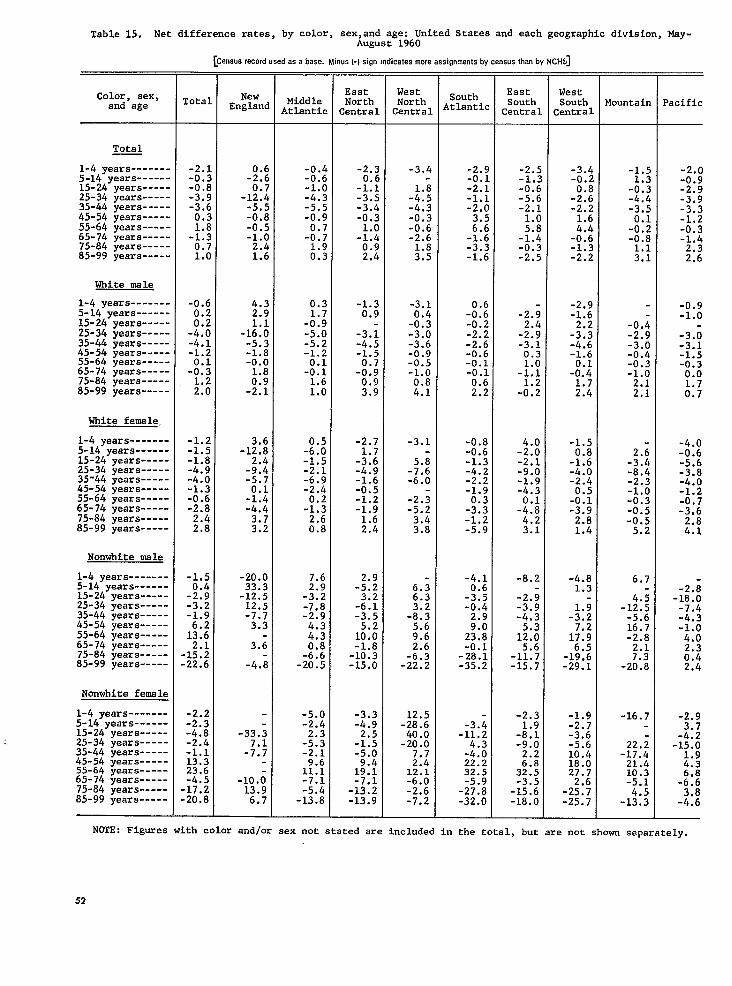
Table 15. Net differencerates, by color, sex,and age: United Statesand each geographicdivision,MSy-
Color, sex,and age
Tota1
1-4 yeara-------5-14 years------15-24 years-----25-34 yeara-----35-44 years-----45-54 years-----55-64 years-----65-74 yeara-----75-84 years-----85-99 yeara-----
White male
1-4 years-------5-14 years------15-24 years-----25-34 years-----35-44 years-----45-54 years-----55-64 years-----65-74 years-----75-84 years-----85-99 years-----
White female,
1-4 years-------5-14 years------15-24 years-----25-34 years-----35-44 years-----45-54 years-----55-64 years-----65-74 years-----75-84 years-----85-99 yeara-----
Nonwhitemale
1-4 years-------5-14 years------15-24 years-----25-34 years-----35-44 years-----45-54 yeare-----55-64 years-----65-74 years-----75-84 years-----85-99 years-----
Nonwhite female
1-4 years-------5-14 years------15-24 years-----25-34 years-----35-44 yeara-----45-54 years-----55-64 years-----65-74 years-----75-84years-----85-99 years-:---
Total
-2.1-0.3-0.8-3.9-3.60,3
-H!0.71.0
-0.60.2
-::;-4.1-1.2
-::;
;:;
-1.2-1.5-1.8-4.9-4.0-1.3-0.6-2.82.42.8
-1.5
-::$-3.2-1.9
1!::
-1::;.22.6
-2.2-2.3-4.8-2.4-1.113.323.6-4.5.17.2.20.8
August 1960
[Census rscord used as a base. Minus (-) sign ,mticates mrs assigmrmnts by cemus thm by NCH$]
NewEngland
-!::
-J:i-5.5-0.8-0.5-1.02.41.6
4.32.9
-Ii::-5.3-1.8-0.01.8
-H
-J::
-;::-5.7
-::;-;.;
3:2
-20.033.3-12.512.5-7.73.3
3.;
-4.i
-33,;
-H
-10.613.96.7
MiddleAtlantic
-0.4-0.6-1.C-4.2-5.5-0.50.7-0.7
;:;
0.3
-::;-5.0-5.2-1.2
-8:{
;::
-%:-1.5-2.1-6.9-2.4
-;::
0:8
H-3.2-7.8-2.94.34,3
-:::-20.5
-5.0-2.4
-i::-2.1
1?:!-7.1-5,4-13.8
EastNmtbCentral
-2.3
-!:!-3.5-3.4-0.3
-i::0.92.4
-1.30.9
-3.;-4.5-1.5
-8:;0.93.9
-2.7
-:::-4.9-1.6-0.5-1.2-:.:
2:4
-::;
-2::-3.5
1:::-1.8-10.3-15.0
-3.3-4.9
-:::-5.0
1?:$-7.1+;.;
.
WestNorthCentral
-3.4
-:::-4.3-0.3-0.6-2.6
R
-3.1
-:::-3.0-3.6-0.9-0.5-1.00.84.1
-3.1
-;::-6.0
-2.5-5.23.43.8
6.;6.3
-::;5.69,62.6
-6.3-22.2
12.5-28.640.0-20.0
H12.1-6.0-2.6-7.2
South!tlantic
-2.9-0.1-2.1-1.1-2.0
2::-1.6-3.3-1.6
-8::-0.2-2,2-2.6-0.6-0.1-0.10.62.2
-0.8-0.6-1.3-4.2-2.2-1.9
-%:-1.2-5.9
-;.;
-3:5-0.4
;::23.8-0.1-28.1-35.2
-3.;-11.2
-:::22.232.5-5.9-27.8-32.0
EsstSouth
Centra 1
-2.5
-1.:-0.6-5.6-2.11.05.8-1.4-0.3-2.5
-2.6
-:::-3.10.3
-:::
-:::
-:::-2.1-9.0-1.9-4.3
-::;4.23.1
-8.2
-2.;-3.9-4.3
1::;
-1?:$-15.7
-2.3
-H-9.0
:::32.5-3.5
-15.6-18.0
WestSouth;entra1
-3.1-0.2
-:::-2.1
:::-0.6-1.:-2.2
-2.9-1.6
-$;-4.6-1.6
-H
;::
-1.5
-:::-4.0-2.4
-8:?-3.92.81.4
-4.81.3
-H
l::!
-19:6-29.1
-1.9-2.7-3.6-5.610.41s.02;.;
-25:7-25.7
Mountain
-1.5
-;:;-4.4-3.5
-:::-0.8
::;
-0.i-2.9-3.0-0.4-0.3-1.02.12,1
-::!-8.4-2.3-1.0-0.3-0.5-0.55.2
6.7
-:;::
16:7-2.8
H-20,8
-16.7
22.;-17.421.410.3-5.14.5
-13.3
Pscific
-2.0-0.9-2.9-3.9-3.3-1.2-0.3-1.4
:::
-0.9-1.0
-3.;-3.1-1.5-0.30.0
::;
-4.0-0.6-5.6-3.8-4.0$;
-3:6
:::
-2.i-18.0-7,4-4.3-1.04.0
$;2.4
-2.9
-H-15.0
H
-:::
-:::
N~E: Figureswith color and/or sex not stated are includedin the total, but are not shown separately.
52

Table 16. Net difference rates for white malea for stage T.and stage II, by age: South AtlanticDivision, May-August 1960
[jms.us reccrd used as base. Minus (-) sign inciic.ates mm assignments by census than NCHS. For explanation of stage I and stage 11, see Technical
Appendixl
Age
1-4 years---------------------------------------
5-14 years--------------------------------------
15-24
25-34
35-44
45-54
55-64
65-74
75-84
85-99
years-------------------------------------
years-------------------------------------
years-------------------------------------
years-------------------------------------
years-------------------------------------
years-------------------------------------
years-------------------------------------
years-------------------------------------
85 yeara and over-------------------------------
Not stated--------------------------------------
Not valid---------------------------------------
Stage I
Age notstated andnot validincluded
1.1
0.5
-1.0
-1.7
0.2
0.9
0.6
1.4
3.1
. . .
-100.0
-42.9
Age notstated andnot validexcluded
0.6
-0.6
-0.2
-2.2
-2.6
-0.6
-0.1
-0.1
-0.6
2.2
. . .
. . .
. . .
Stage II
Age notstated andnot validallocated
-6.3
1.3
-3.8
0.8
-5.7
-3.8
-0.5
0.9
k. 8
. . .
5.2
. . .
. . .
Age notstated andnot validunallocated
-6.3
-2.9
2.3
-4.5
-2.7
. -0.8
0.7
1.1
. . .
5.5
. . .
. . .
NOTE: Stage I, but not stage II, excludes decedents whose age was stated to be 100 years orover on the c~nsui record.
53

Table 17. Number of matched deaths reporting same race on both census and death records, census record only, anddeath record only; and net and groaa difference rates: United States and each region, May-August 1960
Region and race
All regions
White -----------Nonwhite --------
Negro ---------Indian--------Japanese ------Chinese-------Filipino ------Other non-white --------
Not stated andnot valid------
Northeast
White -----------NOnwhite --------
Negro---------Indian--------Japanese ------Chinese-------Filipino ------Other non-white --------
Not stated andnot valid------
North Central
White -----------NOnwhite --------
Negro---------Indian--------~h~~;e------
-.-.-.-FilipinO ------Other non-white --------
Not stated andnot valid------
White -----------Ncmwhite --------
Negro---------Indian--------~h~~e------
.--.---Filipino ------Other ncin-white --------
Not stated andnot valid------
White -----------Nonwhite --------
Negro---------Indian--------Japanese ------Chinese-------Filipino ------Other non-white --------
ITotstated andnot valid------
Number reporting
Same onboth
353,61237,11035,309
602562315138
69
.,.
107,5515,4675,313
24
7:
1
...
113,1166,5876,40111028215
...
81,80922,36922,188
146
1:
...
51,1362,6871,407322521205130
68
...
:ensusrecordonly
847881685154193356
49
3,214
27524522921
Ii15
11
824
19620415351383
8
989
27426222038337
6
842
102170
::13
3:
24
559
Deathrecor?only
3,6211,2991,092
!;1711
197
22
1,00733233510
:1
26
5
1,117263257141
;
9
9
92644843320212
5
4
571256
X1011
6
157
4
Census record as base
Net difference
Number
2,774418407-71-5-16-45
148
-3,192
732
18:-11
-1;-14
15
-819
921
1::-:;
-6-1
1
-980
652186213-18
:;-5
-1
-838
46986-16
::
-2;
133
-555
0.81.1
-ki-0.9-4.623.2
125,4
-99.3
0,71,5
-2;::12.5-11.5-77.8
125.0
-99.4
0.80.9
-2!::-6.5
-2007-12.5
12.5
-99.1
0.8
!?::-9.8
-12,5-11.1-71.4
-16,7
-99.5
0.9
-?::-1.4-0.6
-1:::
144.6
-99.3
Gross difference
Number
4,46~2,18C1,777
23732SC67
246
3,236
1,28257756431
1:16
37
829
1,313467410654105
17
998
1,20071065358
i9
11
846
67342615083232037
181
563
lMinus sign indicates more assignments by census than by NCHS.
2Minua si= indicates more assignments by NCHS than by c~sus.
Rate
1.35.7
3?::
l::i34.5
208.5
100.7
1.210.110.268,912.518.488.9
308.3
100.6
k;
4;::12.934.562.5
212.5
100.9
::?
3::?62.522,2
128.6
183.3
100.5
1.314.910.12;.;
.
2::;
196.7
100.7
Death record as base
Net difference
Number
-2,774-41E-40771:
::
-14E
3,192
-732-87-10611-1
::
-15
819
-921-59-10437261
-1
980
-652-186-21318125
1
838
-469-8616
:
i:
-133
555
Rate
2
-0,8-1,1-1.110.40.9
3:::
-55.6
14,509.1
-0.7-1.5-1.932.4-11.113,0
35Q.O
-55.6
16,380.0
-0.8-0.-9-1.629.8
2%?14.-3
-11.1
10,888.-9
-0.8-0.8-0.910.814.312.5
‘250.0.. ..-
20.0
20,950.0
-0.9-2.91.11.4
-:::18.4
-59.1
13,875.0
Groaa difference
Numbex
4,4682,1801,777
237335067
246
3,236
1,28257756431
1*16
37
829
1,31346741065
1:5
17
998
1,20071065358
29
11
846
67342615083
;:37
181
563
Rate
k;3:::
1;:!45.0
92,5
14,709.1
1,2
1:::91.211.120.8
400.0
137.0
16,580,0
1.16.8
5;:;13.8$;,:
.
188.9
11,088,9
1.53.1
3::;71.425.0
450.0
220.0
21,150.0
li:;10.22;.;
.
2%;
80.4
14,075.0
NOTE : For explanation of why white and nonwhite do not add to the total, aee Technical Appendix.

Table 18. Number of matched and unmatcheddeaths and proportionunmatched,by race: United Statesand each region,May-August 1960
Region and race
All regions
All races------------------
white----------------------------Nonwhite-------------------------Negro--------------------------Indian-------------------------~~;;e -----------------------
---.--------------------Filipino-----------------------Other nonwhite-----------------
Not stated and not valid---------
Northeast
All races------------------
White----------------------------Nonwhite-------------------------Negro----------+---------------Indian---------L.--------------
Ja~:e ------------------------------- ---------- ------
Filipino-----------------------Other nonwhite-----------------
Not stated and not valid---------
North Central
All races ------------------
White-----------------------------Nonwhite-------------------------Negro--------------------------Indian-------------------------.TT~;~e -----------------------
------------------------Filipino-----------------------Other nonwhite-----------------
Not statedand not valid---------
South
All races------------------
White -------- -------- -------- ----
Nonwhite-------------------------Negro----------7~r-------------Indian---------------d---------Japanese-----------------------Chinese------------------------Filipino-----------------------Other nonwhite-----------------
Not stated and not valid---------
w
All races------------------
White----------------------------Nonwhite-------------------------Negro--------------------------Indian-------------------------Jafan;~e-----------------------
------------------------Filipino-----------------------Other nonwhite-----------------
Not stated and not valid---------
Matched deaths accordingto:
Censusrecord
395.664
354,45937,99135.994
-756581348194118
3,214
114.362
107,8265,7125,542
45
8;
121,092
11:,;;;
6;554161312988
989
105.556
82,08322,63122,408
184818
:842
54,654
51,2382,8571,49036653421416192559
Deathrecord
395,664
357,23338,40936,401
68557633214926622
114.362
108,5585,7995,648
34
7?
2;5
121,092
114,2336,8506,658124
z:799
105.556
82,73522,81722,621
1667162
2
54,654
51,7072,9431,4743615312161362254
Unmatcheddeaths
100.412
84,56015,85114,913
4321311531121101
24.321
21,8212,4992,410
16458
;1
26,318
23,7922,5262,386
1057
15310
34,279
24,6819,5989,487
83315:
15,494
14,2661,2286302281176510385
Proportionunmatched
Censusrecord
20.2
19.329,429.336.418.430.536.648.20.0
17.5
16.830.430.326.233.340.010.O42.90.1
17.9
17.427.126.739.518.434.127.355.6
24.5
23.129.829.731.127.345.536.450.0
22.1
21.830.129.738,418.023,339.048.0
Deathrecord
20.2
19.129.229.138.718;531.542.929.34.3
17.5
16.730.129.932.030.843.033.325.016.7
17.9
24.5
23.029.629.533.330.048,466.754:5
22.1
21.629.429.938.718.123.143.127.4
55

c
TECHNICAL
Design of Study
The study includes a sample of registereddeaths which occurred during the 4-month period,May-August, 1960. ‘l%e following age-colorgroups were included:
1. All nonwhite decedents
2. All white decedents under 65 years of age
3. One-half of white decedents 65-74 yearsof age
4. One-fifth of white decedents 75 years andover
The records for white decedents were systemati-cally selected from the regular mortality punched-card file using the randomly assigned terminal
Table 1. Number and Dercent distribution
APPENDIX [
digitsof thecertificatenumbers. Sample groups
threeand fourof Imth the matched and unmatchedrecords were inflated by two and five, respec-tively, during the processing operation.
As indicated in table 1, the actual count ofdeath certificates included in the match operationwas 340,033. Of this number, 495 records wereexcluded because of “impossible” codes—483matched and 12 records unmatched.
Also included in table I are the inflated countsof records by match status. ‘‘”
A seasonaI bias may be introduced since thedeaths were limited to May-August. But an exami-nation of ‘‘nonmatch” rates by month, particularlyApril and September, for a previous study involv-ing the occupation item on the ‘census and deathrecords,7 resulted in a decision to limit this studyto the 4-month period. ‘ ‘“
!-,
of records included in the’1960 ComparisonStudy: United States, May-August 1960
i I
I Actual count of I Inflated count ofrecords ~~ records
Result of match operation
Total ----------------------------------
Matched --------------------------------------Unmatched ------------------------------------Rejectsl-------------------------------------
I l,,-!, ,,
I IPercent
I~~l-,~fmPercentNumber distribu- Number distribu-
tion tion
340,033 I 100.0 I 533,747 I 100.01 I 1
262,483 77.2 420,29277,055
78.722,7 112,656 21.1
2495 0,1 3799 0.1
‘Includes impossible codes not included in the study.
2Includes 483 matched records and 12 unmatched.
31ncludes 782 matched records and 17 unmatched.
56

Criteria for Matching
Copies of the 340,033 death certificates in-cluded in this study were coded for the stage ICensus Enumeration District (ED). A recordwas considered matched if the exact streetaddress of residence and the name of the dece-dent were located in the ED book. Other infor-mation such as date of birth and marital statuswere used if the above criteria did not resultin a match.
If infants under 1 year of age were notlocated in the ED kook, an attempt was made tomatch via the mother. The infants representeda high nonmatch risk group since mmy of themwere born after the 1960 Census of Populationand therefore were not enumerated.
Almost 6 percent of the records were matchedat the place of death, rather than the usual placeof residence. Those persons matched at the placeof death were for the most part those who diedin institutions. , ,
Decedents matched in stage I and included inthe 25-percent sample of the 1960 Census of Popu-lation, referred to as stage II, were then searchedin the stage 11 books. There were 64,675 suchdecedents and all but 2,188 were located in thestage H census records. The names of these 2,188decedents could pot be located on the appropriatepages of the stage’ II schedules.
A host of reasons exists for failure to matchthe death certificate to the census record:
(1)
(2)
(3)
(4)
The decedent may have moved after thedate .of enumeration on April 1.
The decedent may not have been enu-merated.
Clerical and machine errors occurredat all stages of ~ study.
,Misstaterncmt6 pf information were en-tered on the census record and/or thedeath certificate.
Variances
The sample design has been discussed in aprevious section, “Design of Study.” To obtainthe sampling error of an estimate of tbe net
difference rate for a given geographic area, itwould be necessary to know the number of deathrecords for white decedents 65-74 years of ageand 75 years and over during May-August 1960for geographic areas botb before and after sam-pling. The death records were sampled but thecolor designations for most geographic areaswere based on the color on the census record.Although all nonwhite decedents were includedin the study period, a decedent stated to bewhite on the death record may be nonwhite onthe census record and vice versa. Therefore,it is not possible to state that the samplingerror is zero for the nonwhite group shown inthe tables.
Age
The age reported on the death record isgenerally the age of the decedent at his lastbirthday. If the rqmrted age did not agree withthe computed age (the difference between the dateof death and the date of birth on the certificate),the stated age was accepted unless the differencewas 5 years or more. If the difference was 5years or more, entries for other items on thevital record such as cause of death, occupation,marital status, and social security number wereconsidered in determining the age. Most of thedifferences involved infants. Therefore, the afore-mentioned characteristics would give some in-dication of the “correct” age. If a discrepancyoccurred such as 25 years for the computed ageand 35 for the stated age, the stated age wasaccepted.
The age classification used in the 1960Census of Population is based on the quarter ofthe year of birtb as of April 1, 1960. For thisstudy, the age was updated to adjust for a birth-day that might have occurred between the dateof the census and the time of death.
As indicated in the tables showing data byage, the number of matched records for dece-dents under 1 year of age and 100 years and over,according to the census record, are excluded.The number of records with negative ages arealso excluded. Infants were excluded becausemany were born after the date of enumerationon April 1, 1960. There were 23,176 records
57
for infants. Decedents 100 years and over andthose with negative ages were omitted becausethere was an excessive number of errors in thecentury-of-birth codes on the census record. Forexample, if the year of birth was actually 1861and the century code for 1900 was assigned, theresult was a negative age. There were 1,452 suchrecords, that is, for persons 100 years and overand for negative ages. Such exclusions were madeto maintain comparability in order to betterassess differences in age reported on the tworecords.
Additional technical problems relating toage reported on the vital record are coveredin another report.6
Race and Color
Deaths in the United States in 1960 areclassified for vital statistics purposes into white,Negro, American and Alaskan Indian, Chinese,Japanese, Aleut, Eskimo, Filipino, Hawaiian,part-Hawaiian, and other nonwhite. The U.S.Bureau of the Census uses the same classifi-cation.
Tabulations in this study by race weregrouped as follows:
WhiteNonwhite:
NegroIndian (American and Alaskan)JapaneseChineseFilipinoOther nonwhite (Aleut, Eskimo, Hawaiian,
part-Hawaiian, and racial mixtures ex-cept as noted below)
Not stated and not valid
The category “white” includes, in addition to per-sons reported as “white,” those reported as Mexi-can or Puerto Rican. If race is given as a mixtureof Negro with any other race except Hawaiian, therace is classified as Negro. Mixtures of Hawaiianand any other race are classified as “other non-white. ”
In stage I the number of census records forwhich the race item was not stated is combinedwith “not valid” codes (processing errors) andshown as a single group in the race tables. Ihe
relative number of such records is small—lessthan 1 percent of the matched records. If therace was not entered on the death record, thecode for “white” was assigned in the initialcode-punch operation in NCHS. Consequently,the category “not stated and not valid” accord-ing to death certificate designations includes onlyinvalid codes. The number of such records issmall. This factor is noted, not because it seri-ously invalidates the net difference rates, butbecause the category “not stated and not valid”was excluded from most of the residence tables.Therefore, figures by white and nonwhite do notadd to the total.
With the exception of table 18 which showsa comparison of detailed groupings of race, thetables show the color item according to censusdesignations. The purpose was to compare asingle characteristic such as data for an SMSAaccording to census and to death record assign-ments. 71erefore, all other characteristics suchas age, sex, and color in that table were bvcensus designations so as not td distort the com-parison of the variable being compared.
Sex
In a table showing a characteristic such asage or race classified by se~, the sex of thematched decedent is that stated on the censusrecords in order not to invalidate the character-istic being compared. :)
The small number of deaths for which thesex was not stated-O.5 perdent of the totalmatched records—is included in the total inthose tables containing sex, but the categoryis not shown separately. ‘
Urban and Rural Areas ‘ “,.4r.i,~.l ,:
The urban-rural definitions used by NCHSdiffer from those used for data published by theU.S. Bureau of the Census. For this study, theBureau of the Census assigned the residencecodes on the census records of the decedentsincluded in this study according to the rulesused for vital statistics. Therefore, the figuresfor urban and rural are comparable with respectto the application of rules, and the differences
58

between the NCHS figures and those tabulated bycensus result from the entries on the two recordsor processing errors. As noted earlier, differ-ences in the enumeration process and the regis-tration system give greater weight to the accuracyof the census figures. For the decemial census,geographic locations can be fixed with a high de-gree of accuracy by the Bureau of the Censusthrough the use ~f street maps, census tracts,and the like. NCHS is dependent almost entirelyon the information entered in the residence itemon the vital record.
For the definitions of urban and rural asused for vital statistics purposes, see VitulSi!utistics of the United Stutes, 1960, VolumeII, Part A.
Geographic Divisions and Regions
The nine divisions and four regions referredto in this reprt correspond to those used by theU.S. Bureau of the Census. For States included ineach division and region, see reference 8.
Formula for Adiusting Annual Death Rate
(
dmd – dmcD-D
dm= )
= R ~ = Upper range of
D–D(
‘m;::mc) ‘D (:: d.)
Standard Metropolitan Statistical Areas
The standard metropolitan statistical areas(SMSA’S) used in this report are the same as thoseestablished by the JJ.S. Bureau of the Budget as of1960 (except in the New England States) and usedby the U.S. Bureau of the Census.
Except in the New England States, an SMSAisa county or a group of contiguous counties whichcontains at least one city of 50,000 inhabitants ormore or “twin cities’,’ with a combined populationof at least SO,000, in the 1960 census. Contiguouscounties are included in an SMSA if, according tospecified criteria, they are (1) essentially metro-politan in character and (2) socially and economi-cally intergrated Iwith the central city or cities.
In New England the Bureau of the Budget usestowns and cities 1rather than counties as geo-graphic components of SMSA‘s. NCHS cannot usethe SMSA classification in New England becauseits data are not coded to identify all towns. Insteadthe metropolitan State economic area (MSEA)established by the Bureau of the Census, whichis made up of county units, is used. (For a morecomplete discussion of SMSA’s and MSEA’s, seereferences 8-10.)
Metropolitan and Nonmetropolitan Counties
Counties which are included in SMSA’S, orin New England MSEA’S, are called metropolitancounties; all other counties are classified asnonmetropolitan.
P
= R2 = Lower range of
Symbols
D = annual number of deaths, 1960
rate
P =populatiofi enumerated as of April 1, 1960
dmc =matched deaths in study period according tocensus record
dm~ =matched deaths in study period according todeath record
du = unmatched deaths in study period
R = annual death rate per 1,000 population
RI =upper range of adjusted annual death rateper 1,000 population
R2 = lower range of adjusted annual death rateper 1,000 population
Deaths, 1960, by residence-SMSA of Abilene,Texas— White
Fovmula A—uppw range
794 – 794(17:;”2) =
114,508
771X 1,000 = 6.7 = RI
114,508
RI
= upper range
59

Fovmulu B—lower range
7?4- P’ (“;;’’2)1 -794 (172:57)=R’114,508
573 ~ 1,000s R2 = 5.0 = lower range114,508
Rates
R -6.9 published annual rateRI= 6.7
IIadjusted ratesR2=5.0
Net and Gross Difference Rates
Net difference rates for matched deaths werecomputed as follows:
(1)
(2)
(3)
Subtract the number of records accord-ing to census assignments only fromthose according to NCHS assignmentsonly
Divide the number obtained in step 1 bythe number of records for which there isagreement between census and NCHS pluscensus assignments only
Multiply by 100
Most tables contain net difference rates with thecensus record as base; thus a negative rateindicates more assignments by census than byNCHS. If the death record is the base, a nega-tive rate signifies more assignments by NCHS.In most instances the base is inconsequential.If the differences are relatively large, the ratemay vary greatly depending on the base.
Gross difference rates were computed bysumming the differences rather than subtractingthe differences as for net difference rates. Other-wise the computation was the same.
Due to a programming error the first digitof the gross difference rates was not printed outon the tabulations in many instances. Rather thanmanually correct all of these errors, only a fewwere recomputed for inclusion in this report.
Symbols
Si - Number of assignments are the sameaccording to both the census record and thedeath record
c, = Number of assignments according to thecensus record only
di = Number of assignments according to thedeath record only
ndr, = Net difference rate
gd~ = Gross difference rate
Formulas
Net difference rate:
Census record is base.
d,- C,x 100 = ndrl
s, +Ci
Death record is base.
Ci – dlx 100 = ridri
S1 + d,
Gross di~erence Yate:
Census record is base.
d, + cl x 100 = gdr.ISi+ c,
Death record is base.
C, + d,x 100 = gdr,
S, + dl
000
60* U. S. GOVERNMENT PRINTING OFFICE: 1969—34204S/3S

Series 1.
Series 2.
Series 3.
Series 4.
Series 10.
Series 11.
Sevies 12.
Series 13.
Series 14.
Series 20.
Series 21.
Series 22.
OUTLINE OF REPORT SERIES FOR VITAL AND HEALTH STATISTICS
origindy I%blic Health Service l%blication No. 1000
Programs and collection fwocedures.-Reports which desc .i i -he gener?l programs of the NationalCenter for Health Statistics and its offices and divisions, data collection methods used, definitions,and other material necessary for understanding the data.
Data evaluation and methods research. -Studies of new statistical methodology including: experi-mental tests of new survey methods, studies of vital statistics collection methods, new analyticaltechniques, objective evaluations of reliability of collected data, contributions to statistical theory.
Ana&yticat studies. —Reports presenting analytical or interpretive studies based on vital and healthstatistics, carrying the analysis further than the expository types of reports in the other series.
Documents and committee reports. — Final reports of major committees concerned with vitsl andhealth statistics, and documents such as recommended model vital registration laws and revised birthand death certificates.
Data j%om the Health Interview Survey. —Statistics on illness, accidental injuries, disability, use ofhospital, medical, dental. and other services, and other health-related topics, based on data collectedin a continuing national household interview survey.
Data from the Health Examination Survey. -Data from direct examination, testing, and measure-ment of national samples of tie population provide the basis for two types of reports: (1) estimatesof the medically defined prevalence of specific diseases in the United States and the distributions ofthe population with reqpect to physical, physiol@cal, and psychological characteristics; and (2)analysis of relationships among the various measurements without reference to an explicit finiteuniverse of persons.
Data from the Institutional Population Surveys. —Statistics relating to ‘the health characteristics ofpersons in institutions. and on medical, nursing, and personal care received, based on nationalsamples of establishments providing these services and samples of the residents or patients.
Data from the HospitaJ Discharge Survey.— Statistics relating to discharged patients in short-stayhospitals, based on a sample of patient records in a national sample of hospitals.
Da to on health resources: manpower and facilities .- Statistics on the numbers, geographic distri-bution, and characteristics of health resources including physicians, dentists, nurses, other healthmanpower occupations, hospitals, nursing homes, and outpatient and other inpatient facilities.
Data on mortatity, —Various statistics on mortality other than as included in annual or monthlyreports —special analyses by cause of death, age, and other demographic variables, also geographicand time series analyses.
Data on natality, marriage, and divorce. —Various statistics on natality, marriage, and divorce otherthan as included in annual or monthly reports— special analyses by demographic variables, alsogeographic and time series analyses, studies of fertility.
Data from the Nationa[ Nata[ity and MortaLity Surveys. —Statistics on characteristics of births anddeaths not available from the vital records, based on sample surveys stemming from these records,including such topics as mortality .by socioeconomic class, medical experience in the last year oflife, characteristics of pregnancy. +’tc.
For a list of titles of reports published in these series, write to: Office of Information
National Center for Health Statistics
Public Health Semite, HRA
Rockville, Md. 20852

U.S. DEPARTMENT OF HEALTN EDUCATION, AND WELFAREPUBLIC XEALTH SERVICEf%lth Resources Administration5600 Fishers LaneRockville, Maryland 20852
OFFICIAL BUSINESSPenalty for Private Usc $300
PoSTAGE AND FEES PAID
U.S. D=ARTMENT OF HEW*
uS.MUL
THIRD CLASSBLK. RT.