comparison of water quality index (wqi) between...
TRANSCRIPT

COMPARISON OF WATER QUALITY INDEX (WQI) BETWEEN DOE
METHOD AND HARKIN’S INDEX
LIM FUI LING
A dissertation submitted in partial fulfillment of the
requirements for the award of the degree of
Master of Engineering
Faculty of Chemical and Natural Resource Engineering
Universiti Teknologi Malaysia
MARCH 2007

iii
To my beloved father, Lim Kon Pau
and
beloved late mother, Chong Moi
iv
ACKNOWLEDGEMENTS
In preparing this thesis, I have received coorperation and dedication from various parties. In particular, I wish to express my sincere appreciation to my thesis supervisor, Associate Professor Dr. Maketab Mohamed, for guidance, patience and understanding. I am greatly indebted to you for giving me the opportunity to conduct this research project. A great deal of experience is learned throughout this project and will be cherish for the rest of my life.
Special thanks for the Department of Environment (DOE) for their assistance in
providing the necessary water quality data for my thesis. I am also indebted to Universiti Teknologi Malaysia (UTM) for giving me the opportunity to complete my studies.
My fellow postgraduate students should also be recognized for their support
especially Puan Harimah. My sincere appreciation also extends to all my colleagues and superior who have provided assistance and encouragement at various occasions.
Last but not least, to my parents and family members, who have supported me
all my life. Without them, I would not be here today.

v
ABSTRACT
Water quality index (WQI) provides a convenient means of summarizing large
numbers of water quality data, facilitating its communication to a general audience and
will aid in establishment of priorities by providing quantitative data on overall water
quality in regularly sampled water bodies. Large volume of continuous time series water
quality data can be readily available due to automated continuous water quality
monitoring of DOE/ASMA. Raw data obtained from DOE/ASMA for Sungai Rompin,
Skudai and Klang from year 1998 to 2002 is analyzed using DOE WQI method and
Harkin’s WQI method. Average WQI from the study are: Sungai Rompin DOE 81.65 /
Harkins 9.76; Sungai Skudai DOE 67.33 / Harkins 10.80 ; Sungai Klang DOE 51.54 /
Harkins 9.63. DOE WQI show that Sungai Rompin is clean river, Sungai Skudai is
slightly polluted and Sungai Klang is polluted river. However, Harkin’s WQI is not able
to provide the observation as DOE WQI. This indicate that DOE WQI is more sensitive
to data changes and provide better insight of river condition compared to Harkin’s WQI.
Correlation value, r2 calculated using Microsoft excel obtained for Sungai Rompin is
0.25, Sungai Skudai is 0.59 and Sungai Klang is 0.43. However, weak or marginally
significant correlation does not necessary indicate lack of agreement as to what
constitutes good or poor water quality because of Harkin’s WQI calculation. Harkin’s
WQI dependant on the control vector chosen for the Sn calculation. This is the major
hindrance of Harkin’s WQI because the Sn data need to be computed whenever there is
new data added to be computed. The control vector chosen also will affect the overall
observation because by using different data as the control vector, the whole Harkin’s
WQI data will be change. DOE WQI is more dependants on dissolved oxygen (DO)
data because it has the highest weighing compared to other parameter. Current DOE
WQI method still the preferred simplify method to share data with public. However,
there is way to further improve on the water quality information to the authority or
public for management.
vi
ABSTRAK
Indek kualiti air (WQI) adalah satu cara yang mudah untuk meringkaskan data
kualiti air yang banyak, memudahkan komunikasi dengan orang awam dan membantu
program pengendalian kualiti air dalam pemilihan. Data kualiti air yang banyak sedia
ada disebabkan terdapat pengumpulan data dari masa ke semasa dengan sistem
automatik kualiti air DOE/ASMA. Data kasar diperolehi dari DOE/ASMA untuk
Sungai Rompin, Skudai dan Klang dari tahun 1998 ke 2002, dianalisa dengan
menggunakan cara pengiraan DOE WQI dan Harkin WQI. Purata WQI dari pengiraan
adalah: Sungai Rompin DOE 81.65 / Harkins 9.76; Sungai Skudai DOE 67.33 / Harkins
10.80 ; Sungai Klang DOE 51.54 / Harkins 9.63. DOE WQI menunjukkan bahawa
Sungai Rompin adalah bersih, Sungai Skudai sederhana tercemar dan Sungai Klang
adalah tercemar. Walaubagaimanapun, Harkin’s WQI tidak dapat menunjukkan
pemerhatian yang sama. Ini menunjukkan DOE WQI adalah lebih sensitif kepada data
dan memberi keadaan sungai yang lebih tepat berbanding dengan Harkin’s WQI. Data
kolerasi, r2 dikira menggunakan ‘Microsoft excel’ untuk Sungai Rompin adalah 0.25,
Sungai Skudai adalah 0.59 dan Sungai Klang adalah 0.43. Walaubagaimanapun, korelasi
yang lemah tidak semestinya menunjukkan kualiti air yang sebenar disebabkan
pengiraan Harkin WQI yang bergantung kepada vektor kontrol yang dipilih untuk
pengiraan Sn. Ini adalah satu halangan besar untuk indek Harkin kerana data Sn perlu
dikira setiap kali data yang baru ditambah. Vektor kontrol yang dipilih juga akan
memberi kesan kepada pemerhatian keseluruhannya kerana dengan vektor control yang
berlainan, data Harkin WQI akan bertukar. DOE WQI adalah lebih bergantung kepada
data oksigen terlarut (DO) dan menyebabkan ianya memberi nilai yang paling tinggi
berbanding dengan parameter lain. Cara pengiraan sekarang menggunakan DOE WQI
masih digalakkan sebagai satu cara untuk berkongsi data terutama dengan orang awam.
Walaubagaimanapun, terdapat cara yang lebih baik untuk terus memperbaiki informasi
kualiti air untuk penguatkuasa dan orang awam.

vii
TABLE OF CONTENTS
CHAPTER TITLE PAGE TITLE PAGE i DECLARATION ii DEDICATION iii ACKNOWLEDGEMENTS iv ABSTRACT v ABSTRAK vi TABLE OF CONTENTS vii LIST OF TABLES xi LIST OF FIGURES xii LIST OF SYMBOLS xvi LIST OF APPENDICES xvii 1 INTRODUCTION 1
1.1 Major Water Quality Issues in Rivers 2
1.1.1 Changes in physical characteristics 2
1.1.2 Faecal comtamination 2
1.1.3 Organic matters 3
viii
1.1.4 River eutrophication 3
1.1.5 Salinisation 4
1.1.6 Acidification 5
1.1.7 Trace elements 5
1.1.8 Nitrate pollution 5
1.1.9 Organic micropollutants 6
1.1.10 Changes in river hydrology 6
1.2 Water Resources Management in Malaysia 7
1.3 Study Area Overview 9
1.4 Problem Statement 9
1.5 Importance of Study 10
1.6 Study Objectives 11
1.7 Scope of Study 11
2 LITERATURE REVIEW 12
2.1 DOE WQI 13
2.1.1 Dissolved Oxygen (DO) 13
2.1.2 Biochemical Oxygen Demand (BOD) 14
2.1.3 Chemical Oxygen Demand (COD) 15
2.1.4 Ammoniacal Nitrogen (NH3N) 15
2.1.5 Suspended Solid (SS) 15
2.1.6 pH 16
2.2 Harkin’s DOE 17

ix
2.2.1 Phosphate 17
2.3 Other Index Number System 18
2.3.1 Horton (1965) 18
2.3.2 Ross (1977) 22
2.3.3 House and Ellis (1987) 23
2.3.4 Other researchers 24
3 METHODOLOGY 27
3.1 DOE WQI Method 27
3.2 Harkin’s WQI Method 29
4 RESULTS AND DISCUSSION 32
4.1 Sungai Rompin 32
4.1.1 Discussion of Data from River Basin
Rompin, Pahang 32
4.1.2 Correlation data between DOE and
Harkin’s WQI 37
4.1.3 Overall Correlation data between DOE
and Harkin’s WQI from Year 1998 to 2002 40
4.2 Sungai Skudai 41
4.2.1 Discussion of Data from River Basin
Skudai, Johor 41
4.2.2 Correlation data between DOE and

x
Harkin’s WQI 46
4.2.3 Overall Correlation data between DOE and
Harkin’s WQI from Year 1998 to 2002 50
4.3 Sungai Klang 52
4.3.1 Discussion of Data from River Basin
Klang, Selangor/ Wilayah Persekutuan 52
4.3.2 Correlation data between DOE and
Harkin’s WQI 56
4.3.3 Overall Correlation data between DOE and
Harkin’s WQI from Year 1998 to 2002 61
5 CONCLUSIONS AND RECOMMENDATIONS 63
5.1 Monitoring improvement suggestion 65
REFERENCES 68
APPENDIX 71

xi
LIST OF TABLES
TABLE NO. TITLE PAGE
1.1 Definition of Classes for INWQS 7
1.2 Excerpt of Interim National Water Quality Standards (INWQS) 8
2.1 Quality characteristic and rating scales for development of water 21
quality index
2.2 The four water uses for index score 25
4.1 The relationship of DOE WQI to Harkins WQI for Rompin Year 41
1998-2002 using correlation calculation
4.2 The relationship of DOE WQI to Harkins WQI for Skudai Year 51
1998-2002 using correlation calculation
4.3 The relationship of DOE WQI to Harkins WQI for Klang Year 62
1998-2002 using correlation calculation
5.1 Water Quality Status for one of the river basin at Sabah 64
(Year 2002)
5.2 The determinands included within the four independent indices 66

xii
LIST OF FIGURES
FIGURE NO. TITLE PAGE
1.1 Theoritical variations in O2 and pH associated with algal 4
production in a eutrophic river (P production; R respiration)
2.1 The equilibrium of different forms of phosphate in relation to 17
the pH of pure freshwaters
4.1 WQI Vs. Month for Rompin Year 1998 33
4.2 WQI Vs. Month for Rompin Year 1999 33
4.3 WQI Vs. Month for Rompin Year 2000 34
4.4 WQI Vs. Month for Rompin Year 2001 34
4.5 WQI Vs. Month for Rompin Year 2002 35
4.6 Summary of five years data’s DOE WQI Vs. Month for Rompin 36
4.7 Summary of five years data’s Harkin’s WQI Vs. Month for 36
Rompin
4.8 The relationship of DOE WQI to Harkins WQI for Rompin 37
Year 1998
4.9 The relationship of DOE WQI to Harkins WQI for Rompin 38
Year 1999
4.10 The relationship of DOE WQI to Harkins WQI for Rompin 38

xiii
Year 2000
4.11 The relationship of DOE WQI to Harkins WQI for Rompin 39
Year 2001
4.12 The relationship of DOE WQI to Harkins WQI for Rompin 39
Year 2002
4.13 The relationship of DOE WQI to Harkins WQI for Rompin 40
Year 1998-2002
4.14 WQI Vs. Month for Skudai Year 1998 42
4.15 WQI Vs. Month for Skudai Year 1999 42
4.16 WQI Vs. Month for Skudai Year 2000 43
4.17 WQI Vs. Month for Skudai Year 2001 43
4.18 WQI Vs. Month for Skudai Year 2002 44
4.19 Summary of five years data’s DOE WQI Vs. Month for Skudai 45
4.20 Summary of five years data’s Harkin’s WQI Vs. Month for 45
Skudai
4.21 The relationship of DOE WQI to Harkins WQI for Skudai 46
Year 1998
4.22 The relationship of DOE WQI to Harkins WQI for Skudai 47
Year 1999
4.23 The relationship of DOE WQI to Harkins WQI for Skudai 47
Year 2000
4.24 The relationship of DOE WQI to Harkins WQI for Skudai 48
Year 2001
xiv
4.25 The relationship of DOE WQI to Harkins WQI for Skudai 48
Year 2002
4.26 The relationship of DOE WQI to Harkins WQI for Skudai 49
Year 2001 after change control vector using maximum Sn
from the 1st calculation of 22.79
4.27 The relationship of DOE WQI to Harkins WQI for Skudai 51
Year 1998-2002.
4.28 WQI Vs. Month for Klang Year 1998 52
4.29 WQI Vs. Month for Klang Year 1999 53
4.30 WQI Vs. Month for Klang Year 2000 53
4.31 WQI Vs. Month for Klang Year 2001 54
4.32 WQI Vs. Month for Klang Year 2002 54
4.33 Summary of five years data’s DOE WQI Vs. Month for Klang 55
4.34 Summary of five years data’s Harkin’s WQI Vs. Month for 56
Klang
4.35 The relationship of DOE WQI to Harkins WQI for Klang 57
Year 1998
4.36 The relationship of DOE WQI to Harkins WQI for Klang 57
Year 1999
4.37 The relationship of DOE WQI to Harkins WQI for Klang 58
Year 2000
4.38 The relationship of DOE WQI to Harkins WQI for Klang 58
Year 2001

xv
4.39 The relationship of DOE WQI to Harkins WQI for Klang 59
Year 2002
4.40 The relationship of DOE WQI to Harkins WQI for Klang 60
Year 2000 after change control vector using maximum Sn
from the 1st calculation of 22.87
4.41 The relationship of DOE WQI to Harkins WQI for Klang 60
Year 2000 after change control vector using median Sn
from the 1st calculation of 12.05
4.42 The relationship of DOE WQI to Harkins WQI for Klang 62
Year 1998-2002

xvi
LIST OF SYMBOLS
P - Production
R - Respiration
C - Characteristic by the appropriate weighting factor (W)
W - Weighting factor
M1 - Temperature
M2 - Obvious pollution
µ - Micro
x - Concentration in mg/l for all parameters except pH
Ri - Variance
p - Number of parameters being used
n - Number of observations plus the number of control points
k - Number of ties encountered
Rc - Rank of the control value
Sn - Standardized distance
r2 - Correlation

xvii
LIST OF APPENDICES
APPENDIX TITLE PAGE
A Water Quality Standard 71
A1 Interim National Water Quality Standards for Malaysia 71
A2 DOE Water Quality Index Classification 73
A3 DOE Water Quality Classification Based on Water Quality 74
Index
B Water Monitoring Raw Data 75
B1 Rompin 1998 75
B2 Rompin 1999 87
B3 Rompin 2000 95
B4 Rompin 2001 103
B5 Rompin 2002 111
B6 Skudai 1998 119
B7 Klang 1998 131

CHAPTER 1
INTRODUCTION
Water is the essential need for life. The demand for clean and portable water has
increased tremendously due to rapid development and a growing population. To
preserve water quality and quantity, it is necessary to obtain data from regularly
sampling at predetermined stations for in-situ and laboratory analysis. This information
permits one to establish priorities with regards to preservation and quality control in the
country.
Rivers are the most important freshwater resource for man. Major river water
uses such as sources of drinking water supply, irrigation of agricultural lands, industrial
and municipal water supplies, industrial and municipal waste disposal, navigation,
fishing, boating and body contact recreation.
Upstream use of water must only be undertaken in such a way that is does not
affect water quantity, or water quality, for downstream users. Use of river water is,
therefore, the subject of major political negotiations at all levels. Consequently, river
water managers require high quality scientific information on the quantity and quality of
the waters under their control. Provision of this information requires a network of river
monitoring stations in order to:
a) establish short- and long-term fluctuations in water quantity in relation to basin
characteristics and climate;
b) determine the water quality criteria required to optimize and maintain water uses;

2
c) determine seasonal, short- and long-term trends in water quantity and quality in
relation to demographic changes, water use changes and management
interventions for the purpose of water quality protection.
As with all freshwater systems, river quality data must be interpreted within the
context of a basic understanding of the fluvial and river basin processes with control the
underlying characteristics of the river system. Similarly, the design of the monitoring
network, selection of sampling methods and variables to be measured must be based on
an understanding of fluvial processes as well as the requirement for water use.
1.1 Major water quality issues in rivers
1.1.1 Changes in physical characteristics
Temperature, turbidity and total suspended solids (TSS) in rivers can be greatly
affected by human activities such as agriculture, deforestation and the use of water for
cooling.
1.1.2 Faecal contamination
Feacal contamination is still the primary water quality issue in rivers, especially in
many developing countries where human and animal wastes are not yet adequately
collected and treated. Although this applies to both rural and urban areas, the situation is
probably more critical in fast-growing cities where the population growth rate still far
exceeds the rate of development of wastewater collection and treatment facilities.
3
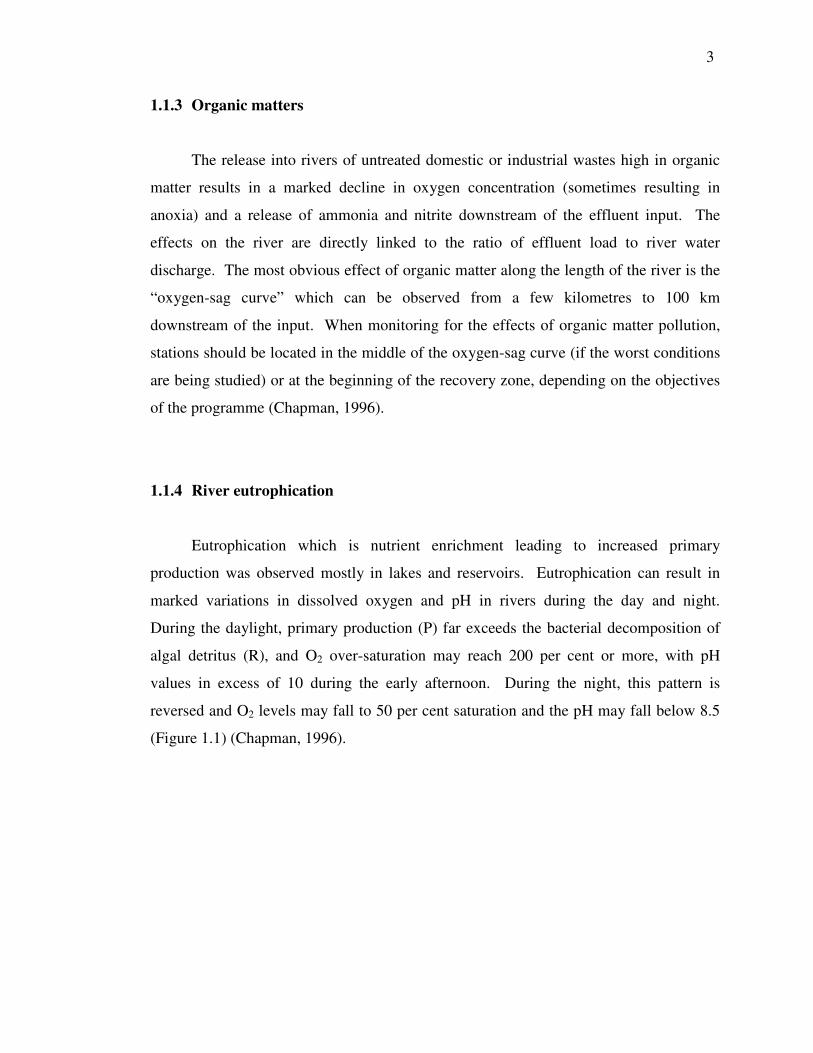
1.1.3 Organic matters
The release into rivers of untreated domestic or industrial wastes high in organic
matter results in a marked decline in oxygen concentration (sometimes resulting in
anoxia) and a release of ammonia and nitrite downstream of the effluent input. The
effects on the river are directly linked to the ratio of effluent load to river water
discharge. The most obvious effect of organic matter along the length of the river is the
“oxygen-sag curve” which can be observed from a few kilometres to 100 km
downstream of the input. When monitoring for the effects of organic matter pollution,
stations should be located in the middle of the oxygen-sag curve (if the worst conditions
are being studied) or at the beginning of the recovery zone, depending on the objectives
of the programme (Chapman, 1996).
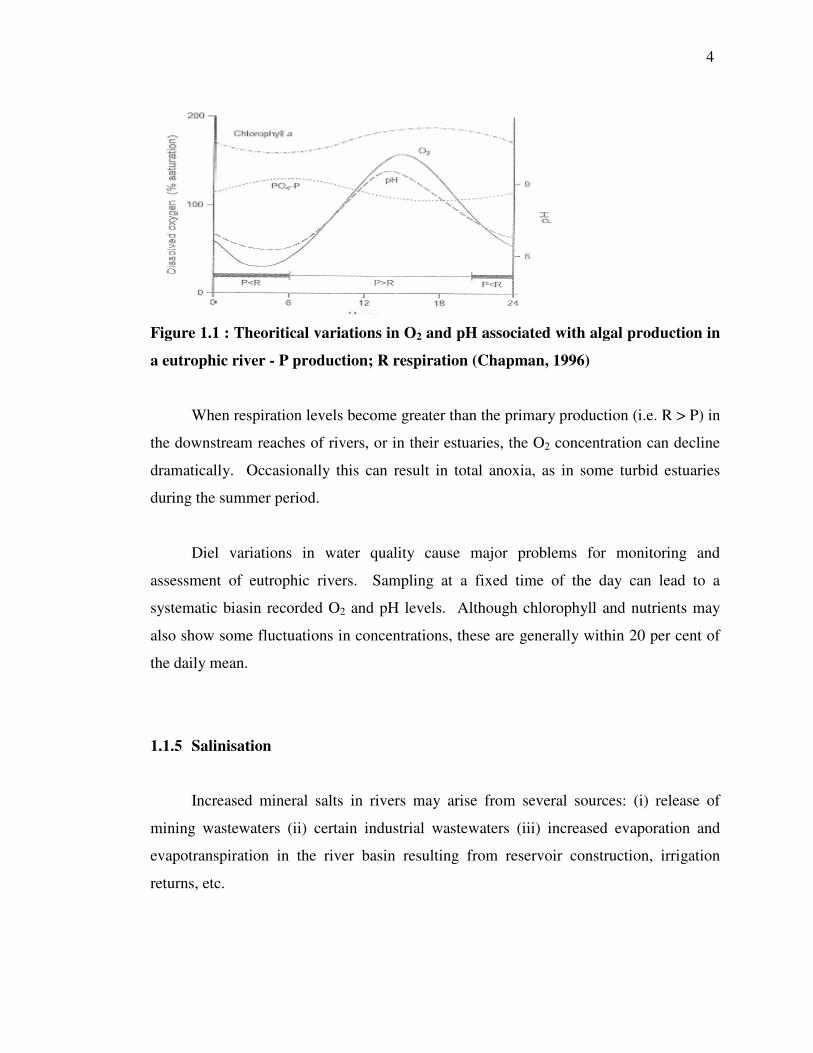
1.1.4 River eutrophication
Eutrophication which is nutrient enrichment leading to increased primary
production was observed mostly in lakes and reservoirs. Eutrophication can result in
marked variations in dissolved oxygen and pH in rivers during the day and night.
During the daylight, primary production (P) far exceeds the bacterial decomposition of
algal detritus (R), and O2 over-saturation may reach 200 per cent or more, with pH
values in excess of 10 during the early afternoon. During the night, this pattern is
reversed and O2 levels may fall to 50 per cent saturation and the pH may fall below 8.5
(Figure 1.1) (Chapman, 1996).
4
Figure 1.1 : Theoritical variations in O2 and pH associated with algal production in
a eutrophic river - P production; R respiration (Chapman, 1996)
When respiration levels become greater than the primary production (i.e. R > P) in
the downstream reaches of rivers, or in their estuaries, the O2 concentration can decline
dramatically. Occasionally this can result in total anoxia, as in some turbid estuaries
during the summer period.
Diel variations in water quality cause major problems for monitoring and
assessment of eutrophic rivers. Sampling at a fixed time of the day can lead to a
systematic biasin recorded O2 and pH levels. Although chlorophyll and nutrients may
also show some fluctuations in concentrations, these are generally within 20 per cent of
the daily mean.
1.1.5 Salinisation
Increased mineral salts in rivers may arise from several sources: (i) release of
mining wastewaters (ii) certain industrial wastewaters (iii) increased evaporation and
evapotranspiration in the river basin resulting from reservoir construction, irrigation
returns, etc.

5
1.1.6 Acidification
Acidification can occur in running waters as a result of: (i) direct inputs of acidic
wastewaters from mining or from specific industries, either as point sources (e.g. sewers)
or diffuse sources (e.g. leaching of mine tailings), and (ii) direct inputs through acidic
atmospheric deposition, mainly as nitric and sulphuric acids resulting mostly from motor
exhausts and fossil fuel combustion. In the latter case, acidification of surface waters
may only take place if the buffering capacity of the river basin soil is very low. Low
buffering capacity mainly occurs in areas of non-carbonate detrital rocks, such as
sandstones, and of crystalline rocks such as granites and gneisses.
1.1.7 Trace elements
Trace element pollution results from various sources, mostly: (i) industrial
wastewaters such as mercury from chlor-alkali plants, (ii) mining and smelter wastes,
such as arsenic and cadmium, (iii) urban run-off, particularly lead, (iv) agricultural run-
off (where copper is still used as a pesticide), (v) atmospheric deposition, and (vi)
leaching from solid waste dump.
1.1.8 Nitrate pollution
Urban wastewaters and some industrial wastes are major sources of nitrate and
nitrile. However, in regions with intensive agriculture, the use of nitrogen fertilizers and
discharge of wastewaters from the intensive indoor rearing of livestock can be the most
significant sources.
Heavy rain falling on exposed soil can cause substantial leaching of nitrate, some
of which goes directly into rivers, but most of which percolates into the groundwater
from where it may eventually reach rivers if no natural denitrification occurs.

6
1.1.9 Organic micropollutants
Organic micropollutants (mostly synthetic chemicals manufactured artificially)
are becoming a critical water quality issue in developed and developing countries. They
enter rivers : (i) as point sources directly from sewers and effluent discharges (domestic,
urban and industrial sources), (ii) as diffuse sources from the leaching of solid and liquid
waste dumps or agricultural lan run-off, or (iii) indirectly through long-range
atmospheric transport and deposition. Agriculture is a major source of new chemical
pollutants to rivers, such as pesticides. The approach to monitoring these substances
depends mostly on their properties, i.e. volatility, water solubility, solubility in lipids,
photodegradation, biodegradation, bioaccumulation, etc.
1.1.10 Changes in river hydrology
Many human activities, directly or indirectly, lead to modification of the river and
its valley which produce changes in the aquatic environment without major changes in
the chemical characteristics of the river water. Such changes can lead to loss if
biological diversity and, therefore, biological monitoring techniques are most
appropriate in these situations, supported by careful mapping of the changes in the river
bed and banks.
Major modifications to river systems include changes to depth and width for
navigation, flood control ponds, reservoirs for drinking water supply, damming for
hydroelectric power generation, diversion for irrigation, and canalization to prevent loss
of flood plains of agricultural importance due to river meandering. All of these affect
the hydrology and related uses of the river system.

7
1.2 Water Resource Management in Malaysia
In Malaysia, the Department of Environment (DOE) started monitoring of river
water quality in 1978, initially establish water quality baselines and subsequently to
detect water quality changes and identify pollution sources. Samples had been regularly
taken at predetermined stations for in-situ and laboratory analysis and data interpretation
in terms of physico-chemical and biological characteristics.
The water quality appraisal is based on the Water Quality Index (WQI) consisting
of parameters such as Dissolved Oxygen (DO), Biochemical Oxygen Demand (BOD),
Chemical Oxygen Demand (COD), Ammoniacal Nitrogen (NH3N), Suspended Solids
(SS) and pH. The WQI serves as a basis for environmental assessment of a watercourse
in relation to pollution load categorization and designation of classes of beneficial uses
as provided for under the Interim National Water Quality Standards for Malaysia
(INWQS). (Department of Environment, 2005). INWQS is divided into 5 classes, Class
1 being the cleanest and Class V being the most polluted.
Table 1.1 : Definition of Classes for INWQS
Class Uses CLASS I : Conservation of natural environment Water Supply 1 – practically
no treatment necessary (except by disinfection or boiling only). Fishery 1 – very sensitive aquatic species
CLASS IIA : Water Supply II – conventional treatment required. Fishery II – sensitive aquatic species
CLASS IIB : Recreational use with body contact CLASS III : Water Supply III – extensive treatment required.
Fishery III – common, of economic value, and tolerant species; livestock drinking
CLASS IV : Irrigation CLASS V : None of the above

8
Table 1.2 : Excerpt of Interim National Water Quality Standards (INWQS)
CLASS PARAMETERS UNIT I IIA IIB III IV V
Ammoniacal Nitrogen
mg/L 0.1 0.3 0.3 0.9 2.7 >2.7
BOD mg/L 1 3 3 6 12 >12 COD mg/L 10 25 25 50 100 >100 DO mg/L 7 5 - 7 5 - 7 3 - 5 <3 <1 pH 6.5 –
8.5 6 - 9 6 - 9 5 - 9 5 - 9 -
Colour TCU 15 150 150 - - - Elec. Conductivity
umhos/cm
1000 1000 - - 6000 -
Floatables N N N - - - Odour N N N - - - Salinity (%) % 0.5 1 - - 2 - Taste N N N - - - Total Dissolved Solid
mg/L 500 1000 - - 4000 -
Total Suspended Solid
mg/L 25 50 50 150 300 300
Temperature (C) oC - Normal +2oC
Normal +2oC
- -
Turbidity (NTU) NTU 5 50 50 - - - Faecal Coliform**
counts/100mL
10 100 400 5000 (20000)a
5000 (20000)a
-
Total Coliform counts/100mL
100 5000 5000 50000 50000 >50000
Notes
N : No visible floatable materials or debris, No objectionable odour; No objectionable
taste
* : Related parameters, only one recommended for use
** : Geometric mean
a : Maximum not to be exceeded
9
1.3 Study Area Overview
In 1960s onwards, efforts were made from a few individual to find a suitable,
reliable and rapid manner of classifying a water body for different purposes, which led to
the development of the “Water Quality Indices or Water Quality Index”. Since then,
different indices have been developed (Horton, 1965; Harkins, 1974).
Water quality index provides a convenient means of summarizing complex water
quality data and facilitating its communication to a general audience. Utilization of the
water quality index will help staff, lawmakers, and the public to evaluate progress being
made in water quality management programs and will aid in establishment of priorities
by providing quantitative data on overall water quality in regularly sampled water bodies.
The index should allow staff to readily interpret and evaluate regularly generated
laboratory data, recognize trends or problem areas, and optimize sampling location and
frequency.
1.4 Problem Statement
In Malaysia, automated continuous water quality monitoring of DOE/ASMA have
proven to be cost effective means for measuring the real time water quality status of
rivers. By this means, large volume of continuous time series water quality data can be
readily available for more effective pollution control and for a better understanding of
the dynamics of water quality changes in the river.
DOE has taken some steps in adopting a WQI system for the evaluation of the
past and present water quality status, but there remain several important aspects to be
studied further before effective application is possible.

10
Harkin’s WQI calculation method is used to compare with DOE WQI because
Harkin’s method can be considered as the first type of water quality index calculation
method and it has been used for studies since then.
DOE WQI is using six parameters whereas Harkins’ WQI is using four parameters
where three of the four parameters are the same as DOE WQI method. The calculation
method also different which will provide insight of different findings based on different
WQI method.
1.5 Importance of Study
The importance of this study draws parallel to the purpose of better understanding
of water quality index and viewed in their proper context. The value of a water quality
index scale is to impart information of trends in water quality in a non-technical manner
and to help pinpoint river stretches which have altered significantly in quality and which,
if necessary, can be investigated in greater detail.
A good water quality index will provide a clearer picture of the river water quality
to public. Water quality index will act as indicators of water quality changes and also
indicate the effects of these changes on potential water use. Large sum of money
invested annually will be worthwhile since it will provide a meaningful usage.
Reducing a large quantity of data to a single number index will allow more
meaningful comparison to be made and integrate the effects of the various pollutions
presents. Single number also can be used as education to country’s younger generation
as one of the method to prevent further river pollution due to mankind.
11
1.6 Study Objectives
The objectives of this study as follows:
1. To interprete water quality raw data from ASMA using 2 types of WQI
calculation methods i.e. Harkins method and DOE method;
2. To detect annual cycles and trends in the surface water quality;
3. To observe the WQI data and illustrate the importance of accurate WQI method
used for information sharing to government and public.
1.7 Scope of Study
To achieve the preset objectives above, several goals are set:
1. Study the water quality status published by DOE yearly and identify three suitable
river basin – clean, slightly polluted and polluted river basins;
2. Request data from ASMA for the above three river basins from year 1998 to 2002
on dissolved oxygen (DO), biochemical oxygen demand (BOD), chemical oxygen
demand (COD), suspended solid (SS), acidity/alkalinity (pH), ammoniacal
nitrogen (NH3-N) and total phosphate (PO4);
3. Calculation of WQI using Harkins method and DOE method;
4. Analyze calculated data and compare 2 different index.