competing with giants: who wins, who loses? betina dimaranan, elena ianchovichina, and will martin...
TRANSCRIPT
Competing with Giants: Who Wins, Who Loses?
Betina Dimaranan, Elena Ianchovichina, and Will Martin
National University of Singapore
15 September 2006

Export Growth: China and India Two giant labor-intensive exporters, growing
rapidly, but some important differences Services much more important in India Only China integrated into global networks
But both now rapidly integrating into world production networks
What will be the implications for them, and for other countries?

Importance of Services
0
5
10
15
20
25
30
1990 1991 1992 1993 1994 1995 1996 1997 1998 1999 2000 2001 2002 2003
%
China
India

Import Share: Parts & Components
0
5
10
15
20
25
30
35
India China
1992
2002

Radically different export patterns 6-digit
China % India % ADP Parts 4.0 Non-industrial diamonds 12.7 Digital ADP machinery 4.0 Petroleum oils 9.7 Input or output units for ADP 4.2 Articles. of jewelry 4.6 Transmission apparatus 3.1 Iron ores 4.5 Parts for transmission apps 2.3 Milled rice 2.6 Monolithic integrated circuits 1.9 Other organic cpds 2.1 Storage units, 1.5 Flat rolled products 2.0 Video recording apparatus 1.5 Other medicaments 1.9 Optical devices 1.4 T-shirts, singlets 1.4 Video recorders 1.2 Women’s blouses 1.4 Television receivers 1.2 Frozen shrimp 1.5 Cargo containers 1.1 Men’s cotton shirts 1.3 Static converters 0.9 Imitation jewelry 1.2 Parts for transmission apps 0.9 Cotton furnishings 1.2 Petroleum oils 0.9 Oil-cake 1.1

Major reforms under way in India Reductions in non-agricultural protection
Improvements in the operation of duty exemption/drawback schemes
Improvements in infrastructure/lowering of trade costs

Questions to be addressed
What are the likely effects of India’s move to greater integration in the world economy?
What will be the effects of rapid growth by two large, globalized exporters? On each other? On other developing countries?

Methodology Modify the GTAP-6 model to allow duty
exemptions on intermediates used for exports Move from 2001 base to 2005 incorporating agreed
reforms– especially China’s WTO commitments Examine globalizing reforms in India
Project the global economy forward to 2020 Compare with higher-than-expected growth in China
and India Allow for increases in the variety of goods exported
from China and India Consider growth biased to physical or human capital

India’s Reforms
Reductions in non-agricultural tariffs
Making duty exemption/drawback schemes more effective Modeled as introduction of such schemes for all
exported goods
20% reduction in trade costs
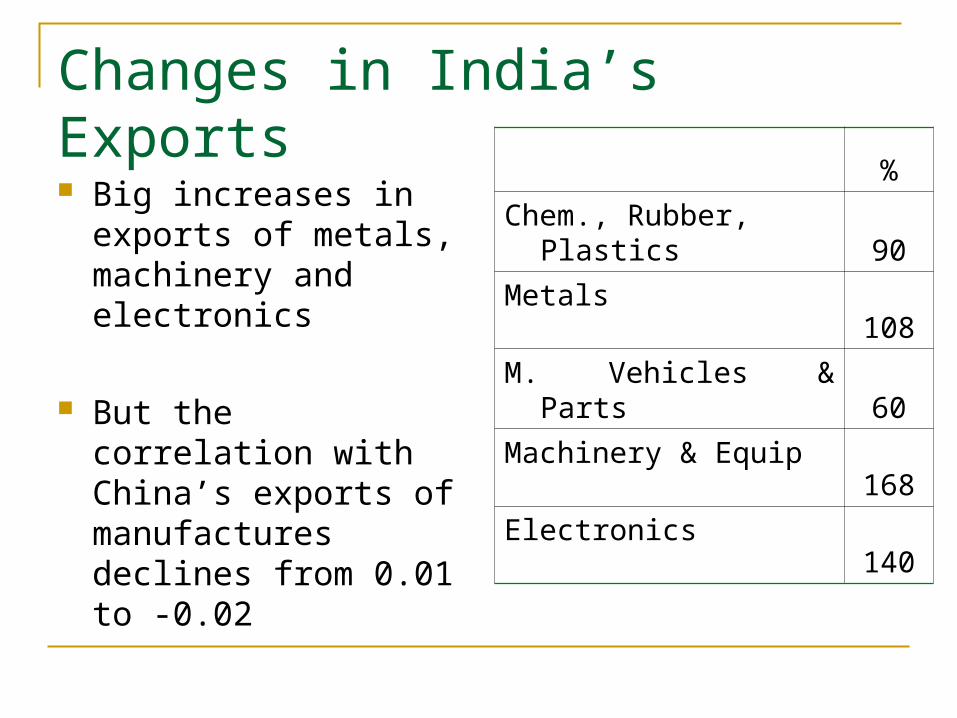
Changes in India’s Exports
Big increases in exports of metals, machinery and electronics
But the correlation with China’s exports of manufactures declines from 0.01 to -0.02
%
Chem., Rubber, Plastics90
Metals108
M. Vehicles & Parts60
Machinery & Equip168
Electronics140
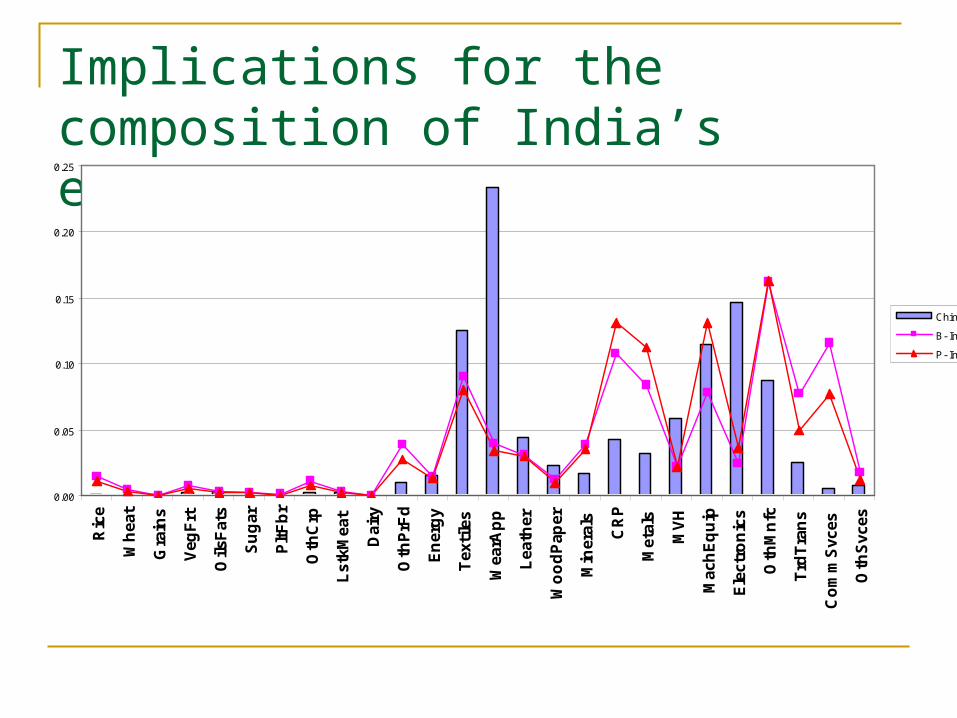
Implications for the composition of India’s exports
0.00
0.05
0.10
0.15
0.20
0.25
Ric
e
Wh
eat
Gra
ins
Veg
Frt
Oils
Fat
s
Su
gar
Plt
Fb
r
Oth
Crp
Lst
kMea
t
Dai
ry
Oth
PrF
d
En
erg
y
Tex
tile
s
Wea
rAp
p
Lea
ther
Wo
od
Pap
er
Min
eral
s
CR
P
Met
als
MV
H
Mac
hE
qu
ip
Ele
ctro
nic
s
Oth
Mn
fc
Trd
Tra
ns
Co
mm
Svc
es
Oth
Svc
es
China
B- India
P- India

Baseline simulation, % pa, 2005-20
GDP Unsk Lab
Skil Lab
Phy Cap. Popn
% % % % % China 6.6 0.8 3.9 8.5 0.6 India 5.5 1.6 4.0 6.1 1.1 Low inc 4.7 1.7 3.1 4.2 1.5 Middle inc 4.5 1.0 3.1 3.9 0.8 High inc 2.7 0.9 0.4 3.0 0.2 World 3.1 0.9 0.8 3.2 0.9

Baseline simulation, % pa, 2005-20
Welfare Output Exports Imports $m % % % % China 1965 146.2 161.9 187.8 167.7 India 631 116.5 124.4 189.9 151.4 Low inc 495 84.3 80.7 70.7 90.7 Middle inc 3284 81.9 75.6 73.0 87.0 High inc 11466 47.8 49.8 57.8 58.7 World 1965 146.2 161.9 187.8 167.7

Impacts of higher growth in China & India on other countries Benefits from increases in direct trade
Strengthening of demand for exports Greater supplies of goods from China & India
Challenges from third market competition Quality and variety growth based on
Hummels and Klenow (2005) Quality of exports represented as an increase in
the effective services provided Variety growth based on H-K assessment that 2/3
of export growth from new varieties
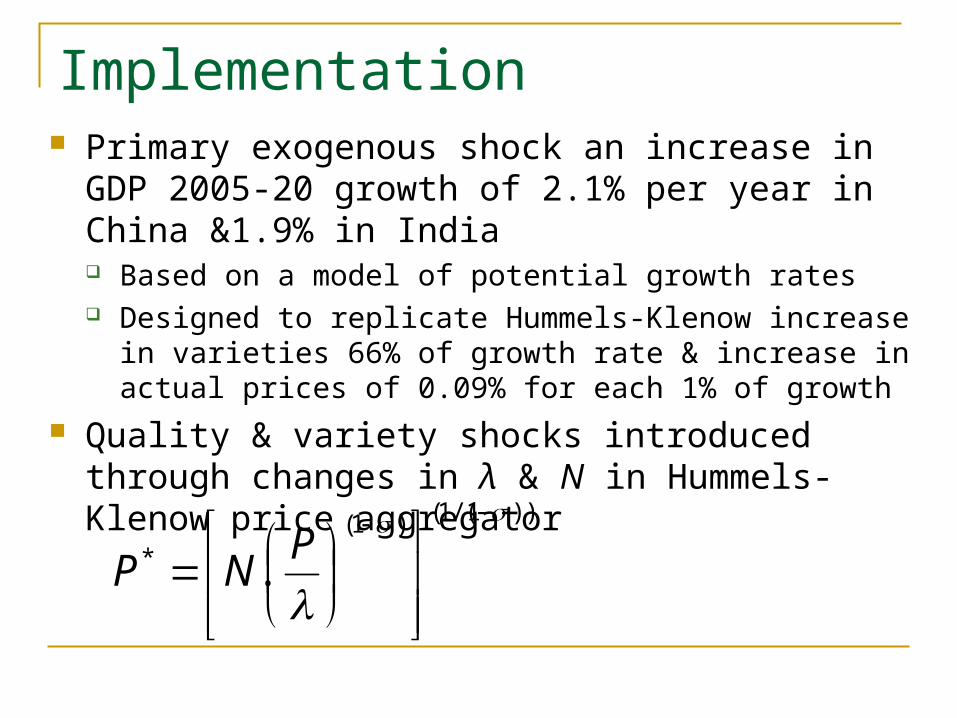
Implementation Primary exogenous shock an increase in GDP 2005-
20 growth of 2.1% per year in China &1.9% in India Based on a model of potential growth rates Designed to replicate Hummels-Klenow increase in varieties
66% of growth rate & increase in actual prices of 0.09% for each 1% of growth
Quality & variety shocks introduced through changes in λ & N in Hummels-Klenow price aggregator
))1/(1()1(* .
P
NP

Impacts on world welfare Growth Growth & Quality % % Australia & N Zealand 0.45 0.91 China 39.9 43.6 Japan 0.16 0.42 Korea 0.11 1.00 Indonesia 0.27 0.61 Malaysia 0.87 2.03 Philippines -0.57 -0.89 Singapore -1.68 -0.34 Thailand -0.31 0.24 Vietnam -0.07 0.29 India 33.7 36.7 USA 0.00 0.15 Argentina & Brazil 0.13 0.28 EU 25 -0.04 0.18 Sub-Saharan Africa 0.96 1.50 LICs (excl India) 0.46 0.87 MICs (excl China) 0.61 0.87 High income countries 0.03 0.28 World 3.8 4.3

Impacts on exports, 2005-20 Growth Growth & Quality Regions % % Australia & N Zealand -0.06 0.72 China 29.41 55.34 Japan 2.44 4.80 Korea 3.45 5.83 Indonesia 0.18 -0.10 Malaysia 0.27 0.02 Philippines -0.26 -3.19 Singapore 4.92 6.50 Thailand 1.63 2.33 Vietnam -1.10 -2.33 India 28.9 47.05 USA 0.67 2.87 Argentina & Brazil -0.06 0.45 EU 25 -0.14 -0.18 Sub-Saharan Africa -0.24 0.80 LICs (excl India) -0.07 0.77 MICs (excl China) -0.18 -0.16 High income countries 0.79 1.73 World 4.4 8.5

Impacts on industry output, 2005-20Regions China India IDN PHL SGP USA EU 25 SSA
% % % % % % % %Textiles 30.0 26.2 -15.6 -14.3 -7.9 -10.5 -9.9 -10.4Apparel 20.5 11.1 -21.4 -25.7 -16.9 -15.3 -16.8 -10.3Leather 45.2 45.5 -20.0 -17.0 -21.7 -6.4 -8.5 -7.7Wood 34.7 32.1 15.4 1.9 1.6 0.3 0.8 0.6Minerals 36.3 33.9 -3.4 1.3 3.9 0.2 -0.5 1.2Chemicals 39.2 33.1 0.9 5.5 0.8 1.4 -3.0 -2.0Metals 34.8 34.0 -8.9 2.6 5.0 -1.0 -1.3 1.4Auto 40.9 30.0 -2.8 0.4 -11.4 -0.4 -1.3 -8.5Machinery 40.2 41.5 -4.4 4.0 -2.5 -4.2 -5.0 -16.1Electronics 58.2 36.5 -12.0 -13.9 5.2 -11.0 -11.7 -24.9Other 33.1 15.6 -19.2 -9.9 -20.3 -16.7 -6.6 -13.3

Productivity growth likely biased We consider scenarios where growth is
biased towards more advanced sectors Sectorally, or through capital growth
Perhaps the most interesting is bias towards strong export sectors in China and India metals, electronics, machinery and equipment,
motor vehicles and commercial services Consider 2% productivity growth per year
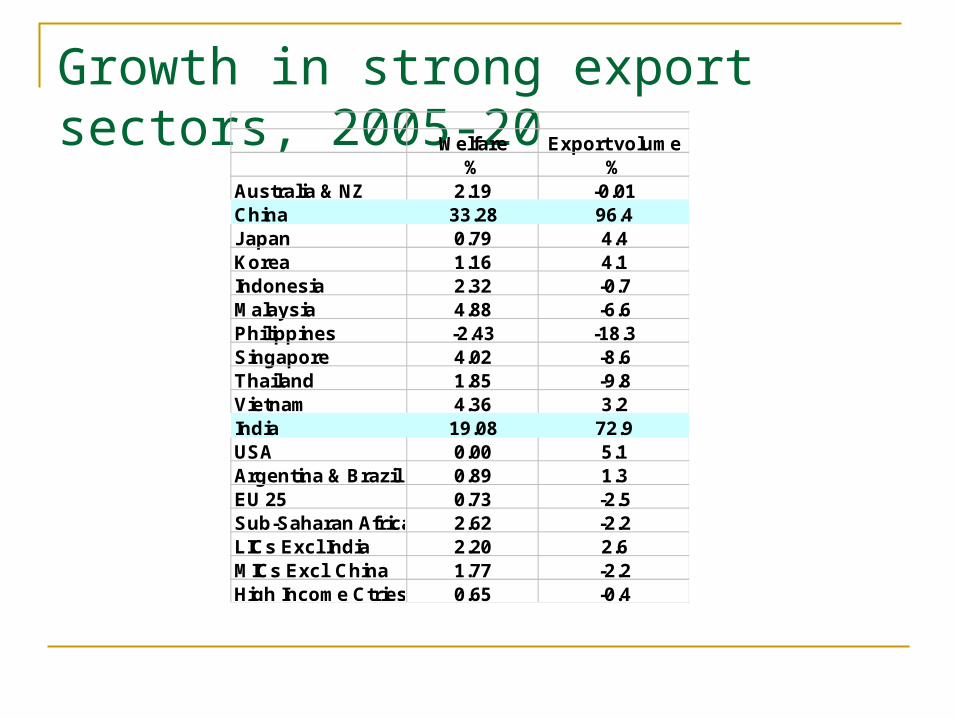
Growth in strong export sectors, 2005-20 Welfare Export volume
% %Australia & NZ 2.19 -0.01China 33.28 96.4Japan 0.79 4.4Korea 1.16 4.1Indonesia 2.32 -0.7Malaysia 4.88 -6.6Philippines -2.43 -18.3Singapore 4.02 -8.6Thailand 1.85 -9.8Vietnam 4.36 3.2India 19.08 72.9USA 0.00 5.1Argentina & Brazil 0.89 1.3EU 25 0.73 -2.5Sub-Saharan Africa 2.62 -2.2LICs Excl India 2.20 2.6MICs Excl China 1.77 -2.2High Income Ctries 0.65 -0.4

Impacts on sectoral outputs, 2005-20%
Regions China India Japan IDN PHL SGP USA EU 25 SSATextiles -80 -41 48 39 72 70 37 72 17Apparel -73 -68 37 96 266 37 81 111 32Leather -64 -89 31 -2 44 29 34 38 12Wood -52 -44 9 37 22 30 6 9 7Minerals -1 -38 17 -8 4 51 7 5 13Chemicals -46 -42 23 -1 16 31 15 6 7Metals 43 118 -19 -46 -41 -32 -15 -25 -46Auto 196 26 -23 -27 -25 -39 -14 -28 -41Machinery 95 156 -32 -38 -24 -42 -24 -37 -50Electronics 252 9 -44 -78 -65 -35 -57 -62 -70Other -58 -71 28 38 81 49 77 44 30
Conclusions China and India currently compete relatively
little, despite being labor-intensive giants Increasing globalization by India looks unlikely to
greatly intensify that competition Higher growth by China and India likely to be
beneficially for the world as a whole, and for most developing countries Especially when improved quality and variety of
exports is considered But substantial adjustments in production and
exports required in some cases