elena ianchovichina the world bank world bank world bank policy ... producers did not get the...
TRANSCRIPT
1
Trade Policy Analysis in the Presence of Duty Drawbacks*
Elena Ianchovichina♣
The World Bank
World Bank Policy Research Working Paper 3312, May 2004 The Policy Research Working Paper Series disseminates the findings of work in progress to encourage the exchange of ideas about development issues. An objective of the series is to get the findings out quickly, even if the presentations are less than fully polished. The papers carry the names of the authors and should be cited accordingly. The findings, interpretations, and conclusions expressed in this paper are entirely those of the authors. They do not necessarily represent the view of the World Bank, its Executive Directors, or the countries they represent. Policy Research Working Papers are available online at http://econ.worldbank.org.
* This paper is a product of the Economic Policy Division, Poverty Reduction and Economic Management Network. I would like to thank William Martin for providing inspiration for this study and comments on earlier drafts of the paper. I am grateful to Thomas Hertel, Terrie Walmsley, and Deepak Bhattasali for their valuable comments, and to Li Yan for helpful advice and data on import tariffs and duty exemptions. ♣ Elena Ianchovichina, MC4-248, World Bank, 1818 H Street, N.W., Washington DC 20433. Tel: +1-202-458-8910. Fax: +1-202-522-1557. Email: [email protected].
Pub
lic D
iscl
osur
e A
utho
rized
Pub
lic D
iscl
osur
e A
utho
rized
Pub
lic D
iscl
osur
e A
utho
rized
Pub
lic D
iscl
osur
e A
utho
rized
Pub
lic D
iscl
osur
e A
utho
rized
Pub
lic D
iscl
osur
e A
utho
rized
Pub
lic D
iscl
osur
e A
utho
rized
Pub
lic D
iscl
osur
e A
utho
rized

2
Trade Policy Analysis in the Presence of Duty Drawbacks
Elena Ianchovichina
Abstract
Duty drawback schemes, which typically involve a combination of duty rebates and exemptions, are a feature of many countries’ trade regimes. They are used in highly protected developing economies as means of providing exporters with imported inputs at world prices, thus increasing their competitiveness, while maintaining the protection on the rest of the economy. In China, duty exemptions have been central to the process of trade reform and have led to a tremendous increase in processed exports utilizing imported materials. Despite the widespread use and importance of duty drawbacks, these “new trade liberalization” instruments have been given relatively little attention in empirical multilateral trade liberalization studies. This paper presents an empirical multi-region general equilibrium model, in which the effects of policy reform are differentiated based on the trade orientation of the firms. The model is useful for analyzing trade liberalization in the presence of duty drawbacks, assessing whether countries should introduce or abolish these types of arrangements, and evaluating the impact of improved duty drawback system administration. The analysis shows that failure to account for duty exemptions in the case of China’s recent WTO accession will overstate the increase in China’s trade flows by 40 percent, welfare by 15 percent, and exports of selected sectors by as much as 90 percent. The magnitude of the bias depends on the level of pre-intervention tariffs and the size of tariff cuts – the larger the initial distortions and tariff reductions, the larger the bias when duty drawbacks are ignored. The bias in the estimates of China’s real GDP, trade flows and welfare changes due to WTO accession increases more than three times when China’s pre-intervention tariffs are raised from their 1997 levels to the much higher 1995 levels. These results suggest that trade liberalization studies, focusing on economies in which protection is high, import concessions play an important role and planned tariff cuts are deep, must treat duty drawbacks explicitly in order to avoid serious errors in their estimates of sectoral output, trade flows and welfare changes.
JEL classification: F11; F13; D58 Key words: Duty drawbacks; Export processing; Duty exemptions; China; General Equilibrium

3
Trade Policy Analysis in the Presence of Duty Drawbacks
1. Introduction
Duty drawback schemes, which typically involve a combination of duty rebates and
exemptions, are a feature of many countries’ trade regimes. They are used in highly protected
developing economies as means of providing exporters with imported inputs at world prices,
and thus increasing their competitiveness, while maintaining the protection on the rest of the
economy. Duty drawback programs have been used with varied degrees of success. While in
many countries duty drawbacks have not been implemented successfully, largely due to
administrative weaknesses, in others these schemes have been very effective in opening up
export-oriented sectors by overriding existing protection. In China, duty exemptions at the point
of entry have been an essential part of the country’s export processing system and trade reform
process.
The legal framework for China’s export processing (EP) system was introduced in
1979 in order to overcome the anti-export bias created by state-managed exchange rate and
pricing policies. In the pre-reform era, exchange rates, indirect trade policy instruments such as
tariffs, and relative prices had little influence on the magnitude and commodity composition of
China’s foreign trade. Firms producing for export sold their products to foreign trade
companies at officially established domestic prices, fixed in domestic currency. Export
producers did not get the foreign exchange income from the sale of their products on
international markets, and thus had little incentive to expand production of goods for which
foreign demand was strong (Lardy 2002). The prices of imports also distorted the distribution
of resources in the economy. Approximately 80 percent of imports were sold in China at prices
similar to those of comparable products, quoted in domestic currency, and adjusted up or down
4
to reflect quality differences. This price setting process isolated domestic firms from the
influence of relative domestic and international price and exchange rate changes. For imports
without domestic equivalents, which accounted for 20 percent of all imports, domestic prices
were based on the cost of imports converted to domestic currency at the official exchange rate.
Since this exchange rate was overvalued, the imports were in effect subsidized. The
consequences of these policies were lagging exports, low growth in trade volume, and a
distorted commodity composition of foreign trade, which did not correspond to China’s
comparative advantage in the production of labor intensive goods.
The EP system helped remedy these problems. Initially the system provided various
incentives for both the processing of raw materials for export and the assembly of imported
parts and components to produce finished goods for export (known as processing and
assembling or processing with supplied materials). As tariffs became very important in the
1980s, these incentives were expanded in 1987 to allow for duty-free imports of all raw
materials and intermediate inputs used in the production of exports. These duty exemptions
contributed strongly to China’s actual collection rate being only one-sixth of its weighted
average tariff rate (World Bank 1994)1 and led to a tremendous increase in processed exports
utilizing imported materials in China. In the span of just three years, processed exports
produced with inputs purchased from abroad almost tripled, increasing from US$140 million in
1988 to US$324 million in 1991, while total exports rose by 50 percent (World Bank 1994). In
2000, EP trade in China accounted for 50 percent of total trade, with EP accounting for 55
percent of total exports. The share of concessional imports in total imports rose from one-third
to around one-half between 1988 and 1991 and has remained around this level since then.
1 Concessional imports cannot alone explain the low collection rates. A collection rate of 5.6 percent represents only 17.5 percent of the trade weighted average tariff of 32 percent for 1991 (World Bank 1994). Other imports by the government such as imports used for priority projects were also exempt. It is also possible that there were other leakages in the revenue collection system.

5
Duty exemptions increase the economy’s competitiveness and efficiency. In the
absence of duty drawbacks the protection of import competing firms is in general positive,
while that of export competing firms is negative (Figure 1).2 This is because export competing
firms face world prices while domestic competing firms are protected by tariffs on final goods.
Duty drawbacks reduce the Effective Rates of Protection (ERPs) for export competing firms to
0,3 which allows export producers to operate at world prices, and halve the standard deviation
in ERPs, which in turn increases the efficiency of the economy.
Despite the presence and vast importance of duty drawbacks in China and other
developing countries, these “new trade liberalization” instruments have been given relatively
little attention both in trade negotiations and in empirical multilateral trade liberalization
studies. A paper by Panagariya (1992) provides a systematic analysis of the effects of
input tariffs and duty drawbacks on welfare, but standard global trade models (Hertel
1997) have abstracted from the presence of concessional imports, while trade liberalization
studies using these models have at best offered only partial solutions to the problem (Bach,
Martin and Stevens 1997). Recently, the topic of concessional import arrangements has been
considered in papers by Gruen (1999), Cadot, de Melo and Olarreaga (2003), and Fan and Li
(2000). Gruen (1999) illustrates the similarities and differences between traditional and “new
trade liberalization” instruments such as export processing zones (EPZs) and duty drawback
schemes, and concludes that in theory both can bring about complete free trade. Cadot et al.
(2000) consider the political economy implications of duty-drawback schemes for the
incentives of export industries to lobby against upstream tariffs on imported intermediates.
2 Figure 1 illustrates these points by showing effective rates of protection (ERP) in China. These ERP are based on protection data in 1995 as presented in version 4 GTAP and are computed for import and export competing firms separately to emphasize differences in protection depending on the orientation of the firms. 3 The ERPs for export processing firms with duty exemptions are close but not exactly zero because the domestic components of value added still have import duties embedded in them.

6
Acknowledging the importance of duty drawbacks for China’s export processing system, Fan
and Li (2000) implement duty exemptions in a one-region recursive dynamic model of China.
This paper presents an empirical multi-region general equilibrium model in which the
effects of policy reform are differentiated based on the trade orientation of the firms. The
resulting model could be used to analyze trade liberalization in the presence of duty drawbacks,
assess whether countries should introduce or abolish these types of arrangements, and evaluate
the economy-wide impact of improved administration of the duty drawback system. The
method is similar to that of Fan and Li (2000), yet it differs in that it allows implementation of
partial and/or full duty drawbacks in any number of regions in an empirical multi-region
general equilibrium model. The model discussed here is designed so that in the absence of duty
exemptions, its solution coincides with the solution of GTAP (Hertel 1997), a widely used
applied general equilbrium model for trade policy analysis. This feature is attractive as it
permits evaluation of various unilateral trade reforms, regional and multilateral trade
agreements under different assumptions for duty drawbacks in different regions within the same
modeling framework.
The importance of duty exemptions for the analysis of China’s WTO accession is
shown by conducting two experiments – one with GTAP, which ignores duty exemptions, and
another one with the model featuring duty drawbacks. The comparison of the results from the
two experiments suggests that findings of studies that have looked at China’s entry to the WTO
without taking into account duty exemptions (Martin et al. 1999; Bach et al., 1996; Walmsley
and Hertel, 2001) may be seriously biased. Failure to take into account duty exemptions on
imports for production of exports in China will overstate the impact of China’s entry to the
WTO on the country’s trade flows and welfare by 40 percent and 15 percent, respectively. The
magnitude of the bias depends on the level of pre-intervention tariffs and the size of tariff cuts –

7
the larger the initial distortions and tariff reductions, the larger the bias when duty drawbacks
are ignored. The bias in the estimates of China’s real GDP, trade flows and welfare changes due
to WTO accession increases more than three times when China’s pre-intervention tariffs are
raised from their 1997 levels to the much higher 1995 levels. These results suggest that trade
liberalization studies focusing on economies, in which protection is high, import concessions
play an important role and planned tariff cuts are deep, must treat duty drawbacks explicitly in
order to avoid serious errors in their estimates of sectoral output, trade flows and welfare
changes.
The paper is structured as follows. Section 2 introduces the general equilibrium model
with duty drawbacks. Section 3 discusses data and parameters for this study. Section 4
illustrates the importance of representing duty exemptions explicitly with an example of the
impact of China’s WTO accession. Section 5 concludes with a summary of the findings.
2. The model
We consider a world with R regions each endowed with F types of endowments and producing
G types of goods. There is a one-to-one correspondence between goods and industries. In each
industry there are two types of competitive firms – export-oriented and domestic-oriented. All
export-oriented firms are identical and form the export-oriented sub-sector of an industry.
Similarly, domestic-oriented firms are identical and form the domestic-oriented sub-sector of an
industry. Both types of firms produce the same commodity using the same technology and are
identical in all respects except one – the export-oriented firms produce exclusively for export
markets using imported intermediates that are either exempt from duties or eligible for refunds
on the import tax paid, while the domestic-oriented firms produce no exports and supply

8
exclusively the domestic market. Production for domestic and export markets is therefore
completely decoupled.
The choice to fully separate domestic and export production simplifies considerably the
representation of duty drawbacks in a large empirical multi-region model. It is preferable to
representations based on a single sector producing differentiated products for domestic and
export markets because it allows the two sectors to use quite different input mixes, and
particularly for the export-oriented activities to use much more import-intensive means of
production. It is also a fairly accurate depiction of the trade regime in countries where duty
drawbacks are used as export promotion instruments while protection on the rest of the
economy is fairly high.4
One of the G industries produces a nontradable investment good, which could be
installed in a domestic or an export-oriented firm. The model captures the fact that a portion of
imported intermediate capital goods are duty exempt. This is an important feature since tax
concessions for imported capital goods are popular in many developing countries. For example,
capital goods brought into China for export processing by foreign-invested enterprises have
been exempt from import duties during most of the 1990s.
Export producers in region r supply jrX of good j to export markets,5 while domestic-
oriented producers supply jrD of good j to local markets. The intermediate input demand for
input i in industry j of region r, ΩijrI , where superscript , XD∈Ω indicates the type of sub-
sector (D stands for the domestic-oriented one, X stands for the export-oriented one), is
4 In a deterministic world, a producer of exports will always take advantage of duty exemptions or duty rebates unless the administrative costs of the export processing arrangements are excessive. 5 The sector producing investment goods is an exception since its exports are zero.

9
proportional to the level of activity in sector j and determined by fixed intermediate input
coefficients ijra :
,jrijrijr aI Ω=Ω (1)
where .,...,1,,...,1, RrGji ∈∈
Firms purchase both foreign and domestic intermediates, which are imperfect
substitutes in a constant-elasticity-of-substitution (CES) composite function (Armington 1969).
Producers for the domestic and export markets minimize unit intermediate input costs subject to
input prices and the CES function that relates the level of activity to intermediate inputs:6
),,( ΩΩΩΩ = Mir
Dir
Iijrijr
Dijr ppaII D (2)
),,( ΩΩΩΩ = Mir
Dir
Iijrijr
Mijr ppaII M (3)
where ,...,1,,...,1, RrGji ∈∈ ; ΩDijrI is the demand of sub-sector , XD∈Ω of industry j
for domestic intermediate i;7 ΩMijrI is the demand of sub-sector , XD∈Ω of industry j for
imported intermediate good i; Dirp is the domestic price of good i in region r, ΩM
irp is the
import price of good i used for final consumption or as intermediate input by sub-sector
, XD∈Ω in region r. Duty drawbacks for imported materials used in the production of exports
imply that the intensity of imported intermediate use by the export sector is higher than the
intensity of imported intermediate use by the sector producing for the local market.
Zero profit for the choice of composite inputs imply that:
),,( ΩΩΩ = Mir
Dir
Ij
Iijr ppcp (4)
6 Functional forms are represented explicitly, but unit demand and supply functions are shown in reduced form, i.e. a(.), where superscripts DI and MI stand for intermediate use of domestic and imported goods, respectively. 7 The first superscript determines whether the intermediate inputs are domestic or imported. The second superscript defines whether they are used by the domestic-oriented sub-sector or the export-oriented sub-sector.

10
where ,...,1,,...,1, RrGji ∈∈ ; (.)ΩI
jc is the unit cost function defined by the CES
aggregates of domestic and imported interemediate inputs for sub-sector , XD∈Ω of
industry j; and ΩI
ijrp is the composite demand price of good i for intermediate use by sub-
sector , XD∈Ω of industry j in region r.
Producers minimize unit factor costs given the vector of factor prices Ffrp and relevant
taxes Ffrt , and a CES function that relates the level of output to the factor inputs. Linear
homogeneity of the production function implies that factor demands of sub-sector , XD∈Ω
in industry j of region r ( ΩfjrF ) can be written as:
),,( Ffr
Ffr
Ffjrjrfjr tpaF ΩΩ Ω= (5)
where superscript F stands for factor use, ,...,1,,...,1,,...,1 RrGjFf ∈∈∈ .
Imports of good i in region r for the production of goods sold domestically and for
exports are CES composites of imports from various sources s, ΩisrM ,8 where , XD∈Ω ,
respectively. Consequently, bilateral imports, determined by cost-minimizing choice, given the
fob export prices Xirp , the export tax rate X
irst , the import tariff rate Mirst and transport costs irsτ ,
are given by:
),,,,(.)( isrMisr
Xisr
Xis
MXisr
j
MXijr
Xisr ttpaIM τ∑= (6)
),,,,().( isrMisr
Xisr
Xis
MDisr
j
MDijr
Mir
Disr ttpaICM τ∑+= (7)
where MirC is consumption of imported good i in region r, ,...,1,;,...,1, RrsGji ∈∈ .
8 Subscript s stands for ‘source’ region, while subscript r stands for ‘destination’ region.
11
Output of the domestic-oriented sub-sector i in region r ( irD ) meets demand for
domestic intermediate products, and final demand for good i in region r:
Dir
j
Dijrir CID += ∑∑ Ω
Ω
)( (8)
where , XD∈Ω , ,...,1,,...,1, RrGji ∈∈ . Output of the export sector meets import
demand of all trading partners:
,)(∑∑ Ω
Ω
=s
irsir MX (9)
where , XD∈Ω , ,...,1,;,...,1 RsrGi ∈∈ .
Primary factor supply is exogenous and equals primary factor demand:
,∑∑ Ω
Ω
=j
fjrfr FF (10)
where , XD∈Ω , ,...,1;,...,1;,...,1 RrGjFf ∈∈∈ .
Competitive producers in both the export-oriented and domestic-oriented sub-sectors
earn zero profit in equilibrium:
,)1()1(∑ ∑ ΩΩ +++= ΩΩ
f j
Ijir
Ijirjir
Ffir
Ffr
Ffirir tpatpap (11)
where , XD∈Ω , ,...,1,,...,1,,...,1, RrFfGji ∈∈∈ ; ΩI
jirt is a tax on intermediate inputs.
In equilibrium, the domestic cif price equals the fob price gross of export tax, the applicable
tariff, and transport costs:
),1()1)](1([ isrs
Misr
Xisr
Xis
MDisr
MDir ttpap τ+++= ∑ (12)
),1)(1()]1([ isrMisr
s
Xisr
Xis
MXisr
MXir ttpap τφ +++= ∑ (13)

12
where ,...,1,,,...,1 RrsGi ∈∈ , φ is a parameter between 0 and 1 that determines the
extent of liberalization of the export processing sector.
If φ is zero, export producers get duty exemptions or full rebates of their import duty.
If 0<φ <1, export producers get partial refunds. If φ =1 import taxes are the same for the export
and domestic sub-sectors. Equations (4), (11) through (13) show that duty drawbacks improve
the exporters’ competitiveness as their costs either do not reflect import duties or reflect
reduced import taxes due to partial duty rebates.
Equations (1) through (13) describe the changes needed in order to implement duty
drawbacks in a standard multi-region applied general equilibrium model. For comparison
purposes all other equations of the model come from the GTAP model (Hertel 1997) and for the
sake of brevity are not shown here.9 The model is implemented in GEMPACK (Harrison and
Pearson 1996). When imported intermediate inputs used by exporting firms are taxed at the
same rates as those used by firms selling locally, tariff cuts on imported intermediate inputs are
the same regardless of their use, and the input composition of the export-oriented sub-sector is
identical to the input composition of the domestic-oriented sub-sector, the solution with this
model is identical to the solution with GTAP; otherwise the solutions differ.
9 A brief summary of these features follows. Consumers and the government receive income from payments for primary factor services and tax revenue, respectively, and save a fixed share of their income. Consumers maximize a constant-difference-elasticity (CDE) demand system, while public consumption is governed by a Cobb-Douglas utility function. As in the case of intermediate inputs, both private and government final demands are a CES composite of domestic and imported products. The consumer price level is the numeraire, and aggregate investment is such that the trade balance is a fixed share of income.

13
3. The data
The experiments assessing the importance of duty drawbacks for the analysis of China’s WTO
accession employ version 5 GTAP database (Dimaranan and McDougall 2002), aggregated to
20 regions (Table 1) and 25 sectors (Table 2). Some tax rates in China were changed using the
approach in Malcolm (1998)10 in order to reflect the following additional information: export
subsidies for feedgrains and plant-based fibers at 32% and 10%, respectively, and nominal
protection rates for agricultural commodities as suggested by Huang et al. (2002) (Table 4,
column 2); the tax rate on unskilled nonagricultural labor at 34% as in Ianchovichina and
Martin (2003) and based on information in Shi Xinzheng (2002), export taxes on textiles and
apparel exports to the United States at 11% and 15%, respectively, and to the European Union
at 12% and 15%, respectively.11
Since the GTAP data do not distinguish inputs based on whether they are used for
export or domestic production, it was necessary to split the factor and intermediate input usage
of each sector and region into domestic-oriented and export-oriented firms’ usage. For China,
ideally, we would like to use information on duty exempt imports by product and sector use and
factor usage by sector and sub-sector (for export or domestic use). This information is typically
difficult to obtain. China Customs, for instance, keeps track of imported intermediate input use
by product, but not by sector. Initially the data on imported intermediate inputs in GTAP were
split using information on duty-exempt imports by product in China at the HS2 level from
China Customs. However, resulting data could not be employed in the analysis because they
did not contain information on duty-exempt imports by sector use and the commodity classes at
10 This approach ensures that the adjustment are made while preserving the share information in the data base. 11 The export tax equivalents were estimated and used by Ianchovichina and Martin (2003).

14
the level of aggregation for China Customs data often overlapped two or more GTAP
categories. Moreover, the reported imports of duty-free intermediate inputs for export
production from China Customs exceeded the total intermediate use obtained from China’s
input-output tables in the GTAP data.
Several explanations come to mind, including data error, strong substitution toward the
duty-free intermediates in the export processing sectors, and fraudulent misclassification of
intermediates not destined for export processing.12 As a result of these problems, the data set
for the new model produced with this external information seriously distorted the original
input-output and tax information in the GTAP data base.
In order to get around this problem and the lack of data, the domestic and export sub-
sectors were initially created by dividing each sector’s intermediate and factor input use in
proportion to the domestic and export shares of output in a region.13 Since data sources suggest
that nearly all imports purchased for production of capital goods in China were subject to duty
exemptions,14 we assume that the capital goods sector in China uses only duty exempt imported
capital intensive manufactures. To preserve the tax information in the GTAP data, factor
endowment, imported and domestic intermediate input use of the export and domestic-oriented
sub-sectors at market prices are computed in the same way as the corresponding input use at
12 There is evidence that smuggling and various violations of the export processing regulations are common forms of fraud and account for approximately half of all trade related fraud. Estimates, based on data gathered by Naugton (2000) during interviews with Chinese officials in 1999, suggest that in the late nineties the value of all trade related fraud in a year was well over US$ 10 billion. Companies might under-invoice imports in order to use part of the undeclared materials to produce for the domestic market. Companies might over-invoice imports when they intend to either over-invoice exports, which is most common, or over-report the unit consumption of materials and use the over-invoiced portion to produce for the domestic market (Ianchovichina 2001). 13 This method ensures that, for regions other than China, the treatments in GTAP and the new model are identical when tariffs and tariff reductions for imported intermediate inputs for export and domestic use are the same. 14 According to GTAP 11 percent of total imports are used in the production of capital goods and according to the China Council (2001) 13 percent of imports are duty free imports used in the production of investment goods.

15
agents’ prices. Imports of commodity i into region s used for production of exports and for
domestic sales by source r were computed from the data on bilateral imports by commodity in
GTAP as follows :
irsisXirs MM γ= ,
irsisDirs MM )1( γ−= ,
where ,...,1 Gi∈ , ,...,1, Rsr ∈ , irsM are bilateral imports of good i from region r into
region s in the GTAP database, and ∑∑
=
rirs
j
MXijs
is M
Iγ , where ,...,1 Gj∈ .
This approach ensures that the sum of imported intermediates i by exporters in region s
equals the sum of imported intermediates i from all regions r into region s. Similarly, the sum
of imported intermediates i by domestic-oriented producers in region s and imports of good i
for final consumption equals the sum of imports of good i used for domestic use from all
regions r into region s.
The next step was to eliminate tariffs on intermediate manufactured imports used in the
production of exports in the newly created database using the approach in Malcolm (1998),
modified so that all elasticities of subsitution except those between domestic and intermediate
goods in China were set to 1. The elasticity of substitution between domestic and intermediate
goods in China was set at twice its value in the GTAP database. This approach increased the
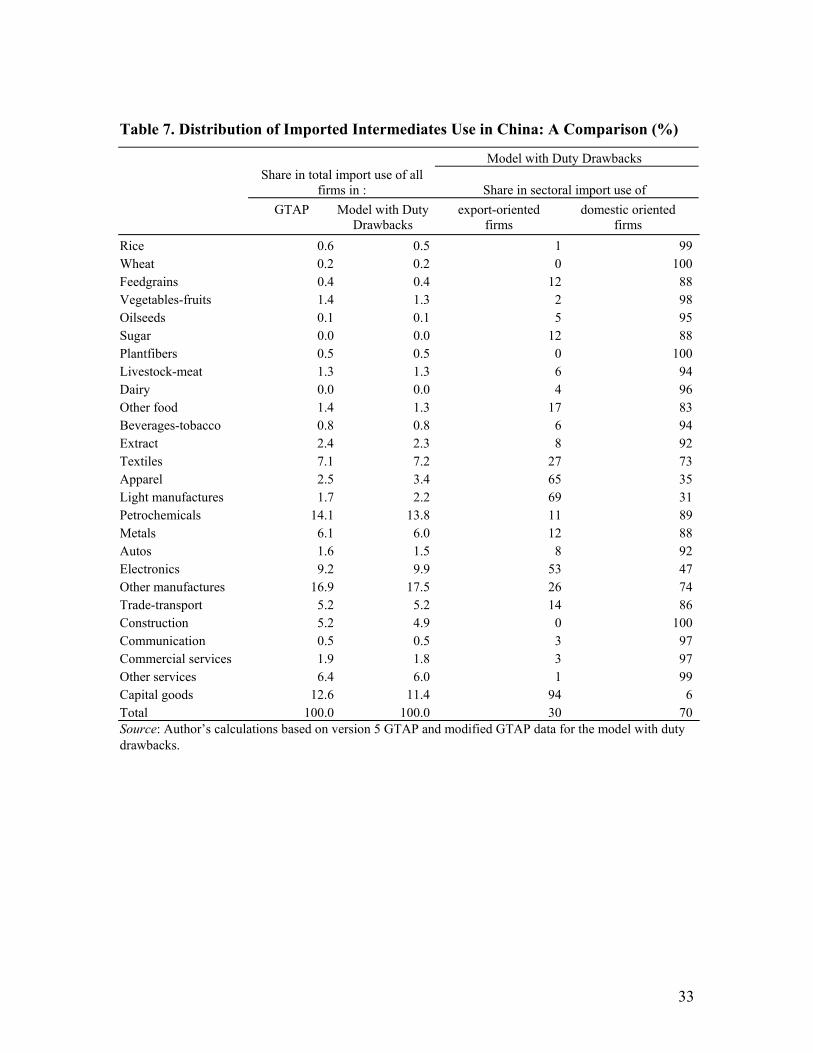
import-intensity of the exporting sectors as tariffs on imports used for export processing were
eliminated. It raised the share of imports used by the export activities in China to 30 percent
(Table 7), while preserving key aggregate statistics of the GTAP database (Table 1; columns 3

16
and 4 of Table 2; last row of Table 3; Table 7). China’s sectoral shares in world output, exports
and imports were changed somewhat, but in all cases these changes were negligible (Table 3).
In the new data, import taxes on imports for domestic use were preserved and equal to
the import tax rates on imports in version 5 GTAP database, while taxes on manufactured
imports for the production of exports were set at zero (Table 4). Import taxes on farm products
were left unchanged since evidence suggested limited use of duty exemptions for farm
imports.15 Protection on cross-border trade in services also do not differ based on the trade
orientation of the firms.
All parameters for the two experiments come from version 5 GTAP data (Dimaranan
and McDougall 2002). These include the Allen partial elasticities of substitution that describe
the substitutability between domestic and imported intermediates, the substitutability between
imported intermediates from different sources, and the substitutability between primary factors.
Furthermore, the Allen partial elasticities of substitution in the domestic-oriented sub-sector of
a sector are the same as those in the export-oriented sub-sectors of the economy. This reflects
the assumption that all firms are identical and facilitates the comparison between GTAP and the
model with duty drawbacks.16
4. Analysis of China’s WTO Accession
The importance of duty drawbacks for the analysis of policy reform is illustrated by evaluating
the impact of China’s WTO accession first using the GTAP model, and then the model with
15 A number of farm products are still subject to state trading (World Trade Organization 2001). More recently, Huang et al. (2002) show that a number of products faced negative protection rates (Table 4). 16 The assumption ensures that in the absence of duty exemptions and conditional on the assumptions listed above, the solution to the model with duty drawbacks coincides with the solution to the GTAP model.

17
duty drawbacks in section 2. The comparison of the results from the two models suggests that
results of studies which have abstracted from China’s duty exemptions when analyzing China’s
entry to the WTO (Martin et al. 1999; Bach et al. 1996; Walmsley and Hertel 2001) may be
seriously biased. The presence of duty exemptions is an important determinant of the outcome
of trade liberalization. With duty exemptions on imported inputs for export processing, the
liberalization in China affects only intermediate imports for domestic use and imports for final
consumption. Therefore, its impact on output, trade flows and welfare is smaller than the one,
captured with GTAP which abstracts from duty exemptions. The impact is significantly smaller
for those industries that rely heavily on imported intermediates.
4.1 Experimental design
The simulation design for the pair of experiments follows closely Ianchovichina and Martin
(2003), but for simplicity and comparison purposes the changes associated with accession are
evaluated in a comparative static context. Both experiments are designed to reflect the impact
of WTO accession which involves (a) liberalization from 1997 tariffs to post accession tariff
rates (2007) (Table 4);17 (b) the elimination of quotas on China’s textile and clothing exports to
the US and EU markets; 18 (c) the removal of agricultural export subsidies for feedgrains and
plant-based fibers (cotton) in China (Huang et al. 2002); (d) the liberalization of China’s cross-
border trade in services; and (e) the restructuring of the Chinese automobile sector19 (Francois
and Spinanger 2002). The two experiments differ only in that tariff cuts in GTAP are the same
17 China’s own protection is reduced to the lesser of the tariff binding or the 2001 applied rate. The experiment features also tariff cuts as part of Chinese Taipe’s accession to the WTO. 18 Quotas on textile and apparel exports have been represented in the analysis as if they were an export tax. 19 The restructuring of the automobile sector is represented as a 20 percent productivity gain to car assembly operations.
18
for all imports regardless of their use, whereas tariff cuts on manufactured imports used by the
export processing sector are zero in the model with duty exemptions (Table 4).
The macroeconomic closure assumes full employment, perfect mobility of skilled and
unskilled workers between sectors, and fixed trade balance as a share of GDP in China and
Chinese Taipei.20 Since accession to the WTO involves a long run change in the stance of trade
policy the elasticity of substitution between imported goods from different sources and between
composite imported and domestic goods in the GTAP data base were doubled.
4.2 Results
China’s output, export, and import changes due to WTO accession, obtained with GTAP and
the model with duty drawbacks, are shown in Table 5. Columns 4, 7 and 10 of Table 5 show the
bias introduced in the results when duty exemptions are not considered in the analysis. Both
models lead to very similar estimates of world output change. The increase in China’s real GDP
due to the country’s accession to the WTO is small reflecting the fact that both models do not
include the linkage between trade reform and productivity growth.
At the sectoral output level, however, China’s WTO accession boosts production in a
number of sectors, including apparel, textiles, cotton and automobiles. Automobile
manufacturing gets a boost as a result of the assumed increase in productivity of assembly-type
operations and the tariff reductions on imported intermediate inputs such as auto parts. The
expansion of the apparel industry is associated with the lifting of the burdens imposed by the
MFA on China’s exports and domestic protection on the cost structure of the industry. This
expansion in apparel in turn boosts China’s textiles and cotton sectors. 20 While the trade balance can be expected to vary, particularly if there is a substantial change in foreign investment levels, there is no link between the change in foreign investment and the chage in income in GTAP and the new model.

19
The results from the two models differ quantitatively. With GTAP accession to the
WTO leads to an increase in China’s apparel output by 96 percent (column 5, Table 5), while
with the model with duty drawbacks this increase is 81 percent. This implies that with GTAP
the increase in China’s output of apparel is approximately 20 percent higher than the one
predicted with the duty drawbacks model, which captures the expansion of apparel as a result of
export quota removal while taking into account duty exemptions on imported inputs used in the
production of apparel exports. These exemptions have essentially opened up the export-oriented
apparel sector as they affected two-thirds of intermediate inputs in the apparel industry, and
imply that the output increases are attributed mainly to the lifting of the burdens imposed by the
MFA on China’s apparel exports.
In some cases the results with the two models differ not only quantitatively, but also
qualitatively. Given the large importance of export processing arrangements and duty
exemptions in the electronics sector (Table 2) and the significant tariff cuts on electronic
products (Table 4), the model with duty drawbacks suggests a small contraction in the output of
electronics due to China’s WTO accession. By contrast GTAP misses the effect of duty
exemptions on output and estimates a small export-driven increase in electronics output (Table
5).
The impact of WTO accession on China’s share in world trade is much stronger than
the one on China’s share in world output (Table 5). According to GTAP, China’s exports and
imports rise by 32 percent due to accession.21 The model with duty drawbacks also estimates a
strong, however, more modest increase in China’s exports and imports (23 percent) because it
21 The similar increase in imports and exports reflects the assumption that China’s trade balance is a fixed share of GDP.
20
allows for the partial liberalization implicit in the exemption scheme on intermediate inputs
used in the production of exports.
A comparison of the sectoral trade flow changes suggests that for some sectors – for
example, electronics – the bias introduced by ignoring duty exemptions in China could be
significant – a difference of 26 percent in the estimated percentage changes with the two
models or an increase in exports with the duty drawbacks model that is 90 percent smaller than
the one with GTAP. In the case of apparel, there is a 13 percent difference in the estimated
percentage changes with the two models or an increase in exports with the new model which is
45 percent smaller than the one with GTAP. For these sectors the export expansion with the
model with duty drawbacks is strong, but much less so than with GTAP because duty
exemptions have already removed much of the burden of protection on the export sector in
China and any benefits of tariff cuts have a smaller, indirect impact. Failure to take into account
duty exemptions on imported inputs used in the production of exports also leads to serious bias
in the estimation of import changes for a number of products among which textiles (18
percent), apparel (16 percent), automobiles (15 percent), light manufactures (16 percent) and
other manufactures (11 percent) (Table 5).
Table 6 shows regional welfare changes due to China’s entry to the WTO computed
with GTAP (column 2) and the model with duty drawbacks (column 3). While qualitatively the
changes in regional welfare are broadly the same, quantitatively the results differ substantially.
Indeed, GTAP overestimates China’s welfare gain by almost 15 percent. This is due to an
upward bias in the allocative efficiency gain most of which is due to gains in textiles (46
percent), apparel (23 percent), electronics (13 percent) and other manufactures (11 percent)
(last column of Table 6). The presence of a well functioning duty exemption scheme implies
that to a large extent China’s liberalization has already been captured prior to accession, and

21
therefore the allocative efficiency gains associated with an improved allocation of resources
across sectors due to WTO accession will be smaller than suggested by GTAP.
For other regions, this implies that the change in their welfare will be mainly due to the
removal of restrictions on Chinese exports and not so much to removal of China’s import
tariffs. This, in turn, translates into smaller gains for developed countries and smaller loses for
developing countries when duty exemptions are modeled explicitly. As a result the global
welfare gain with GTAP is approximately 30 percent larger than the gain estimated with the
model with duty drawbacks.
4.3 Size of the bias and initial protection
The degree of bias in estimating the changes due to trade reform with GTAP depends on the
magnitude of the initial tariffs and tariff cuts – the larger the initial distortion and tariff
reduction, the larger the bias when duty exemptions are ignored. The increase in the bias results
from the fact that GTAP captures additional cost saving and efficiency gains associated with
the rise in initial distortions and tariff cuts since it does not take into account duty exemptions
for export processing.
In China weighted average tariffs in 1997 were much lower than tariffs in 1995 (Table
8). Consequently, the bias in the estimated impact of tariff reductions from 1995 to post
accession tariff levels with GTAP would be much larger than the bias in the estimated impact
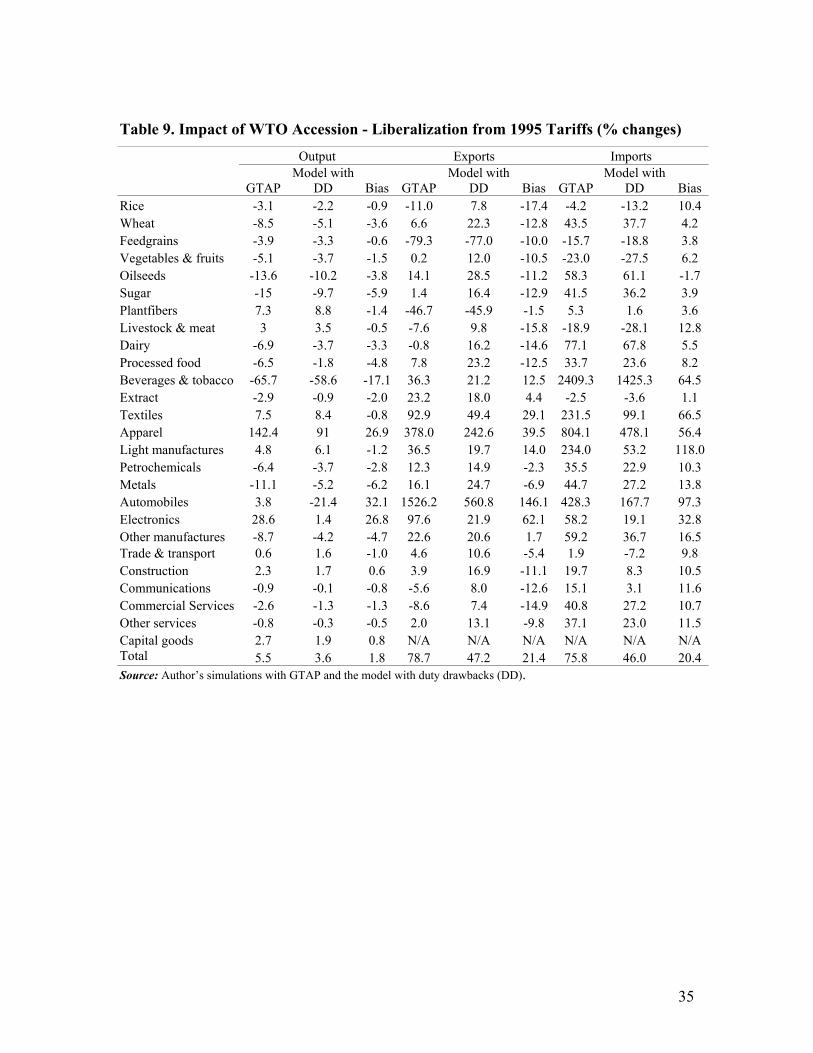
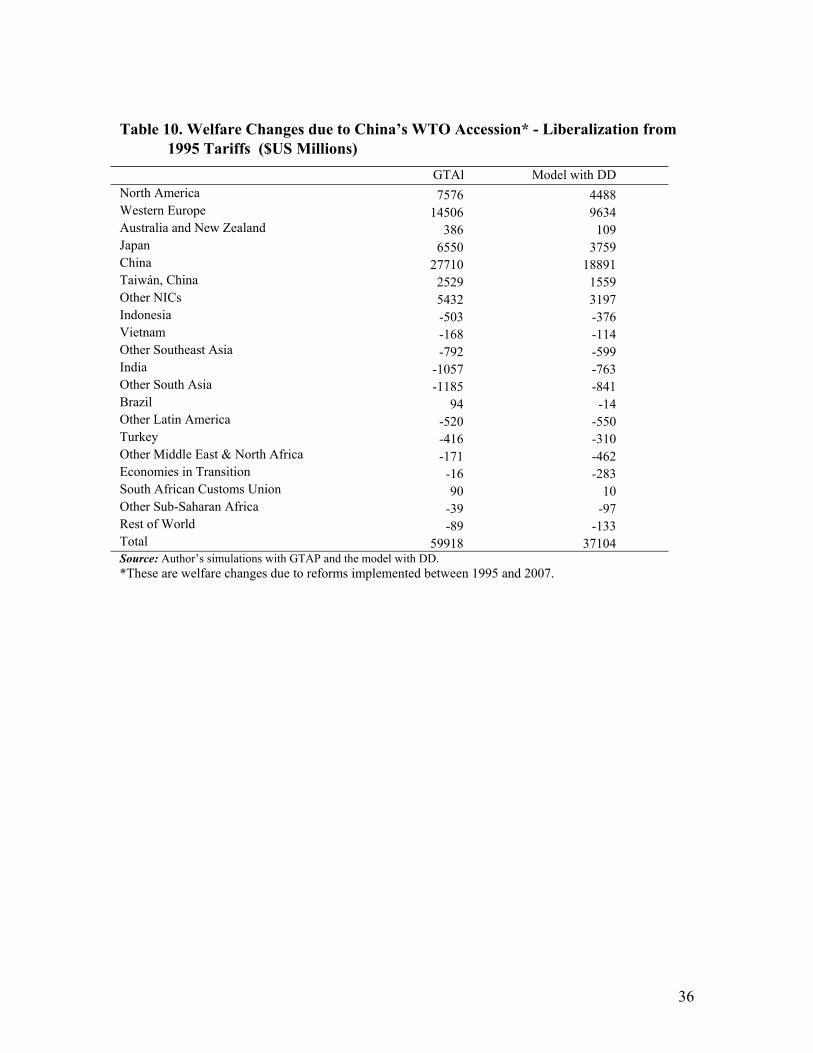
of tariff cuts from 1997 to post accession tariffs. Tables 9 and 10 show changes in output,
trade, and welfare due to WTO accession, which involves liberalization from 1995 tariff levels.
The experimental design is identical to the one presented in section 4.1 except for the tariff
cuts, which are larger than the ones applied earlier since tariffs in 1995 were higher than tariffs
in 1997 (Table 8). Results in Tables 9 and 10 suggest that the bias in GTAP’s estimates of

22
China’s real GDP, trade flows and welfare changes due to WTO accession increases more than
3 times when China’s pre-intervention tariffs are raised from their 1997 levels to the much
higher levels in 1995. For example, GTAP overestimates China’s welfare gain due to WTO
accession from 1995 tariffs by 48 percent (Table 10), whereas the bias in the estimated gain due
to WTO accession from 1997 tariffs is just 15 percent (Table 6). This increase in the bias in the
estimated welfare gain is due to the fact that in the face of larger initial distortion and tariff cuts
the GTAP model estimates a much larger (4 times) second best efficiency gain as it ignores the
fact that the export sector benefits from duty exemptions on imported intermediate inputs.
The bias in the sectoral results is also worse in the case of liberalization from 1995
tariffs compared to liberalization from 1997 tariffs. It is largest for sectors in which 1995 tariffs
are much larger than 1997 tariffs. The bias doubles in the case of electronics and triples in the
case of apparel. It is 46 times larger in the case of automobile output and 15 times larger in the
case of automobile exports and imports (Tables 5 and 9).
5. Conclusions
Concessional import rights, such as duty exemptions, which override existing protection, have
been an important element of the process of gradual trade liberalization that has boosted growth
in China and other countries. Despite their vast importance, duty drawbacks have been given
relatively little attention in trade negotiations and multilateral trade liberalization studies.
Standard global trade models have largely abstracted from the presence of concessional
imports, while trade liberalization studies using these models have at best only acknowledged
their importance and have not offered an in-depth solution to the problem.
This paper presents a model with duty drawbacks in which the effects of policy reform
are differentiated based on the trade orientation of the firms. The model treats explicitly both

23
duty drawbacks on imported intermediate inputs and investment goods used for the production
of exports. The paper evaluates the importance of duty exemptions in China by assessing the
impact of China’s WTO accession, which involves liberalization from 1997 to post-accession
tariffs among a number of other liberalization measures, on the country’s output, trade and
welfare. The analysis, which uses first GTAP and then the model with duty drawbacks,
suggests that the absolute magnitudes of changes in sectoral output and trade flows due to
accession are larger, sometimes substantially, with GTAP compared to those with the duty
drawbacks model. The analysis shows that failure to account for duty exemptions in the case of
China’s recent WTO accession will overstate the increase in China’s aggregate trade flows by
40 percent and China’s welfare by 15 percent. This reflects the fact that duty exemptions have
reduced substantially border protection in China prior to WTO accession. Consequently, any
boost to trade and efficiency gains associated with an improved allocation of resources across
sectors due to WTO accession will be smaller with the proposed model than with GTAP.
The magnitude of the bias in estimating the changes due to trade reform with GTAP
depends on the level of initial tariffs and the size of the tariff cuts – the larger the initial
distortion and tariff reductions, the larger the bias when duty exemptions are ignored. The bias
in GTAP’s estimates of China’s real GDP, trade flows and welfare changes due to WTO
accession increases by more than three times when China’s pre-intervention tariffs are raised
from their 1997 levels to the much higher 1995 levels. These results suggest that trade
liberalization studies focusing on economies in which protection is high, import concessions
play an important role, and planned tariff cuts are deep must always treat duty drawbacks
explicitly in order to avoid serious errors in their estimates of sectoral, trade flow, and welfare
changes.

24
References
Armington, P. 1969. ‘A theory of Demand for Products Distinguished by Place of Production’, IMF Staff Papers, 16:159-178.
Bach, C., Martin, W. and Stevens, J. 1996. ‘China and the WTO: tariff offers, exemptions and welfare implications’ Weltwirtschaftliches Archiv 132(3):409-31.
Cadot, O., de Melo, J. and Olarreaga, M. 2003. ‘The Protectionist Bias of Duty Drawbakcs: Evidence from Mercosur’, Journal of International Economics, 59(1), pp. 161-82.
China Council. 2001. China Business Guide, China Council for the Promotion of International Trade / China Chamber of International Commerce (eds), Beijing, China.
Dimaranan, B. and R. McDougall 2002.Global Trade, Assistance, and Production: The GTAP 5 Data Base, Center for Global Trade Analysis, Purdue University.
Fan, Zhai and Li, S. 2000. ‘The Implications of Accession to WTO on China’s Economy’, paper presented at the Third Annual Conference on Global Economic Analysis, Melbourne, Australia, June 27-30, 2000.
Francois, J. and Spinanger, D. 2002. ‘The Motor Vehicle Sector in China and WTO Accession,’ paper presented at the Seminar on WTO Accession, Policy Reform and Poverty Reduction in China, World Bank, Beijing, June 28-29, 2002.
Gruen, N. 1999. “Towards a More General Approach to Trade Liberalization” The Economic Record 75:385-396.
Harrison, J. and Pearson, K. 1996. ‘Computing Solutions for Large General Equilibrium Models Using GEMPACK’, Computational Economics 9(2), pp. 83-127.
Hertel, T. 1997. Global Trade Analysis: Modeling and Applications, Cambridge University Press, Cambridge.
Huang, J., Rozelle, S. and Min, C. 2002. ‘The Nature of Distortions to Agricultural Incentives in China and Implications of WTO Accession’, paper prepared for the conference WTO Accession, Policy Reform and Poverty Reduction, Beijing, June 26-28, 2002.
Ianchovichina, E. 2001. ‘China’s WTO Accession and Export Processing Trade’, mimeo, World Bank.
Ianchovichina, E. and Martin, W. 2001. ‘Trade Liberalization in China’s Accession to WTO’, Journal of Economic Integration 16(4), pp. 421-445.
Ianchovichina, E. and Martin, W. 2003. ‘Economic Impacts of China’s Accession to the World Trade Oragnization’, Policy Research Working Paper No. 3053, The World Bank, Poverty Reduction and Economic Management Network, Economic Policy Division and Development Research Group, Trade.

25
Lardy, N., 2002. ‘Trade Reforms Prior to Entering the WTO’, Chapter 2 in Lardy, ed. Integrating China in the Global Economy, Washington, D.C.: Brookings Institution Press.
Malcolm, G. 1998. “ Adjusting Tax Rates in the GTAP Database” GTAP Technical Paper No. 12, Center for Global Trade Analysis, Purdue University (www.gtap.org).
Martin, W., Dimaranan, B. and Hertel, T. 1999. “Trade Policy, Structural Change and China’s Trade Growth” Paper presented to the Conference on Policy Reform in China, Center for Research on Economic Development and Policy Reform, Stanford University, November 18-20.
McDougall, R., Elbehri, A. and Truong, T. 1998. Global Trade, Assistance and Protection: The GTAP 4 Data Base. Center for Global Trade Analysis, Purdue University.
Naughton, B., 2000. “China’s Trade Regime on the Eve of WTO Accession: Achievements, Limitations, and Implications for the US,” Forthcoming in Ted Galen Carpenter and James Dorn, eds. China’s Future: Constructive Partner or Emerging Threat? Washington, D.C.: Cato Institute, July 2000.
Panagaryia, A. 1992. ‘Input Tariffs, Duty Drawbacks, and Tariff Reforms,” Journal of International Economics 32(1-2), pp. 131-147.
Shi, Xinzheng (2002), ‘Empirical Research on Urban-Rural Income Differentials: A Case of China,’ mimeo, Peking University.
Walmsley, T. L. and Hertel, T.W. 2001. China's Accession to the WTO: Timing is Everything, World Economy 24(8), pp. 1019-49.
World Bank 1994. China: Foreign Trade Reform. Washington DC: World Bank.
World Trade Organization 1994. The Results of the Uruguay Round of Multilateral Trade Negotiations. Geneva: World Trade Organization.
World Trade Organization 2001. ‘Draft Report of the Working Party on the Accession of China,’ (www.insidetrade.com).

26
Figure 1. China’s Effective Rates of Protection in 1995.
Source: Calculations by Emiko Fukase based on version 4 of GTAP database, 1995 tariff rates.
-120
-100
-80
-60
-40
-20
0
20
40
60
80
food grains
feedgrains
oilseeds
meatlstk
dairy
othagr
extract
woodpaper
pchemineral
metals
electronics
othmnfcs
Sectors
%
Imp. Competing Firm Exp. Competing Firm

27
Table 1. Key dimensions of version 5 GTAP data (in italics) and modified data for the model with duty drawbacks (shares of GDP) Regions Private
Consumption Investment Government
Consumption Exports Imports
North America 0.68 0.18 0.15 0.14 0.15 0.68 0.18 0.15 0.14 0.15 Western Europe 0.61 0.19 0.19 0.31 0.30
0.61 0.19 0.19 0.31 0.30 Australia/New Zealand 0.62 0.22 0.17 0.20 0.20
0.62 0.22 0.17 0.20 0.20 Japan 0.60 0.29 0.10 0.12 0.10
0.60 0.29 0.10 0.12 0.10 China 0.48 0.36 0.12 0.30 0.27
0.48 0.36 0.12 0.30 0.27 Taiwan 0.57 0.20 0.14 0.46 0.37
0.57 0.20 0.14 0.46 0.37 Other NICs 0.57 0.38 0.11 0.52 0.58
0.57 0.38 0.11 0.52 0.58 Indonesia 0.64 0.29 0.07 0.27 0.27
0.64 0.29 0.07 0.27 0.27 Vietnam 0.71 0.33 0.10 0.43 0.57
0.71 0.33 0.10 0.43 0.56 Other Southeast Asia 0.55 0.34 0.11 0.61 0.61
0.55 0.34 0.11 0.61 0.61 India 0.65 0.24 0.12 0.12 0.12
0.65 0.24 0.12 0.12 0.12 Other South Asia 0.76 0.19 0.09 0.17 0.21
0.76 0.19 0.09 0.17 0.21 Brazil 0.64 0.20 0.18 0.08 0.10
0.64 0.20 0.18 0.08 0.10 Other Latin America 0.75 0.21 0.08 0.19 0.22
0.75 0.21 0.08 0.19 0.22 Turkey 0.67 0.26 0.12 0.23 0.28
0.67 0.26 0.12 0.23 0.28 Other Middle East & N. Africa 0.57 0.22 0.22 0.33 0.33
0.57 0.22 0.22 0.33 0.33 Economies in Transition 0.64 0.22 0.16 0.31 0.32
0.64 0.22 0.16 0.31 0.32 S. African Customs Union 0.59 0.18 0.21 0.26 0.24
0.59 0.18 0.21 0.26 0.24 Other Sub-Saharan Africa 0.76 0.16 0.12 0.27 0.31
0.76 0.16 0.12 0.27 0.31 Rest of World 0.78 0.18 0.10 0.15 0.21 0.78 0.18 0.10 0.15 0.21 Total 0.63 0.22 0.15 0.22 0.22 0.63 0.22 0.15 0.22 0.22 Source: Author’s calculations based on version 5 GTAP data and modified GTAP data for the model with duty drawbacks.

28
Table 2. Distribution of Imported Intermediates Use by Sector in China (%) Model with duty
drawbacks GTAP Model with duty
drawbacks Share in total import use
of Share in sectoral import
use of Export-
oriented frims
Domestic oriented
firms
All firms All firms Export-oriented
firms
Domestic oriented
firms Rice 0.0 0.7 0.5 0.6 1 99 Wheat 0.0 0.2 0.2 0.2 0 100 Feedgrains 0.2 0.5 0.4 0.4 12 88 Vegetables-fruits 0.1 1.8 1.3 1.4 2 98 Oilseeds 0.0 0.1 0.1 0.1 5 95 Sugar 0.0 0.0 0.0 0.0 12 88 Plantfibers 0.0 0.7 0.5 0.5 0 100 Livestock-meat 0.3 1.7 1.3 1.3 6 94 Dairy 0.0 0.0 0.0 0.0 4 96 Other food 0.7 1.6 1.3 1.4 17 83 Beverages-tobacco 0.2 1.1 0.8 0.8 6 94 Extract 0.6 3.0 2.3 2.4 8 92 Textiles 6.5 7.5 7.2 7.1 27 73 Apparel 7.3 1.7 3.4 2.5 65 35 Light manufactures 5.1 1.0 2.2 1.7 69 31 Petrochemicals 4.9 17.6 13.8 14.1 11 89 Metals 2.4 7.5 6.0 6.1 12 88 Autos 0.4 2.0 1.5 1.6 8 92 Electronics 17.5 6.7 9.9 9.2 53 47 Other manufactures 15.3 18.4 17.5 16.9 26 74 Trade-transport 2.4 6.4 5.2 5.2 14 86 Construction 0.1 7.0 4.9 5.2 0 100 Communication 0.1 0.7 0.5 0.5 3 97 Commercial services 0.2 2.5 1.8 1.9 3 97 Other services 0.2 8.5 6.0 6.4 1 99 Capital goods 35.4 1.0 11.4 12.6 94 6 Total 100.0 100.0 100.0 100.0 30 70 Source: Author’s calculations based on version 5 GTAP data and modified GTAP data for the model with duty drawbacks.

29
Table 3. China’s Shares of World Output, Exports and Imports in 1997 (Percent) Output Exports Imports GTAP Modelwith
DD GTAP Model with
DD GTAP Model with
DD Rice 19.3 18.8 6.2 6.2 3.1 2.8 Wheat 10.7 10.5 0.1 0.1 3.1 2.9 Feedgrains 9.0 8.9 6.1 6.1 3.1 3.0 Vegetables & fruits 17.7 17.3 2.9 2.9 1.3 1.2 Oilseeds 8.5 8.4 1.8 1.8 8.3 7.9 Sugar 1.1 1.1 1.3 1.3 2.0 1.9 Plantfibers 15.0 14.4 0.0 0.0 13.2 12.3 Livestock & meat 8.8 8.6 3.9 3.9 2.9 2.6 Dairy 0.6 0.6 0.2 0.2 0.7 0.7 Processed food 3.4 3.4 3.2 3.2 3.2 3.1 Beverages & tobacco 6.7 6.5 2.1 2.1 2.6 2.7 Extract 8.5 8.4 1.5 1.5 2.1 2.0 Textiles 15.7 14.9 10.8 10.6 10.6 11.4 Apparel 9.7 9.6 18.7 18.7 1.5 1.6 Light manufactures 18.7 18.2 27.6 27.4 3.4 3.8 Petrochemicals 7.5 7.4 2.9 2.9 5.0 4.9 Metals 6.9 6.8 3.3 3.3 4.4 4.2 Automobiles 2.1 2.1 0.3 0.3 1.0 0.9 Electronics 4.5 4.3 4.5 4.4 4.2 4.3 Other manufactures 6.4 6.3 4.2 4.2 3.9 3.7 Trade & transport 2.3 2.2 3.3 3.3 2.7 2.5 Construction 5.0 5.0 1.5 1.5 4.1 3.8 Communications 2.4 2.4 1.3 1.3 1.4 1.3 Commercial Services 0.9 0.9 0.5 0.5 0.9 0.9 Other services 2.0 2.0 0.8 0.8 1.5 1.4 Total 4.1 4.0 3.9 3.8 3.5 3.5
Source: Author’s calculations with GTAP and the model with duty drawbacks (DD).

30
Table 4. Pre- and post-accession import protection (tariff or tariff equivalent) China Chinese Taipei For domestic use For export processing 1997 Post-
accession 1997 Post-
accession 1997 Post-
accession Rice -5.0 -3.3 -5.0 -3.3 2.2 0.0Wheat 25.0 12.0 25.0 12.0 6.5 6.5Feedgrains 20.0 32.0 20.0 32.0 1.0 0.0Vegetables & fruits -10.0 -4.0 -10.0 -4.0 35.7 16.0Oilseeds 30.0 3.0 30.0 3.0 1.8 0.2Sugar 44.0 20.0 44.0 20.0 21.9 22.7Plantfibers 20.0 20.0 20.0 20.0 0.0 0.0Livestock & meat -20.0 -15.0 -20.0 -15.0 7.5 4.0Dairy 30.0 11.0 30.0 11.0 16.6 5.9Processed food 35.1 9.9 0.0 0.0 14.9 9.9Beverages & tobacco 63.2 15.6 0.0 0.0 48.1 13.0Extract 0.7 0.6 0.0 0.0 5.5 4.1Textiles 25.1 8.9 0.0 0.0 6.1 5.6Apparel 31.7 14.9 0.0 0.0 12.8 11.2Light manufactures 12.1 8.4 0.0 0.0 4.0 3.4Petrochemicals 13.1 7.1 0.0 0.0 4.2 2.9Metals 9.7 5.7 0.0 0.0 4.0 1.5Automobiles 34.4 13.8 0.0 0.0 23.9 13.3Electronics 11.9 2.3 0.0 0.0 2.9 0.3Other manufactures 13.0 6.6 0.0 0.0 4.4 2.1Trade & transport 1.9 0.9 1.9 0.9 1.3 0.7Construction 13.7 6.8 13.7 6.8 5.9 2.9Communications 9.2 4.6 9.2 4.6 9.2 4.6Commercial Services 29.4 14.7 29.4 14.7 3.7 1.9Other services 24.5 12.7 24.5 12.7 7.1 3.5Total – Agriculture 4.2 3.6 1.7 1.0 9.1 4.6Total – Manufactures 15.0 6.9 0.0 0.0 6.3 3.5Total merchandise trade* 14.4 6.8 0.0 0.0 6.5 3.6Source: Version 5 GTAP for protection in 1997 and Ianchovichina and Martin (2003) for post-accession protection. *The estimates in the table are based on trade weights for the respective years. If trade weights for 2000 at the six-digit level of the harmonized system are used the total weighted average tariffs in 2001 and 2007 are 12.2% and 6.3%, respectively, for China, and 4.5% and 3.1%, respectively, for Chinese Taipei.

31
Table 5. Impact of Accession on Output, Exports and Imports (% changes)
Output Exports Imports
GTAP Model
with DD Bias* GTAP Model
with DD Bias GTAP Model
with DD Bias Rice -1.9 -1.6 -0.3 -7.5 -4.0 -3.6 -6.9 -8.7 2.0Wheat -10.9 -9.9 -1.1 19.9 21.9 -1.6 29.1 28.9 0.2Feedgrains -4.6 -4.7 0.1 -77.9 -77.6 -1.3 -15.7 -16.5 1.0Vegetables & fruits -3.9 -3.4 -0.5 1.9 3.0 -1.1 -20.5 -21.5 1.3Oilseeds -15.1 -14.3 -0.9 26.0 27.8 -1.4 42.8 44.7 -1.3Sugar -12.4 -11.0 -1.6 5.5 7.5 -1.9 38.8 37.8 0.7Plantfibers 16.6 15.8 0.7 -55.5 -56.0 1.1 15.8 13.6 1.9Livestock & meat 2.6 2.5 0.1 4.4 1.8 2.6 -26.2 -27.9 2.4Dairy -8.1 -7.3 -0.9 7.3 6.3 0.9 65.3 64.2 0.7Processed food -17.6 -16.0 -1.9 13.8 12.8 0.9 116.5 106.0 5.1Beverages & tobacco -19.4 -17.5 -2.3 9.9 0.5 9.4 566.3 453.6 20.4Extract -1.9 -1.5 -0.4 10.0 7.5 2.3 -8.0 -7.9 -0.1Textiles 17.8 16.7 0.9 38.8 27.2 9.1 92.3 63.7 17.5Apparel 96.2 81.2 8.3 213.6 177.3 13.1 154.7 120.4 15.6Light manufactures -0.2 0.0 -0.2 2.8 0.9 1.9 29.9 12.0 16.0Petrochemicals -4.0 -3.4 -0.6 1.0 -0.6 1.6 17.2 13.2 3.5Metals -6.4 -4.8 -1.7 -0.7 -0.4 -0.3 15.4 11.4 3.6Automobiles 16.5 15.7 0.7 440.1 391.4 9.9 43.1 34.7 6.2Electronics 5.0 -3.9 9.3 28.4 2.0 25.9 22.2 6.2 15.1Other manufactures -6.2 -4.2 -2.1 1.9 -1.4 3.3 27.0 14.2 11.2Trade & transport -0.3 -0.1 -0.2 -2.5 -2.1 -0.4 4.0 2.2 1.8Construction 0.7 0.4 0.3 -3.5 -2.0 -1.5 22.2 19.4 2.3Communications -1.1 -0.8 -0.3 -8.3 -6.7 -1.7 16.7 14.2 2.2Commercial Services -2.9 -2.5 -0.4 -9.3 -7.0 -2.5 41.3 38.6 1.9Other services -1.0 -0.8 -0.2 -4.4 -3.6 -0.8 40.5 37.6 2.1Capital goods 1.1 0.7 0.4 N/A N/A N/A N/A N/A N/ATotal 2.3 1.8 0.5 32.4 22.8 7.8 32.3 22.5 8.0Source: Author’s simulations with GTAP and the model with duty drawbacks (DD). * The bias is computed as a difference in percentage changes, namely [(1+x)/(1+x_DD)-1]*100, where x is the percentage change in the respective variable in GTAP and x_DD is the percentage change in the respective variable in the model with duty drawbacks.

32
Table 6. Welfare Changes due to China’s WTO Accession* ($US Millions) GTAP Model
with DD North America 4384 3480 Western Europe 7345 6009
Contribution to the Difference between GTAP and model with DD: Allocative Efficiency Gains in China
by Product: Australia and New Zealand 103 40 % Japan 2394 1513 Agriculture 0.1 China 10317 8970 Processed food 4.0 Taiwán, China 592 337 Beverages & tobacco 0.1 Other NICs 1249 734 Extract -0.5 Indonesia -313 -286 Textiles 45.9 Vietnam -93 -83 Apparel 23.2 Other Southeast Asia -466 -411 Light manufactures 1.0 India -716 -625 Petrochemicals 1.9 Other South Asia -808 -718 Metals -1.6 Brazil 1214 1068 Automobiles 3.8 Other Latin America -542 -516 Electronics 13.4 Turkey -281 -252 Other manufactures 11.2 Other Middle East & N. Africa -371 -409 Trade & transport -0.9 Economies in Transition -190 -239 Construction 0.4 South African Customs Union 24 3 Communications -0.1 Other Sub-Saharan Africa -84 -89 Commercial Services -1.5 Rest of World -178 -182 Other services -0.3 Total 23580 18344 Total 100.0 Source: Author’s simulations with GTAP and the model with duty drawbacks. *These are welfare changes due to reforms implemented between 1997 and 2007.
33
Table 7. Distribution of Imported Intermediates Use in China: A Comparison (%)
Model with Duty Drawbacks
Share in total import use of all
firms in : Share in sectoral import use of
GTAP
Model with Duty Drawbacks
export-oriented firms
domestic oriented firms
Rice 0.6 0.5 1 99Wheat 0.2 0.2 0 100Feedgrains 0.4 0.4 12 88Vegetables-fruits 1.4 1.3 2 98Oilseeds 0.1 0.1 5 95Sugar 0.0 0.0 12 88Plantfibers 0.5 0.5 0 100Livestock-meat 1.3 1.3 6 94Dairy 0.0 0.0 4 96Other food 1.4 1.3 17 83Beverages-tobacco 0.8 0.8 6 94Extract 2.4 2.3 8 92Textiles 7.1 7.2 27 73Apparel 2.5 3.4 65 35Light manufactures 1.7 2.2 69 31Petrochemicals 14.1 13.8 11 89Metals 6.1 6.0 12 88Autos 1.6 1.5 8 92Electronics 9.2 9.9 53 47Other manufactures 16.9 17.5 26 74Trade-transport 5.2 5.2 14 86Construction 5.2 4.9 0 100Communication 0.5 0.5 3 97Commercial services 1.9 1.8 3 97Other services 6.4 6.0 1 99Capital goods 12.6 11.4 94 6Total 100.0 100.0 30 70Source: Author’s calculations based on version 5 GTAP and modified GTAP data for the model with duty drawbacks.

34
Table 8. China’s import protection (tariff or tariff equivalent)
For domestic useFor export processing For domestic use
For export processing
1997 Post-
accession 1997 Post-
accession 1995Post-
accession 1995 Post-
accessionRice -5.0 -3.3 -5.0 -3.3 -5.0 -3.3 -5.0 -3.3 Wheat 25.0 12.0 25.0 12.0 25.0 12.0 25.0 12.0 Feedgrains 20.0 32.0 20.0 32.0 20.0 32.0 20.0 32.0 Vegetables & fruits -10.0 -4.0 -10.0 -4.0 -10.0 -4.0 -10.0 -4.0 Oilseeds 30.0 3.0 30.0 3.0 30.0 3.0 30.0 3.0 Sugar 44.0 20.0 44.0 20.0 44.0 20.0 44.0 20.0 Plantfibers 20.0 20.0 20.0 20.0 20.0 20.0 20.0 20.0 Livestock & meat -20.0 -15.0 -20.0 -15.0 -20.0 -15.0 -20.0 -15.0 Dairy 30.0 11.0 30.0 11.0 30.0 11.0 30.0 11.0 Processed food 35.1 9.9 0.0 0.0 20.1 9.9 0.0 0.0 Beverages & tobacco 63.2 15.6 0.0 0.0 137.2 15.6 0.0 0.0 Extract 0.7 0.6 0.0 0.0 3.4 0.6 0.0 0.0 Textiles 25.1 8.9 0.0 0.0 56.0 8.9 0.0 0.0 Apparel 31.7 14.9 0.0 0.0 76.1 14.9 0.0 0.0 Light manufactures 12.1 8.4 0.0 0.0 32.3 8.4 0.0 0.0 Petrochemicals 13.1 7.1 0.0 0.0 20.2 7.1 0.0 0.0 Metals 9.7 5.7 0.0 0.0 17.4 5.7 0.0 0.0 Automobiles 34.4 13.8 0.0 0.0 123.1 13.8 0.0 0.0 Electronics 11.9 2.3 0.0 0.0 24.4 2.3 0.0 0.0 Other manufactures 13.0 6.6 0.0 0.0 22.0 6.6 0.0 0.0 Trade & transport 1.9 0.9 1.9 0.9 1.9 0.9 1.9 0.9 Construction 13.7 6.8 13.7 6.8 13.7 6.8 13.7 6.8 Communications 9.2 4.6 9.2 4.6 9.2 4.6 9.2 4.6 Commercial Services 29.4 14.7 29.4 14.7 29.4 14.7 29.4 14.7 Other services 24.5 12.7 24.5 12.7 24.5 12.7 24.5 12.7 Total – Agriculture 4.2 3.6 1.7 1.0 4.8 3.6 1.7 1.0 Total – Manufactures 15.0 6.9 0.0 0.0 25.3 6.9 0.0 0.0 Total merchandise trade* 14.4 6.8 0.0 0.0 24.3 6.8 0.0 0.0 Source: versions 4 and 5 GTAP for protection in 1995 and 1997, respectively, and Ianchovichina and Martin (2003) for post-accession protection. *The estimates in the table are based on trade weights for the respective years.
35
Table 9. Impact of WTO Accession - Liberalization from 1995 Tariffs (% changes)
Output Exports Imports
GTAP Model with
DD Bias GTAPModel with
DD Bias GTAP Model with
DD Bias Rice -3.1 -2.2 -0.9 -11.0 7.8 -17.4 -4.2 -13.2 10.4 Wheat -8.5 -5.1 -3.6 6.6 22.3 -12.8 43.5 37.7 4.2 Feedgrains -3.9 -3.3 -0.6 -79.3 -77.0 -10.0 -15.7 -18.8 3.8 Vegetables & fruits -5.1 -3.7 -1.5 0.2 12.0 -10.5 -23.0 -27.5 6.2 Oilseeds -13.6 -10.2 -3.8 14.1 28.5 -11.2 58.3 61.1 -1.7 Sugar -15 -9.7 -5.9 1.4 16.4 -12.9 41.5 36.2 3.9 Plantfibers 7.3 8.8 -1.4 -46.7 -45.9 -1.5 5.3 1.6 3.6 Livestock & meat 3 3.5 -0.5 -7.6 9.8 -15.8 -18.9 -28.1 12.8 Dairy -6.9 -3.7 -3.3 -0.8 16.2 -14.6 77.1 67.8 5.5 Processed food -6.5 -1.8 -4.8 7.8 23.2 -12.5 33.7 23.6 8.2 Beverages & tobacco -65.7 -58.6 -17.1 36.3 21.2 12.5 2409.3 1425.3 64.5 Extract -2.9 -0.9 -2.0 23.2 18.0 4.4 -2.5 -3.6 1.1 Textiles 7.5 8.4 -0.8 92.9 49.4 29.1 231.5 99.1 66.5 Apparel 142.4 91 26.9 378.0 242.6 39.5 804.1 478.1 56.4 Light manufactures 4.8 6.1 -1.2 36.5 19.7 14.0 234.0 53.2 118.0Petrochemicals -6.4 -3.7 -2.8 12.3 14.9 -2.3 35.5 22.9 10.3 Metals -11.1 -5.2 -6.2 16.1 24.7 -6.9 44.7 27.2 13.8 Automobiles 3.8 -21.4 32.1 1526.2 560.8 146.1 428.3 167.7 97.3 Electronics 28.6 1.4 26.8 97.6 21.9 62.1 58.2 19.1 32.8 Other manufactures -8.7 -4.2 -4.7 22.6 20.6 1.7 59.2 36.7 16.5 Trade & transport 0.6 1.6 -1.0 4.6 10.6 -5.4 1.9 -7.2 9.8 Construction 2.3 1.7 0.6 3.9 16.9 -11.1 19.7 8.3 10.5 Communications -0.9 -0.1 -0.8 -5.6 8.0 -12.6 15.1 3.1 11.6 Commercial Services -2.6 -1.3 -1.3 -8.6 7.4 -14.9 40.8 27.2 10.7 Other services -0.8 -0.3 -0.5 2.0 13.1 -9.8 37.1 23.0 11.5 Capital goods 2.7 1.9 0.8 N/A N/A N/A N/A N/A N/A Total 5.5 3.6 1.8 78.7 47.2 21.4 75.8 46.0 20.4 Source: Author’s simulations with GTAP and the model with duty drawbacks (DD).
36
Table 10. Welfare Changes due to China’s WTO Accession* - Liberalization from 1995 Tariffs ($US Millions)
GTAP Model with DD North America 7576 4488 Western Europe 14506 9634 Australia and New Zealand 386 109 Japan 6550 3759 China 27710 18891 Taiwán, China 2529 1559 Other NICs 5432 3197 Indonesia -503 -376 Vietnam -168 -114 Other Southeast Asia -792 -599 India -1057 -763 Other South Asia -1185 -841 Brazil 94 -14 Other Latin America -520 -550 Turkey -416 -310 Other Middle East & North Africa -171 -462 Economies in Transition -16 -283 South African Customs Union 90 10 Other Sub-Saharan Africa -39 -97 Rest of World -89 -133 Total 59918 37104 Source: Author’s simulations with GTAP and the model with DD. *These are welfare changes due to reforms implemented between 1995 and 2007.