competitive agriculture or state control: ukraine's...
TRANSCRIPT

Competitive agr iculture or state control:
Ukraine's response to the global food cr isis
May 2008
Europe and Central Asia Region
Sustainable Development Unit
Document of the Wor ld Bank

- ii -
This Note has been prepared by the Sustainable Development Department of the Europe and Central Asia (ECA) Region of the World Bank by a team led by Matthias Grueninger and Stephan von Cramon (co-authors) with contributions from (in alphabetical order) Aleksander Kaliberda, Cem Mete, Emil Daniel Tesliuc, Heinz Strubenhoff, Julia Smolyar, Katerina Petrina, Martin Raiser, Menahem M. Prywes, Oleg Nivievskyi, Pablo Saavedra, Ruslan Piontkivsky, Sebastian Hess, Sergiy Zorya, Victor Sulla. It was peer reviewed by ECA's food crisis response team.
The Note was prepared quickly at the request of the Government of Ukraine. While significant efforts have been made to verify data sources and analytical results, and the team is confident of the final product's quality, the tight timeline for the delivery of this Note did not allow for a major research effort and peer review process. The Note should therefore be considered as work in progress, as a contribution to the currently ongoing discussions on the global food crisis and how Ukraine should respond, driven by broadly shared concerns about inflation and food security. Comments are welcome and explicitly invited and should be addressed to the team leader for this Note, Matthias Grueninger ([email protected]).

- iii -
Table of Contents
Summary for policy makers........................................................................................................................iv
A. The global food cr isis.........................................................................................................................1
Agricultural commodity price developments ............................................................................................1 The impact of rising commodity prices.....................................................................................................2 Government responses world-wide ...........................................................................................................3
B. The impact of a changing wor ld situation on Ukraine and local response so far .........................5
Food prices, inflation, and poverty in Ukraine..........................................................................................5 The response of the Ukrainian government to increasing food prices and inflation .................................7 Ukraine's agricultural production and trade during the period of increasing world food prices................8 Economic impact of world food price increase on Ukraine's consumers and producers within policy framework before April 2008..................................................................................................................10 Export revenues and investment incentives resulting from the decision (April 2008) to relax export restrictions in the grain sector .................................................................................................................12
C. When will Ukraine take its foot off the brake and why should it?...............................................13
Impact of Ukrainian policies on the world until March 2008..................................................................13 Ukraine's potential for increasing agricultural production and trade.......................................................13 Expected effects of the full removal of export restrictions in the agriculture sector ...............................14
D. Building Ukraine's expor t-or iented, competitive agr iculture sector ...........................................16
An attempt to formulate a vision .............................................................................................................16 Current state programs to support the agriculture sector.........................................................................16 Policy and institutional framework .........................................................................................................18 Public investments...................................................................................................................................19
E. Measures to protect the poor and vulnerable from food pr ice increases....................................19
Brief assessment of social assistance programs in Ukraine.....................................................................19 National-level response to rising food prices and preparedness..............................................................20

- iv -
Summary for policy makers
World market prices for grains and oilseeds have risen dramatically over the last 24 months. Despite a recent drop, wheat prices are still about twice what they were two years ago. Given the underlying causes, this situation is likely to persist for the medium term (IFPRI and World Bank projections use a time horizon until 2015). Rising food prices are causing significant hardship worldwide and threatening to cast large numbers of people into poverty. However, the current situation is a major opportunity for Ukraine, a net grain exporter with a significant exploitable yield gap and one of the few countries in the world that are in a position to significantly increase net exports and make up for emerging deficits elsewhere.
With appropriate policies and investments, Ukraine could significantly increase its grain harvest and gain global market share in an environment of rising global demand. Even relatively conservative estimates of growth in yields and acreage indicate that a regular harvest of over 40 million tons would be possible. Seizing this opportunity would require a shift in policies and corresponding increases in private and public investment.
Government policies to date have failed to seize this opportunity. Indeed, Ukraine's main reaction to the global increase in food prices has been to introduce grain export restrictions. Together with the oilseed export tax and recent export quotas for sunflower seed oil, these restrictions are estimated to have cost producers over US$ 2 billion in the 2007-08 marketing year to date. These are revenues for rural producers that could have been used to purchase improved inputs, upgrade the storage and handling infrastructure, and improve farming technologies and farm management skills.
The Government's decision to increase grain export quotas in April 2008 is a step towards removing agricultural disincentives. The increase of export quotas for wheat by 1 million tons and for barley by 0.5 million tons is expected to generate some US$ 500 million in additional export revenues, equivalent to 0.3% of GDP. It also expected to provide critical relief to a tight global wheat market. However, as long as export restrictions remain in place and the risk of their extension into next year remains, farmers will invest less than they could and international trade relations including the negotiation of new agreements could be negatively affected.
Rising food prices do create a difficult macroeconomic and social policy challenge. In some countries, rising food prices have caused political turbulence. Generally, the poor are more vulnerable to inflation and food price inflation in particular, because they spend a larger proportion of their incomes on food, and are more dependent on wage incomes and transfers. However, because of large nominal increases in average wages and social transfers at the beginning of the year, the impact of rising food prices on poverty is likely to have been muted in Ukraine. Without these increases, the poverty rate measured against an internationally comparable poverty line of US$ 2.15 a day would have risen from 3.1% to 17.6%.
While the global increase in food prices has played a role, the underlying cause of inflation in Ukraine is that the economy is overheating. Domestic consumption has been

- v -
growing at twice the rate of GDP growth in the past three years; the current account has widened by 15% of GDP since 2004; domestic credit is growing at some 70% year on year; and nominal current spending of the budget was up 68% in January 2008. The de facto peg of the Hryvnia against the US dollar has meant furthermore that increases in international commodity prices denominated in dollars have been transmitted directly into Hryvnia. In other emerging markets, appreciating currencies have buffered these increases. The Government should refrain from further upward spending adjustments in the 2008 budget and instead save additional revenues to cool the economy. The National Bank should introduce greater exchange rate flexibility and thus allow monetary policy to react to global price shocks.
The world food crisis both poses challenges and presents opportunities for Ukraine. The solution to the challenges lies in appropriate macroeconomic policies and targeted social support, not in interventions in food markets. Measures to protect the poor and vulnerable from food price increases need to be separated from agricultural market policy, so that Ukraine can seize the emerging opportunities:
(i) An appropriate agricultural policy framework and public investment program would provide incentives for further and critical private investments needed to build Ukraine's export-oriented and competitive agriculture sector. Increased productivity in agriculture would also make Ukraine less vulnerable to low harvests. Ukraine's accession to the WTO and the beginning of negotiations on a free trade agreement with the EU will provide key impetus to the required reforms, and the Ministry of Agricultural Policy has taken several initial steps. Key reform and investment areas include: (a) trade policies (including refraining from export restrictions); (b) transport, storage (c) market information infrastructure and agricultural statistics; (d) institutional framework for land market; (e) access to finance and risk management instruments; (f) research and extension, and vocational training of agricultural specialists and farm managers; (g) veterinary and food safety control system compliant with regulations in target markets.
(ii) The negative impact of increasing domestic food prices should be cushioned with targeted social assistance programs, complemented with tighter macroeconomic management to reduce overall inflation, ensuring that the gains from responding to this important economic opportunity for Ukraine are more equally shared. Ukraine already operates a number of targeted social transfer systems that are quite efficient at identifying and supporting the most vulnerable. For instance, the "last resort" program for the very poor has a targeting efficiency of 73% among the poorest fifth of the population. Support to single mothers and to young (0-3 years) children is also effective. These programs could be scaled up to support those most affected by rising food prices. This would be cheaper and more sustainable than the blanket increases in all social payments implemented in recent years. At the same time, numerous benefits that do not effectively target the poor, such as housing subsidies, could be scaled back.
Ukraine is in a position to make a significant contribution to the international effort to deal with the food crisis, while providing attractive investment and employment opportunities in the agriculture sector (in rural areas) that are expected to yield significant income, trade and fiscal benefits.
- 1 -
A. The global food cr isis
Agr icultural commodity pr ice developments
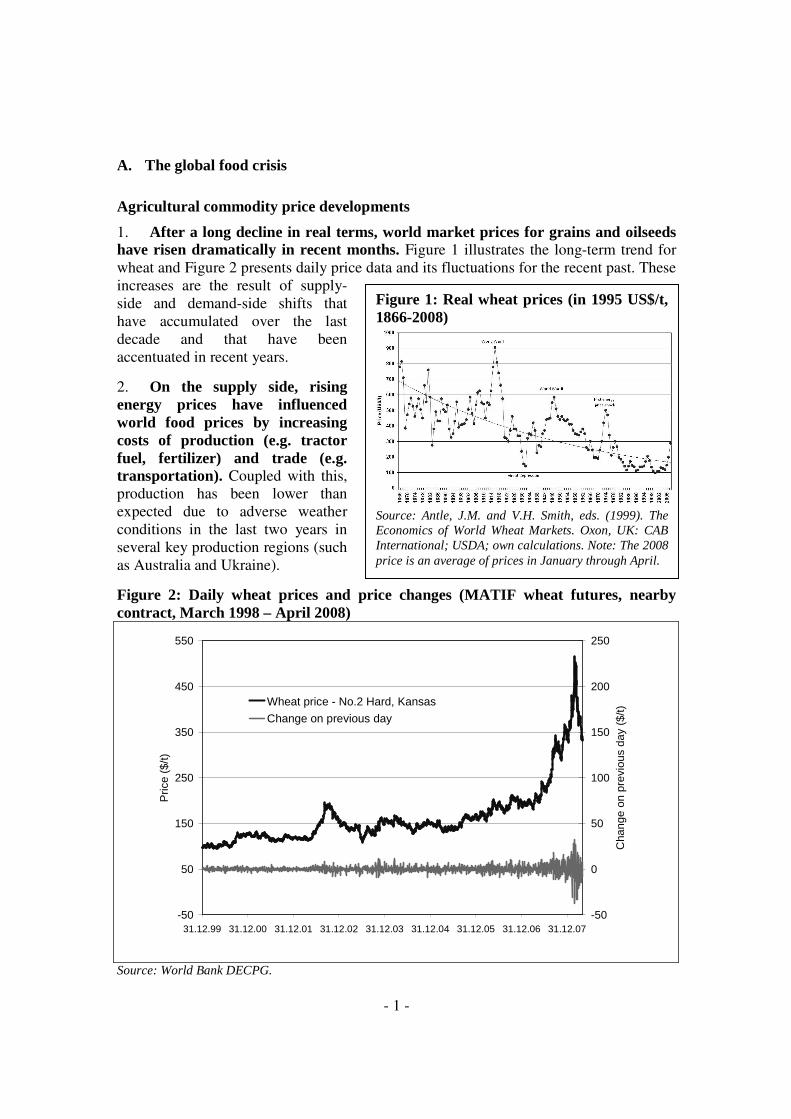
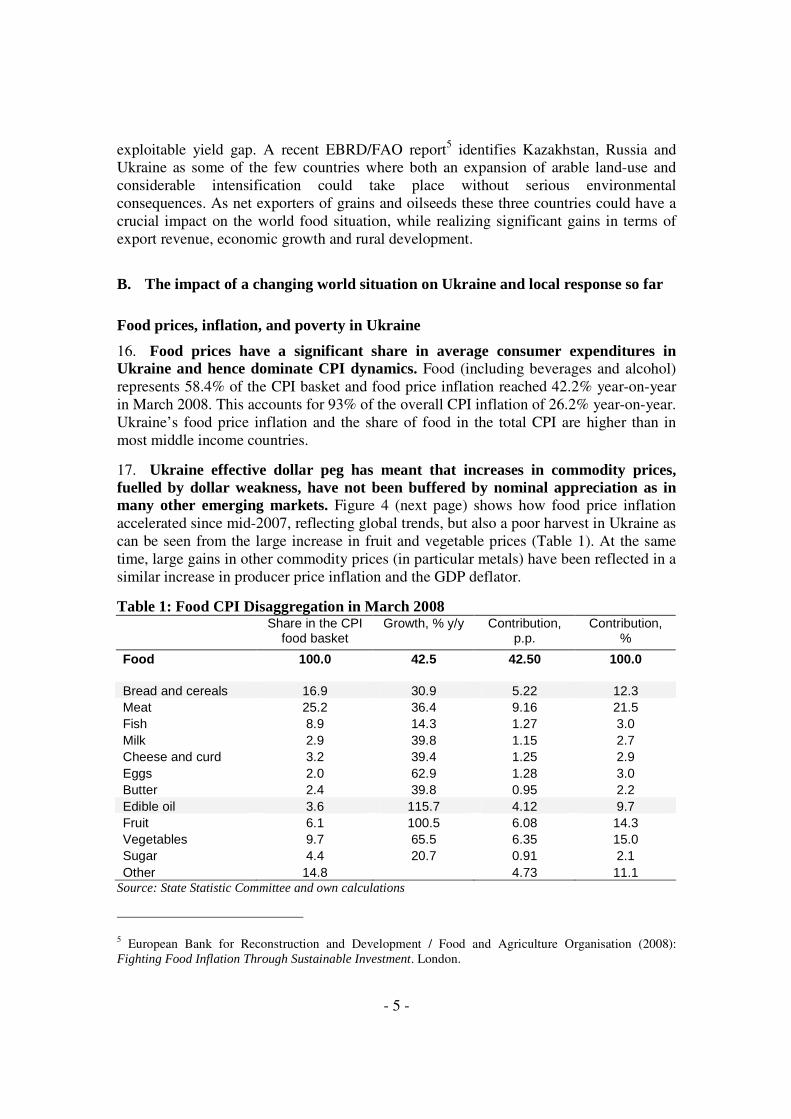
1. After a long decline in real terms, wor ld market pr ices for grains and oilseeds have r isen dramatically in recent months. Figure 1 illustrates the long-term trend for wheat and Figure 2 presents daily price data and its fluctuations for the recent past. These increases are the result of supply-side and demand-side shifts that have accumulated over the last decade and that have been accentuated in recent years.
2. On the supply side, r ising energy pr ices have influenced wor ld food pr ices by increasing costs of production (e.g. tractor fuel, fer tilizer) and trade (e.g. transpor tation). Coupled with this, production has been lower than expected due to adverse weather conditions in the last two years in several key production regions (such as Australia and Ukraine).
Figure 2: Daily wheat pr ices and pr ice changes (MATIF wheat futures, nearby contract, March 1998 – April 2008)
-50
50
150
250
350
450
550
31.12.99 31.12.00 31.12.01 31.12.02 31.12.03 31.12.04 31.12.05 31.12.06 31.12.07
Pric
e ($
/t)
-50
0
50
100
150
200
250
Cha
nge
on p
revi
ous
day
($/t)
Wheat price - No.2 Hard, Kansas
Change on previous day
Source: World Bank DECPG.
Figure 1: Real wheat pr ices (in 1995 US$/t, 1866-2008)
Source: Antle, J.M. and V.H. Smith, eds. (1999). The Economics of World Wheat Markets. Oxon, UK: CAB International; USDA; own calculations. Note: The 2008 price is an average of prices in January through April.

- 2 -
3. On the demand side, income growth in many emerging economies – especially those with large populations such as China and India – has led to increased demand for meat and dairy products. Since it takes significantly more than one kg of feed to produce one kg of meat or liter of milk, demand for grains and oilseeds has grown disproportionately. Demand for agricultural feed stocks for biofuel production (vegetable oils to produce biodiesel, and sugar and grains to produce bioethanol) has also surged in recent years.
4. Together , these supply and demand shifts have led to a situation in which wor ld grain consumption has exceeded wor ld grain production in seven of the last nine years. The resulting shortfalls have been compensated by a steady reduction in global cereal stocks, which at roughly 20% (equivalent to 10.4 weeks) of global consumption are currently at their lowest level since the early 1970s1. Such reductions in stocks cannot continue indefinitely, and markets have responded to the increasing scarcity of grain on world markets with increasing prices.
5. Pr ice volatility has also increased sharply. Low stocks make markets highly sensitive to new information about supply and demand. Sudden policy changes by governments (such as export restrictions in response to increased food prices, or new biofuel subsidies) and increasing climate variability and its impact on crop performance, as well as increased speculative interest in agricultural markets, have thus contributed to a significant increase in price volatility (Figure 1 above).
6. The observed increase in food pr ices is not a temporary phenomenon, but likely to persist for the medium term. Food crop prices are expected2 to remain high in 2008 and 2009 and then begin to decline as supply and demand respond to high prices; however, they are likely to remain well above the 2004 levels through 2015 for most food crops. While other major organizations (IFPRI, FAO, OECD, USDA) that regularly monitor and project commodity prices broadly concur with these projections, long-term price forecasts are notoriously difficult to make. Besides the supply and demand side factors listed above, the future rate of technical change, climate change, and land and water degradation are key factors determining the prospects of increased food production.
The impact of r ising commodity pr ices
7. Rising agr icultural commodity pr ices have fed into sharp food pr ice increases and fueled overall inflation in recent months. Rising commodity prices do not necessarily translate into immediate and proportionate rises in domestic food prices, due to differences in macro-economic and exchange rate policies, as well as labor, energy and transportation costs. They nonetheless have fueled a sharp food price increase in recent months. In 2007, food price increases accounted for almost 70% of 2007 aggregate 1 FAO, 2007. Food Outlook, November 2007. 2 See, for example, World Bank, 2008. Rising food prices: Policy options and World Bank response; http://siteresources.worldbank.org/NEWS/Resources/risingfoodprices_backgroundnote_apr08.pdf. Or: IFPRI, 2008: http://www.ifpri.org/themes/foodprices/foodprices.asp

- 3 -
inflation in emerging economies.3 In Europe and Central Asia (ECA), food price inflation has been the main factor behind rising overall inflation, with aggregate inflation increasing from 6 percent in 2006 to about 10 percent in 2007, food inflation from 6.4 to 14.8 percent.
8. The impact of r ising food pr ices on developing countr ies real incomes and terms of trade has var ied. In many countries parallel increases in other commodity prices has offset the impact of rising food prices on the terms of trade. At the same time, growth in the world economy has remained healthy, driven in particular by emerging markets, and hence real income gains have often offset the impact of higher food prices on household budgets.
9. The poor are generally more vulnerable to food pr ice inflation. Poor households spend a higher share of their incomes on food than better-off households, so food price inflation reduces their incomes proportionately more. Households also benefit or lose as a result of higher prices depending on whether they are net producers or consumers of staple foods and the extent to which their wages adjust to higher prices. But even when poor people are engaged in agricultural production, the rise in input costs and market imperfections have meant that they have not always benefited from higher output prices. Preliminary estimates of the global impact of recent food price rises suggest that up to 100 million people in developing countries could fall into poverty in the next 6 months.4
10. As a result, r ising food pr ices have led to political unrest and violence. In many developing countries, rising food prices have led to protests and riots. Roughly 40 countries have been affected, and in the prominent case of Haiti, the Prime Minister was removed from office following food riots that left many dead and injured.
Government responses wor ld-wide
11. Given the political sensitivity of food pr ices, many governments have reacted quickly to the global r ise in food pr ices. Policy interventions can be divided into three broad categories: (i) Increasing food availability in households through direct (income) transfers in cash or kind. Measures ensuring household food security by strengthening targeted safety nets include targeted cash transfers to vulnerable groups, food-for-work programs, emergency food aid distribution, and school feeding programs; (ii) Reducing domestic food prices through short-run trade policy measures or administrative action, including the reduction of import tariffs and taxes, grain or bread subsidies, domestic price controls, state procurement and distribution, and export taxes or export restrictions; and (iii) Stimulating a domestic food production and marketing response, improving food supply in the long term, by enhancing agricultural production systems including research, extension, and information systems, and by strengthening post-harvest management, marketing infrastructure, and access to finance and risk management instruments.
3 IMF (2008): Impact of High Food and Fuel Prices on Developing Countries – FAQs. http://www.imf.org/external/np/exr/faq/ffpfaqs.htm. 4 Ivanic and Martin (2008): Implications of Higher Global Food Prices for Poverty in Low-Income Countries. The World Bank, Washington DC.

- 4 -
12. Measures to increase household food availability suppor t the poor without distor ting domestic incentives to produce more food, and without reducing the incomes of poor food sellers. Hence, they address the symptoms of the food price crisis without impairing the mechanisms that must function to solve this crisis in the medium and long run. However, measures in this category can be administratively costly and comparatively difficult to implement.
13. Measures to reduce domestic pr ices are sometimes easier to implement, but they have the decisive disadvantage that they reduce incentives for domestic production. Hence, they mask the symptoms of the food price crisis while hindering the cure. Furthermore, these measures also provide unnecessary benefits for the middle and upper classes. In recent months, many food exporting countries – including Ukraine – have resorted to export restrictions. Along with the domestic disadvantages listed above, such measures further increase the level and volatility of world market prices, adding to suffering among the truly needy worldwide.
14. In the long run, only a significant and sustained increase in food production can relax markets and ensure affordable food for all. According to FAO (Food Outlook, Nov. 2007), an additional 1 billion tons of cereals will be needed by 2030. This can only be achieved if the right incentives frameworks through appropriate agricultural policies are established worldwide, and especially in high potential countries such as Ukraine.
15. Only very few countr ies are in a position to significantly increase net expor ts and make up for emerging deficits elsewhere. Increases in agricultural output can be achieved through the expansion of arable land-use or through intensification. FAO estimates that more than 80 percent of the projected expansion in arable area is expected to take place in sub-Saharan Africa and Latin America. While this expansion will bear its own environmental risks (esp. through the destruction of rain forests), only 20 percent of the overall increase in crop production will come from expansion anyway. The largest part, 80 percent, will have to come from intensification through higher yields per crop and more crops per year (multiple cropping, reduced fallow). Figure 3 shows for the example of wheat that Ukraine is a country with a significant
Figure 3: Exploitable yield gaps for wheat: actual versus obtainable yield
0.0
1.0
2.0
3.0
4.0
5.0
6.0
7.0
8.0
9.0
Germ
any
Ukrain
eUSA
Turke
y
Ethiop
iaBra
zil
Argen
tina
Tanza
nia
Obtainable
Actual
Source: FAO, 2002. World agriculture: towards 2015 / 2030. Updated, pers. communication with FAO.
- 5 -
exploitable yield gap. A recent EBRD/FAO report5 identifies Kazakhstan, Russia and Ukraine as some of the few countries where both an expansion of arable land-use and considerable intensification could take place without serious environmental consequences. As net exporters of grains and oilseeds these three countries could have a crucial impact on the world food situation, while realizing significant gains in terms of export revenue, economic growth and rural development.
B. The impact of a changing world situation on Ukraine and local response so far
Food pr ices, inflation, and pover ty in Ukraine
16. Food pr ices have a significant share in average consumer expenditures in Ukraine and hence dominate CPI dynamics. Food (including beverages and alcohol) represents 58.4% of the CPI basket and food price inflation reached 42.2% year-on-year in March 2008. This accounts for 93% of the overall CPI inflation of 26.2% year-on-year. Ukraine’s food price inflation and the share of food in the total CPI are higher than in most middle income countries.
17. Ukraine effective dollar peg has meant that increases in commodity pr ices, fuelled by dollar weakness, have not been buffered by nominal appreciation as in many other emerging markets. Figure 4 (next page) shows how food price inflation accelerated since mid-2007, reflecting global trends, but also a poor harvest in Ukraine as can be seen from the large increase in fruit and vegetable prices (Table 1). At the same time, large gains in other commodity prices (in particular metals) have been reflected in a similar increase in producer price inflation and the GDP deflator.
Table 1: Food CPI Disaggregation in March 2008 Share in the CPI
food basket Growth, % y/y Contribution,
p.p. Contribution,
%
Food 100.0 42.5 42.50 100.0 Bread and cereals 16.9 30.9 5.22 12.3 Meat 25.2 36.4 9.16 21.5 Fish 8.9 14.3 1.27 3.0 Milk 2.9 39.8 1.15 2.7 Cheese and curd 3.2 39.4 1.25 2.9 Eggs 2.0 62.9 1.28 3.0 Butter 2.4 39.8 0.95 2.2 Edible oil 3.6 115.7 4.12 9.7 Fruit 6.1 100.5 6.08 14.3 Vegetables 9.7 65.5 6.35 15.0 Sugar 4.4 20.7 0.91 2.1 Other 14.8 4.73 11.1
Source: State Statistic Committee and own calculations
5 European Bank for Reconstruction and Development / Food and Agriculture Organisation (2008): Fighting Food Inflation Through Sustainable Investment. London.

- 6 -
Figure 4: The CPI and its main components in Ukraine (January 2001 – March 2008)
0
5
10
15
20
25
30
Jan-01
Jul-01
Jan-02
Jul-02
Jan-03
Jul-03
Jan-04
Jul-04
Jan-05
Jul-05
Jan-06
Jul-06
Jan-07
Jul-07
Jan-08
CP
I (%
yea
r-on-y
ear)
ServicesNon-food productsFood products
Source: State Statistics Committee of Ukraine; own calculations.
18. However, the underlying reason for the rapid increase in inflation is that the Ukrainian economy has been overheating. Domestic consumption has been rising at an average rate of over 13% in 2005-07, much higher than GDP growth. The current account has deteriorated from a 10.6% of GDP surplus to a 4.2% of GDP deficit. Against this background, fiscal and monetary policies have been too loose. Nominal budget spending was up 68% in January 2008, private sector credit grew 72% in February, and nominal wage growth in the economy was 38.4% on average in March. Large capital inflows throughout 2007 led to heavy interventions by the NBU in the context of a de facto dollar peg driving money growth to 50% y-o-y. While net capital inflows have slowed since the start of the year and the budget has run a cash surplus in the first four months, inflationary expectations have risen and will require more concerted action to be brought back down. The National Bank of Ukraine (NBU) calculates a core price index net of food, energy and other administered prices, which shows an increase in core inflation from 2.5% in 2006-2007 to 5.5% by March 2008.
19. Because of fast r ising real incomes, the impact of food pr ice inflation on pover ty has been muted. Simulations using the 2006 household budget survey show that a 30% increase in food prices, uncompensated by any income gains, would push the poverty rate (measured as incomes below $2.15 per day in PPP terms) from 3.1% to 8.6%. A 50% price increase would raise this to 17.6%. With the average wage rising approximately at the same rate as food prices, average poverty impact of food price inflation is expected to be negligible. However, given that a larger share of the rural population is below or close to the poverty line compared to urban, and given that higher agricultural commodities prices have not translated into higher agricultural wages (see

- 7 -
below), the rural population is more negatively affected by rising food prices.
The response of the Ukrainian government to increasing food pr ices and inflation
20. The pr imary response of the Ukrainian Government to r ising food pr ices has been to implement grain expor t quotas. Export quotas were first introduced in late September 2006 (Table 2). In spring and June of 2007, the quotas were abolished for corn and barley, respectively. But they were re-implemented in July when it became clear that the harvest would be low due to drought and high temperatures. The quota volumes set for the 2007/08 marketing year were so low as to effectively ban exports altogether (Figure 5, next page). In late April 2008, export quotas for wheat and barley were extended to July 2008, but also increased, from 0.2 to 1.2 million tons and from 0.4 to 0.9 million tons, respectively.
Table 2: History of cereals expor t restr ictions in Ukraine since September 2006 (all amounts in 1000 tons)
Date Event Wheat Barley Maize Rye Cabinet Resolution #
September 28, 2006
Licensing of export and import of wheat and wheat-rye mix (meslin) introduced - - - - 1364
October 11, 2006
Export quotas introduced until 31Dec2006 400 600 500 3 1418
December 8, 2006
New Export quotas for 1Jan2007- 30Jun2007 3 600 500 3 1701
Total for 2006/2007 MY 403 1200 1000 6 February 22, 2007
Export quotas for barley and maize cancelled 3 - - 3 290
May 16, 2007
Export quotas for wheat cancelled - - - 3 748
June 20, 2007
New Export quotas introduced for July 01 until 01Oct2007 3 3 3 3 844
September 26, 2007
Export quotas extended until 01Nov2007 3 3 3 3 1179
October 31, 2007
Export quotas extended until 31Dec2007 3 3 3 3 1287
September 26, 2007
New export quotas introduced, for 01Jan2008 until 31Mar2008 200 400 600 3 1179
March 28, 2008
Export quotas extended until 30Apr2008; for maize abolished as of 01 Apr, only licensing until 01Jul2008 200 400 - 3 271
April 23, 2008
Export quotas for wheat and barley increased and extended until 01Jul2008 1200 900 - 3 418
Total for 2007/2008 MY 1203 903 603 6 Source: Resolutions of the Cabinet of Ministers, Government of Ukraine.
21. Export quotas are administered as follows.6 The Ministry of Economy announces 6 CMU Regulation #1179 of 26.10.2007, with changes and amendments of 23.04.2008.

- 8 -
a call for applications for export quotas. Within 11 days of the announcement, traders must submit applications that include copies of export contracts that justify the requested volume, together with a state registration certificate and certification from the Ministry of Agrarian Policy that the trader does have the grain in question. After all applications have been checked, a special commission distributes the available quota to the traders in proportion to the volumes that they have requested. This system creates powerful incentives for rent-seeking.
Figure 5: Monthly expor ts of wheat and bar ley from Ukraine (million tons, January 2006 – March 2008)
0
500
1000
1500
2000
2500
Jul-04
Sep-04
Nov-04
Jan-05
M ar-05
M ay-05
Jul-05
Sep-05
Nov-05
Jan-06
M ar-06
M ay-06
Jul-06
Sep-06
Nov-06
Jan-07
M ar-07
M ay-07
Jul-07
Sep-07
Nov-07
Jan-08
M ar-08
Expo
rts
('000
ton
s)
Wheat Barley Corn
Source: State Statistics Committee, Customs Committee for 2008 Data.
22. Local administrations are empowered to control flour /bread margins in the bakery industry. A Cabinet resolution allows local administrations to set maximum margins for bakeries. Arrangements are oblast and city specific. In practice, 10% is the maximum margin, 5% is commonly used, and there are cases in which margins are smaller than 5%. If the fixed margin becomes unbearable for the bakeries in a region, they negotiate with local administrations. In addition, local administrations provide subsidies to bakeries to ensure that they (i) can purchase cheaper grain/flour early in the season, and (ii) use these subsidies for 3 to 5 most commonly purchased types of bread.
Ukraine's agr icultural production and trade dur ing the per iod of increasing wor ld food pr ices
23. Ukraine’s yields and production of major grains has stagnated since the 2004/05 harvest, and fell sharply due to drought in 2007/08. Production of oilseeds, especially rapeseed, has seen significant expansion, however primarily based on increased acreage rather than significant average yield increases. The forecast for

- 9 -
2008/09 is currently positive, with wheat expected to rebound to the highest level of production since 2002/03, and acreages and yields of all crops expected to increase over the previous year (Table 3).
Table 3: Production of major crops in Ukraine, 2002-2008 Year 02/03 03/04 04/05 05/06 06/07 07/08 08/09* Wheat acreage (ha) 6784 2625 5633 6453 5211 5971 6725 yields (t/ha) 2.91 1.62 2.93 2.78 2.65 2.29 2.8 production (mill. t) 19.76 4.25 16.53 17.91 13.81 13.70 18.85 Bar ley acreage (ha) 4287 4719 4460 4266 5194 4150 4335 yields (t/ha) 2.29 1.58 2.38 2.07 2.18 1.48 2.16 production (mill. t) 9.83 7.45 10.62 8.82 11.30 6.15 9.35 Corn acreage (ha) 1151 2016 1680 1648 1800 1900 2035 yields (t/ha) 2.72 2.85 4.14 3.99 3.42 3.32 3.78 production (mill. t) 3.13 5.75 6.95 6.57 6.16 6.30 7.70 Tot. grain acreage (ha) 14500 11282 14032 14433 14018 13553 14832 yields (t/ha) 2.5 1.8 2.71 2.55 2.45 2.08 2.6 production (mill. t) 36.27 20.32 37.96 36.82 34.40 28.20 38.62 Sunseed acreage (ha) 2890 4020 3650 4250 4520 4090 4250 yields (t/ha) 1.21 1.14 0.93 1.18 1.27 1.19 1.25 production (mill. t) 3.50 4.59 3.40 5.05 5.75 4.86 5.31 Rapeseed acreage (ha) n.a. 54 106 202 405 945 1605 yields (t/ha) n.a. 0.94 1.17 1.43 1.61 1.17 1,49 production (mill. t) Na 51 124 289 652 1106 2391
Source: UkrAgroConsult. * 2008/09 forecast as of April 20, 2008.
24. Export quotas have reduced expor t volumes and led to an increase in grain stocks in Ukraine to levels that are considerably higher than was the case in the past. With closing stocks of 3.27 million tons of wheat and 4.17 million tons of grains total, Ukraine now stores 26.5 percent and 15.4 percent, respectively, of its annual demand (Table 4), which is broadly in line with the global average of 20 percent of cereals stocks to use ratio.
Table 4: Grain and wheat supply/demand balances in Ukraine (million tons, 2003/04 – 2007/08)
Grains, total Wheat
Year 03/04 04/05 05/06 06/07 07/08 03/04 04/05 05/06 06/07 07/08
Opening stocks 2.03 1.34 2.47 2.70 2.75 1.43 0.93 1.29 1.98 1.90
Crop 20.32 37.96 36.82 34.40 28.20 4.25 16.53 17.91 13.81 13.70
Imports 3.73 0.16 0.19 0.19 0.23 3.40 0.005 0.01 0.01 0.025
Supply 26.07 39.46 39.47 37.29 31.18 9.08 17.46 19.21 15.80 15.62
Exports 2.89 11.28 13.24 9.79 3.33 0.05 4.33 6.48 3.30 1.00
Demand 24.73 36.99 36.77 34.54 27.01 8.15 16.18 17.23 13.90 12.35
Closing stocks 1.34 2.47 2.70 2.75 4.17 0.93 1.29 1.98 1.90 3.27
Stocks/demand (%) 5.4 6.7 7.4 8.0 15.4 11.4 8.0 11.5 13.6 26.5 Source: UkrAgroConsult

- 10 -
Economic impact of world food pr ice increase on Ukraine's consumers and producers within policy framework before Apr il 2008
Producers and exporters
25. As a result of the expor t quota system, farmers have sustained significant losses (foregone revenues). Before the introduction of export quotas in September 2006, the spread between export prices and ex-warehouse prices for wheat in Ukraine averaged US$ 17.25 per ton. Since the introduction of the quota, this spread increased to US$ 85.36 per ton on average. When exports were effectively eliminated in July 2007, the spread even rose to almost US$ 134 /t (Figure 6). Given a wheat crop of 13.7 million tons, the roughly US$ 116 /t of excess spread in the 2007/08 marketing year alone represented almost US$ 1.6 billion foregone farm revenues7. For barley, the corresponding foregone farm revenue amounts to US$ 326 million for the same year.
Figure 6: Pr ices and FOB-EXW spreads for feed wheat in Ukraine (US$/t, July 2004 – January 2008)
$0
$50
$100
$150
$200
$250
$300
$350
$400
$450
Jul 0
4
Sep 0
4
Nov 0
4
Jan
05
Mrz
05
Mai
05
Jul 0
5
Sep 0
5
Nov 0
5
Jan
06
Mrz
06
Mai
06
Jul 0
6
Sep 0
6
Nov 0
6
Jan
07
Mrz
07
Mai
07
Jul 0
7
Sep 0
7
Nov 0
7
Jan
08
Mrz
08
Wheat Feed EXW in US$/t Wheat Feed FOB in US$/t Spread fob-exw in Ukraine Source: UkrAgroConsult; USDA; own calculations.
7 Some of this effect must be attributed to legitimate increases in the spread that are due to energy price increases, and not export restrictions. However, energy prices only account for part of the exw-fob spread, and they have not increased at nearly the same rate as the spread.
- 11 -
26. Some of these losses appeared as rents for those traders who were able to secure expor t cer tificates. For wheat, multiplying the excess spread in each month since the quotas were implemented by the corresponding volume of exports leads to an estimate of US$ 48.0 million for wheat (US$ 47.3 million for barley) between September 2006 and March 2008. The remainder of the producer losses largely accrues as benefits to the domestic feed and food processing sector, such as the poultry and flour industries, and to consumers.
Consumers and workers
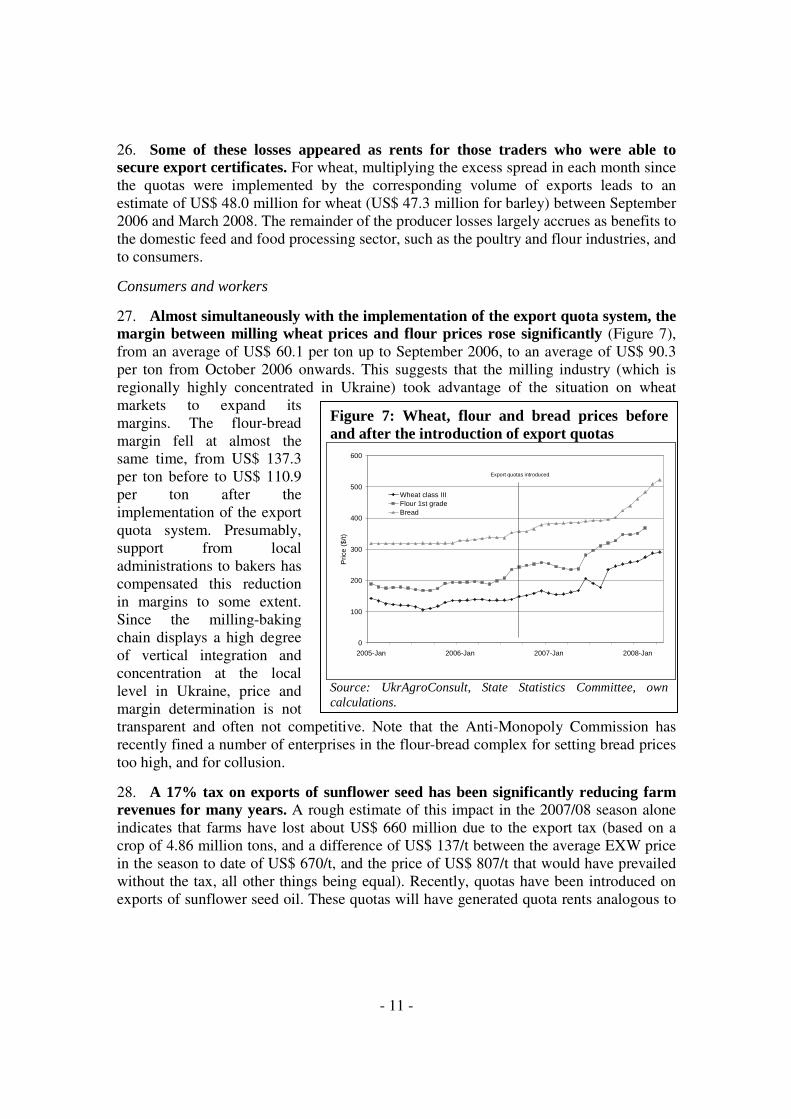
27. Almost simultaneously with the implementation of the expor t quota system, the margin between milling wheat pr ices and flour pr ices rose significantly (Figure 7), from an average of US$ 60.1 per ton up to September 2006, to an average of US$ 90.3 per ton from October 2006 onwards. This suggests that the milling industry (which is regionally highly concentrated in Ukraine) took advantage of the situation on wheat markets to expand its margins. The flour-bread margin fell at almost the same time, from US$ 137.3 per ton before to US$ 110.9 per ton after the implementation of the export quota system. Presumably, support from local administrations to bakers has compensated this reduction in margins to some extent. Since the milling-baking chain displays a high degree of vertical integration and concentration at the local level in Ukraine, price and margin determination is not transparent and often not competitive. Note that the Anti-Monopoly Commission has recently fined a number of enterprises in the flour-bread complex for setting bread prices too high, and for collusion.
28. A 17% tax on expor ts of sunflower seed has been significantly reducing farm revenues for many years. A rough estimate of this impact in the 2007/08 season alone indicates that farms have lost about US$ 660 million due to the export tax (based on a crop of 4.86 million tons, and a difference of US$ 137/t between the average EXW price in the season to date of US$ 670/t, and the price of US$ 807/t that would have prevailed without the tax, all other things being equal). Recently, quotas have been introduced on exports of sunflower seed oil. These quotas will have generated quota rents analogous to
Figure 7: Wheat, flour and bread pr ices before and after the introduction of expor t quotas
0
100
200
300
400
500
600
2005-Jan 2006-Jan 2007-Jan 2008-Jan
Pric
e ($
/t)
Wheat class IIIFlour 1st gradeBread
Export quotas introduced
Source: UkrAgroConsult, State Statistics Committee, own calculations.

- 12 -
those for wheat and barley mentioned above.8
29. The grain and sunflower seed export restr ictions have had some effect on restraining domestic consumer pr ice growth. Note from Table 1 that the share of cereals and bread in the food CPI is 16.9%. Full transmission of the rough doubling of international grain prices into increases in domestic prices of wheat and bread would have added 6.1 percentage points to annual CPI inflation in 20079. Another way of quantifying the magnitude of this effect is to consider the revenue losses to producers due to export restrictions in 2007/08 (estimated at roughly US$ 1.8 billion for wheat and barley, net of quota rents, plus US$ 0.66 billion for sunflower seed) on a per capita basis. Assuming that these losses for producers are fully passed on as reduced food expenditure to consumers, the resulting savings amount to roughly US$ 52.30 per year and citizen of Ukraine. However, to the extent that the price controls reduce potential output, there are losses to the economy that provide no gains to consumers at all. As emphasized elsewhere in this note, the proper instrument to deal with inflation are tighter fiscal and monetary policies, and the appropriate reaction to the social costs of higher food prices are targeted social transfers. Both measures are clearly available to the Ukrainian authorities.
30. There is no indication that higher food pr ices have resulted in higher wage increases for agr icultural workers. While agricultural wages have increases since early 2007 (Figure 8), they have grown at almost exactly the same percentage rate as average wages in the economy as a whole. Hence, in absolute terms, the gap between average wages and agricultural wages has actually increased – a surprising development given the relative increases in agricultural output prices and earnings.
Export revenues and investment incentives resulting from the decision (Apr il 2008) to relax expor t restr ictions in the grain sector
31. Increased grain exports resulting from the relaxation of expor t restr ictions will generate around US$ 500 million in additional export revenues by June 2008. As of April 23, 2008, export quotas have been increased by one million tons for wheat and 0.5 8 It is reported that two companies have received over 50% of the allocated quotas. 9 This is based on the following calculations: Global wheat prices are up roughly 100% y-o-y. Domestic cereal and bread prices were up only 31% y-o-y. Hence the additional impact of a full pass through would be 70%. This multiplied by the share of bread and cereals in the total CPI (8.8%) gives 6.1 percentage points additional CPI inflation.
Figure 8: Wages in agr iculture and the economy as a whole (January 2007 –
0
200
400
600
800
1000
1200
1400
1600
1800
2000
Jan07 Mar07 May07 Jul07 Sep07 Nov07 Jan08
Wag
es (
Hry
vnia
/mon
th)
Total Agriculture
Source: State Statistics Committee; own calculations.

- 13 -
million tons for barley. Against the backdrop of an expected record harvest, this increased export opportunity is likely to be taken, leading to an additional US$ 150 million in export revenues for barley and US$ 350 million for wheat at current prices. The total of US$ 500 million additional export revenues is equivalent to 0.3 percent of GDP and can contribute to reduce Ukraine’s fast growing current account deficit.
32. The relaxation of expor t quotas should fur ther lead to a significant increase in farm gate pr ices for grain in Ukraine and create incentives for pr ivate investments. The excess spread discussed above would be expected to disappear, providing farmers with improved income opportunities and incentives for investments. In the medium-term, Ukraine could probably produce and export even larger grain volumes (see next chapter).
C. When will Ukraine take its foot off the brake and why should it?
Impact of Ukrainian policies on the wor ld until March 2008
33. By restr icting expor ts of grains and oilseeds / vegetable oils, Ukraine has, along with countr ies such as Argentina, Kazakhstan and Russia, contr ibuted to record wor ld market pr ice levels. As a result of export restrictions in these countries, a number of other countries world-wide must adjust to a larger food shortage. In response to the proliferation of such export restrictions in recent months, Japan announced in late April that it would ask the WTO to introduce new rules to prevent countries from restricting exports of key staple products in the future.
34. With wor ld markets for these products tight, Ukraine does have a cer tain degree of influence on wor ld market pr ices in the shor t run. However, Ukraine would be ill-advised to attempt to exercise this influence by purposely reducing exports in the long run in an effort to drive up world market prices and thus export revenues, either alone or in concert with some form of ‘grain cartel’. Ethical considerations aside, Ukraine’s market power is limited in the long run and the fundamental structure of world grain markets differs considerably from that on, for example, oil markets. The exercise of market power on world food markets has never functioned sustainably in the past.
Ukraine's potential for increasing agr icultural production and trade
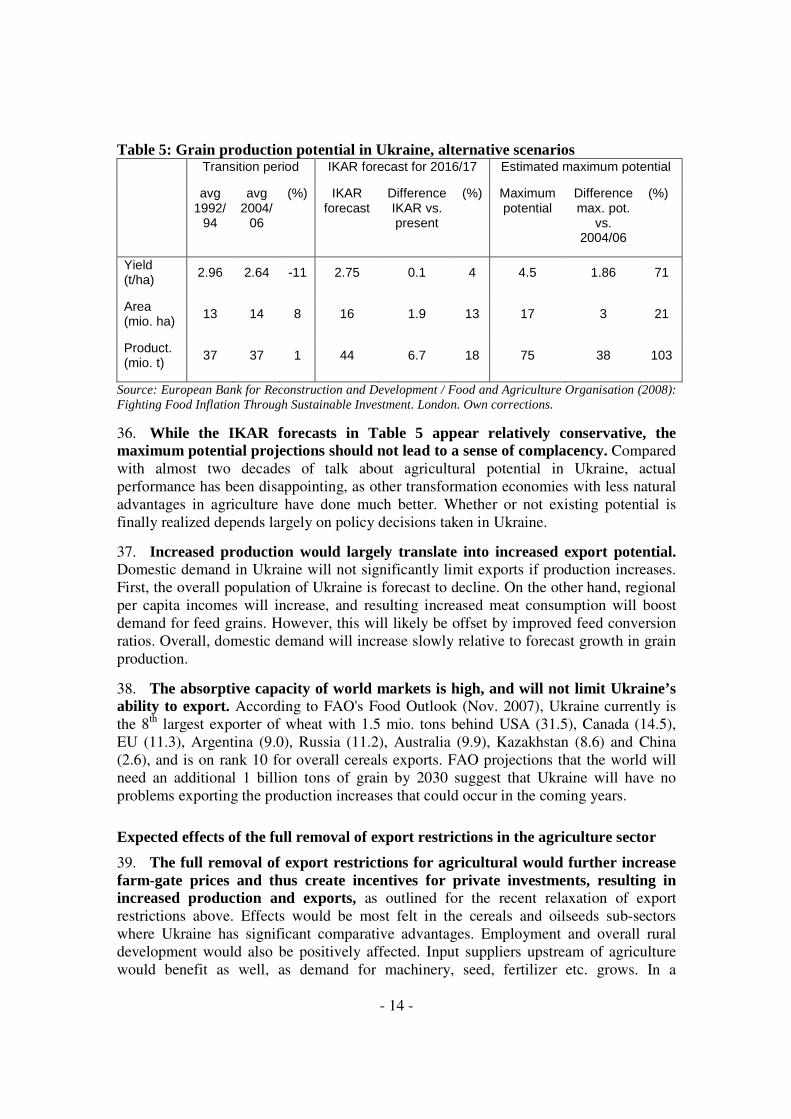
35. Both yields and agr icultural areas in Ukraine could expand considerably if farmers were subject to appropr iate incentives. On the occasion of a regional conference on "Fighting food inflation through sustainable investment" in London in March 2008, FAO in collaboration with EBRD prepared an updated assessment of regional grain production and its potential. According to these analyses, average grain yields fell by 11% in the transition period, from 2.96 to 2.64 t/ha between 1992/94 and 2004/06. The IKAR forecast in Table 5 (next page) calls for a relatively modest increase of 4% to 2.75 t/ha by 2016, while the maximum potential projection based on yields in France corrected for the fact that Ukraine receives less precipitation suggests that a 71% increase to 4.5 t/ha is possible. Combined with acreage expansions of 13% (IKAR forecast) and 21% (maximum potential projection), these yield increases would lead to an expansion in production of between 18 and 103%. Similar forecasts and projections could be generated for oilseeds.
- 14 -
Table 5: Grain production potential in Ukraine, alternative scenar ios Transition period IKAR forecast for 2016/17 Estimated maximum potential
avg 1992/
94
avg 2004/
06
(%) IKAR forecast
Difference IKAR vs. present
(%) Maximum potential
Difference max. pot.
vs. 2004/06
(%)
Yield (t/ha) 2.96 2.64 -11 2.75 0.1 4 4.5 1.86 71
Area (mio. ha)
13 14 8 16 1.9 13 17 3 21
Product. (mio. t)
37 37 1 44 6.7 18 75 38 103
Source: European Bank for Reconstruction and Development / Food and Agriculture Organisation (2008): Fighting Food Inflation Through Sustainable Investment. London. Own corrections.
36. While the IKAR forecasts in Table 5 appear relatively conservative, the maximum potential projections should not lead to a sense of complacency. Compared with almost two decades of talk about agricultural potential in Ukraine, actual performance has been disappointing, as other transformation economies with less natural advantages in agriculture have done much better. Whether or not existing potential is finally realized depends largely on policy decisions taken in Ukraine.
37. Increased production would largely translate into increased expor t potential. Domestic demand in Ukraine will not significantly limit exports if production increases. First, the overall population of Ukraine is forecast to decline. On the other hand, regional per capita incomes will increase, and resulting increased meat consumption will boost demand for feed grains. However, this will likely be offset by improved feed conversion ratios. Overall, domestic demand will increase slowly relative to forecast growth in grain production.
38. The absorptive capacity of wor ld markets is high, and will not limit Ukraine’s ability to export. According to FAO's Food Outlook (Nov. 2007), Ukraine currently is the 8th largest exporter of wheat with 1.5 mio. tons behind USA (31.5), Canada (14.5), EU (11.3), Argentina (9.0), Russia (11.2), Australia (9.9), Kazakhstan (8.6) and China (2.6), and is on rank 10 for overall cereals exports. FAO projections that the world will need an additional 1 billion tons of grain by 2030 suggest that Ukraine will have no problems exporting the production increases that could occur in the coming years.
Expected effects of the full removal of expor t restr ictions in the agr iculture sector
39. The full removal of expor t restr ictions for agr icultural would fur ther increase farm-gate pr ices and thus create incentives for pr ivate investments, resulting in increased production and expor ts, as outlined for the recent relaxation of export restrictions above. Effects would be most felt in the cereals and oilseeds sub-sectors where Ukraine has significant comparative advantages. Employment and overall rural development would also be positively affected. Input suppliers upstream of agriculture would benefit as well, as demand for machinery, seed, fertilizer etc. grows. In a

- 15 -
competitive market, traders mainly earn money on volume, so they would benefit from a sustained expansion in Ukraine’s exports. As increased production eliminated or greatly reduced the probability of net import situations such as prevailed in 2000 and 2003, both traders and processors would benefit from a dependable supply of agricultural raw materials, and a more stable policy environment.
Figure 9: Simulation of gross margins/ha of wheat-producing farms in 2006, three scenar ios.
Source: own calculations.
40. Effects on cereal gross margins – as a measurement of these benefits – would be significant. Figure 9 presents simulation results for wheat that compare the distribution of gross margins/ha across all large wheat-producing farms in 2006 with three scenarios. Simulation A adjusts the 2006 data to account for increased fuel, fertilizer and seed prices, as well as increased output prices prevailing in January 2008. The distribution of gross margins is clearly shifted to the right, and calculations show that the aggregated gross margin10 over all wheat farms increases from 1.7 billion UAH in 2006 to 4.2 billion UAH under the prices prevailing in January 2008. This indicates that on balance, grain producers have profited from recent input and output price increases. Simulation B is identical to simulation A except that output prices are permitted to increase further to the full value they would attain without the price-depressing impact of export restrictions. The distribution of gross margins shifts further to the right, and grows in aggregate to 6.8 billion UAH. Simulation C assumes that in addition to simulation B, the productivity of wheat farming in Ukraine increases by 20%; in other words, farms are able to produce 20% more wheat using a given amount of inputs. Again, the distribution of gross margins 10 The aggregate gross margin can be interpreted as an estimate of value added.

- 16 -
shifts, and the aggregate gross margin of wheat production in Ukraine increases to 8.8 billion UAH. Note that these simulations do not take into account production increases due to possible acreage expansion.
41. The increase in farm gate pr ices will hur t consumers in the shor t run through higher food pr ices. However, it is important to realize that this effect is temporary. Grain export restrictions have contributed to stagnant performance in the grain sector. As a result of this under-performance, Ukraine remains highly vulnerable to poor harvests. In 2000/01 and 2003/04, for example, poor harvests put Ukraine into a net import position for food grains, and domestic prices climbed significantly as a result. Luckily for Ukraine, world market prices were relatively low in those years. Imagine the political turmoil that would have resulted had Ukraine been forced by a poor harvest to import at current world market prices! The only sure way to avoid such a scenario in the future is to lay the basis for an export-oriented agriculture sector that produces stable net food surpluses in the years and decades to come. Experts agree that Ukrainian grain production could be much more robust to adverse weather conditions such as those that prevailed in 2000 and 2003, if the necessary investments took place. Grain export restrictions may bring some measure of short-term relief from high world market prices for consumers, but they do so at the cost of reduced investments in agricultural production and, hence, sustained and perilous vulnerability in the long run.
D. Building Ukraine's expor t-or iented, competitive agr iculture sector
An attempt to formulate a vision
42. Already within the medium term, Ukraine could have a thr iving, expor t-or iented agr iculture sector , producing high-quality food and feed for large domestic and foreign markets, ensur ing food safety and compliance with demanding quality requirements, and providing attractive investment and employment oppor tunities in rural areas.
Current state programs to suppor t the agr iculture sector
43. The Government of Ukraine has established a program for the ‘Agroindustr ial Complex and Development of Rural Areas’ that, if implemented, would make a significant contr ibution to increased sectoral competitiveness and reduced rural/urban disparities. This program – based on the three pillars (i) rural development, (ii) competitiveness of agriculture, including quality and safety issues, and (iii) natural resource management and environmental sustainability – includes provisions for the improvement of social and physical infrastructure in rural areas, for the development of key markets associated with agriculture (finance, land, insurance), for the adoption of international food safety and quality standards, for a transition to efficient mechanisms of state support (decoupled payments), and for increased efficiency based on innovations and knowledge transfer.
44. The Ministry of Agr icultural Policy (MAP) has prepared an advanced draft of a national program for rural development until 2015. Citing relevant laws such as the

- 17 -
Law of Ukraine "On basis principles of national agrarian policy for the period until the year 2015", the Law of Ukraine "On state support for the rural economy of Ukraine", and the Law of Ukraine "On the priority of the development of rural space and the agro-industrial sector in the national economy", MAP has prepared a detailed draft of a national program aiming at enhanced competitiveness on domestic and foreign markets, ensuring food security for the country, and the preservation of rural way of life and peasantry as the carrier of Ukrainian identify, culture, and spirituality.
45. The agr icultural budget has been adjusted to reflect some of the pr ior ies and emphases in the government’s program. Compared with 2007, the share of non-distortive (green box11) expenditures in the adopted budget for 2008 increased from 47.2% to 55.6%. Rural development expenditures have been significantly increased. The government has also significantly increased resources for land market development and the eventual lifting of the moratorium of land sales. Risk management is addressed by increasing the allocation for insurance cost compensation, although the choice of instrument may need to be revisited (see for example index-based weather risk insurance). Budget allocations for research and development, and education and training have increased by 40% and 52%, respectively, but it is not yet evident that the increased budget would improve the quality of education. Support to biofuels production, for which UAH 15 mio. were budgeted in 2007, has been cancelled in 2008, as have subsidies for fertilizer purchases. Overall, agricultural budget allocations under the MAP have increased to 91% of total agricultural public expenditures, which makes the MAP the major authority responsible for agricultural policy and rural development.
46. Despite these positive elements, the effectiveness of much of the public spending for agr iculture remains low. The green box includes many elements such as funding for public stocks that can have a very distortive impact on markets. Many policies are not consistent with the stated goals of improving efficiency and competitiveness. The fact that competitive products such as grains and oilseeds are taxed via export restrictions, for example, while uncompetitive products such as sugar receive significant support, reduces and distorts investment in agriculture. And many policies work at cross-purposes, with the taxing effect of export restrictions, for example, neutralizing the impact of budget spending designed to support grain and oilseeds production.
47. A broadly shared vision combined with an agreed, comprehensive and consistent sector development program, consolidating existing plans and programs and presenting measurable objectives with a timeline of concrete milestones appears 11 "Green Box" measures as defined under the WTO Agreement on Agriculture are measures of domestic support to agriculture that have no, or at most minimal, trade-distorting effects or effects on production. Support needs to be provided through a publicly-funded government program (including government revenue foregone), not involving transfers from consumers, and the support in question must not provide price support to producers. Green box measures are exempt from reduction commitments and include (i) governmental services including research, extension advisory services, market information, pest control, inspection services, infrastructure; (ii) public stockholding for food security purposes; (iii) domestic food aid; (iv) direct payments to producers and decoupled income support; (v) government contribution to income insurance and income safety net programs; (vi) natural disaster relief including gov. contributions to crop insurance schemes; (vii) structural adjustment assistance through producer or resource retirement programs and investment aids; (viii) environmental programs; and (ix) regional assistance programs.

- 18 -
to be still lacking but would be critical to increase efficiency and effectiveness of development initiatives in the agriculture sector. Ukraine needs to finally arrive at a genuine sector-wide approach to agricultural development with a published, agreed, and coordinated agenda across areas of ministerial responsibility and which establishes clear political accountability. The remainder of this chapter outlines some12 of the key reform and investment areas in which significant progress is necessary for the implementation of the vision of an export-oriented, competitive agriculture sector in Ukraine.
Policy and institutional framework
48. A transparent, predictable and market-or iented policy framework for the agr iculture sector will both increase the effectiveness of public expenditure and reduce uncer tainty and r isk, and hence increase pr ivate investments. A key priority is to reduce ad-hoc interference in agricultural markets and eliminate the sudden and unpredictable steps to regulate quantities and prices that make investment in Ukrainian agriculture much less attractive for investors than it could be.
49. Public and pr ivate investment are especially needed to improve the efficiency of marketing systems for agr icultural products. Even if excess price spreads due to export restrictions were completely eliminated, farmers in Ukraine would still get less for their products than their counterparts in other countries because of the high marketing costs. For example, if farmers in Ukraine had received roughly the same share of fob grain prices as their counterparts in Germany, the 2006 harvest of roughly 35 million tons would have resulted in an additional US$ 1 billion of farm revenue, equivalent to about one-half of total government spending in support of agriculture in that year.13
50. Another policy pr ior ity is the completion of institutional ar rangements for the registration of proper ty r ights (including land) and the removal of the morator ium on land sales. Land purchase and sale would not lead to rapid, dramatic changes, but it would set in motion a virtuous circle whereby the availability of collateral increases investment and productivity in agriculture, which in turn leads to increased land values, which make yet more collateral available, etc. It would also, together with the enforcement of bankruptcy procedures in agriculture, increase the pressure on less efficient farmers to leave production and make the resources that they have been using poorly available to more efficient farmers. One of the largest handicaps facing agriculture in Ukraine is the persistence of a very high proportion of highly inefficient farms, many of which are subtracting rather than adding value as they produce14.
51. Compliance with international quality standards will be cr itical for Ukraine's fur ther integration into the global economy. Ukraine has recently completed its lengthy negotiations on WTO accession, and has entered into negotiations with the EU on a free trade agreement (FTA). The extent to which Ukrainian agriculture benefits from WTO membership and an FTA with the EU hinges on its ability to comply with 12 This is not an exhaustive presentation of issues and options. 13 Based on an average fob price of 150$/t and a difference of 20% (= 30 $/t) between the roughly 70% of the fob price that farmers in Germany receive compared with roughly 50% in Ukraine. 14 World Bank, 2008. Ukraine – Agricultural Competitiveness. Draft Policy Note.

- 19 -
international quality standards. For example, Ukraine is currently only able to export most livestock products (meat, milk) to a small number of mainly former Soviet countries. If agronomic practices and product quality do not comply with market requirements and internationally recognized guidelines and standards, the result will be lower quality food products for domestic consumers (food safety), delays in completion of trade agreements, and an inability to access to high-quality-high-price foreign (and domestic) markets.
Public investments
52. Handling, storage and transpor tation infrastructure. Agricultural markets and supply chains continue to be characterized by significant post-harvest losses, high transaction costs, and intransparent price formation due to information asymmetries. This leaves producers with unnecessarily unfavorable deals and limited marketing options, causing low farm-gate prices and hence creating disincentives for private investment in agriculture. It also increases consumer prices. Public investment especially in infrastructure with public good characteristics (road and rail networks, waterways) can intensify competition by reducing regional market power, and therefore act as an important catalyst for private investment in other links of the supply chain. For example, incentives to expand on-farm storage capacity (which would make a major contribution by enabling farmers to avoid being forced to sell into post harvest glut markets) depend on dependable, low cost transport channels to more than one possible purchaser.
53. Ukrainian agr iculture urgently needs centers of excellence in higher education and research to produce future innovations, agr ibusiness leaders, analysts and excellence in administration. As agriculture becomes increasingly sophisticated and competitiveness is increasingly determined by transformations that take place post-harvest in a complex food web, the importance of purely production-based natural conditions is declining. Ukraine, however, currently combines its set of high-potential agro-climatic conditions with insufficient amounts of human capital. Lack of information and expertise on farms coupled with significant information asymmetries have resulted in low and highly heterogeneous productivities, insufficient product qualities, and inequities along supply chains, with implications for farmer incomes individually, the competitiveness of Ukrainian agricultural produce as a whole, and for consumers' food safety concerns.
E. Measures to protect the poor and vulnerable from food pr ice increases
54. Measures to protect the poor and vulnerable from food pr ice increases need to be separated from agr icultural market policy.
Br ief assessment of social assistance programs in Ukraine
55. The Ukrainian government can compensate poor consumers for the increase in food pr ices in a cost-effective manner , if it wishes to do so, through a means-tested compensation program which can be deployed quickly. The fraction of the poorest population to be compensated is a political decision, and may be larger than the fraction of the poor.

- 20 -
56. Ukraine spent about 18 % of its GDP on social secur ity sector in 2007, out of which almost 2.5% of GDP was spent on social assistance, including cash and in-kind transfers (known as privileges). Social pending in 2008 is expected to increase by a further two percent of GDP. While some social assistance programs, notably housing and utility allowances, are not as efficient as they could be because the distribution of spending is not focused on the poorest and most vulnerable groups, the country does have well performing programs. Specifically allowances for single mothers, child allowances for 0-3 years old and the guaranteed minimum income program are very good at identifying the poor.
57. Eligibility for the compensation can be processed via the local depar tment for labor and social protection, which already implements a number of well-targeted programs. Ukraine operates a number of income & asset tested programs, which are very good at identifying the poor: two types of child allowances, and a program for extremely poor households. The last resort program for extreme poor covers 3 to 4% of the population, and channels 73% of the benefits to the poorest 20% of the population. This program is excellent by regional or OECD standards. Two other child allowance programs are also good: 54% of the allowances for lone mothers goes to families at the bottom 20% of the per capita income distribution, and 36% of the child allowances for 0-3 years old goes also there. These results are very good compared to other means-tested programs in Eastern Europe and Central Asia, or even OECD.
58. Targeted aid using the same procedures and legal framework as the last-resor t program, and based on an income and asset test, should be implemented with a higher eligibility cut-off than the last-resor t program, to include a larger fraction of the poorest population. The last-resort program covers only 3.5% of the population. Low income pensioners, unemployed, and other poor families, would have access to this program, in addition to the other social protection benefits they receive.
59. This solution is preferable to, for example, a grain subsidy or school feeding programs. Food subsidies for goods with positive income elasticity, such as wheat, maize or rice, are highly regressive, with the majority of the subsidy going to well-off consumers, who spent a small fraction of their budget on these commodities and can afford to pay more. School subsidies are not an effective way to handle the problem in Ukraine, because they will miss many of the poor. According to the 2006 Household Budget Survey data, families with children account for only 20% of the total population, and only a subset of these families have school-aged children.
National-level response to r ising food pr ices and preparedness
60. Over the medium term, the targeting outcomes of means-tested programs could be fur ther improved by strengthening the ver ification of repor ted wages and other formal incomes combined with imputation of hard-to-ver ify incomes. This combination of instruments is called the hybrid means test (HMT) mechanism. A HMT mechanism selects beneficiaries of social programs based on the total income of the household, where the incomes earned in the formal sector are verified, and those from the informal sector are estimated based on a small set of household characteristics correlated to the true income. This set of predictors of the actual welfare of households is derived

- 21 -
from a representative household survey. They are easy to collect, hard to falsify and easy to verify. In addition verification of formal income could be strengthen by applying proxy means testing to create the risk profiling of clients and by targeting verification to the fraudulent clients.
61. Given the relatively large amounts spent on social assistance in Ukraine and the existence of an effective and sophisticated system to target the poor, it would be most cost efficient to phase out some of the poor per forming programs, such as housing subsidies, while focusing on existing well-designed programs and adapt them to cover the larger targeted group and compensate for food price increases. Combining income test with proxy means testing is the best approach in Ukraine to ensure that the transfers reach the neediest. The government’s best response to the challenges of rising food prices would be the application of the HMT instrument to existing well-performing programs.
62. In addition to improved targeting of social transfers, appropr iate macroeconomic policies have a cr itical role to play. By reducing overall inflation, fiscal and monetary policy contribute directly to limiting the impact of exogenous price shocks on the poor, most of whom are dependent on wage income or social transfers. By contrast, wealthier individuals benefit most from rising inflation, since it reduces their cost of capital and inflates asset values.
63. In par ticular , the Government of Ukraine should refrain from fur ther upward spending revisions in the 2008 budget. Current price trends are well above the forecasted levels in the 2008 budget. Some social payments, in particular minimum pensions, which are indexed against the official inflation forecast, are declining in real terms. However, on the whole, the rise of public wages and social transfers in the 2008 budget is a sufficient cushion against higher inflation. The authorities should bolster the credibility of their anti-inflation program by adopting a realistic inflation forecast but refraining from correspondingly increasing current spending in the budget. It would be preferable not to submit a revised budget at all which would run the risk of populist spending battles further undermining the fight against inflation.
64. The National Bank should pursue its intention to introduce greater exchange rate flexibility and continue its policy of tightening liquidity. The UAH/dollar exchange rate on the inter-bank market has recently strengthened by around 2% against the official rate and the mid-point of the informal band. The NBU should widen the band and demonstrate its commitment to greater flexibility to the market by allowing the official rate to move towards the market level. Moreover, the NBU should be encouraged to tighten the provision of liquidity and enforce tighter prudential norms on the banking sector.