competitiveness and factors affecting indonesian food
TRANSCRIPT

Received: February 2, 2018; Revised: March, 20, 2018; Accepted: April 10, 2018Bogor Agricultural University. Jl. Kamper, Kampus IPB Darmaga, Bogor, West Java, IndonesiaE-mail: [email protected], [email protected], [email protected] DOI: htttp://dx.doi.org/10.15408/etk.v17i2.7239
EtikonomiVolume 17 (2), 2018: 185 - 198P-ISSN: 1412-8969; E-ISSN: 2461-0771
Competitiveness and Factors Affecting Indonesian Food Industry’s Export to Regional Comprehensive Economic Partnership
Mia Ayu Wardani1, Sri Mulatsih2, Wiwiek Rindayati3
Abstract. Regional Comprehensive Economic Partnership (RCEP) is regional cooperation between ASEAN, Australia, China, India, Japan, South Korea and New Zealand. The vast potential of the RCEP provides an opportunity for the improvement of the Indonesian economy. This study aims to analyze the comparative advantages and dynamics export of Indonesia’s food industry as well as the factors affecting exports. The methods used Revealed Comparative Advantage (RCA), Export Product Dynamic (EPD), and panel data. The results indicate that food industry generally has strong competitiveness in the RCEP market except in Australia, Cambodia, Japan, Korea and Laos. Meanwhile, the dynamics position of food industry exports is rising star in ten countries, and the rest are in the position of falling star and retreat. Factors that influence food exports are economic distance, real GDP per capita of the destination country, the population of the destination country, price export, trade openness and tariff.Keywords: competitiveness, food industry, panel data, free trade area, gravity
Abstrak. Regional Comprehensive Economic Partnership (RCEP) merupakan kerjasama regional antara ASEAN dengan Australia, China, India, Jepang, Korea Selatan dan Selandia Baru. Potensi pasar RCEP yang sangat besar memberi peluang bagi peningkatan perekonomian Indonesia. Penelitian ini bertujuan untuk menganalisis daya saing komparatif dan dinamika ekspor industri makanan dan minuman Indonesia serta faktor-faktor yang memengaruhi ekspor industri tersebut ke kawasan RCEP. Metode yang digunakan adalah analisis Revealed Comparative Advantage (RCA),Export product Dynamic (EPD),dan analisis data panel. Hasil penelitian menunjukkan bahwa industri makanan dan minuman Indonesia memiliki daya saing yang kuat di pasar RCEP kecuali pada negara Australia, Kamboja, Jepang, Korea dan Laos. Sedangkan posisi dinamika ekspor industri makanan dan minuman Indonesia berada pada posisi rising star pada sepuluh negara dan sisanya berada pada posisi falling star dan retreat. Faktor-faktor yang memengaruhi ekspor industri makanan minuman Indonesia adalah jarak ekonomi, GDP riil perkapita negara tujuan, populasi negara tujuan, harga ekspor, keterbukaan perdagangan dan tarif.Kata kunci: daya saing, industri makanan, data panel, perdagangan bebas, gravity
How to Cite:
Wardani, M. A., Mulatsih, S., & Rindayati, W. (2018). Competitiveness and Factors Affecting Indonesian Food Industry’s Export to Regional Comprehensive Economic Partnership. Etikonomi: Jurnal Ekonomi. Vol. 17 (2): 185 – 198. doi: http//dx.doi.org/10.15408/etk.v17i2.7239.

Mia Ayu Wardani. Competitiveness and Factors Affecting Indonesian Food Industry’s Export
http://journal.uinjkt.ac.id/index.php/etikonomiDOI: htttp://dx.doi.org/10.15408/etk.v17i2.7239
186
Introduction
Trade liberalization has become the policy of most countries in the world. Trade liberalization is an economic concept that refers to the system of trade in goods and services between countries without any government intervention in the form of tariffs and other trade barriers (Krugman et al., 2012). Trade liberalization builds a free trade that is a country’s trade with other countries without any obstacles. The Government of Indonesia with the ASEAN countries ratified the establishment of FTA for the first time in 2002 in the ASEAN Free Trade Area (AFTA). Furthermore, the ASEAN FTA is expanding its cooperation with its trading partner nations. In 2004, ASEAN cooperated with China (ACFTA). In 2007 ASEAN cooperated with Korea (AKFTA). In 2008 ASEAN established cooperation with Japan (ASEAN-Japan Comprehensive Economic Partnership). In 2010 ASEAN established two joint partnerships with India (AIFTA) and Australia and New Zealand (AANZFTA).
As a response of ASEAN to the economic dynamics of both regional and global, ASEAN initiated RCEP (Regional Comprehensive Economic Partnership). The initiated also embodies the blueprint of the 4th pillar of the ASEAN Economic Community (MEA), i.e., ASEAN integration with the global. The Regional Comprehensive Economic Partnership (RCEP) is a form of economic cooperation between ASEAN and its six trading partners, China, Japan, South Korea, India, Australia and New Zealand. The RCEP deepens the cooperation previously established in the ASEAN+1 FTA. RCEP is expected to become new economic cooperation that can achieve unreached ASEAN+1 objectives. There are three reasons why need to move from ASEAN+1 to RCEP. First, ASEAN+1 has not reached full liberalization. Negotiation of RCEP can give strength to achieve higher tariff liberalization. Second, some form of ASEAN FTA+1 makes a condition called “noodle bowl.” Noodle bowl is a term used to describe the complexity of many agreements from various FTAs. Potential problems arising from a violation of coherence between agreement rules that can hamper every country reach the benefit from FTA. RCEP can solve the problem by providing an overall FTA pooling container. RCEP provides a more convergent work that can reduce the effect of the noodle bowl. Third, the RCEP will strengthen the centrality of ASEAN in the Asia Pacific region (Fukunaga and Isono, 2013).
All RCEP member country leaders at the 21st ASEAN Summit and Related Summit in Phnom Penh, Cambodia undertook to launch of the RCEP negotiations on 18- 20 November 2012. RCEP cooperation is believed to be a mega FTA with strong economic power. The potential condition of the RCEP in the form of the unification of 15 RCEP member countries provides an opportunity market for Indonesia’s export. According to the Ministry of Trade (2015), there are enormous potential and resources in the RCEP. Total population RCEP countries are 3.4 billion (approximately 48% of the world’s population), total GDP reaches USD 20 trillion (40% of world’s GDP) and total trade of USD 10.1 trillion (28% of world’s trade). Therefore, the existence of RCEP can bring an opportunity for Indonesia to develop and improve exports.

http://journal.uinjkt.ac.id/index.php/etikonomiDOI: htttp://dx.doi.org/10.15408/etk.v17i2.7239
187
EtikonomiVolume 17 (2), 2018: 185 - 198
Figure 1 Export and Import Indonesia to RCEP
Source: Trademap
RCEP countries have dominated destination of Indonesia’s export. Based on data from Central Bureau of Statistics/BPS (2017), the calculation of the total value of Indonesian exports to all RCEP members reaches 60% of total exports Indonesia, the remaining 11% to the United States and 29% to other countries including Europe, Asia, and Africa. Based on the top 10 importer countries of Indonesia, 8 of which are members of RCEP, China, Japan, Singapore, India, Malaysia, South Korea, Thailand, and the Philippines. In other hands, Indonesia has a problem to face RCEP cooperation. Indonesia’s export and import in RCEP for the last ten years from 2007 to 2016 has fluctuated. It shows in Figure 1 that Indonesia’s export decline from 2011 to 2017. Indonesia’s import value from RCEP tends to follow the export. The declining Indonesia’s trade with RCEP could cause harm to the Indonesian economy. Besides, since 2012 Indonesia’s import value exceeds its export. This fact reflects that Indonesia is more likely to be an export market than developing export markets in the RCEP region. The declining value of Indonesian exports along with Indonesia’s higher imports than exports is a threat to Indonesia in facing the RCEP cooperation.
A comprehensive strategy is needed to improve Indonesia’s trade performance. This strategy is an effort to face the competition of the international trade. Free trade accelerates with modernization that makes a country cannot separate from industrialization process. In some developed countries, the role of the manufacturing sector is more dominant than the agricultural sector. Arifin (2013) recommends policies that improve the value chains of these commodities in the future, to enhance their competitiveness and sustainability in international trade. So it is vital to changes Indonesia’s trade that initially identified with the agricultural sector turned into the manufacturing sector. The manufacturing sector is a significant component of the national economy and the most significant contributor to GDP. In 2016, the manufacturing sector accounted for 2544 trillion rupiahs in Indonesia’s GDP. The Figure 2 represents the most significant contributor in GDP is manufacturing sector that is equal to 25% of the total GDP. While other sectors are lower contribution such as agricultural sector that is equal to 17% of Indonesia’s total GDP. Figure 2 shows share of GDP Indonesia by sectors in 2016.

Mia Ayu Wardani. Competitiveness and Factors Affecting Indonesian Food Industry’s Export
http://journal.uinjkt.ac.id/index.php/etikonomiDOI: htttp://dx.doi.org/10.15408/etk.v17i2.7239
188
Figure 2 Share of GDP Indonesia by sector in 2016
Source: BPS
The output of Indonesia’s manufacturing sector from 2010 to 2016 has improved with a positive trend of 9.13% (See Figure 3). Although output growth tends to fluctuate, manufacturing growth had a positive trend of about 6.75%. The growth of the industry will bring a chain effect to the economy as an increase of added value to gain of export earnings. Thus, Indonesian manufacturing can still utilize as a strategy to increase Indonesian exports to RCEP. Besides, to its contribution to GDP and an increase in national exports, the manufacturing sector is also a labor-intensive sector that absorbs much labor. Based on data from BPS (2017), the number of workers working in the manufacturing sector has increased significantly from 11.89 million people in 2006 to 15.54 million people in 2016 and continued to increase until February 2017 to 16.57 million people. The increasing labors in the industry certainly contribute to the decline in unemployment in Indonesia. Therefore, the manufacturing sector becomes very important in the role of economic development of the state of Indonesia.
Figure 3 GDP of Industrial sector in Indonesia
The primary industrial sector in Indonesia is the food industry. According to the Ministry of Industry (2017), the food industry sector has always been the largest foreign exchange earner compared to other industries. This industry has the highest export value compared to other industrial sectors. The export trend of the food industry from 2000 to 2016 shows a substantial number of 15.8%. In 2016, the share of the food industry in

http://journal.uinjkt.ac.id/index.php/etikonomiDOI: htttp://dx.doi.org/10.15408/etk.v17i2.7239
189
EtikonomiVolume 17 (2), 2018: 185 - 198
Indonesia’s exports reaches 22% of the total industrial exports. Figure 4 shows the growing conditions of the food industry (ISIC 15) that has been dominating compared to other industries.
Figure 4 Export of all industrial sector
The previous study about food industry did by Fischer and Schornberg (2007) show that during 1999-2002, compared to 1995-1998, for both sectors overall competitiveness increased slightly. Based on the above description, the food industry becomes very important in the role of economic development of Indonesia and one of the strategic steps to face the RCEP cooperation. Therefore, we need a study to review the competitiveness of how strong the food industry of Indonesia in the RCEP market. So Indonesia can use the best strategy to get positive impact from RCEP cooperation. Most existing studies compare RCEP with another FTA such as Rahman and Ara (2015) that analyze TPP-TTIP-RCEP and research by Wilson (2015) that entitle Mega-Regional Trade Deals in the Asia-Pacific: Choosing Between the TPP and RCEP. The research, not specific analyzes about RCEP especially the relationship with Indonesia. Ratna and Huang (2016) had evaluated the impact of tariff and non-tariff reductions on intra- RCEP trade flows.
Nevertheless, this study analyzes generally of trade, not specific in the commodity. To our knowledge, there is no existing study analyzing trade RCEP that focuses on industry sector in Indonesia. So the goals of this study were: first, to analyze the competitiveness of Indonesia’s food industry in RCEP. Second, to identify the dynamics of exports of Indonesia’s food industry in RCEP. Third, to analyze the factors that affect Indonesia’s food industry export of to RCEP.
Method
The data used in this research is secondary data from 16 RCEP member countries, namely Indonesia, Malaysia, Singapore, Brunei, the Philippines, Vietnam, Thailand, Laos, Myanmar, Cambodia, Japan, China, India, South Korea, Australia and New Zealand from
Mia Ayu Wardani. Competitiveness and Factors Affecting Indonesian Food Industry’s Export
http://journal.uinjkt.ac.id/index.php/etikonomiDOI: htttp://dx.doi.org/10.15408/etk.v17i2.7239
190
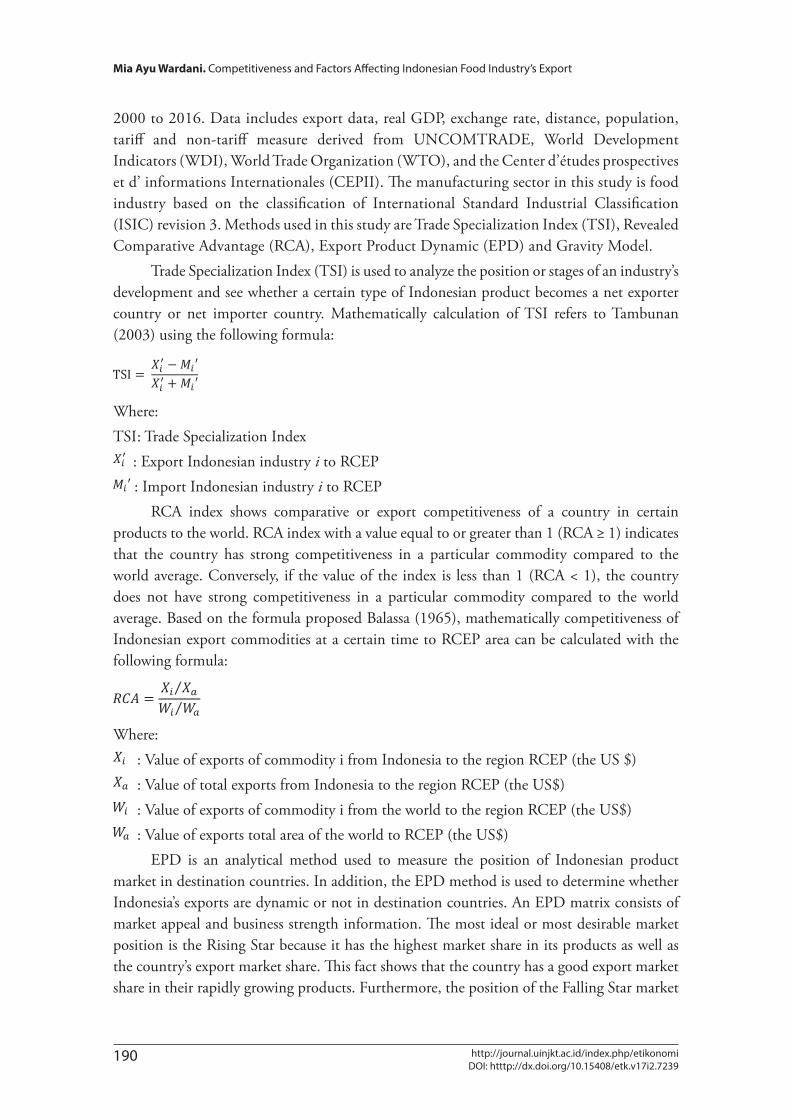
2000 to 2016. Data includes export data, real GDP, exchange rate, distance, population, tariff and non-tariff measure derived from UNCOMTRADE, World Development Indicators (WDI), World Trade Organization (WTO), and the Center d’études prospectives et d’ informations Internationales (CEPII). The manufacturing sector in this study is food industry based on the classification of International Standard Industrial Classification (ISIC) revision 3. Methods used in this study are Trade Specialization Index (TSI), Revealed Comparative Advantage (RCA), Export Product Dynamic (EPD) and Gravity Model.
Trade Specialization Index (TSI) is used to analyze the position or stages of an industry’s development and see whether a certain type of Indonesian product becomes a net exporter country or net importer country. Mathematically calculation of TSI refers to Tambunan (2003) using the following formula:
Where: TSI : Trade Specialization Index
: Export Indonesian industry i to RCEP : Import Indonesian industry i to RCEP
RCA index shows comparative or export competitiveness of a country in certain products to the world. RCA index with a value equal to or greater than 1 (RCA ≥ 1) indicates that the country has strong competitiveness in a particular commodity compared to the world average. Conversely, if the value of the index is less than 1 (RCA < 1), the country does not have strong competitiveness in a particular commodity compared to the world average. Based on the formula proposed Balassa (1965), mathematically competitiveness of Indonesian export commodities at a certain time to RCEP area can be calculated with the following formula:
Where: : Value of exports of commodity i from Indonesia to the region RCEP (the US $) : Value of total exports from Indonesia to the region RCEP (the US$) : Value of exports of commodity i from the world to the region RCEP (the US$) : Value of exports total area of the world to RCEP (the US$)
EPD is an analytical method used to measure the position of Indonesian product market in destination countries. In addition, the EPD method is used to determine whether Indonesia’s exports are dynamic or not in destination countries. An EPD matrix consists of market appeal and business strength information. The most ideal or most desirable market position is the Rising Star because it has the highest market share in its products as well as the country’s export market share. This fact shows that the country has a good export market share in their rapidly growing products. Furthermore, the position of the Falling Star market

http://journal.uinjkt.ac.id/index.php/etikonomiDOI: htttp://dx.doi.org/10.15408/etk.v17i2.7239
191
EtikonomiVolume 17 (2), 2018: 185 - 198
indicates an increase in export market share in stagnant products. The market position of Lost Opportunity shows the decline of export market share in dynamic products. While the market’s least favored position is Retreat because it has the lowest market share in both its products and the country’s exports (Esterhuizen 2006).x-axis: Growth in business forces or so-called export market i:
y axis: Growth market appeal, or so-called market share of products:
Where: : export value of the Indonesia’s food manufacturing to destination country : export value of the world’s food manufacturing to destination country
: total value of Indonesia’s exports to the destination countries : total value of world’s exports to the destination country
: Number of yearsThe method used to analyze factors affecting the food industry exports to RCEP use a
gravity model with panel data processing. The previous study used gravity model was done by Bui and Chen (2015). It examines the factors affecting rice exports in Vietnam. Vietnam’s rice exports ineffective, unsustainable, and unstable. Therefore, to know the factors that influence it, this research uses gravity model method with research period from 2004 until 2013. The result is the biggest impact of Vietnam rice exports influenced by GDP, price, population, and exchange rate. According to Firdaus (2011), there are three methods used to estimate the model with panel data, i.e. Pooled Least Square (PLS), Fixed Effect Model (FEM), and Random Effect Model (REM). In this study, best estimation model is Fixed Effect Model (FEM).
Variables in the model referring to Rahman (2009) with some adjustment variables used. The dependent variable in this study is value export of food industry to RCEP (lnEXP). While the independent variable used in this study was economic distance, real GDP per capita in the destination country, the population of the destination country, export prices, the real exchange rate the country of destination, trade openness, tariff, and dummy Non-tariff Measures. Estimation of the model would be transformed into ln (natural logarithm) to avoid bias model. Specification models are used as follows:
Where: : Export value of industry i Indonesia to the country k in year t (US $)
: real GDP per capita country k year-t (US $)

Mia Ayu Wardani. Competitiveness and Factors Affecting Indonesian Food Industry’s Export
http://journal.uinjkt.ac.id/index.php/etikonomiDOI: htttp://dx.doi.org/10.15408/etk.v17i2.7239
192
: Economic distance beetwen Indonesia and country k year-t : Population country k year-t (person)
: Price export of sector i year-t (US$/ton) : Real exchange rate countries k year-t
: Trade openness country k yeart-t : Rates impoort that applied to the industry i in country k year-t (%)
: DummyNon-TarifMeasure that applied to the industry i in country k year-t. Equal to 1 if in that country is enforced at least 1 SPS or TBT policy and equal to 0 if no SPS or TBT policy applies.
i : Food industry of Indonesiaj : Indonesiak : RCEP countriest : Year analysis
Result and Discussion
TSI and RCA method analyzed the competitiveness of Indonesia’s food industry. A country cannot survive in international competition if it only relies on its comparative advantage, but it must also support with a strong competitive advantage. According to Tambunan (2003), an industry’s competitive advantage can be measured using the Trade Specialization Index. TSI used to know export stage of Indonesia’s food industry in RCEP market. While RCA used to know comparative advantage of Indonesia’s food industry in each RCEP member countries. TSI Index ranged from -1 to 1. Food industry of Indonesia has good position of export stage in RCEP market. Positive TSI index proves it. Average of TSI index from 2000 to 2016 is 0.43. It means that Indonesia as exporter food product in RCEP market. Figure 5 shows the result of TSI. Indonesia’s food industry is showing continued trade performance. This condition is an opportunity for Indonesia to increase exports and expand the country of destination for food industry exports in RCEP market.
RCA index also used to analyze the competitiveness of Indonesia’s food industry in RCEP. The result of 15 RCEP countries shows that RCA index has greater than one. It means Indonesian food industry has high competitiveness in RCEP. The estimation results of the RCA index shows in Table 1. The highest average of RCA is in India for 11.38. This result means that the Indonesian food industry has a comparative advantage and competitive in the Indian state. Similarly, in the country of China, Myanmar, Malaysia, and Brunei have RCA index that greater than one. This condition can be an opportunity for Indonesia to push export products of the food industry in that countries. Indian country is a country that can be selected to be the target of export food product. In addition to the value of high competitiveness in the country, India is one of country which has the largest population in the world. So this may be an opportunity for Indonesia to increase exports of the food product.

http://journal.uinjkt.ac.id/index.php/etikonomiDOI: htttp://dx.doi.org/10.15408/etk.v17i2.7239
193
EtikonomiVolume 17 (2), 2018: 185 - 198
Figure 5 TSI index of Indonesia’s food industry in RCEP
Research about RCA also used by Bojnec and Ferto (2014). This paper analyzed the export competitiveness of dairy products of the European Union (EU) countries (EU-27) on intra-EU, extra-EU, and global markets over the 2000–2011 period. The results indicated that about half of the EU-27 countries had had competitive exports in a particular segment of dairy products. The majority of the new EU-12 countries have faced difficulties in maintaining their level of export competitiveness, at least for some dairy products and market segments. The export competitiveness of the higher level of processed milk products for final consumption can be significant for export dairy chain competitiveness on global markets. Kuldilok et al. (2013) analyze the export competitiveness of the tuna industry in Thailand. The paper uses a revealed comparative advantage (RCA) approach and calculates RCA indices for both major exporters in the world market and competitors in individual export markets. The finding of this research is Thailand has comparative advantage in all major export markets. These have remained stable in the USA, the Middle East, Japan, and Canada but have fallen substantially in Australia. Tuna management and conservation in Thailand could be used to support the sustainability of the industry.
Export dynamics for Indonesian food industry in RCEP market can be researched using Export Product Dynamics (EPD). Based on observations and EPD estimates, the market position of the food industry in Indonesia is illustrated in Table 1. Based on the analysis of EPD, the position of the export of Indonesian food industry are Rising star, Falling star and Retreat. There are ten countries in rising star position, four countries on falling star and a country has retreat position namely Japan. This shows that generally Indonesian food industry has good market position in RCEP region. Position rising star means that during the period 2000-2016, global demand for Indonesian food products increases every year. The rising star position has the highest market share in its products as well as the country’s export market. Countries with position rising star is an ideal position so that ten countries have potential for export purposes Indonesian food product.

Mia Ayu Wardani. Competitiveness and Factors Affecting Indonesian Food Industry’s Export
http://journal.uinjkt.ac.id/index.php/etikonomiDOI: htttp://dx.doi.org/10.15408/etk.v17i2.7239
194
Table 1 Result of RCA and EPD analysis
No Country Trend export (%) Average of RCA EPD
1 Australia 13.93 0.66 Falling Star
2 Brunei 8.86 2.18 Rising star
3 Cambodia 18.59 0.12 Rising star
4 China 22.73 5.30 Rising star
5 India 17.43 11.38 Rising star
6 Japan 2.00 0.47 Retreat
7 Korea 17.61 0.52 Falling Star
8 Laos -20.05 0.57 Rising star
9 Malaysia 18.11 3.44 Rising star
10 Myanmar 30.69 3.70 Rising star
11 New Zealand 27.32 1.99 Rising star
12 Philippines 25.73 1.20 Rising star
13 Singapore 12.58 1.63 Falling Star
14 Thailand 20.65 1.04 Rising star
15 Vietnam 26.88 1.87 Falling Star
Gravity model used in this study that consists of time series data as much as 17 years from 2000 to 2016 and cross-section data for 15 RCEP member countries, ASEAN and six trading partner namely Japan, South Korea, India, China, Australia and New Zealand. Base on fifteen countries of Indonesia’s trading partners in RCEP, not all countries have a consistent trade on food product with Indonesia. Therefore, in this study, the data cross section used is a country which consistently trading with Indonesia from 2000 to 2016. In this analysis does not use the countries of Laos, Myanmar, and Cambodia in a cross-section form because these countries do not have consistency trading with Indonesia. The estimation results are present in Table 2.
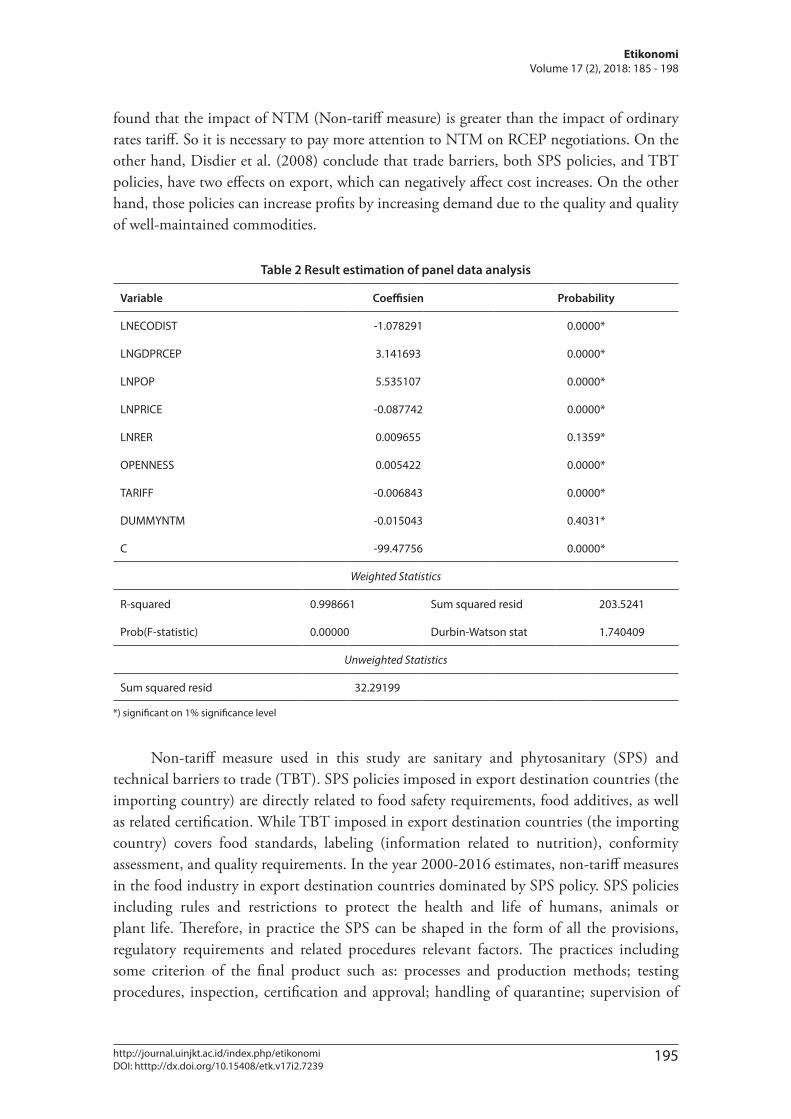
Based on the result, eight independent variables used on this model (See Table 2 for details). Two variables do not significantly affect the export of foods industry to RCEP market. The variable are real exchange rate of the destination country and Non-Tariff Measure. One of the factors that cause the real exchange rate has no effect on the export of food industry is food products is a primary item that is needed by humans. Their appreciation or depreciation of the exchange rate does not affect someone in foods consumption, so the demand for food products still increase.
Non-tariff measure in this research does not affect significantly to the export of Indonesia’s food industry. It is different with previous study by Ratna and Huang (2016) that
http://journal.uinjkt.ac.id/index.php/etikonomiDOI: htttp://dx.doi.org/10.15408/etk.v17i2.7239
195
EtikonomiVolume 17 (2), 2018: 185 - 198
found that the impact of NTM (Non-tariff measure) is greater than the impact of ordinary rates tariff. So it is necessary to pay more attention to NTM on RCEP negotiations. On the other hand, Disdier et al. (2008) conclude that trade barriers, both SPS policies, and TBT policies, have two effects on export, which can negatively affect cost increases. On the other hand, those policies can increase profits by increasing demand due to the quality and quality of well-maintained commodities.
Table 2 Result estimation of panel data analysis
Variable Coeffisien Probability
LNECODIST -1.078291 0.0000*
LNGDPRCEP 3.141693 0.0000*
LNPOP 5.535107 0.0000*
LNPRICE -0.087742 0.0000*
LNRER 0.009655 0.1359*
OPENNESS 0.005422 0.0000*
TARIFF -0.006843 0.0000*
DUMMYNTM -0.015043 0.4031*
C -99.47756 0.0000*
Weighted Statistics
R-squared 0.998661 Sum squared resid 203.5241
Prob(F-statistic) 0.00000 Durbin-Watson stat 1.740409
Unweighted Statistics
Sum squared resid 32.29199
*) significant on 1% significance level
Non-tariff measure used in this study are sanitary and phytosanitary (SPS) and technical barriers to trade (TBT). SPS policies imposed in export destination countries (the importing country) are directly related to food safety requirements, food additives, as well as related certification. While TBT imposed in export destination countries (the importing country) covers food standards, labeling (information related to nutrition), conformity assessment, and quality requirements. In the year 2000-2016 estimates, non-tariff measures in the food industry in export destination countries dominated by SPS policy. SPS policies including rules and restrictions to protect the health and life of humans, animals or plant life. Therefore, in practice the SPS can be shaped in the form of all the provisions, regulatory requirements and related procedures relevant factors. The practices including some criterion of the final product such as: processes and production methods; testing procedures, inspection, certification and approval; handling of quarantine; supervision of

Mia Ayu Wardani. Competitiveness and Factors Affecting Indonesian Food Industry’s Export
http://journal.uinjkt.ac.id/index.php/etikonomiDOI: htttp://dx.doi.org/10.15408/etk.v17i2.7239
196
statistical methods, procedures sampling and methods of risk assessment that is relevant; as well as the packaging and labeling requirements directly related to food safety. Food safety standards into one which was considered by the authorities abroad, so that is what’s become an obstacle to Indonesian products outside the tariff.
According to the Ministry of Industry (2017), the development of innovation and implementation of security standards for food products could stimulate the competitiveness of the food industry in the global arena that will encourage the expansion of the export market. To confirm of the product that is safe, nutritious and quality, so far the government has encouraged the Indonesian National Standard (SNI), Good Manufacturing Practices (GMP), Hazard Analysis and Critical Control Point (HACCP), Food Hygiene, Food Safety, Food Sanitation, as well as the International Food Standards (Codex Alimentarius). That was to ensure the company implemented a raw material selection, processing, packaging, distribution and trading to product safety. Given some of this food product safety standards has guaranteed food products Indonesia qualified food safety and competitiveness in the RCEP market. Therefore, whether or not the form of non-tariff barriers imposed by Indonesia’s export destination countries no significant effect on the export of Indonesian food industry. There NTM or not, the export of Indonesian food industry keep growing due to improved competitiveness.
Other variables included in the model estimation have a significant effect on exports of food industry. These variables are economic distance, real GDP per capita RCEP countries, population of destination country, the export prices, the real exchange rate, openness of trade and tariff. Variable economic distance between the Indonesian and destination country has negative effect, where an increase in the distance between the Indonesian economy with the target country by one percent, the value of commodity exports will decline 1.07%. Increased economic distance makes the costs incurred higher destination country; this will reduce the demand for Indonesian exports so that the export value of Indonesian industry will decline.
Variable real GDP per capita of the destination country has a positive effect. Whereby any increase in real GDP per capita of the destination country by one percent, the value of food export will increase by 3.14%. Increased real GDP per capita of a country indicates an increase in the purchasing power; this will increase the demand for Indonesian exports so that the export value of Indonesian food industry will increase. Population variables influence positively to food export, where any increase in the population of a country by one percent, the value of food export will increase by 5.53%. The increasing population of destination countries indicate increased consumption of the destination country; this will increase the demand for Indonesian exports so that the export value of Indonesian food industry will increase. Their population growth in the importing country will increase the number of food products which can be exported due to the increase of consumption in the country. This condition can be exploited by Indonesia to increase the export of food to big country.
Export price variables have a negative effect, where every commodity price increase of one percent then the value of food export will decrease by 0.08% (cateris paribus). Rising

http://journal.uinjkt.ac.id/index.php/etikonomiDOI: htttp://dx.doi.org/10.15408/etk.v17i2.7239
197
EtikonomiVolume 17 (2), 2018: 185 - 198
export prices make the cost of destination countries higher; this will reduce the demand for Indonesian exports so that the value of Indonesia’s food industry exports will decline. Trade openness variables are expressed in trade per GDP is positive and significant impact on the food industry (ISIC 15) on the level of 1%. Variable trade per GDP show positive sign that means the more open a country in the RCEP region to trade can increase the value of Indonesian food industry exports. A positive trade variable per GDP indicates that the more open a country in the RCEP region to trade can increase the value of Indonesian food industry exports. Based on the estimation result, if there is a increase trade per GDP of 1%, it can increase the export value of food industry by 0.005%. The tariff variable has a negative effect to the food industry export. Import tariffs imposed on commodities imported from other countries. Therefore, tariff reduction on cooperation is essential because it can increase Indonesian exports.
Conclusion
Indonesian food industry has a strong competitiveness in the RCEP market. In general, the position of the food industry exports is in rising star position on the market RCEP. Countries that have the potential to be targeted export Indonesian food industry include India, China, Myanmar, Malaysia, Brunei and New Zealand. It was known that the factors that affect the export of Indonesian food industry to RCEP region are economic distance, real GDP per capita destination country, the population of the destination country, export price, trade openness, and tariffs.
Policy suggestions that can be submitted are choosing RCEP member countries with large populations, high trade openness, and a low tariff as an export market of Indonesia. In RCEP negotiations, Indonesia should propose tariffs on food products. Besides, increase in product innovation required for the expansion of the export market share of Indonesia. Improved product standards are indispensable for food products in Indonesia. For Indonesia, the next step should strengthen economic integration among member countries to join forces, to maximize economies of scale, and also increase the export of foods products to RCEP market. Future studies are advised to use other variables that have not listed in the model, such non-tariff measure as a whole and use the NTM for more detailed calculations.
References
Arifin, B. (2013). On the Competitiveness and Sustainability of the Indonesian Agriculture Export Commodities. ASEAN Journal of Economics, Management and Accounting. Vol. 1(1): 81-100.
Balassa, B. (1965). The Theory of Economic Integration. Massachusetts: Homewood Illinois: RD Irwin Inc.
Bojnec, S., & Ferto, I. (2014). Export Competitiveness of Dairy Product on Global Markets: The Case of the European Union Countries. Journal of the American Dairy Science Association. Vol. 97(10): 6151-6163.

Mia Ayu Wardani. Competitiveness and Factors Affecting Indonesian Food Industry’s Export
http://journal.uinjkt.ac.id/index.php/etikonomiDOI: htttp://dx.doi.org/10.15408/etk.v17i2.7239
198
Bui, T. H. H., & Chen, Q. (2015). An Analysis of Factors in Influencing Rice Export in Vietnam Based on Gravity Model. Journal of the Knowledge Economy. Vol. 8(3): 830-844. doi: https://doi.org/10.1007/s13132-015-0279-y.
Disdier, A. C., Fontagne, L., & Mimuoni, M. (2008). The Impact of Regulations on Agricultural Trade: Evidence from The SPS and TBT Agreements. American Journal of Agricultural Economics. Vol. 90(2): 336-350.
Esterhuizen. (2006). Measuring and Analysing Competitiveness in The Agribusiness Sector: Methodological and Analytical Framework. (Unpublished Dissertattion). Pretoria: University of Pretoria.
Firdaus, M. (2011). Aplikasi Ekonometrika Untuk Data panel dan Time Series (The Econometrics Aplication for Panel and Time Series Data). Bogor: IPB Press.
Fischer, C., & Schornberg, S. (2007). The Competitiveness Situation of the EU Meat Processing and Beverage Manufacturing Sectors. Journal Acta Agriculturae Scandinavica Section C-Food Economics. Vol. 4(3): 148-158. doi: https://doi.org/10.1080/16507540701597139.
Fukunaga, Y., & Isono, I. (2013). Taking ASEAN+1 FTAs towards the RCEP: A Mapping Study. Economic Research Institute for ASEAN and East Asia Discussion Paper Series. 2.
Kuldilok, K. S., Dawson, P. J., & Lingard, J. (2013). The Export Competitiveness of the Tuna Industry in Thailand. British Food Journal. Vol. 115(3): 328-341.
Krugman, P. R., Obstfeld, M., & Melitz, M. (2012). International Economics Theory and Policy, Ninth Edition. New Jersey: Pearson Prentice Hall.
Rahman, M. M. (2009). Australia’s Global Trade Potential: evidence from the gravity model analysis. Oxford Business & Economics Conference Program. London: Oxford University.
Rahman, M. M., & Ara, L. A. (2015). TPP, TTIP and RCEP: Implications for South Asian Economies. South Asia Economic Journal. Vol. 16(1): 27-45. doi: https://doi.org/10.1177/1391561415575126.
Ratna, R. S., & Huang, J. (2016). Regional Comprehensive Economic Partnership (RCEP) FTA: Reducing Trade Cost Through Removal of Non-Tariff Measures. Korea and the World Economy. Vol. 17(2):213-242
Tambunan, T. H. (2003). Perkembangan Sektor Pertanian di Indonesia: Beberapa Isu Penting (The Development of Agricultural Sector in Indonesia: Some Important Issues). Jakarta: Ghalia Indonesia.
Trade, Ministry. (2015). Analysis of the Potential and Benefit of Value ChainRegional Comprehensive Economic Partnership for Indonesia. Final Report of the Agency for the Assessment and Development of Trade Policy.