competitiveness of the eu poultry meat sector - · pdf filelei wageningen ur is one of the...
TRANSCRIPT
LEI Wageningen UR is one of the world’s leading independent socio-economic research institutes. LEI’s unique data, models and knowledge offer clients insight and integrated advice on policy and decision-making in an innovative manner, and ultimately contribute to a more sustainable world. LEI is part of Wageningen UR (University and Research centre), forming the Social Sciences Group together with the Department of Social Sciences and Wageningen UR Centre for Development Innovation.
The mission of Wageningen UR (University & Research centre) is ‘To explore the potential of nature to improve the quality of life’. Within Wageningen UR, nine specialised research institutes of the DLO Foundation have joined forces with Wageningen University to help answer the most important questions in the domain of healthy food and living environment. With approximately 30 locations, 6,000 members of staff and 9,000 students, Wageningen UR is one of the leading organisations in its domain worldwide. The integral approach to problems and the cooperation between the various disciplines are at the heart of the unique Wageningen Approach.
LEI Wageningen URP.O. Box 297032502 LS Den HaagThe NetherlandsE [email protected]/lei
REPORT LEI 2014-038ISBN/EAN 978-90-8615-691-765
P.L.M. van Horne and N. Bondt
International comparison base year 2013
Competitiveness of the EU poultry meat sector

Competitiveness of the EU poultry meat sector
International comparison base year 2013
P.L.M. van Horne and N. Bondt
This research has been commissioned by the Association of Poultry Processors and Poultry Trade (AVEC) in the EU.
LEI Wageningen UR Wageningen, November 2014
REPORT
LEI 2014-038
ISBN/EAN 978-90-8615-691-765
Horne, P.L.M. van, N. Bondt, 2014. Competitiveness of the EU poultry meat sector; International comparison base year 2013. Wageningen, LEI Wageningen UR (University & Research centre), LEI Report 2014-038. 46 pp.;14 fig.;19 tab.;19 ref. Key words: Competitiveness, poultry meat, production costs, international trade, EU. This report can be downloaded for free at www.wageningenUR.nl/en/lei (under LEI publications). © 2014 LEI Wageningen UR P.O. Box 29703, 2502 LS Den Haag, The Netherlands, T +31 (0)70 335 83 30 E [email protected], www.wageningenUR.nl/en/lei. LEI is part of Wageningen UR (University & Research centre).
For its reports, LEI utilises a Creative Commons Attributions 3.0 Netherlands license. © LEI, part of DLO Foundation, 2014 The user may reproduce, distribute and share this work and make derivative works from it. Material by third parties which is used in the work and which are subject to intellectual property rights may not be used without prior permission from the relevant third party. The user must attribute the work by stating the name indicated by the author or licensor but may not do this in such a way as to create the impression that the author/licensor endorses the use of the work or the work of the user. The user may not use the work for commercial purposes. LEI accepts no liability for any damage resulting from the use of the results of this study or the application of the advice contained in it. LEI is ISO 9001:2008 certified. LEI Report 2014-038 | Project code 2282100057 Cover photo: Shutterstock
Contents
Preface 5
Summary 7
S.1 Key findings 7 S.2 Complementary findings 8 S.3 Methodology 9
1 EU legislation 10
1.1 Introduction 10 1.2 EU legislation 10 1.3 Economic impact of EU legislation 12 1.4 Situation in some third countries 13
2 Structure and employment 16
2.1 Introduction 16 2.2 Poultry meat production 16 2.3 Structure 17 2.4 Employment 19 2.5 Production value 20 2.6 Alternative broiler production 21
3 Production costs of broilers 2013 in selected countries 23
3.1 Production costs in some EU countries 23 3.1.1 Production costs at primary farm 23 3.1.2 Production costs after slaughter 25
3.2 Production costs in some non-EU countries 26 3.2.1 Production costs at primary farm 26 3.2.2 Production costs after slaughter 28
4 Import and export of poultry meat 30
4.1 Imports of breast fillet 30 4.2 Imports of leg meat 32 4.3 Exports 33
5 Results of different scenarios 34
5.1 Description of the scenarios 34 5.2 Production costs of breast fillet 34 5.3 Scenario 1 - Lower EU import levy 35 5.4 Scenario 2 - Change in exchange rates 36 5.5 Scenario 3 - Combination 37
6 Conclusions 39
References and websites 42
Annex 1: Development of the currency exchange rate in Argentina, Brazil, USA, Ukraine and Russia compared with the euro (2004 = 100%) 44
Annex 2: Overview of EU import levies and quotas 45
Preface
Companies in the EU poultry meat supply chain have to comply with European legislation on animal welfare, food safety and environmental protection. While the legislation aims to guarantee a qualitatively good poultry production, it also confronts the sector with extra costs. Countries outside the EU do not have the same extensive legislation. At the same time, the EU is involved in multilateral negotiations with the World Trade Organisation (WTO) and bilateral negotiations with different partners including India, Ukraine, Mercosur and the USA, both of which are intended to further liberalise trade by further reducing or abolishing import levies. This causes concerns within the EU on its competitiveness in the poultry meat industry. In this report the Agricultural Economics Research Institute (LEI), an independent research institute of Wageningen UR (University and Research) in the Netherlands, presents the results of a study on the competitiveness of the EU poultry meat sector. The production costs for poultry meat are calculated for several EU and non-EU countries. Based on these data, several scenarios are described and their effect is calculated to illustrate the impact of lower import levies and changes in exchange rates. The study was initiated and funded by the Association of Poultry Processors and Poultry Trade (AVEC) in the EU. The authors thank AVEC for providing data and for commentary on the draft report. Ir. L.C. van Staalduinen Director General LEI Wageningen UR
LEI 2014-038 | 5

6 | LEI 2014-025
Summary
S.1 Key findings
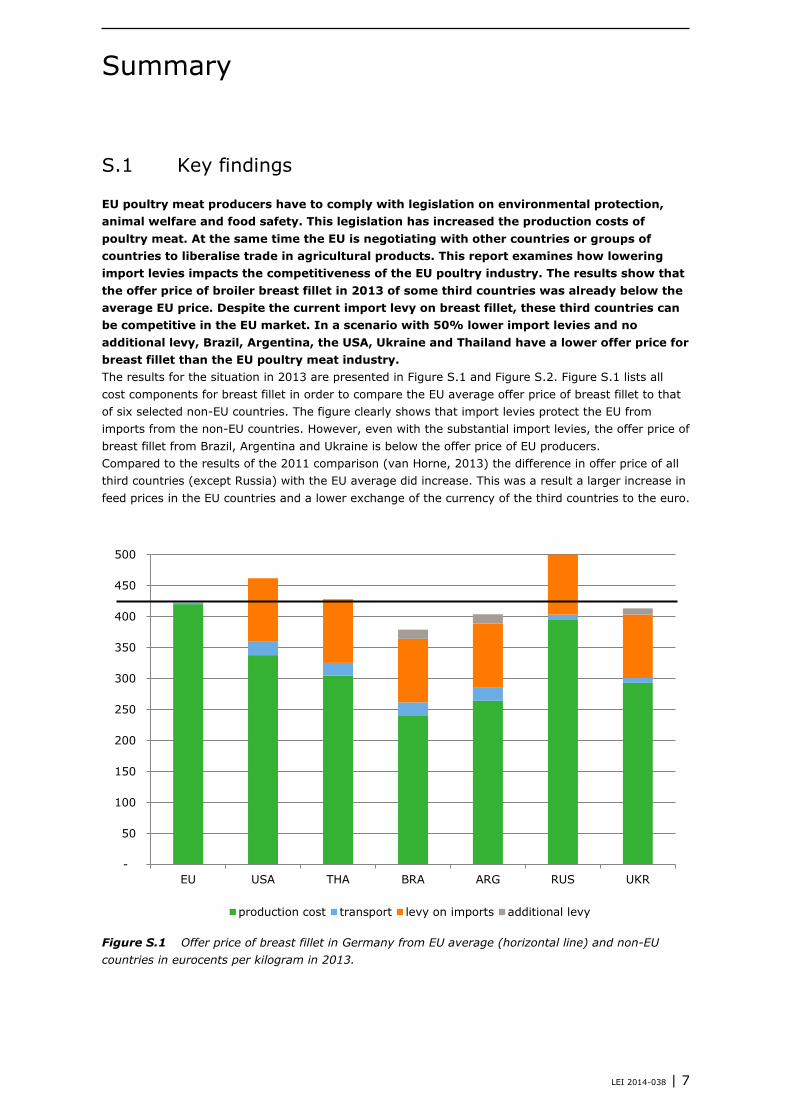
EU poultry meat producers have to comply with legislation on environmental protection, animal welfare and food safety. This legislation has increased the production costs of poultry meat. At the same time the EU is negotiating with other countries or groups of countries to liberalise trade in agricultural products. This report examines how lowering import levies impacts the competitiveness of the EU poultry industry. The results show that the offer price of broiler breast fillet in 2013 of some third countries was already below the average EU price. Despite the current import levy on breast fillet, these third countries can be competitive in the EU market. In a scenario with 50% lower import levies and no additional levy, Brazil, Argentina, the USA, Ukraine and Thailand have a lower offer price for breast fillet than the EU poultry meat industry. The results for the situation in 2013 are presented in Figure S.1 and Figure S.2. Figure S.1 lists all cost components for breast fillet in order to compare the EU average offer price of breast fillet to that of six selected non-EU countries. The figure clearly shows that import levies protect the EU from imports from the non-EU countries. However, even with the substantial import levies, the offer price of breast fillet from Brazil, Argentina and Ukraine is below the offer price of EU producers. Compared to the results of the 2011 comparison (van Horne, 2013) the difference in offer price of all third countries (except Russia) with the EU average did increase. This was a result a larger increase in feed prices in the EU countries and a lower exchange of the currency of the third countries to the euro.
Figure S.1 Offer price of breast fillet in Germany from EU average (horizontal line) and non-EU countries in eurocents per kilogram in 2013.
-
50
100
150
200
250
300
350
400
450
500
EU USA THA BRA ARG RUS UKR
production cost transport levy on imports additional levy
LEI 2014-038 | 7
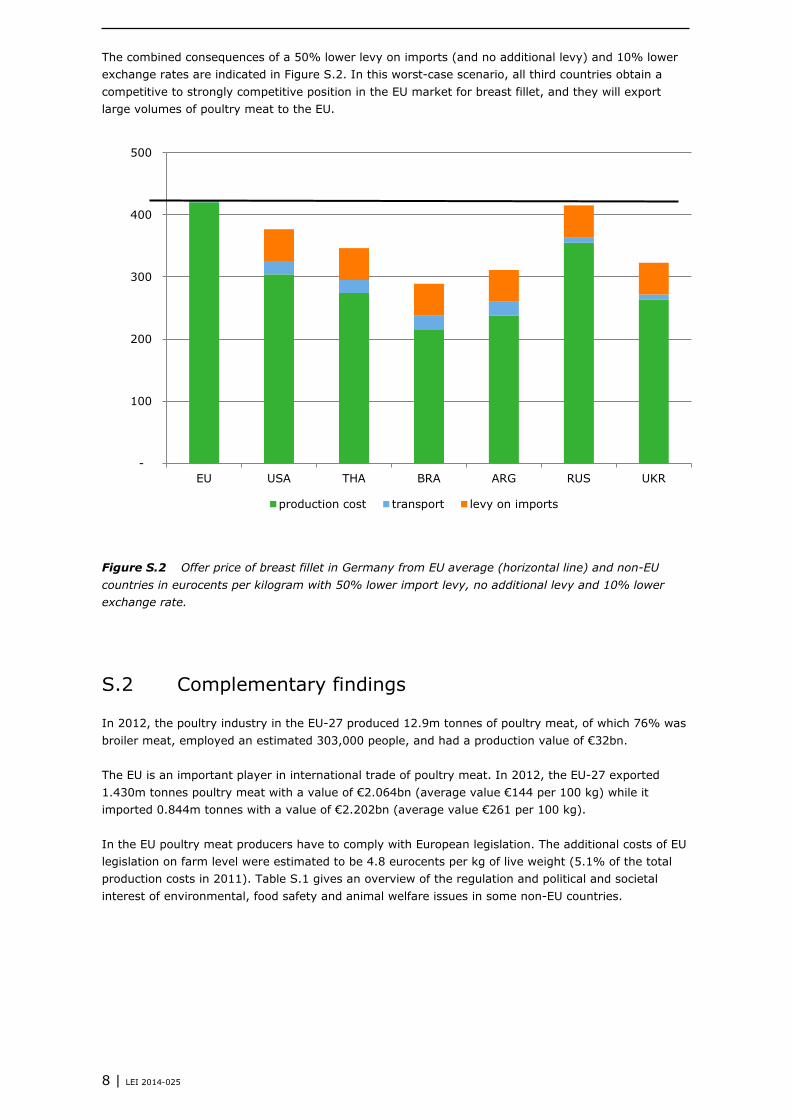
The combined consequences of a 50% lower levy on imports (and no additional levy) and 10% lower exchange rates are indicated in Figure S.2. In this worst-case scenario, all third countries obtain a competitive to strongly competitive position in the EU market for breast fillet, and they will export large volumes of poultry meat to the EU.
Figure S.2 Offer price of breast fillet in Germany from EU average (horizontal line) and non-EU countries in eurocents per kilogram with 50% lower import levy, no additional levy and 10% lower exchange rate.
S.2 Complementary findings
In 2012, the poultry industry in the EU-27 produced 12.9m tonnes of poultry meat, of which 76% was broiler meat, employed an estimated 303,000 people, and had a production value of €32bn. The EU is an important player in international trade of poultry meat. In 2012, the EU-27 exported 1.430m tonnes poultry meat with a value of €2.064bn (average value €144 per 100 kg) while it imported 0.844m tonnes with a value of €2.202bn (average value €261 per 100 kg). In the EU poultry meat producers have to comply with European legislation. The additional costs of EU legislation on farm level were estimated to be 4.8 eurocents per kg of live weight (5.1% of the total production costs in 2011). Table S.1 gives an overview of the regulation and political and societal interest of environmental, food safety and animal welfare issues in some non-EU countries.
-
100
200
300
400
500
EU USA THA BRA ARG RUS UKR
production cost transport levy on imports
8 | LEI 2014-025
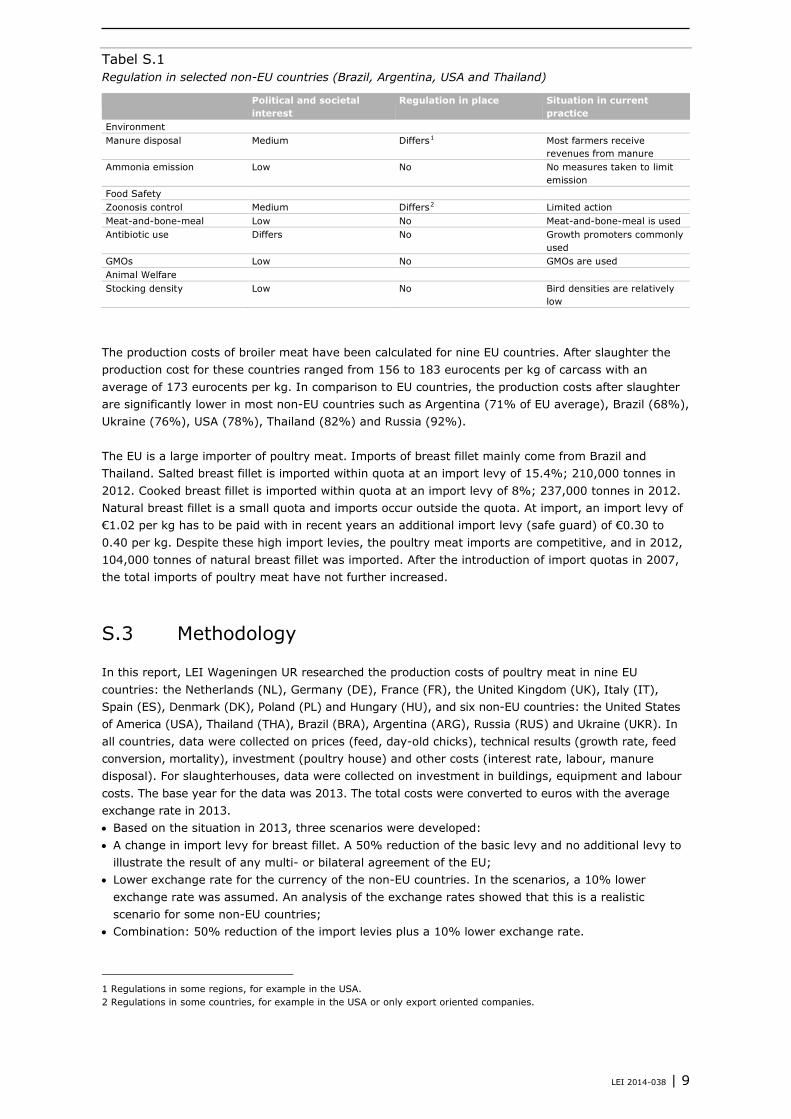
Tabel S.1 Regulation in selected non-EU countries (Brazil, Argentina, USA and Thailand)
Political and societal interest
Regulation in place Situation in current practice
Environment Manure disposal Medium Differs1 Most farmers receive
revenues from manure Ammonia emission Low No No measures taken to limit
emission Food Safety Zoonosis control Medium Differs2 Limited action Meat-and-bone-meal Low No Meat-and-bone-meal is used Antibiotic use Differs No Growth promoters commonly
used GMOs Low No GMOs are used Animal Welfare Stocking density Low No Bird densities are relatively
low
The production costs of broiler meat have been calculated for nine EU countries. After slaughter the production cost for these countries ranged from 156 to 183 eurocents per kg of carcass with an average of 173 eurocents per kg. In comparison to EU countries, the production costs after slaughter are significantly lower in most non-EU countries such as Argentina (71% of EU average), Brazil (68%), Ukraine (76%), USA (78%), Thailand (82%) and Russia (92%). The EU is a large importer of poultry meat. Imports of breast fillet mainly come from Brazil and Thailand. Salted breast fillet is imported within quota at an import levy of 15.4%; 210,000 tonnes in 2012. Cooked breast fillet is imported within quota at an import levy of 8%; 237,000 tonnes in 2012. Natural breast fillet is a small quota and imports occur outside the quota. At import, an import levy of €1.02 per kg has to be paid with in recent years an additional import levy (safe guard) of €0.30 to 0.40 per kg. Despite these high import levies, the poultry meat imports are competitive, and in 2012, 104,000 tonnes of natural breast fillet was imported. After the introduction of import quotas in 2007, the total imports of poultry meat have not further increased.
S.3 Methodology
In this report, LEI Wageningen UR researched the production costs of poultry meat in nine EU countries: the Netherlands (NL), Germany (DE), France (FR), the United Kingdom (UK), Italy (IT), Spain (ES), Denmark (DK), Poland (PL) and Hungary (HU), and six non-EU countries: the United States of America (USA), Thailand (THA), Brazil (BRA), Argentina (ARG), Russia (RUS) and Ukraine (UKR). In all countries, data were collected on prices (feed, day-old chicks), technical results (growth rate, feed conversion, mortality), investment (poultry house) and other costs (interest rate, labour, manure disposal). For slaughterhouses, data were collected on investment in buildings, equipment and labour costs. The base year for the data was 2013. The total costs were converted to euros with the average exchange rate in 2013. • Based on the situation in 2013, three scenarios were developed: • A change in import levy for breast fillet. A 50% reduction of the basic levy and no additional levy to
illustrate the result of any multi- or bilateral agreement of the EU; • Lower exchange rate for the currency of the non-EU countries. In the scenarios, a 10% lower
exchange rate was assumed. An analysis of the exchange rates showed that this is a realistic scenario for some non-EU countries;
• Combination: 50% reduction of the import levies plus a 10% lower exchange rate.
1 Regulations in some regions, for example in the USA. 2 Regulations in some countries, for example in the USA or only export oriented companies.
LEI 2014-038 | 9
1 EU legislation
Introduction 1.1
This chapter provides an overview of legislation in the EU. Poultry farmers and other food business operators in the poultry meat chain in the EU have to comply with this European legislation. This legislation is the translation of societal and political choices made in the EU and its standards and demands may exceed international standards and practices. Most EU legislation relates to environmental protection, animal welfare and food safety. Paragraph 1.2 gives an overview of the most important legislation. Paragraph 1.3 presents the economic impact of the legislation while Section 1.4 gives a short overview of the current situation of (welfare) legislation in some third countries. Although all links in the supply chain are confronted with EU legislation, this chapter mainly focuses on the situation and consequences at farm level.
EU legislation 1.2
This section briefly presents the EU legislation that is directly relevant to the poultry meat sector. Some countries choose to go beyond EU standards by implementing more stringent national or regional legislation, which is not, or just briefly, discussed in this chapter. A report of the European Parliament, written by a group of research institutes, gives an overview of EU legislation related to the livestock sector: beef cattle, pigs, sheep and poultry (Chotteau et al., 2009). Environmental protection The EU has taken measures to limit the pollution of land, water and air. The main environmental legislation affecting poultry production in the EU are the Nitrates Directive and the Integrated Pollution Prevention and Control Directive (IPPC Directive). The Nitrates Directive (91/676/EC) aims to control pollution and protect water quality in Europe, by preventing nitrates from agricultural sources from polluting ground and surface waters and by promoting the use of good farming practices. The Nitrates Directive forms an integral part of the Water Framework Directive and is one of the key instruments to protect waters against agricultural pressures. The Directive has established action programmes to be implemented by farmers, such as limitation of fertiliser application and/or a maximum amount of livestock manure that can be applied per hectare per year (170 kg of nitrogen). Some countries have additional national environmental legislation to limit manure spreading to certain periods or specific soil types. This is especially relevant in areas with a high concentration of pigs and poultry, such as the south and east of the Netherlands, Flanders in Belgium, Bretagne in France, Catalonia in Spain, and the Po valley in the north of Italy. Because of this legislation poultry farmers in these areas have to pay manure disposal costs (Van Horne, 2012). The IPPC Directive (2008/1/EC) applies to larger farms with more than 40,000 birds. The aim of the IPPC Directive is to apply the best available techniques to prevent or to reduce ammonia or other emissions to air, land and water from these activities, since pollution from poultry houses need to be controlled. The Directive requires these farms to have a production permit and to undergo an environmental impact assessment. A fee is charged to cover the costs of the assessment. The Directive also requires an odour or noise management plan in case of potential odour or noise complaints (Van Wagenberg et al., 2012). In addition, Directive 2001/81/EC gives National Emission Ceilings to ammonia emission for every member state. Some countries, such as the Netherlands and Germany, have additional national regulations to reduce ammonia emissions from poultry houses. EU countries have to meet limit values for certain substances to ensure air quality, following Directive 2008/50/EC. The Directive offers 3- or 5-year extensions to comply with the limit values based on conditions and the assessment by the European Commission. Several EU Member states will have to
10 | LEI 2014-025
take measures to reduce emissions of fine dust from the most important sources, such as poultry houses, in which the dust arises from feathers, bedding material and manure (Aarnink and Ellen, 2008). National authorities can set emission standards for fine dust from poultry houses based on the Best Available Techniques (BAT). On 27 October 2003, the European Union's Council of Ministers adopted The Energy Taxation Directive (2003/96/EC), restructuring the European Community framework to tax energy products and electricity. The Directive widens the scope of the EU's minimum rate system for energy products, previously limited to mineral oils, to all energy products, including coal, natural gas and electricity. The taxation leads to a rise of energy prices for broiler farmers, resulting in higher costs of heating and mechanical ventilation. Food safety The poultry meat industry has to adapt rules of hygiene, traceability and labelling, because foodstuffs of animal origin may present microbiological and chemical risks. The EU has extensive food safety legislation based on risk analysis, most importantly the General Food Law (Regulation (EC) No 178/2002) and the hygiene package (Regulations (EC) No 852/2004, 853/2004, 854/2004 and 882/2004). This legislation states that food business operators such as farmers have the primary responsibility for food safety. Farmers are specifically affected by legislation on implementing good agricultural practices and Salmonella control. Farmers are also confronted with higher feed costs as a result of EU legislation. For the poultry meat sector, the Zoonoses legislation is especially relevant. Zoonoses Directive 2003/99/EC and Regulation 2160/2003 regulate sampling, monitoring and control measures. Between member states, there is a large variation in Salmonella prevalence. In response to the EFSA baseline study, each member state had to make a plan to reduce the Salmonella prevalence in poultry meat. The legislation ensures that proper and effective measures are taken to detect and to control Salmonella and other zoonotic agents at all stages of production, processing and distribution, particularly at the level of primary production, including in feed. The European legislation on animal feed provides a framework to ensure that feedstuffs do not endanger to human or animal health or the environment. The legislation sets rules on the circulation and use of feed materials, requirements for feed hygiene, rules on undesirable substances in animal feed, legislation on genetically modified food and feed, and conditions for the use of additives in animal nutrition. For example, in the EU the use of meat-and-bone meal is banned. The consequence is higher disposal costs for slaughterhouses and higher costs for poultry feed. Furthermore, in January 2006, the EU banned growth-promoting antibiotics in animal feed. In addition, the European Commission has launched an EU strategy to combat the threat of antimicrobial resistance to human, animal and plant health. The strategy includes phasing out of antibiotics for non-medical use in animals, and covers a range of actions at EU and national level in the areas of data collection, surveillance, research and awareness-raising. A large proportion of protein sources for poultry feed is imported from outside the EU. An increasing share of world production of soya crops is from genetically modified hybrids. The asynchronous EU approval of GM crops, coupled with the operation of almost zero tolerance, is negatively affecting the EU supply of feed ingredients (Backus et al., 2008), resulting in higher feed costs. Animal welfare All member states have ratified the European Convention for animal protection with principles relating to animal housing, feed and care appropriate to their needs (Council Directive 98/58/EC). The aim is to spare animals all unnecessary suffering in three main areas: farming, transport and slaughter. Minimum animal welfare standards have been established to protect and to avoid competition distortions between producers in various member states. The most important standards are concerned with natural behaviour, space, feed and water supply, lighting, surgeries, veterinary aid and good stockmanship. European legislation forms the basis, partly complemented by national top-ups (Van Wagenberg et al., 2012). Directive 2007/43/EC establishes minimum rules for the protection of chickens for meat production. This directive aims to provide the chickens with a good level of welfare and health under good indoor climate conditions. An important part of this directive is setting a
LEI 2014-038 | 11
maximum stocking density of 33 kg/m2, or a maximum of 39 to 42 kg/m2 if stricter housing conditions and welfare standards are met and the mortality rate of at least seven consecutive flocks is under a certain target value. The new legislation establishes several other conditions, such as lighting, litter, feeding, and ventilation requirements, to ensure better animal welfare. The Directive also provides the Commission with the possibility to introduce further measures in the future, based on the scientific data and practical evidence collected by the Member States.
Economic impact of EU legislation 1.3
The poultry sector is governed by EU legislation and its implementation almost always leads to extra costs. The poultry meat sector has to cope with the additional costs related to environmental protection, food safety and animal welfare regulations. These additional costs were estimated for the following aspects: • Environmental protection Manure disposal costs, as result of the Nitrate directive. Reduction of ammonia emission in manure application, during manure storage and in the poultry
house. • Food safety Salmonella control. Costs of hygiene measures, sample collection, testing and vaccination. Meat-and-bone meal (MBM). The ban on meat-and-bone meal in the EU results in higher feed
costs. Antibiotic growth promoters. The ban on the use of antibiotic growth promoters results in higher
feed costs. Genetically Modified Organisms (GMO). The strict rules in the EU on the use of GMO crops result in
higher feed costs. • Animal Welfare Stocking density. Additional housing costs to regulate the maximum live weight per square meter
poultry house. The additional costs for poultry farms have also been estimated for all these measures. These estimates are based on research done in the Netherlands (Van Horne, 2013). For all measures the average situation for all EU countries is given. However, the actual situation can differ per country or per region. For example, manure disposal costs are high in regions with a large number of poultry farms and there are low or no costs in regions with few poultry farms. In some EU countries other regulations can be relevant, which are not mentioned in the list above, such as the energy tax in the Netherlands, resulting in higher cost for heating and electricity, and regulations on foot pad lesions (dermatitis) in Denmark and Sweden. Figure 1.1 gives all cost components of the EU legislation relating to poultry meat. The additional costs directly related to EU regulations are estimated to be 4.79 eurocents per kg live weight. This is 5.1% of the total production costs in 2011.
12 | LEI 2014-025
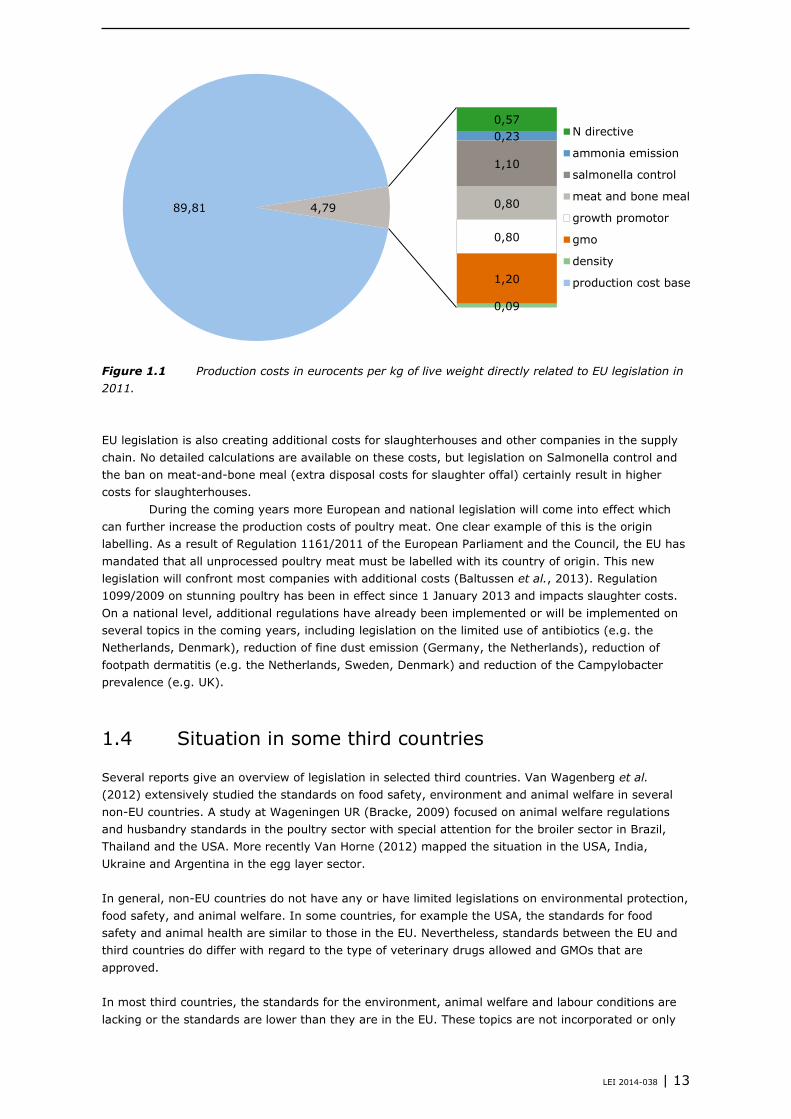
Figure 1.1 Production costs in eurocents per kg of live weight directly related to EU legislation in 2011. EU legislation is also creating additional costs for slaughterhouses and other companies in the supply chain. No detailed calculations are available on these costs, but legislation on Salmonella control and the ban on meat-and-bone meal (extra disposal costs for slaughter offal) certainly result in higher costs for slaughterhouses. During the coming years more European and national legislation will come into effect which can further increase the production costs of poultry meat. One clear example of this is the origin labelling. As a result of Regulation 1161/2011 of the European Parliament and the Council, the EU has mandated that all unprocessed poultry meat must be labelled with its country of origin. This new legislation will confront most companies with additional costs (Baltussen et al., 2013). Regulation 1099/2009 on stunning poultry has been in effect since 1 January 2013 and impacts slaughter costs. On a national level, additional regulations have already been implemented or will be implemented on several topics in the coming years, including legislation on the limited use of antibiotics (e.g. the Netherlands, Denmark), reduction of fine dust emission (Germany, the Netherlands), reduction of footpath dermatitis (e.g. the Netherlands, Sweden, Denmark) and reduction of the Campylobacter prevalence (e.g. UK).
Situation in some third countries 1.4
Several reports give an overview of legislation in selected third countries. Van Wagenberg et al. (2012) extensively studied the standards on food safety, environment and animal welfare in several non-EU countries. A study at Wageningen UR (Bracke, 2009) focused on animal welfare regulations and husbandry standards in the poultry sector with special attention for the broiler sector in Brazil, Thailand and the USA. More recently Van Horne (2012) mapped the situation in the USA, India, Ukraine and Argentina in the egg layer sector. In general, non-EU countries do not have any or have limited legislations on environmental protection, food safety, and animal welfare. In some countries, for example the USA, the standards for food safety and animal health are similar to those in the EU. Nevertheless, standards between the EU and third countries do differ with regard to the type of veterinary drugs allowed and GMOs that are approved. In most third countries, the standards for the environment, animal welfare and labour conditions are lacking or the standards are lower than they are in the EU. These topics are not incorporated or only
0,57 0,23
1,10
0,80
0,80
1,20
0,09
89,81 4,79
N directive
ammonia emission
salmonella control
meat and bone meal
growth promotor
gmo
density
production cost base
LEI 2014-038 | 13
marginally incorporated into trade agreements. Internationally accepted conventions or standards exist for food safety (Codex Alimentarius), animal health (OIE) and labour conditions (ILO), but do not exist for the environment and animal welfare. Food safety and animal health are important aspects in negotiating and establishing trade agreements, but the environment, animal welfare and labour conditions are not or not high on the agenda (Van Wagenberg et al., 2012). Important exporters of poultry meat on the world market are Brazil, USA, Thailand and Argentina. These countries have no food safety regulations that are similar to those in the EU, such as the ban on meat-and-bone meal and antibiotic growth promoters, and the strict rules on the use of GMO crops as ingredients in poultry feed. In the following sections we summarise the main characteristics of the poultry sector, the export position, the legislation on animal welfare and the production standards for these poultry meat producing countries. Brazil Brazil is one of the world's leading poultry producing countries and the number one exporter of poultry meat. The Brazilian poultry industry has been developed around the concept of strategic groups for commodities (chicken) and specialties (processed products), and it is characterised by high productivity and high technology use. The integration model is largely adopted, bringing strict control of the entire supply chain. The poultry industry is mainly concentrated in southern Brazil because of the area's subtropical climate where broilers are often kept in simple open houses. Three types of broiler housing can be distinguished in the area: low density housing (max 30 kg of live weight per m2), middle level density housing (max 34 kg per m2) and high density housing (modern systems with mechanical tunnel ventilation with up to 38 kg per m2). In Brazil, there is not much information available on animal welfare since this topic does not receive much attention in the country. In fact, Brazil has no legislation for poultry on animal welfare at farm level or during transport. A recent French report (ITAVI, 2012) gives an extensive overview of regulation on food safety, animal feed and environmental protection in Brazil. USA The USA has a large poultry sector and is the second largest exporter of poultry meat after Brazil. The USA does not regulate welfare standards for farmed animals. In fact, federal legislation in the USA focuses on transport (Farm Bill, 1996), slaughtering methods (update 1958) and 'laboratory animals' (1966), but even this legislation can differ from state to state. More specific the legislation can be different in some states. For poultry, the US regulations dictate that poultry must be slaughtered using good commercial practices. In the USA, the national chicken council (NCC) has established criteria for animal welfare of broilers. The NCC recommends the guidelines to its members to ensure the humane treatment of animals and to promote the production of quality products. The NCC practices promotes the good health and the welfare of broilers in several areas: education and training of farmers, proper nutrition and feeding, appropriate comfort and shelter, health care, ability to display most normal behaviours, best practices on the farm, catching and transport. Bird welfare at different stocking densities depends on access to feeders and drinkers, ventilation system, litter management and husbandry, but density is advised not to exceed maximum 31.7 kg (birds below 2 kg) or maximum 41.5 kg (birds above 2.5 kg). Thailand The Thai poultry industry is an important player within Asia and a leading exporter of poultry meat. Thailand can compete with breast meat on the EU market because dark leg-meat is preferred on the local Thai market. Since 1999, animal welfare in Thailand has been part of Thai government's agenda and farms need to meet government standards. These farm standards are based on the Good Agricultural Practice (GAP) and are aimed to improve the quality and safety of livestock products. To be certified as export farms, farmers need to meet government criteria addressing not only animal welfare but also environmental concerns (waste management), food safety (e.g. withdrawal time of some pharmaceuticals), disease monitoring, bio safety and traceability. In practice, the government notifications are mostly implemented on a voluntary basis by the sector. However, the regulations are compulsory if farms want to export. On these farms the density should not exceed 34 kg per m2 in closed poultry houses (Bracke, 2009).
14 | LEI 2014-025
Argentina Since 2002, Argentina has become an exporter of broiler meat and ranks seventh among world exporters. Breast meat is the exported product of the highest average value per tonne. Currently, broiler farming and slaughtering/processing in Argentina are almost completely vertically coordinated. Through contracts, the industry delivers, in most cases, day-old chicks, feed and professional advice to the producers, who contribute the poultry housing and labour. The integrators in Argentina promote modernisation by financing improvements on contracted farms, and demanding certain technological standards as a condition of entrance for new producers. Argentina has no specific legislation on animal welfare. However, it does have some legislation for related topics such as food safety and product quality, as well as manuals for the broiler sector on Good Practices for the Production that indirectly impose animal welfare criteria. Van Horne (2010), however, concluded that, according to the information collected through the survey and the interviews with producers and businessmen, producers in Argentina do not consciously implement animal welfare practices. In the same study, the average density in the surveyed broiler houses was low: 26 kg per m2, which is below the EU legal standards.
LEI 2014-038 | 15
2 Structure and employment
Introduction 2.1
This chapter describes the economic importance of the EU poultry meat industry. Paragraph 2.2 describes the total poultry meat production with data on the subsectors broilers, turkeys, ducks and other poultry. Paragraph 2.3 gives information on the structure of the sector with the number of farms and companies in the supply chain. Paragraph 2.4 deals with employment numbers while paragraph 2.5 gives the total economic value of the poultry meat. Finally, paragraph 2.6 describes the importance of alternative poultry meat in the EU.
Poultry meat production 2.2
In 2012, the total poultry meat production in the EU-27 was 12.9m tonnes. This is an increase of 14% compared to 2007. The main poultry meat is broiler meat with a total production of 9.9m tonnes in 2012. There are seven leading producers of broiler meat with each a production of more than 0.7m tonnes: the UK, Poland, Germany, France, Spain, Italy and the Netherlands. Combined, these countries are responsible for 76% of the EU's poultry meat production. Besides broilers, turkeys and ducks are also important subsectors. Total turkey meat production in the EU-27 in 2012 was 1.9m tonnes. The main producing countries of turkey meat are France, Germany, Poland, Italy and the UK, with a common share of 81% of the EU total. In 2012, the total duck meat production in the EU-27 was 0.5m tonnes. Of all EU countries, France is by far the largest producer of duck meat with almost half of the total EU production, followed by Hungary and Germany. These three countries have a common share of 74% of the EU total. Other poultry relates to guinea fowls and goose. Table 2.1 gives an overview of the total poultry meat production, subdivided by broilers, turkeys, ducks and other poultry, for all 27 EU member states.
16 | LEI 2014-025
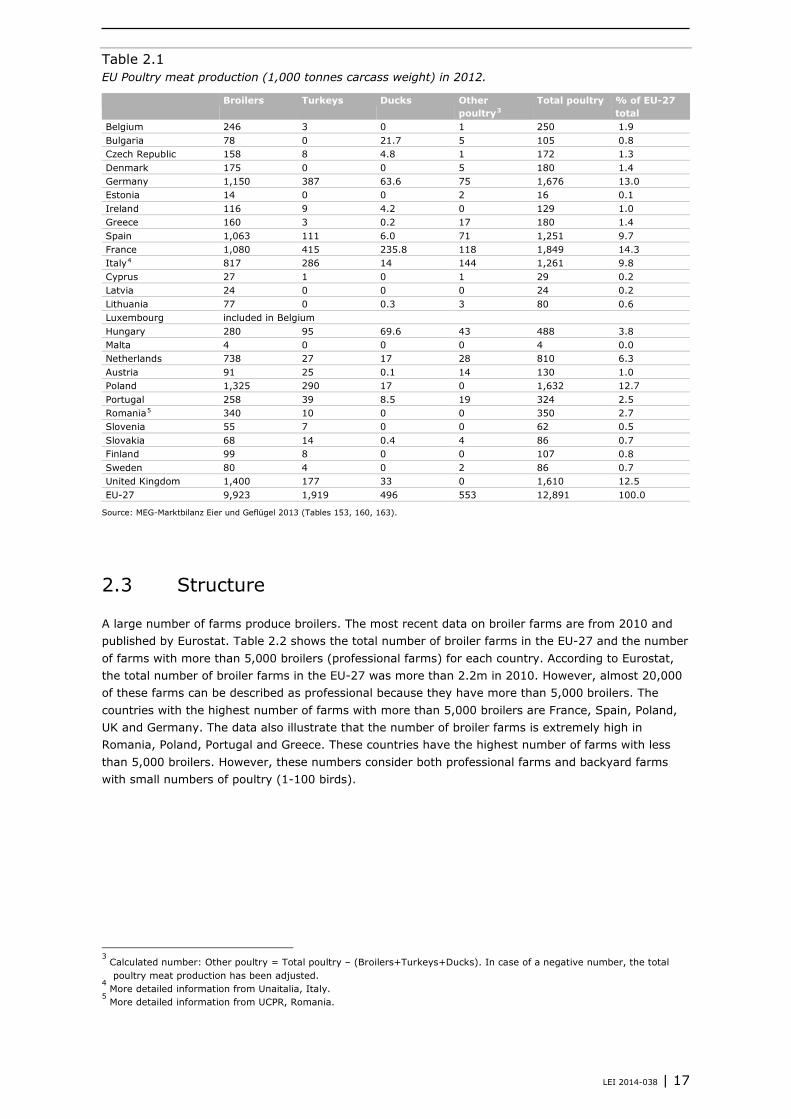
Table 2.1 EU Poultry meat production (1,000 tonnes carcass weight) in 2012.
Broilers Turkeys Ducks Other poultry3
Total poultry % of EU-27 total
Belgium 246 3 0 1 250 1.9 Bulgaria 78 0 21.7 5 105 0.8 Czech Republic 158 8 4.8 1 172 1.3 Denmark 175 0 0 5 180 1.4 Germany 1,150 387 63.6 75 1,676 13.0 Estonia 14 0 0 2 16 0.1 Ireland 116 9 4.2 0 129 1.0 Greece 160 3 0.2 17 180 1.4 Spain 1,063 111 6.0 71 1,251 9.7 France 1,080 415 235.8 118 1,849 14.3 Italy4 817 286 14 144 1,261 9.8 Cyprus 27 1 0 1 29 0.2 Latvia 24 0 0 0 24 0.2 Lithuania 77 0 0.3 3 80 0.6 Luxembourg included in Belgium Hungary 280 95 69.6 43 488 3.8 Malta 4 0 0 0 4 0.0 Netherlands 738 27 17 28 810 6.3 Austria 91 25 0.1 14 130 1.0 Poland 1,325 290 17 0 1,632 12.7 Portugal 258 39 8.5 19 324 2.5 Romania5 340 10 0 0 350 2.7 Slovenia 55 7 0 0 62 0.5 Slovakia 68 14 0.4 4 86 0.7 Finland 99 8 0 0 107 0.8 Sweden 80 4 0 2 86 0.7 United Kingdom 1,400 177 33 0 1,610 12.5 EU-27 9,923 1,919 496 553 12,891 100.0
Source: MEG-Marktbilanz Eier und Geflügel 2013 (Tables 153, 160, 163).
Structure 2.3
A large number of farms produce broilers. The most recent data on broiler farms are from 2010 and published by Eurostat. Table 2.2 shows the total number of broiler farms in the EU-27 and the number of farms with more than 5,000 broilers (professional farms) for each country. According to Eurostat, the total number of broiler farms in the EU-27 was more than 2.2m in 2010. However, almost 20,000 of these farms can be described as professional because they have more than 5,000 broilers. The countries with the highest number of farms with more than 5,000 broilers are France, Spain, Poland, UK and Germany. The data also illustrate that the number of broiler farms is extremely high in Romania, Poland, Portugal and Greece. These countries have the highest number of farms with less than 5,000 broilers. However, these numbers consider both professional farms and backyard farms with small numbers of poultry (1-100 birds).
3 Calculated number: Other poultry = Total poultry – (Broilers+Turkeys+Ducks). In case of a negative number, the total
poultry meat production has been adjusted. 4 More detailed information from Unaitalia, Italy.
5 More detailed information from UCPR, Romania.
LEI 2014-038 | 17
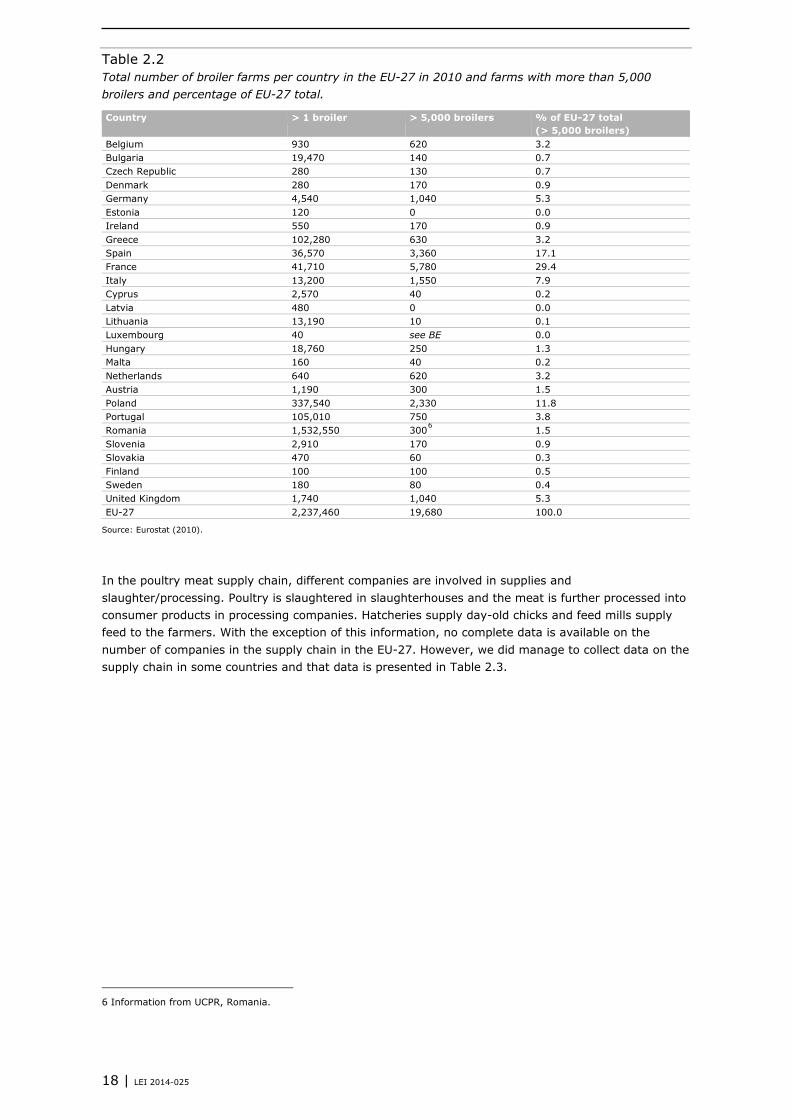
Table 2.2 Total number of broiler farms per country in the EU-27 in 2010 and farms with more than 5,000 broilers and percentage of EU-27 total.
Country > 1 broiler > 5,000 broilers % of EU-27 total (> 5,000 broilers)
Belgium 930 620 3.2 Bulgaria 19,470 140 0.7 Czech Republic 280 130 0.7 Denmark 280 170 0.9 Germany 4,540 1,040 5.3 Estonia 120 0 0.0 Ireland 550 170 0.9 Greece 102,280 630 3.2 Spain 36,570 3,360 17.1 France 41,710 5,780 29.4 Italy 13,200 1,550 7.9 Cyprus 2,570 40 0.2 Latvia 480 0 0.0 Lithuania 13,190 10 0.1 Luxembourg 40 see BE 0.0 Hungary 18,760 250 1.3 Malta 160 40 0.2 Netherlands 640 620 3.2 Austria 1,190 300 1.5 Poland 337,540 2,330 11.8 Portugal 105,010 750 3.8 Romania 1,532,550 3006 1.5 Slovenia 2,910 170 0.9 Slovakia 470 60 0.3 Finland 100 100 0.5 Sweden 180 80 0.4 United Kingdom 1,740 1,040 5.3 EU-27 2,237,460 19,680 100.0
Source: Eurostat (2010).
In the poultry meat supply chain, different companies are involved in supplies and slaughter/processing. Poultry is slaughtered in slaughterhouses and the meat is further processed into consumer products in processing companies. Hatcheries supply day-old chicks and feed mills supply feed to the farmers. With the exception of this information, no complete data is available on the number of companies in the supply chain in the EU-27. However, we did manage to collect data on the supply chain in some countries and that data is presented in Table 2.3.
6 Information from UCPR, Romania.
18 | LEI 2014-025
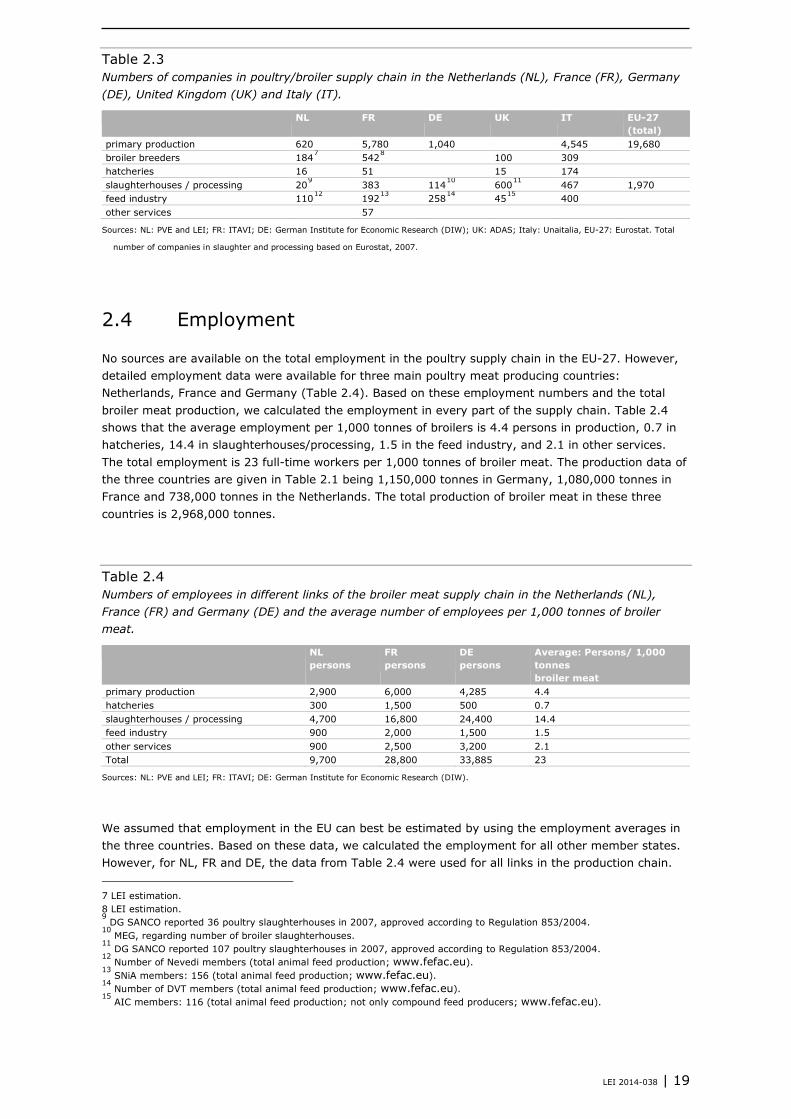
Table 2.3 Numbers of companies in poultry/broiler supply chain in the Netherlands (NL), France (FR), Germany (DE), United Kingdom (UK) and Italy (IT).
NL FR DE UK IT EU-27 (total)
primary production 620 5,780 1,040 4,545 19,680 broiler breeders 1847 5428 100 309 hatcheries 16 51 15 174 slaughterhouses / processing 209 383 11410 60011 467 1,970 feed industry 11012 19213 25814 4515 400 other services 57
Sources: NL: PVE and LEI; FR: ITAVI; DE: German Institute for Economic Research (DIW); UK: ADAS; Italy: Unaitalia, EU-27: Eurostat. Total
number of companies in slaughter and processing based on Eurostat, 2007.
Employment 2.4
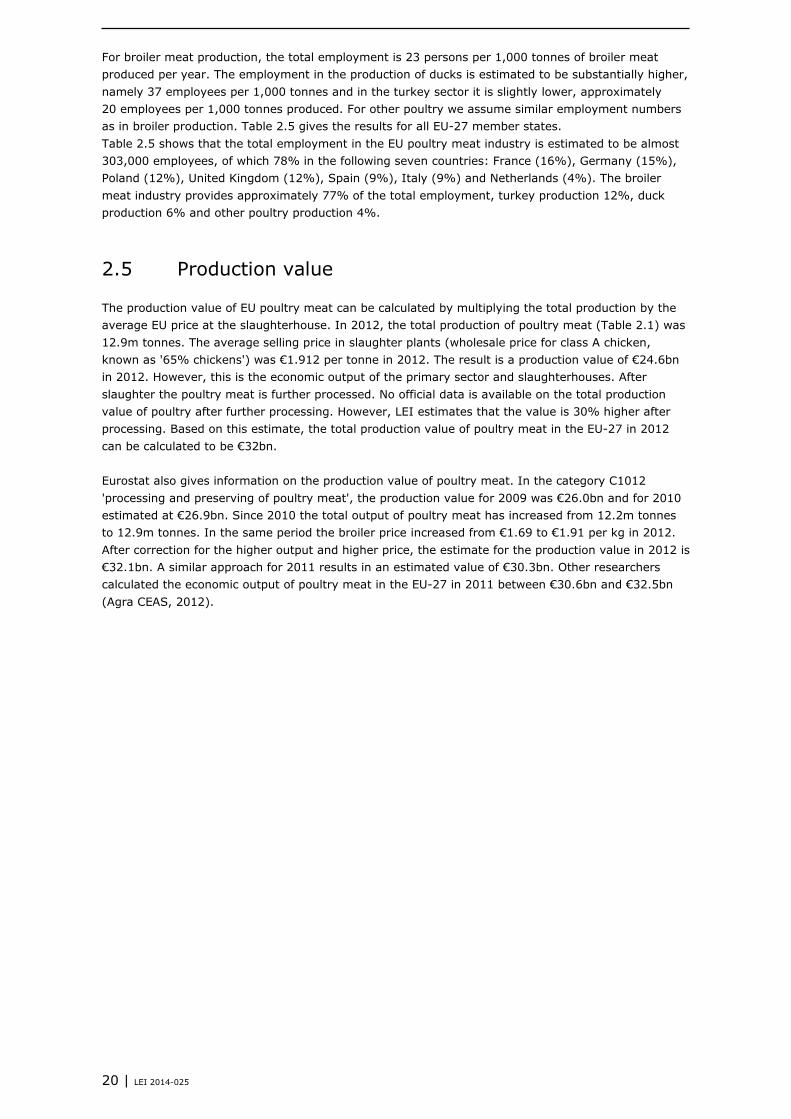
No sources are available on the total employment in the poultry supply chain in the EU-27. However, detailed employment data were available for three main poultry meat producing countries: Netherlands, France and Germany (Table 2.4). Based on these employment numbers and the total broiler meat production, we calculated the employment in every part of the supply chain. Table 2.4 shows that the average employment per 1,000 tonnes of broilers is 4.4 persons in production, 0.7 in hatcheries, 14.4 in slaughterhouses/processing, 1.5 in the feed industry, and 2.1 in other services. The total employment is 23 full-time workers per 1,000 tonnes of broiler meat. The production data of the three countries are given in Table 2.1 being 1,150,000 tonnes in Germany, 1,080,000 tonnes in France and 738,000 tonnes in the Netherlands. The total production of broiler meat in these three countries is 2,968,000 tonnes.
Table 2.4 Numbers of employees in different links of the broiler meat supply chain in the Netherlands (NL), France (FR) and Germany (DE) and the average number of employees per 1,000 tonnes of broiler meat.
NL persons
FR persons
DE persons
Average: Persons/ 1,000 tonnes broiler meat
primary production 2,900 6,000 4,285 4.4 hatcheries 300 1,500 500 0.7 slaughterhouses / processing 4,700 16,800 24,400 14.4 feed industry 900 2,000 1,500 1.5 other services 900 2,500 3,200 2.1 Total 9,700 28,800 33,885 23
Sources: NL: PVE and LEI; FR: ITAVI; DE: German Institute for Economic Research (DIW).
We assumed that employment in the EU can best be estimated by using the employment averages in the three countries. Based on these data, we calculated the employment for all other member states. However, for NL, FR and DE, the data from Table 2.4 were used for all links in the production chain.
7 LEI estimation. 8 LEI estimation. 9 DG SANCO reported 36 poultry slaughterhouses in 2007, approved according to Regulation 853/2004.
10 MEG, regarding number of broiler slaughterhouses.
11 DG SANCO reported 107 poultry slaughterhouses in 2007, approved according to Regulation 853/2004.
12 Number of Nevedi members (total animal feed production; www.fefac.eu).
13 SNiA members: 156 (total animal feed production; www.fefac.eu).
14 Number of DVT members (total animal feed production; www.fefac.eu).
15 AIC members: 116 (total animal feed production; not only compound feed producers; www.fefac.eu).
LEI 2014-038 | 19
For broiler meat production, the total employment is 23 persons per 1,000 tonnes of broiler meat produced per year. The employment in the production of ducks is estimated to be substantially higher, namely 37 employees per 1,000 tonnes and in the turkey sector it is slightly lower, approximately 20 employees per 1,000 tonnes produced. For other poultry we assume similar employment numbers as in broiler production. Table 2.5 gives the results for all EU-27 member states. Table 2.5 shows that the total employment in the EU poultry meat industry is estimated to be almost 303,000 employees, of which 78% in the following seven countries: France (16%), Germany (15%), Poland (12%), United Kingdom (12%), Spain (9%), Italy (9%) and Netherlands (4%). The broiler meat industry provides approximately 77% of the total employment, turkey production 12%, duck production 6% and other poultry production 4%.
Production value 2.5
The production value of EU poultry meat can be calculated by multiplying the total production by the average EU price at the slaughterhouse. In 2012, the total production of poultry meat (Table 2.1) was 12.9m tonnes. The average selling price in slaughter plants (wholesale price for class A chicken, known as '65% chickens') was €1.912 per tonne in 2012. The result is a production value of €24.6bn in 2012. However, this is the economic output of the primary sector and slaughterhouses. After slaughter the poultry meat is further processed. No official data is available on the total production value of poultry after further processing. However, LEI estimates that the value is 30% higher after processing. Based on this estimate, the total production value of poultry meat in the EU-27 in 2012 can be calculated to be €32bn. Eurostat also gives information on the production value of poultry meat. In the category C1012 'processing and preserving of poultry meat', the production value for 2009 was €26.0bn and for 2010 estimated at €26.9bn. Since 2010 the total output of poultry meat has increased from 12.2m tonnes to 12.9m tonnes. In the same period the broiler price increased from €1.69 to €1.91 per kg in 2012. After correction for the higher output and higher price, the estimate for the production value in 2012 is €32.1bn. A similar approach for 2011 results in an estimated value of €30.3bn. Other researchers calculated the economic output of poultry meat in the EU-27 in 2011 between €30.6bn and €32.5bn (Agra CEAS, 2012).
20 | LEI 2014-025
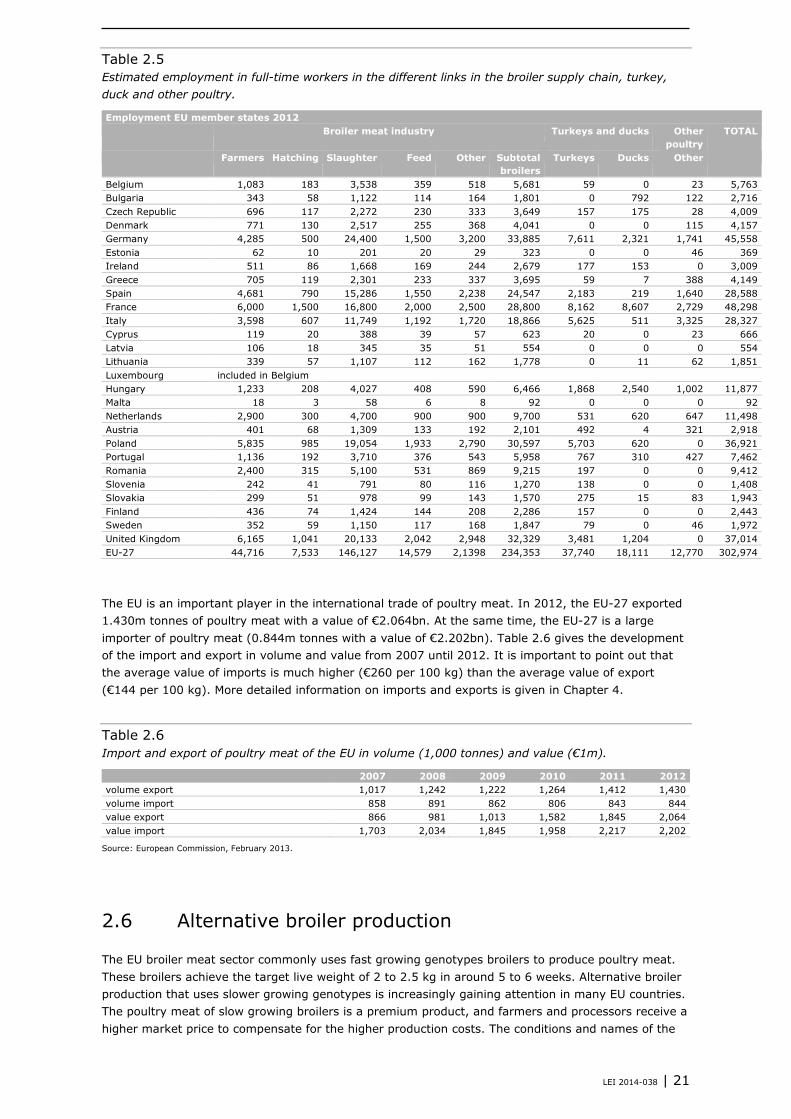
Table 2.5 Estimated employment in full-time workers in the different links in the broiler supply chain, turkey, duck and other poultry.
Employment EU member states 2012 Broiler meat industry Turkeys and ducks Other
poultry TOTAL
Farmers Hatching Slaughter Feed Other Subtotal broilers
Turkeys Ducks Other
Belgium 1,083 183 3,538 359 518 5,681 59 0 23 5,763 Bulgaria 343 58 1,122 114 164 1,801 0 792 122 2,716 Czech Republic 696 117 2,272 230 333 3,649 157 175 28 4,009 Denmark 771 130 2,517 255 368 4,041 0 0 115 4,157 Germany 4,285 500 24,400 1,500 3,200 33,885 7,611 2,321 1,741 45,558 Estonia 62 10 201 20 29 323 0 0 46 369 Ireland 511 86 1,668 169 244 2,679 177 153 0 3,009 Greece 705 119 2,301 233 337 3,695 59 7 388 4,149 Spain 4,681 790 15,286 1,550 2,238 24,547 2,183 219 1,640 28,588 France 6,000 1,500 16,800 2,000 2,500 28,800 8,162 8,607 2,729 48,298 Italy 3,598 607 11,749 1,192 1,720 18,866 5,625 511 3,325 28,327 Cyprus 119 20 388 39 57 623 20 0 23 666 Latvia 106 18 345 35 51 554 0 0 0 554 Lithuania 339 57 1,107 112 162 1,778 0 11 62 1,851 Luxembourg included in Belgium Hungary 1,233 208 4,027 408 590 6,466 1,868 2,540 1,002 11,877 Malta 18 3 58 6 8 92 0 0 0 92 Netherlands 2,900 300 4,700 900 900 9,700 531 620 647 11,498 Austria 401 68 1,309 133 192 2,101 492 4 321 2,918 Poland 5,835 985 19,054 1,933 2,790 30,597 5,703 620 0 36,921 Portugal 1,136 192 3,710 376 543 5,958 767 310 427 7,462 Romania 2,400 315 5,100 531 869 9,215 197 0 0 9,412 Slovenia 242 41 791 80 116 1,270 138 0 0 1,408 Slovakia 299 51 978 99 143 1,570 275 15 83 1,943 Finland 436 74 1,424 144 208 2,286 157 0 0 2,443 Sweden 352 59 1,150 117 168 1,847 79 0 46 1,972 United Kingdom 6,165 1,041 20,133 2,042 2,948 32,329 3,481 1,204 0 37,014 EU-27 44,716 7,533 146,127 14,579 2,1398 234,353 37,740 18,111 12,770 302,974
The EU is an important player in the international trade of poultry meat. In 2012, the EU-27 exported 1.430m tonnes of poultry meat with a value of €2.064bn. At the same time, the EU-27 is a large importer of poultry meat (0.844m tonnes with a value of €2.202bn). Table 2.6 gives the development of the import and export in volume and value from 2007 until 2012. It is important to point out that the average value of imports is much higher (€260 per 100 kg) than the average value of export (€144 per 100 kg). More detailed information on imports and exports is given in Chapter 4.
Table 2.6 Import and export of poultry meat of the EU in volume (1,000 tonnes) and value (€1m).
2007 2008 2009 2010 2011 2012 volume export 1,017 1,242 1,222 1,264 1,412 1,430 volume import 858 891 862 806 843 844 value export 866 981 1,013 1,582 1,845 2,064 value import 1,703 2,034 1,845 1,958 2,217 2,202
Source: European Commission, February 2013.
Alternative broiler production 2.6
The EU broiler meat sector commonly uses fast growing genotypes broilers to produce poultry meat. These broilers achieve the target live weight of 2 to 2.5 kg in around 5 to 6 weeks. Alternative broiler production that uses slower growing genotypes is increasingly gaining attention in many EU countries. The poultry meat of slow growing broilers is a premium product, and farmers and processors receive a higher market price to compensate for the higher production costs. The conditions and names of the
LEI 2014-038 | 21
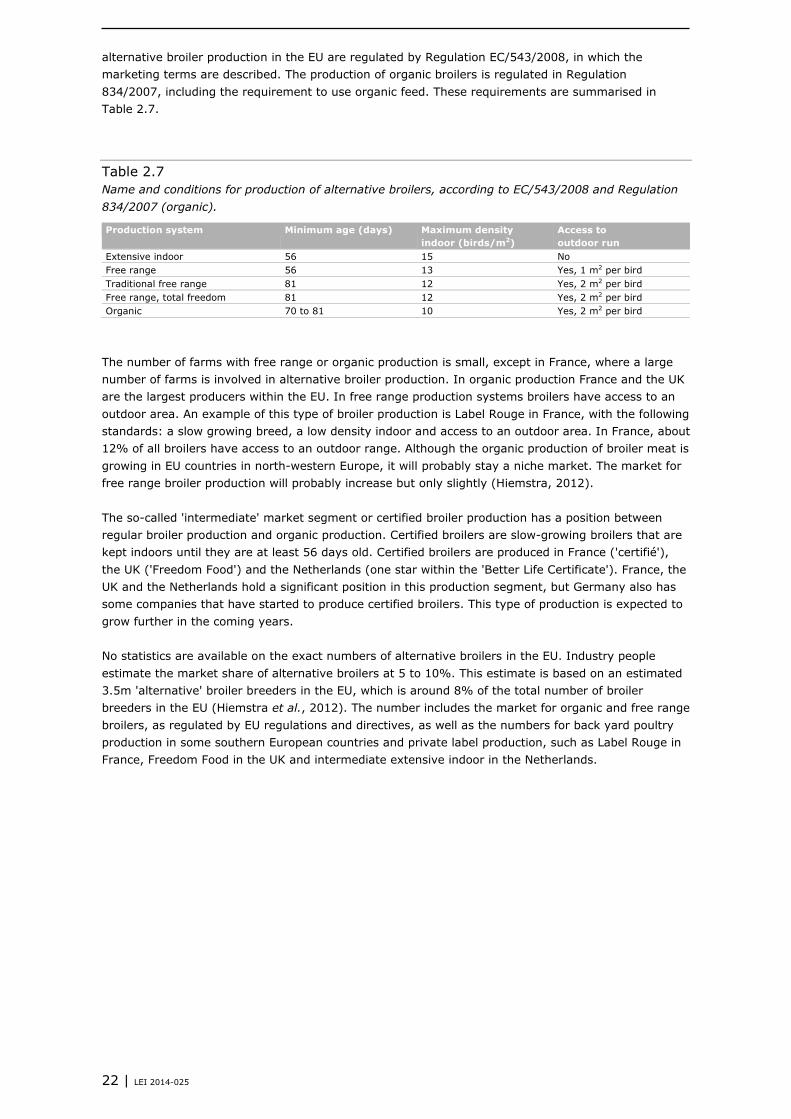
alternative broiler production in the EU are regulated by Regulation EC/543/2008, in which the marketing terms are described. The production of organic broilers is regulated in Regulation 834/2007, including the requirement to use organic feed. These requirements are summarised in Table 2.7.
Table 2.7 Name and conditions for production of alternative broilers, according to EC/543/2008 and Regulation 834/2007 (organic).
Production system Minimum age (days) Maximum density indoor (birds/m2)
Access to outdoor run
Extensive indoor 56 15 No Free range 56 13 Yes, 1 m2 per bird Traditional free range 81 12 Yes, 2 m2 per bird Free range, total freedom 81 12 Yes, 2 m2 per bird Organic 70 to 81 10 Yes, 2 m2 per bird
The number of farms with free range or organic production is small, except in France, where a large number of farms is involved in alternative broiler production. In organic production France and the UK are the largest producers within the EU. In free range production systems broilers have access to an outdoor area. An example of this type of broiler production is Label Rouge in France, with the following standards: a slow growing breed, a low density indoor and access to an outdoor area. In France, about 12% of all broilers have access to an outdoor range. Although the organic production of broiler meat is growing in EU countries in north-western Europe, it will probably stay a niche market. The market for free range broiler production will probably increase but only slightly (Hiemstra, 2012). The so-called 'intermediate' market segment or certified broiler production has a position between regular broiler production and organic production. Certified broilers are slow-growing broilers that are kept indoors until they are at least 56 days old. Certified broilers are produced in France ('certifié'), the UK ('Freedom Food') and the Netherlands (one star within the 'Better Life Certificate'). France, the UK and the Netherlands hold a significant position in this production segment, but Germany also has some companies that have started to produce certified broilers. This type of production is expected to grow further in the coming years. No statistics are available on the exact numbers of alternative broilers in the EU. Industry people estimate the market share of alternative broilers at 5 to 10%. This estimate is based on an estimated 3.5m 'alternative' broiler breeders in the EU, which is around 8% of the total number of broiler breeders in the EU (Hiemstra et al., 2012). The number includes the market for organic and free range broilers, as regulated by EU regulations and directives, as well as the numbers for back yard poultry production in some southern European countries and private label production, such as Label Rouge in France, Freedom Food in the UK and intermediate extensive indoor in the Netherlands.
22 | LEI 2014-025
3 Production costs of broilers 2013 in selected countries
Production costs in some EU countries 3.1
The production costs of broilers have been researched for the following nine EU countries: the Netherlands (NL), Germany (DE), France (FR), United Kingdom (UK), Italy (IT), Spain (ES), Denmark (DK), Poland (PL) and Hungary (HU). The calculated production costs at farm level are based on the situation in 2013. Of almost all countries average zootechnical (performance) data and economic data (prices) were available. To give some examples: in the Netherlands LEI Wageningen UR is collecting data of broiler farms, in Germany similar data are available from the Chamber of Commerce (Landwirtschaftskammer Niedersachsen) and in Denmark data are collected and published by the Danish Poultry Council (Det Danske Fjerkraeraad). For France, the UK and Hungary the data are based on information of respectively the research institute ITAVI, advisory group ADAS and the University of Debrecen. For Poland, Italy and Spain a mix of sources was used to compile the basic assumptions. After calculating the production costs at farm level, we also calculated the costs for slaughter. Section 3.1.2 gives an overview of the production cost after slaughter.
3.1.1 Production costs at primary farm
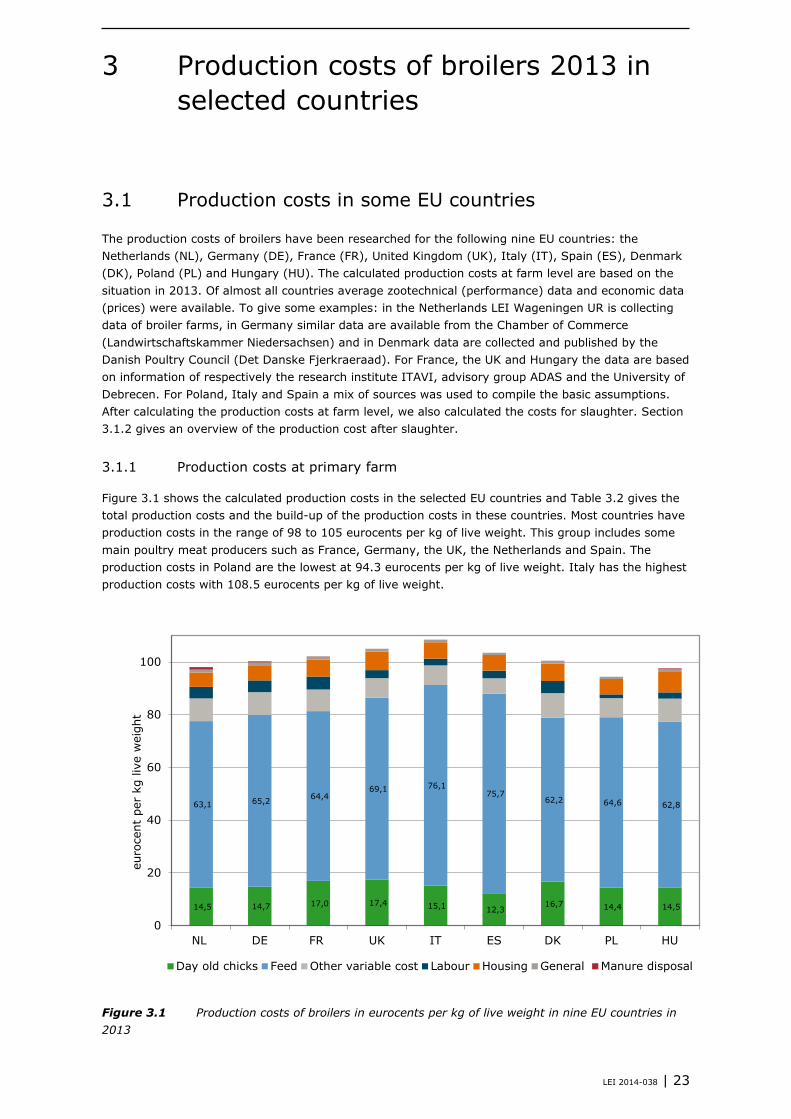
Figure 3.1 shows the calculated production costs in the selected EU countries and Table 3.2 gives the total production costs and the build-up of the production costs in these countries. Most countries have production costs in the range of 98 to 105 eurocents per kg of live weight. This group includes some main poultry meat producers such as France, Germany, the UK, the Netherlands and Spain. The production costs in Poland are the lowest at 94.3 eurocents per kg of live weight. Italy has the highest production costs with 108.5 eurocents per kg of live weight.
Figure 3.1 Production costs of broilers in eurocents per kg of live weight in nine EU countries in 2013
14,5 14,7 17,0 17,4 15,1 12,3 16,7 14,4 14,5
63,1 65,2 64,4 69,1 76,1
75,7 62,2 64,6 62,8
0
20
40
60
80
100
NL DE FR UK IT ES DK PL HU
euro
cent
per
kg
live
wei
ght
Day old chicks Feed Other variable cost Labour Housing General Manure disposal
LEI 2014-038 | 23
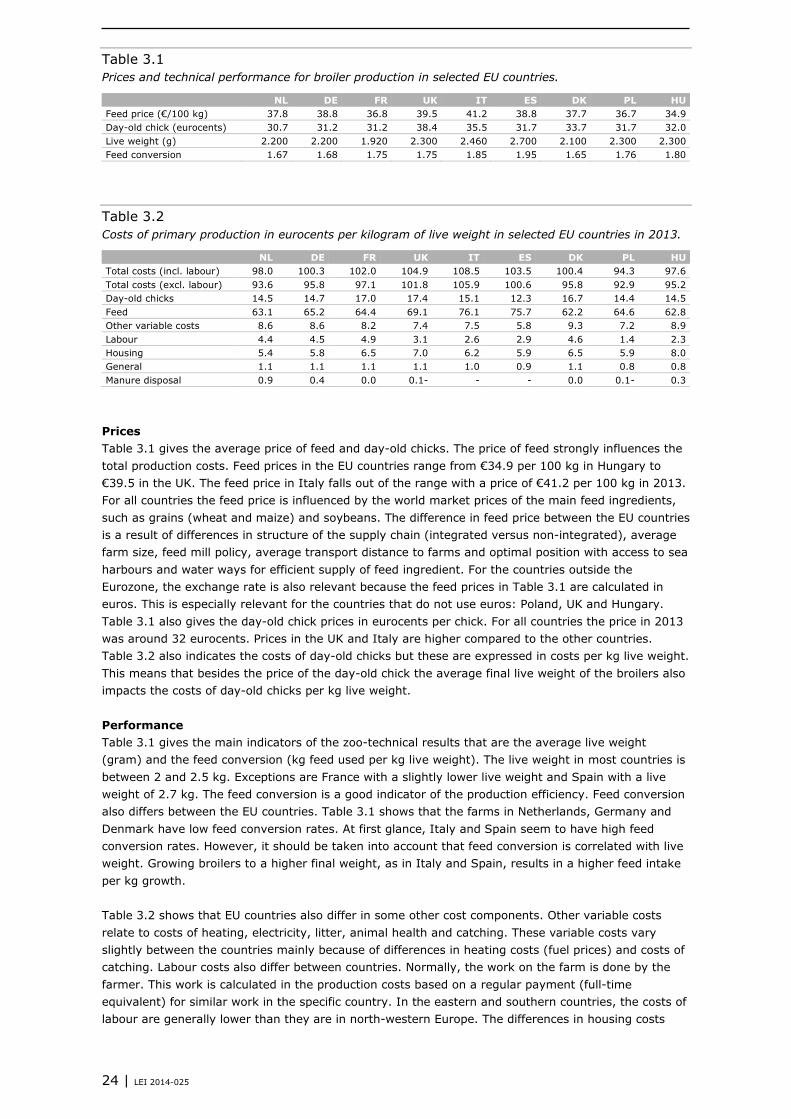
Table 3.1 Prices and technical performance for broiler production in selected EU countries.
NL DE FR UK IT ES DK PL HU Feed price (€/100 kg) 37.8 38.8 36.8 39.5 41.2 38.8 37.7 36.7 34.9 Day-old chick (eurocents) 30.7 31.2 31.2 38.4 35.5 31.7 33.7 31.7 32.0 Live weight (g) 2.200 2.200 1.920 2.300 2.460 2.700 2.100 2.300 2.300 Feed conversion 1.67 1.68 1.75 1.75 1.85 1.95 1.65 1.76 1.80
Table 3.2 Costs of primary production in eurocents per kilogram of live weight in selected EU countries in 2013.
NL DE FR UK IT ES DK PL HU Total costs (incl. labour) 98.0 100.3 102.0 104.9 108.5 103.5 100.4 94.3 97.6 Total costs (excl. labour) 93.6 95.8 97.1 101.8 105.9 100.6 95.8 92.9 95.2 Day-old chicks 14.5 14.7 17.0 17.4 15.1 12.3 16.7 14.4 14.5 Feed 63.1 65.2 64.4 69.1 76.1 75.7 62.2 64.6 62.8 Other variable costs 8.6 8.6 8.2 7.4 7.5 5.8 9.3 7.2 8.9 Labour 4.4 4.5 4.9 3.1 2.6 2.9 4.6 1.4 2.3 Housing 5.4 5.8 6.5 7.0 6.2 5.9 6.5 5.9 8.0 General 1.1 1.1 1.1 1.1 1.0 0.9 1.1 0.8 0.8 Manure disposal 0.9 0.4 0.0 0.1- - - 0.0 0.1- 0.3
Prices Table 3.1 gives the average price of feed and day-old chicks. The price of feed strongly influences the total production costs. Feed prices in the EU countries range from €34.9 per 100 kg in Hungary to €39.5 in the UK. The feed price in Italy falls out of the range with a price of €41.2 per 100 kg in 2013. For all countries the feed price is influenced by the world market prices of the main feed ingredients, such as grains (wheat and maize) and soybeans. The difference in feed price between the EU countries is a result of differences in structure of the supply chain (integrated versus non-integrated), average farm size, feed mill policy, average transport distance to farms and optimal position with access to sea harbours and water ways for efficient supply of feed ingredient. For the countries outside the Eurozone, the exchange rate is also relevant because the feed prices in Table 3.1 are calculated in euros. This is especially relevant for the countries that do not use euros: Poland, UK and Hungary. Table 3.1 also gives the day-old chick prices in eurocents per chick. For all countries the price in 2013 was around 32 eurocents. Prices in the UK and Italy are higher compared to the other countries. Table 3.2 also indicates the costs of day-old chicks but these are expressed in costs per kg live weight. This means that besides the price of the day-old chick the average final live weight of the broilers also impacts the costs of day-old chicks per kg live weight. Performance Table 3.1 gives the main indicators of the zoo-technical results that are the average live weight (gram) and the feed conversion (kg feed used per kg live weight). The live weight in most countries is between 2 and 2.5 kg. Exceptions are France with a slightly lower live weight and Spain with a live weight of 2.7 kg. The feed conversion is a good indicator of the production efficiency. Feed conversion also differs between the EU countries. Table 3.1 shows that the farms in Netherlands, Germany and Denmark have low feed conversion rates. At first glance, Italy and Spain seem to have high feed conversion rates. However, it should be taken into account that feed conversion is correlated with live weight. Growing broilers to a higher final weight, as in Italy and Spain, results in a higher feed intake per kg growth. Table 3.2 shows that EU countries also differ in some other cost components. Other variable costs relate to costs of heating, electricity, litter, animal health and catching. These variable costs vary slightly between the countries mainly because of differences in heating costs (fuel prices) and costs of catching. Labour costs also differ between countries. Normally, the work on the farm is done by the farmer. This work is calculated in the production costs based on a regular payment (full-time equivalent) for similar work in the specific country. In the eastern and southern countries, the costs of labour are generally lower than they are in north-western Europe. The differences in housing costs
24 | LEI 2014-025
(poultry house and inventory) between the countries relate to differences in investments for a poultry house, stocking density and interest rate. General costs relate to the costs at farm level for insurance, bookkeeping, consultancy, telephone, and transport. In some countries broiler farmers have manure disposal costs. In the Netherlands, Germany and Hungary farmers have to pay for a sustainable disposal of manure. In other countries, farmers do not have to pay for manure disposal, while in the UK and Poland farmers even get a small revenue.
3.1.2 Production costs after slaughter
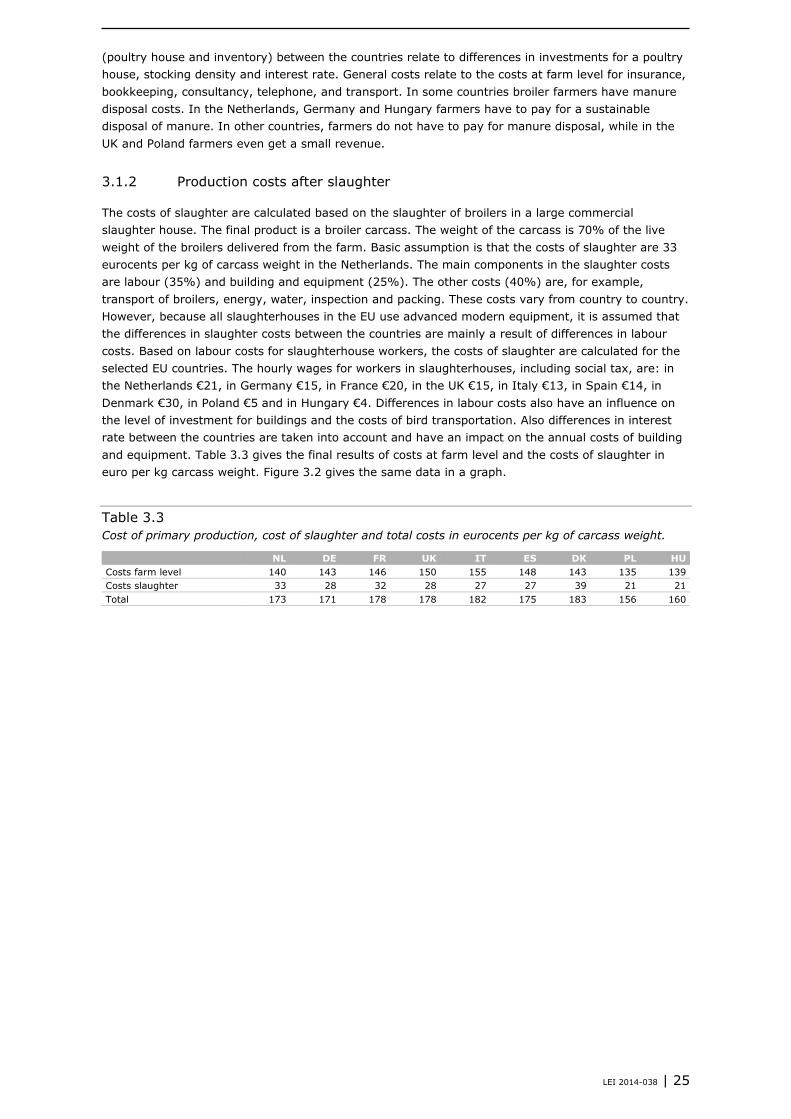
The costs of slaughter are calculated based on the slaughter of broilers in a large commercial slaughter house. The final product is a broiler carcass. The weight of the carcass is 70% of the live weight of the broilers delivered from the farm. Basic assumption is that the costs of slaughter are 33 eurocents per kg of carcass weight in the Netherlands. The main components in the slaughter costs are labour (35%) and building and equipment (25%). The other costs (40%) are, for example, transport of broilers, energy, water, inspection and packing. These costs vary from country to country. However, because all slaughterhouses in the EU use advanced modern equipment, it is assumed that the differences in slaughter costs between the countries are mainly a result of differences in labour costs. Based on labour costs for slaughterhouse workers, the costs of slaughter are calculated for the selected EU countries. The hourly wages for workers in slaughterhouses, including social tax, are: in the Netherlands €21, in Germany €15, in France €20, in the UK €15, in Italy €13, in Spain €14, in Denmark €30, in Poland €5 and in Hungary €4. Differences in labour costs also have an influence on the level of investment for buildings and the costs of bird transportation. Also differences in interest rate between the countries are taken into account and have an impact on the annual costs of building and equipment. Table 3.3 gives the final results of costs at farm level and the costs of slaughter in euro per kg carcass weight. Figure 3.2 gives the same data in a graph.
Table 3.3 Cost of primary production, cost of slaughter and total costs in eurocents per kg of carcass weight.
NL DE FR UK IT ES DK PL HU Costs farm level 140 143 146 150 155 148 143 135 139 Costs slaughter 33 28 32 28 27 27 39 21 21 Total 173 171 178 178 182 175 183 156 160
LEI 2014-038 | 25
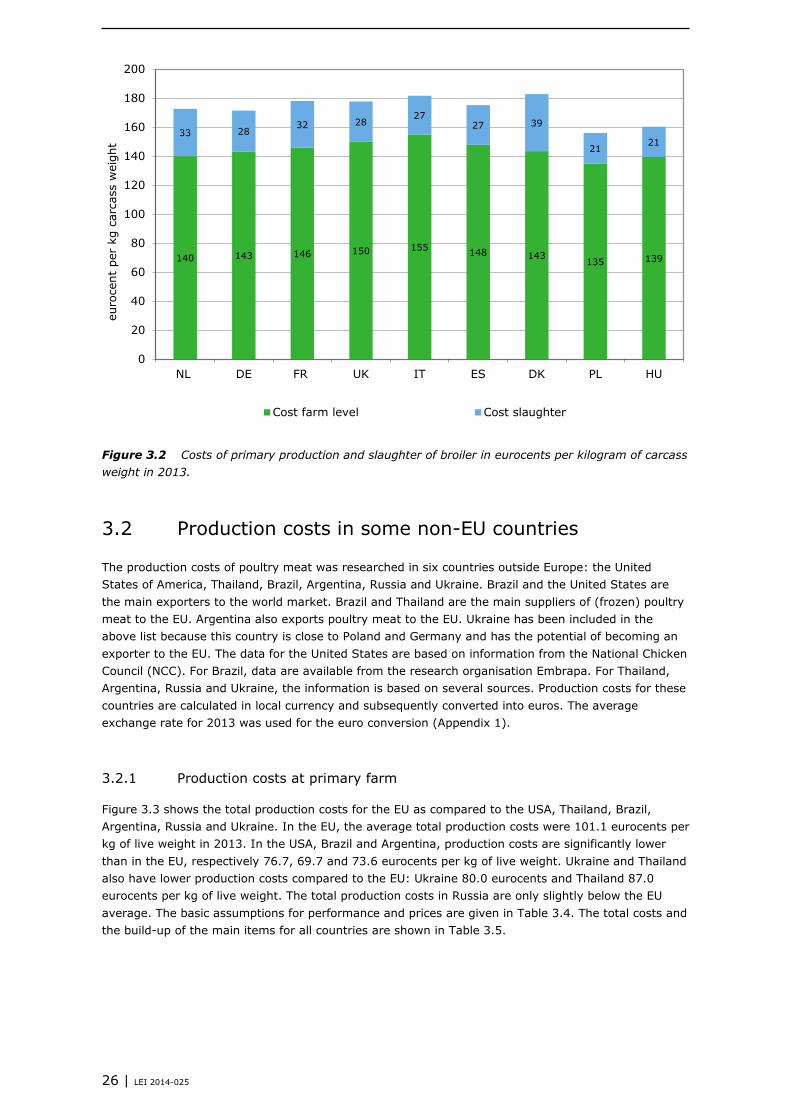
Figure 3.2 Costs of primary production and slaughter of broiler in eurocents per kilogram of carcass weight in 2013.
Production costs in some non-EU countries 3.2
The production costs of poultry meat was researched in six countries outside Europe: the United States of America, Thailand, Brazil, Argentina, Russia and Ukraine. Brazil and the United States are the main exporters to the world market. Brazil and Thailand are the main suppliers of (frozen) poultry meat to the EU. Argentina also exports poultry meat to the EU. Ukraine has been included in the above list because this country is close to Poland and Germany and has the potential of becoming an exporter to the EU. The data for the United States are based on information from the National Chicken Council (NCC). For Brazil, data are available from the research organisation Embrapa. For Thailand, Argentina, Russia and Ukraine, the information is based on several sources. Production costs for these countries are calculated in local currency and subsequently converted into euros. The average exchange rate for 2013 was used for the euro conversion (Appendix 1).
3.2.1 Production costs at primary farm
Figure 3.3 shows the total production costs for the EU as compared to the USA, Thailand, Brazil, Argentina, Russia and Ukraine. In the EU, the average total production costs were 101.1 eurocents per kg of live weight in 2013. In the USA, Brazil and Argentina, production costs are significantly lower than in the EU, respectively 76.7, 69.7 and 73.6 eurocents per kg of live weight. Ukraine and Thailand also have lower production costs compared to the EU: Ukraine 80.0 eurocents and Thailand 87.0 eurocents per kg of live weight. The total production costs in Russia are only slightly below the EU average. The basic assumptions for performance and prices are given in Table 3.4. The total costs and the build-up of the main items for all countries are shown in Table 3.5.
140 143 146 150 155 148 143 135 139
33 28 32 28
27 27 39
21 21
0
20
40
60
80
100
120
140
160
180
200
NL DE FR UK IT ES DK PL HU
euro
cent
per
kg
carc
ass
wei
ght
Cost farm level Cost slaughter
26 | LEI 2014-025
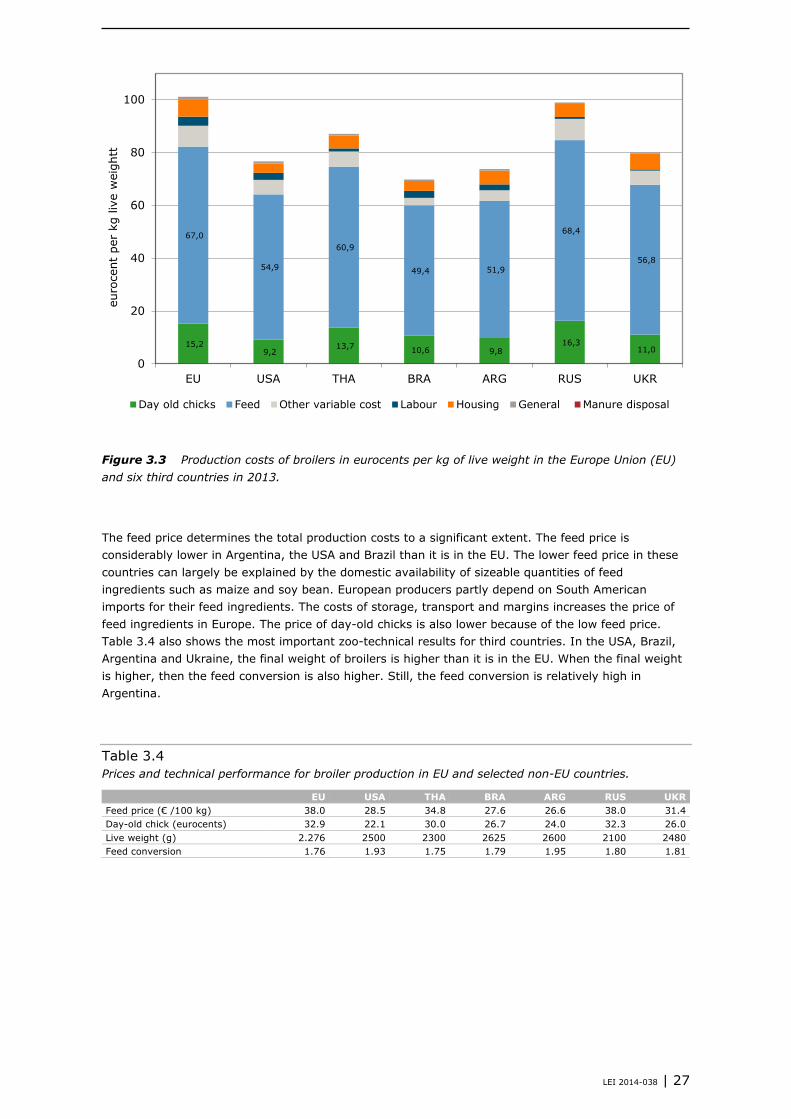
Figure 3.3 Production costs of broilers in eurocents per kg of live weight in the Europe Union (EU) and six third countries in 2013.
The feed price determines the total production costs to a significant extent. The feed price is considerably lower in Argentina, the USA and Brazil than it is in the EU. The lower feed price in these countries can largely be explained by the domestic availability of sizeable quantities of feed ingredients such as maize and soy bean. European producers partly depend on South American imports for their feed ingredients. The costs of storage, transport and margins increases the price of feed ingredients in Europe. The price of day-old chicks is also lower because of the low feed price. Table 3.4 also shows the most important zoo-technical results for third countries. In the USA, Brazil, Argentina and Ukraine, the final weight of broilers is higher than it is in the EU. When the final weight is higher, then the feed conversion is also higher. Still, the feed conversion is relatively high in Argentina.
Table 3.4 Prices and technical performance for broiler production in EU and selected non-EU countries.
EU USA THA BRA ARG RUS UKR Feed price (€ /100 kg) 38.0 28.5 34.8 27.6 26.6 38.0 31.4 Day-old chick (eurocents) 32.9 22.1 30.0 26.7 24.0 32.3 26.0 Live weight (g) 2.276 2500 2300 2625 2600 2100 2480 Feed conversion 1.76 1.93 1.75 1.79 1.95 1.80 1.81
15,2 9,2
13,7 10,6 9,8 16,3
11,0
67,0
54,9
60,9
49,4 51,9
68,4
56,8
0
20
40
60
80
100
EU USA THA BRA ARG RUS UKR
euro
cent
per
kg
live
wei
ghtt
Day old chicks Feed Other variable cost Labour Housing General Manure disposal
LEI 2014-038 | 27
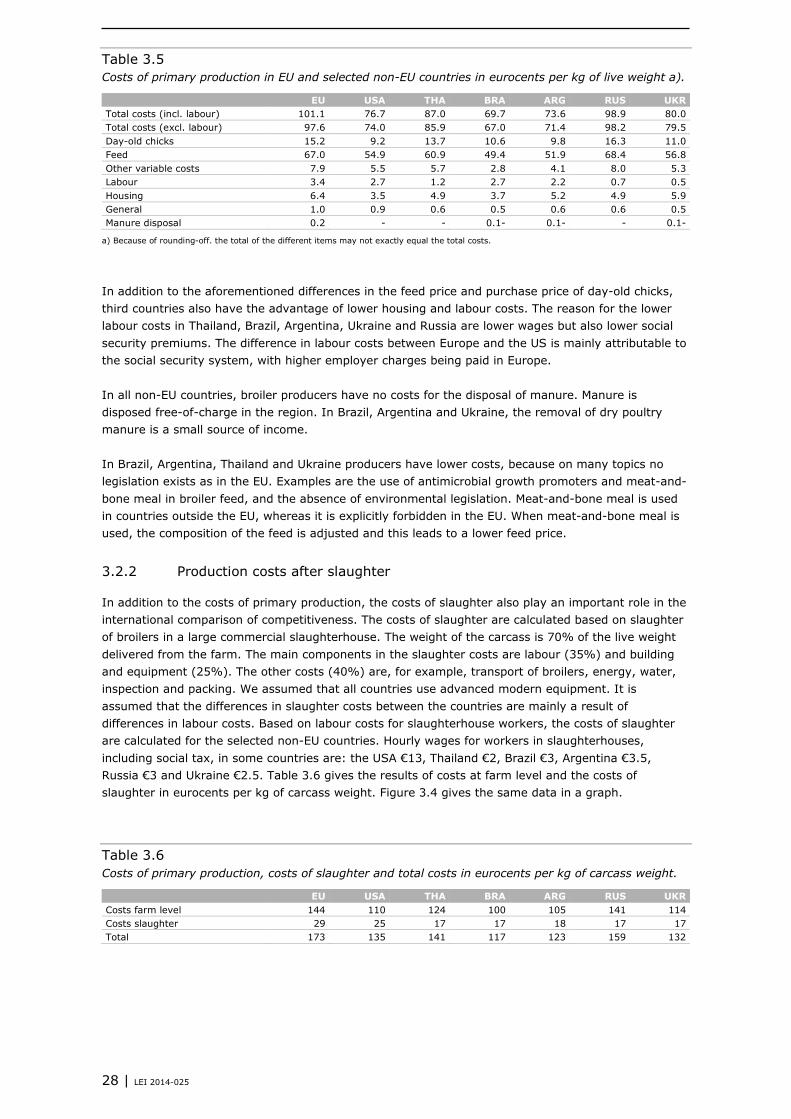
Table 3.5 Costs of primary production in EU and selected non-EU countries in eurocents per kg of live weight a).
EU USA THA BRA ARG RUS UKR Total costs (incl. labour) 101.1 76.7 87.0 69.7 73.6 98.9 80.0 Total costs (excl. labour) 97.6 74.0 85.9 67.0 71.4 98.2 79.5 Day-old chicks 15.2 9.2 13.7 10.6 9.8 16.3 11.0 Feed 67.0 54.9 60.9 49.4 51.9 68.4 56.8 Other variable costs 7.9 5.5 5.7 2.8 4.1 8.0 5.3 Labour 3.4 2.7 1.2 2.7 2.2 0.7 0.5 Housing 6.4 3.5 4.9 3.7 5.2 4.9 5.9 General 1.0 0.9 0.6 0.5 0.6 0.6 0.5 Manure disposal 0.2 - - 0.1- 0.1- - 0.1-
a) Because of rounding-off. the total of the different items may not exactly equal the total costs.
In addition to the aforementioned differences in the feed price and purchase price of day-old chicks, third countries also have the advantage of lower housing and labour costs. The reason for the lower labour costs in Thailand, Brazil, Argentina, Ukraine and Russia are lower wages but also lower social security premiums. The difference in labour costs between Europe and the US is mainly attributable to the social security system, with higher employer charges being paid in Europe. In all non-EU countries, broiler producers have no costs for the disposal of manure. Manure is disposed free-of-charge in the region. In Brazil, Argentina and Ukraine, the removal of dry poultry manure is a small source of income. In Brazil, Argentina, Thailand and Ukraine producers have lower costs, because on many topics no legislation exists as in the EU. Examples are the use of antimicrobial growth promoters and meat-and-bone meal in broiler feed, and the absence of environmental legislation. Meat-and-bone meal is used in countries outside the EU, whereas it is explicitly forbidden in the EU. When meat-and-bone meal is used, the composition of the feed is adjusted and this leads to a lower feed price.
3.2.2 Production costs after slaughter
In addition to the costs of primary production, the costs of slaughter also play an important role in the international comparison of competitiveness. The costs of slaughter are calculated based on slaughter of broilers in a large commercial slaughterhouse. The weight of the carcass is 70% of the live weight delivered from the farm. The main components in the slaughter costs are labour (35%) and building and equipment (25%). The other costs (40%) are, for example, transport of broilers, energy, water, inspection and packing. We assumed that all countries use advanced modern equipment. It is assumed that the differences in slaughter costs between the countries are mainly a result of differences in labour costs. Based on labour costs for slaughterhouse workers, the costs of slaughter are calculated for the selected non-EU countries. Hourly wages for workers in slaughterhouses, including social tax, in some countries are: the USA €13, Thailand €2, Brazil €3, Argentina €3.5, Russia €3 and Ukraine €2.5. Table 3.6 gives the results of costs at farm level and the costs of slaughter in eurocents per kg of carcass weight. Figure 3.4 gives the same data in a graph.
Table 3.6 Costs of primary production, costs of slaughter and total costs in eurocents per kg of carcass weight.
EU USA THA BRA ARG RUS UKR Costs farm level 144 110 124 100 105 141 114 Costs slaughter 29 25 17 17 18 17 17 Total 173 135 141 117 123 159 132
28 | LEI 2014-025
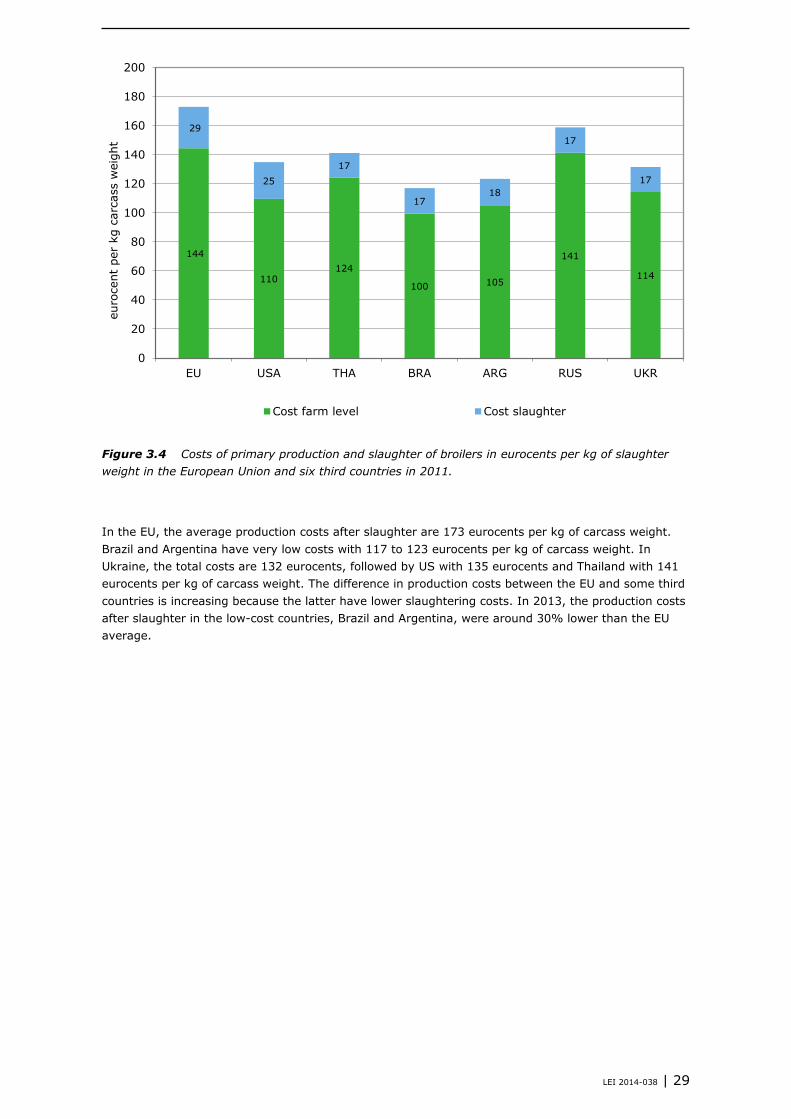
Figure 3.4 Costs of primary production and slaughter of broilers in eurocents per kg of slaughter weight in the European Union and six third countries in 2011.
In the EU, the average production costs after slaughter are 173 eurocents per kg of carcass weight. Brazil and Argentina have very low costs with 117 to 123 eurocents per kg of carcass weight. In Ukraine, the total costs are 132 eurocents, followed by US with 135 eurocents and Thailand with 141 eurocents per kg of carcass weight. The difference in production costs between the EU and some third countries is increasing because the latter have lower slaughtering costs. In 2013, the production costs after slaughter in the low-cost countries, Brazil and Argentina, were around 30% lower than the EU average.
144
110 124
100 105
141
114
29
25 17
17 18
17
17
0
20
40
60
80
100
120
140
160
180
200
EU USA THA BRA ARG RUS UKR
euro
cent
per
kg
carc
ass
wei
ght
Cost farm level Cost slaughter
LEI 2014-038 | 29
4 Import and export of poultry meat
Imports of breast fillet 4.1
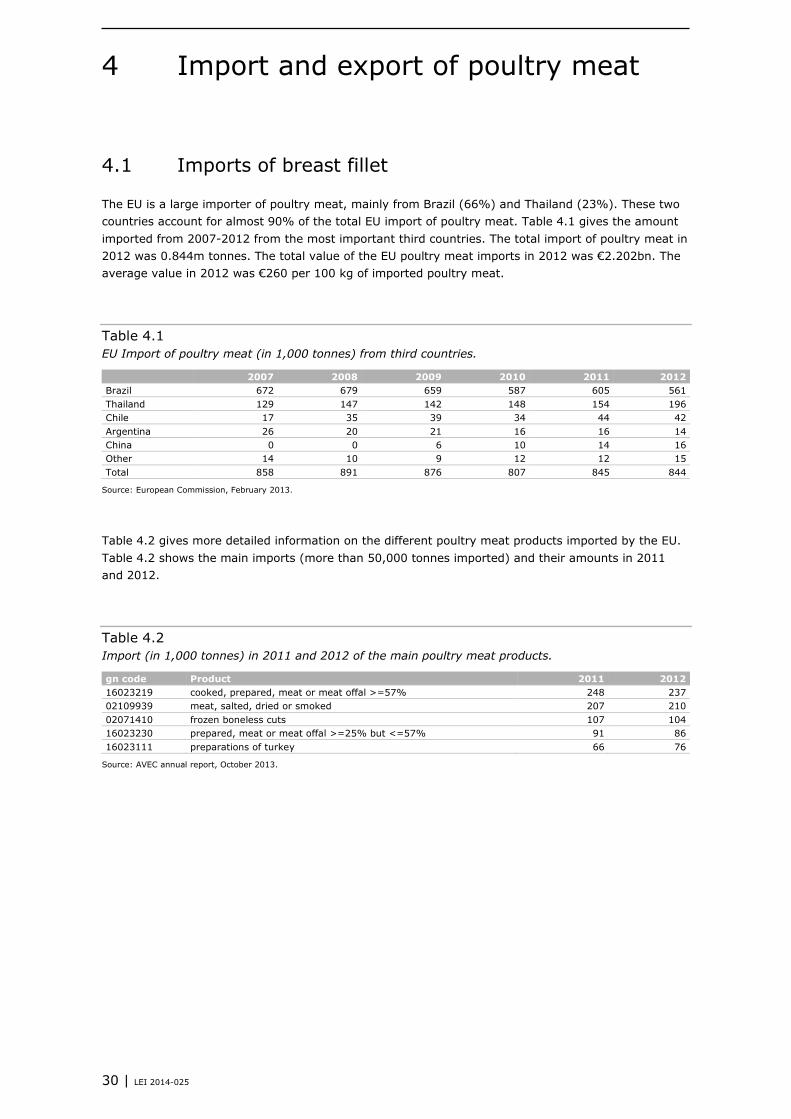
The EU is a large importer of poultry meat, mainly from Brazil (66%) and Thailand (23%). These two countries account for almost 90% of the total EU import of poultry meat. Table 4.1 gives the amount imported from 2007-2012 from the most important third countries. The total import of poultry meat in 2012 was 0.844m tonnes. The total value of the EU poultry meat imports in 2012 was €2.202bn. The average value in 2012 was €260 per 100 kg of imported poultry meat.
Table 4.1 EU Import of poultry meat (in 1,000 tonnes) from third countries.
2007 2008 2009 2010 2011 2012 Brazil 672 679 659 587 605 561 Thailand 129 147 142 148 154 196 Chile 17 35 39 34 44 42 Argentina 26 20 21 16 16 14 China 0 0 6 10 14 16 Other 14 10 9 12 12 15 Total 858 891 876 807 845 844
Source: European Commission, February 2013.
Table 4.2 gives more detailed information on the different poultry meat products imported by the EU. Table 4.2 shows the main imports (more than 50,000 tonnes imported) and their amounts in 2011 and 2012.
Table 4.2 Import (in 1,000 tonnes) in 2011 and 2012 of the main poultry meat products.
gn code Product 2011 2012 16023219 cooked, prepared, meat or meat offal >=57% 248 237 02109939 meat, salted, dried or smoked 207 210 02071410 frozen boneless cuts 107 104 16023230 prepared, meat or meat offal >=25% but <=57% 91 86 16023111 preparations of turkey 66 76
Source: AVEC annual report, October 2013.
30 | LEI 2014-025
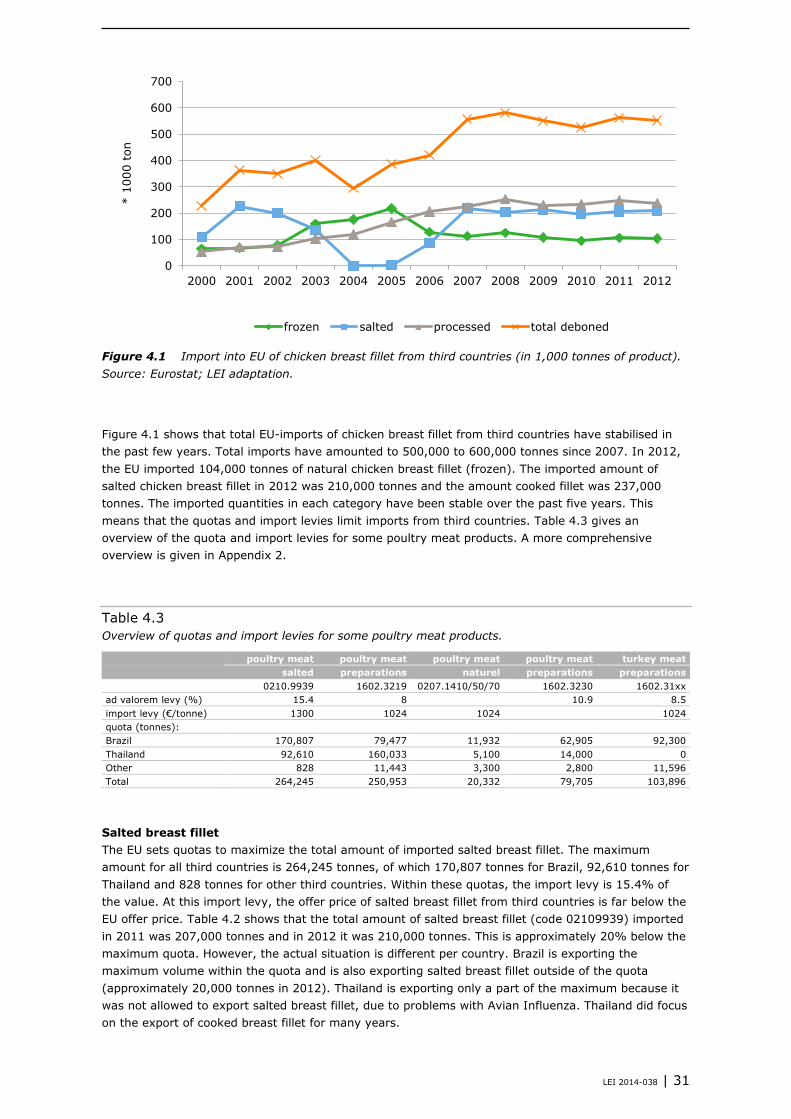
Figure 4.1 Import into EU of chicken breast fillet from third countries (in 1,000 tonnes of product). Source: Eurostat; LEI adaptation.
Figure 4.1 shows that total EU-imports of chicken breast fillet from third countries have stabilised in the past few years. Total imports have amounted to 500,000 to 600,000 tonnes since 2007. In 2012, the EU imported 104,000 tonnes of natural chicken breast fillet (frozen). The imported amount of salted chicken breast fillet in 2012 was 210,000 tonnes and the amount cooked fillet was 237,000 tonnes. The imported quantities in each category have been stable over the past five years. This means that the quotas and import levies limit imports from third countries. Table 4.3 gives an overview of the quota and import levies for some poultry meat products. A more comprehensive overview is given in Appendix 2.
Table 4.3 Overview of quotas and import levies for some poultry meat products.
poultry meat poultry meat poultry meat poultry meat turkey meat salted preparations naturel preparations preparations 0210.9939 1602.3219 0207.1410/50/70 1602.3230 1602.31xx ad valorem levy (%) 15.4 8 10.9 8.5 import levy (€/tonne) 1300 1024 1024 1024 quota (tonnes): Brazil 170,807 79,477 11,932 62,905 92,300 Thailand 92,610 160,033 5,100 14,000 0 Other 828 11,443 3,300 2,800 11,596 Total 264,245 250,953 20,332 79,705 103,896
Salted breast fillet The EU sets quotas to maximize the total amount of imported salted breast fillet. The maximum amount for all third countries is 264,245 tonnes, of which 170,807 tonnes for Brazil, 92,610 tonnes for Thailand and 828 tonnes for other third countries. Within these quotas, the import levy is 15.4% of the value. At this import levy, the offer price of salted breast fillet from third countries is far below the EU offer price. Table 4.2 shows that the total amount of salted breast fillet (code 02109939) imported in 2011 was 207,000 tonnes and in 2012 it was 210,000 tonnes. This is approximately 20% below the maximum quota. However, the actual situation is different per country. Brazil is exporting the maximum volume within the quota and is also exporting salted breast fillet outside of the quota (approximately 20,000 tonnes in 2012). Thailand is exporting only a part of the maximum because it was not allowed to export salted breast fillet, due to problems with Avian Influenza. Thailand did focus on the export of cooked breast fillet for many years.
0
100
200
300
400
500
600
700
2000 2001 2002 2003 2004 2005 2006 2007 2008 2009 2010 2011 2012
* 10
00 t
on
frozen salted processed total deboned
LEI 2014-038 | 31
Cooked breast fillet The EU sets quotas to maximise the total imported amount of cooked breast fillet. The maximum amount for Brazil is 79,477 tonnes, for Thailand 160,033 tonnes and for the other countries 11,443 tonnes. The total amount for all third countries is 250,953 tonnes. Within these quotas, the import levy is 8% of the value. At this import levy the offer price of cooked breast fillet from third countries is far below the EU offer price. That is why the quota is fully used. Table 4.2 shows that the total imported amount of cooked breast fillet (code 16023219) was 248,000 tonnes in 2011 and 237,000 tonnes in 2012. This is almost the maximum total amount. Outside the quota the import levy on cooked breast fillet is €1.02 per kg. Thailand is also exporting cooked breast fillet out of quota. Naturel breast fillet Natural breast fillet has just a limited quota of around 20,000 tonnes. The import levy is €1.02 per kg. Depending on the offer price, a varying additional import levy may be charged. In recent years this has varied from €0.30 to 0.40 per kg. Even with these import levies, third countries can offer natural breast fillet at more competitive prices than the EU industry. Table 4.2 shows that the amount imported of frozen natural breast fillet (code 2071410) was 107,000 tonnes in 2011 and 104,000 tonnes in 2012. Other products of poultry In addition to breast fillet, other products of poultry meat are also imported into the EU. The main product is prepared meat (prepared, meat or meat offal >=25% but <=57%, code 16023230), and in 2012 86,000 tonnes were imported. The quotas are set on 79,705 tonnes. Within the quotas the import levy is 10.9%. Turkey meat Although broiler is the main type of imported poultry meat, meat from other poultry species is also imported from third countries. For turkey meat preparations the maximum amount is 103,896 tonnes. Within these quotas the import levy is 8.5% In 2012, 76,000 tonnes of turkey meat (16023111, preparations of turkey) were imported. Outside the quota the import levy is €1.02 per kg. Depending on the offer price, an additional import levy may be charged.
Imports of leg meat 4.2
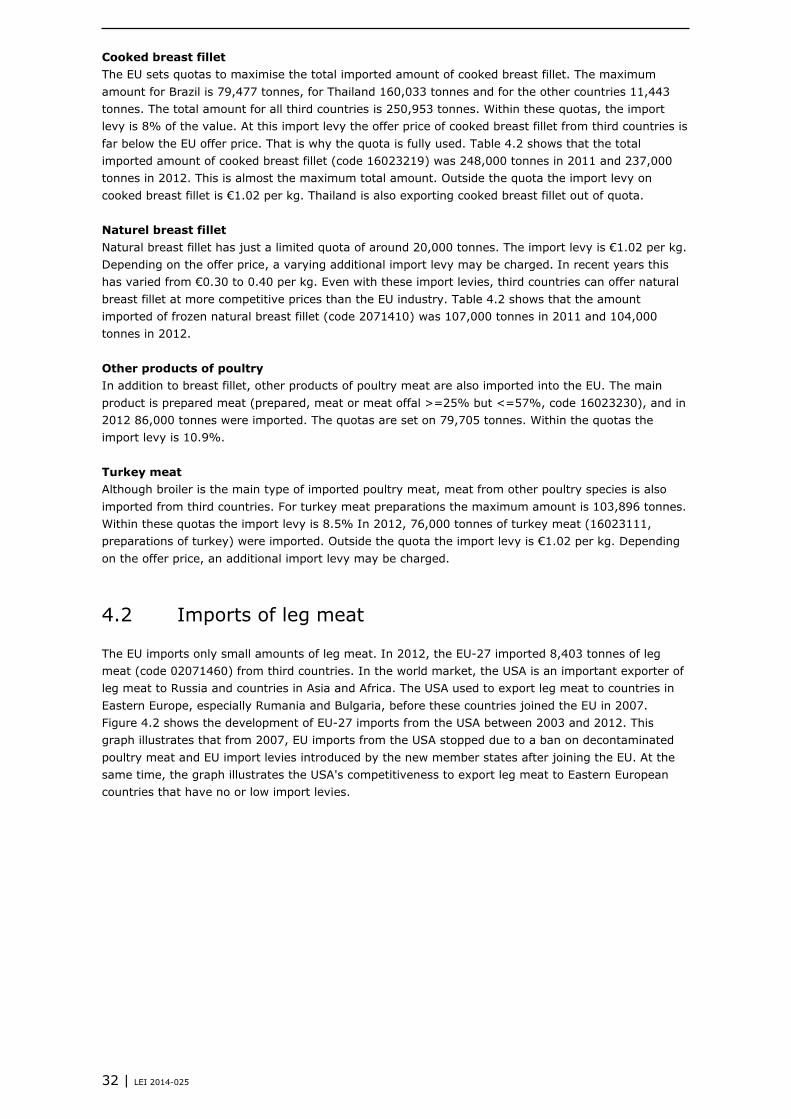
The EU imports only small amounts of leg meat. In 2012, the EU-27 imported 8,403 tonnes of leg meat (code 02071460) from third countries. In the world market, the USA is an important exporter of leg meat to Russia and countries in Asia and Africa. The USA used to export leg meat to countries in Eastern Europe, especially Rumania and Bulgaria, before these countries joined the EU in 2007. Figure 4.2 shows the development of EU-27 imports from the USA between 2003 and 2012. This graph illustrates that from 2007, EU imports from the USA stopped due to a ban on decontaminated poultry meat and EU import levies introduced by the new member states after joining the EU. At the same time, the graph illustrates the USA's competitiveness to export leg meat to Eastern European countries that have no or low import levies.
32 | LEI 2014-025
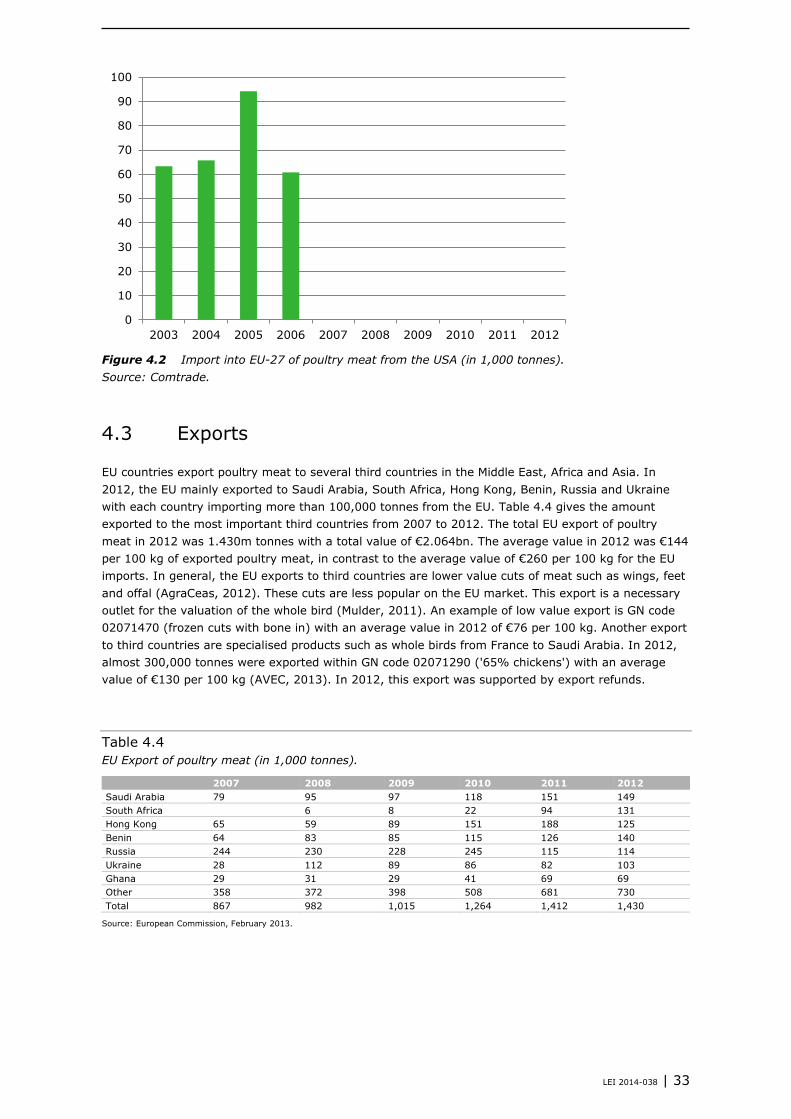
Figure 4.2 Import into EU-27 of poultry meat from the USA (in 1,000 tonnes). Source: Comtrade.
Exports 4.3
EU countries export poultry meat to several third countries in the Middle East, Africa and Asia. In 2012, the EU mainly exported to Saudi Arabia, South Africa, Hong Kong, Benin, Russia and Ukraine with each country importing more than 100,000 tonnes from the EU. Table 4.4 gives the amount exported to the most important third countries from 2007 to 2012. The total EU export of poultry meat in 2012 was 1.430m tonnes with a total value of €2.064bn. The average value in 2012 was €144 per 100 kg of exported poultry meat, in contrast to the average value of €260 per 100 kg for the EU imports. In general, the EU exports to third countries are lower value cuts of meat such as wings, feet and offal (AgraCeas, 2012). These cuts are less popular on the EU market. This export is a necessary outlet for the valuation of the whole bird (Mulder, 2011). An example of low value export is GN code 02071470 (frozen cuts with bone in) with an average value in 2012 of €76 per 100 kg. Another export to third countries are specialised products such as whole birds from France to Saudi Arabia. In 2012, almost 300,000 tonnes were exported within GN code 02071290 ('65% chickens') with an average value of €130 per 100 kg (AVEC, 2013). In 2012, this export was supported by export refunds.
Table 4.4 EU Export of poultry meat (in 1,000 tonnes).
2007 2008 2009 2010 2011 2012 Saudi Arabia 79 95 97 118 151 149 South Africa 6 8 22 94 131 Hong Kong 65 59 89 151 188 125 Benin 64 83 85 115 126 140 Russia 244 230 228 245 115 114 Ukraine 28 112 89 86 82 103 Ghana 29 31 29 41 69 69 Other 358 372 398 508 681 730 Total 867 982 1,015 1,264 1,412 1,430
Source: European Commission, February 2013.
0
10
20
30
40
50
60
70
80
90
100
2003 2004 2005 2006 2007 2008 2009 2010 2011 2012
LEI 2014-038 | 33
5 Results of different scenarios
Description of the scenarios 5.1
Three scenarios for the future were developed to show how a change in import levies and a change in the exchange rate may impact the competitiveness of the EU poultry meat sector: 1. A change in the EU import levy on poultry meat, as a possible result of a new multilateral (WTO)
agreement or bilateral agreements; in this scenario, the basic import levy is reduced by 50%, plus the additional levy is removed, as an example to illustrate the impact;
2. A change in exchange rates of the US dollar, Thai baht, Brazilian real, Argentine peso and Ukrainian hryvnia. In this scenario, a 10% lower exchange rate is assumed for the currencies of the non-EU-countries. The average exchange rate in 2013 was used to convert the production costs of all countries into euros. Appendix 1 shows the development of the exchange rate in some non-EU countries. The graph in Appendix 1 illustrates that a 10% lower exchange rate is a realistic scenario for some countries;
3. A combination of a lower import levy (scenario 1) and a lower exchange rate of third country currencies (scenario 2). This is the 'worst case' scenario.
In this chapter these three scenarios have been examined for breast fillet. In all figures, the EU level is an average of the nine EU countries shown in chapter 3.
Production costs of breast fillet 5.2
Based on the calculation of the production costs at farm level and in the slaughterhouse (see chapter 3), the production costs of breast fillet was calculated for all countries. After slaughter the bird's carcass has to be cut into different parts: breast cap, leg quarter, wings and rest of the carcass. In the next processing step, the breast cap will be deboned, and breast meat will be the final product. Breast meat is the product with the highest value on the European market and therefore it is the most interesting product to be exported to the EU. To calculate the production cost of breast meat for all countries, we added the following costs to the production after slaughter: the costs of cutting up the breast cap and the costs of deboning it. For EU countries, the disposal costs for offal also have to be added, and the revenues have to be subtracted from the total costs. Revenues come from the sale of the legs/leg quarters, the wings and the rest of the carcass. For the non-EU countries, revenue will also come from the offal. The result of the calculation will be the net production costs of a kg of breast meat at the processing plant in the production country. To compare the offer price on the EU market, we also added the additional costs of transport for all countries. Transport costs include local transport to the harbour, sea freight in a container, handling costs in the harbour, and transport from a European harbour to the final location within Europe. Frankfurt am Main in Germany is set as a reference to calculate the transport costs. The import levies were also added to these costs. Figure 5.1 gives an overview of all costs components to compare the offer price of the selected non-EU countries to the EU average.
34 | LEI 2014-025

Figure 5.1 Offer price of breast fillet from EU average (horizontal line) and non-EU countries in eurocents per kg of breast meat in 2013.
In 2013, the offer prices of Brazil, Argentina and Ukraine are already lower than the EU average offer price of breast fillet. Figure 5.1 illustrates that the import levies protect the EU countries from large imports of breast meat from third countries. The additional levy is an extra import tax that may be applied in case of a serious market disorder.
Scenario 1 - Lower EU import levy 5.3
In scenario 1, the impact of a 50% lower basic import levy and no additional levy on imports into the EU have been examined.
-
50
100
150
200
250
300
350
400
450
500
EU USA THA BRA ARG RUS UKR
production cost transport levy on imports additional levy
LEI 2014-038 | 35

Figure 5.2 Offer price of breast fillet from EU average (horizontal line) and non-EU countries in eurocents per kg of breast meat (scenario 1: 50% lower basic levy, no additional levy).
As Figure 5.2 illustrates, in this scenario Brazil and Argentina would be the most competitive suppliers of breast fillet to Frankfurt in 2013. Ukraine and Thailand would also have a lower offer price than the EU countries do. If the EU lowers its import levies, then the USA could also compete on the EU market; only Russia still could not.
Scenario 2 - Change in exchange rates 5.4
Scenario 2 evaluates the consequences of 10% lower currency exchange rates of all non-EU countries.
-
50
100
150
200
250
300
350
400
450
500
EU USA THA BRA ARG RUS UKR
production cost transport levy on imports
36 | LEI 2014-025
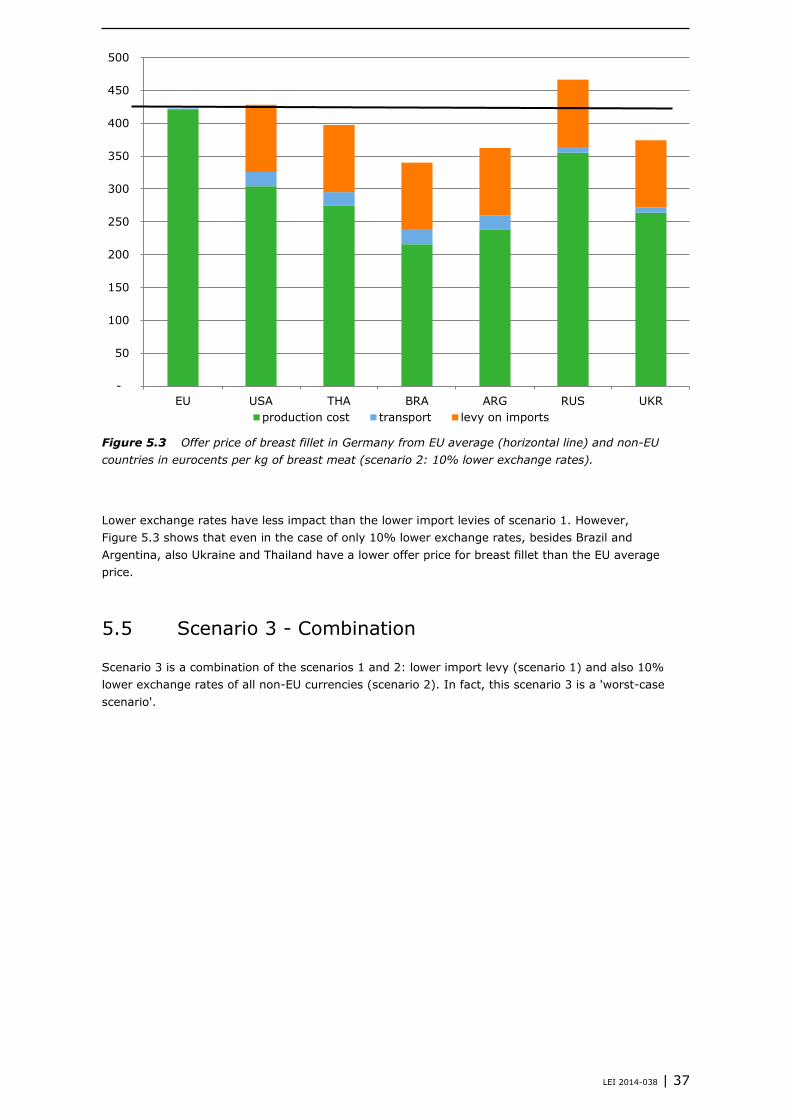
Figure 5.3 Offer price of breast fillet in Germany from EU average (horizontal line) and non-EU countries in eurocents per kg of breast meat (scenario 2: 10% lower exchange rates).
Lower exchange rates have less impact than the lower import levies of scenario 1. However, Figure 5.3 shows that even in the case of only 10% lower exchange rates, besides Brazil and Argentina, also Ukraine and Thailand have a lower offer price for breast fillet than the EU average price.
Scenario 3 - Combination 5.5
Scenario 3 is a combination of the scenarios 1 and 2: lower import levy (scenario 1) and also 10% lower exchange rates of all non-EU currencies (scenario 2). In fact, this scenario 3 is a 'worst-case scenario'.
-
50
100
150
200
250
300
350
400
450
500
EU USA THA BRA ARG RUS UKRproduction cost transport levy on imports
LEI 2014-038 | 37
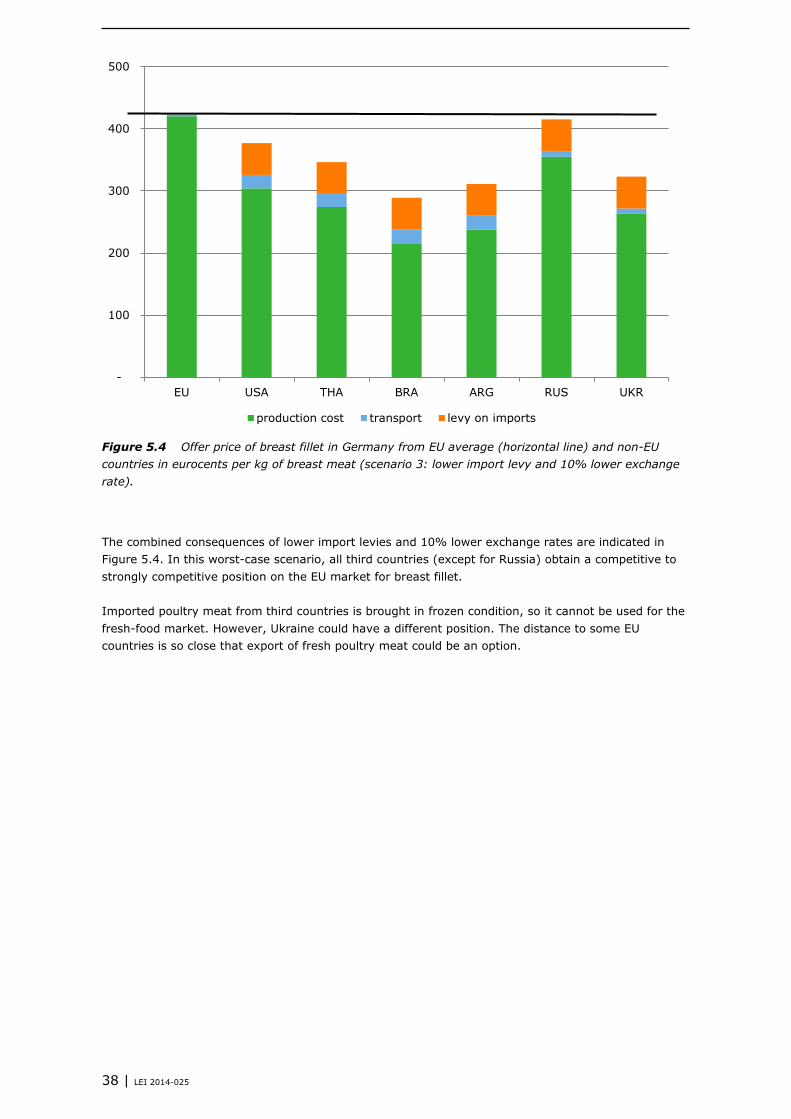
Figure 5.4 Offer price of breast fillet in Germany from EU average (horizontal line) and non-EU countries in eurocents per kg of breast meat (scenario 3: lower import levy and 10% lower exchange rate).
The combined consequences of lower import levies and 10% lower exchange rates are indicated in Figure 5.4. In this worst-case scenario, all third countries (except for Russia) obtain a competitive to strongly competitive position on the EU market for breast fillet. Imported poultry meat from third countries is brought in frozen condition, so it cannot be used for the fresh-food market. However, Ukraine could have a different position. The distance to some EU countries is so close that export of fresh poultry meat could be an option.
-
100
200
300
400
500
EU USA THA BRA ARG RUS UKR
production cost transport levy on imports
38 | LEI 2014-025
6 Conclusions
Structure and employment In 2012, the total poultry meat production in the EU-27 was 12.9m tonnes. The main poultry meat was broiler meat (76% of the total poultry meat production), followed by turkey meat and duck meat. The total number of farms with poultry in the EU-27 in 2010 was 2.2m. Of these farms, 19,680 can be described as professional because they have more than 5,000 birds. In the poultry meat supply chain, different companies are involved in supplies (e.g. hatcheries, feed mills) and slaughter/processing. The supply chain needs approximately 23 full-time workers for the production of 1,000 tonnes of poultry meat. The total employment in the EU poultry meat industry is estimated to be 303,000 employees and 5 to 10% of the market in the EU-27 is 'alternative broilers' (organic, free range and intermediate broilers). Economic importance of the poultry meat sector The total production value of the poultry meat sector in the EU-27 in 2012 was €32bn. This is the total value of the production at the primary farms, the slaughterhouses and the further processing of the poultry meat. The EU is an important player in the international trade of poultry meat. In 2012, the EU-27 exported 1.430m tonnes of poultry meat with a value of €2.064bn (average value €144 per 100 kg). At the same time, the EU-27 imported 0.844m tonnes with a value of €2.202bn (average value €261 per kg. EU legislation In the EU, poultry meat producers have to comply with European legislation. The additional costs of EU legislation are estimated to be 4.8 eurocents per kg of live weight (5.1% of the total production costs in 2011). These costs relate directly to EU legislation on environmental protection (Nitrate directive and reduction of ammonia emissions), food safety (Salmonella control, ban on the use of meat-and-bone meal, antibiotic growth promoters and GMO crops as feed ingredients) and animal welfare (minimum standards on space allowance). Third countries In general, many non-EU countries have very little to no legislation on environmental protection and animal welfare. Some countries, especially the USA, do have legislation on food safety. The main poultry meat exporting countries - excluding the USA - are Brazil, Thailand and Argentina. These countries have no environmental or animal welfare legislation. However, the stocking density in these countries is relatively low (30 to 40 kg per m2), due to high temperatures and low housing costs. These third countries have no legislation in the following areas: the use of GMO feed ingredients, use of meat-and-bone meal in poultry feed, the use of growth promoters, and the control of ammonia emissions from poultry houses and during manure application. Production costs within the EU The production costs of broiler meat have been calculated for the Netherlands, Germany, France, United Kingdom, Italy, Spain, Italy, Denmark, Poland and Hungary. The production cost in 2013 at farm level in these countries was, on average, 101.1 eurocents per kg of live weight. After slaughter, the production costs for these countries ranged from 156 to 183 eurocents with an average of 173 eurocents per kg of carcass weight. Production costs in non-EU countries The production costs of broiler meat were calculated for the following third countries: the United States, Thailand, Brazil, Argentina, Russia and Ukraine. For most of these countries, the production costs after slaughter are significantly lower than they are in the EU countries. Compared to the average level within the EU, the production costs per kg of carcass weight in 2013 was lower in Argentina (71%), Brazil (68%), Ukraine (76%), USA (78%), Thailand (82%) and Russia (92%). In the USA, Brazil and Argentina, the feed prices are low, due to the domestic availability of large quantities
LEI 2014-038 | 39
of feed ingredients. Most third countries also have the advantages of lower housing and labour costs (lower wages and low taxes and social security contributions), and a lack of legislation governing poultry meat production. Imports breast fillet third countries The EU is a large importer of poultry meat. Imports of breast fillet mainly come from Brazil and Thailand. Salted breast fillet is imported (in 2012 210,000 tonnes) within quota at an import levy of 15.4%. Cooked breast fillet is imported (in 2012 237,000 tonnes) within quota at an import levy of 8%. Natural breast fillet has a small quota and imports occur outside the quota. Outside the quota an import levy of €1.02 per kg has to be paid, and in recent years, an additional import levy (safe guard) of €0.10 to 0.30 per kg has also been charged. Despite these high import levies, the imports are competitive, and in 2012, 104,000 tonnes of natural breast fillet was imported. After the introduction of import quota in 2007, the total imports of poultry meat have not increased. Imports leg meat third countries The EU imports only small amounts of leg meat. In the world market, the USA is an important exporter of leg meat. The USA used to export leg meat to countries in Eastern Europe, especially Rumania and Bulgaria, before these countries joined the EU in 2007. Before 2007, the imports from the USA varied between 60,000 to 90,000 tonnes per year. This illustrates the competitiveness of the USA to export leg meat to countries in Eastern Europe that have low or no import levies. In any free trade agreement of the EU with the USA a trade flow of legs or leg quarters from the USA towards some eastern European countries can be expected. Basis situation on import of breast fillet Based on the calculation of the production costs at farm level and in the slaughterhouse, the production costs of breast fillet were calculated for the EU and non-EU countries. The costs of cutting up and deboning have to be included and the revenues for the other parts have to be subtracted. After the transportation costs and the full import levy (including the additional levy) were added, the results show that Argentina and Brazil can compete with the offer price of the EU poultry meat industry. Compared to the results of the 2011 comparison (van Horne, 2013) the difference in offer price of all third countries (except Russia) with the EU average did increase. This was a result of a larger increase in feed prices in the EU countries and a lower exchange rate of the currency in the third countries to the euro. Scenarios Some scenarios for the future have been developed to show how a possible change in import levies and a change in the exchange rate could impact the competitiveness of the EU poultry meat. In the first scenario, a 50% lower basic import levy and no additional levy on poultry meat was used to illustrate the impact of any multi- or bilateral agreement with lower import levies. The results show that in this scenario Argentina, Brazil, Ukraine, USA and Thailand have a lower offer price of breast fillet than the EU poultry meat industry does. In the scenario with a 10% lower exchange rate, Argentina, Brazil, Ukraine and Thailand have a lower offer price offer price to the EU industry. For the worst case scenario, with a combination of lower import levies and a 10% lower exchange rate, all third countries in this research have a lower offer price of breast fillet than the EU industry does. SWOT analysis In a SWOT model, the strengths, weaknesses, opportunities and threats for the EU poultry meat sector were defined. The SWOT analysis gives an overview of the current situation and can be seen as a summary of the study. In Table 6.1, the most important SWOT components are mentioned for the EU poultry meat industry. The components of the SWOT analysis are based on this research, other LEI reports (Van Horne, 2013) and the research of the Rabobank (Mulder, 2011).
40 | LEI 2014-025
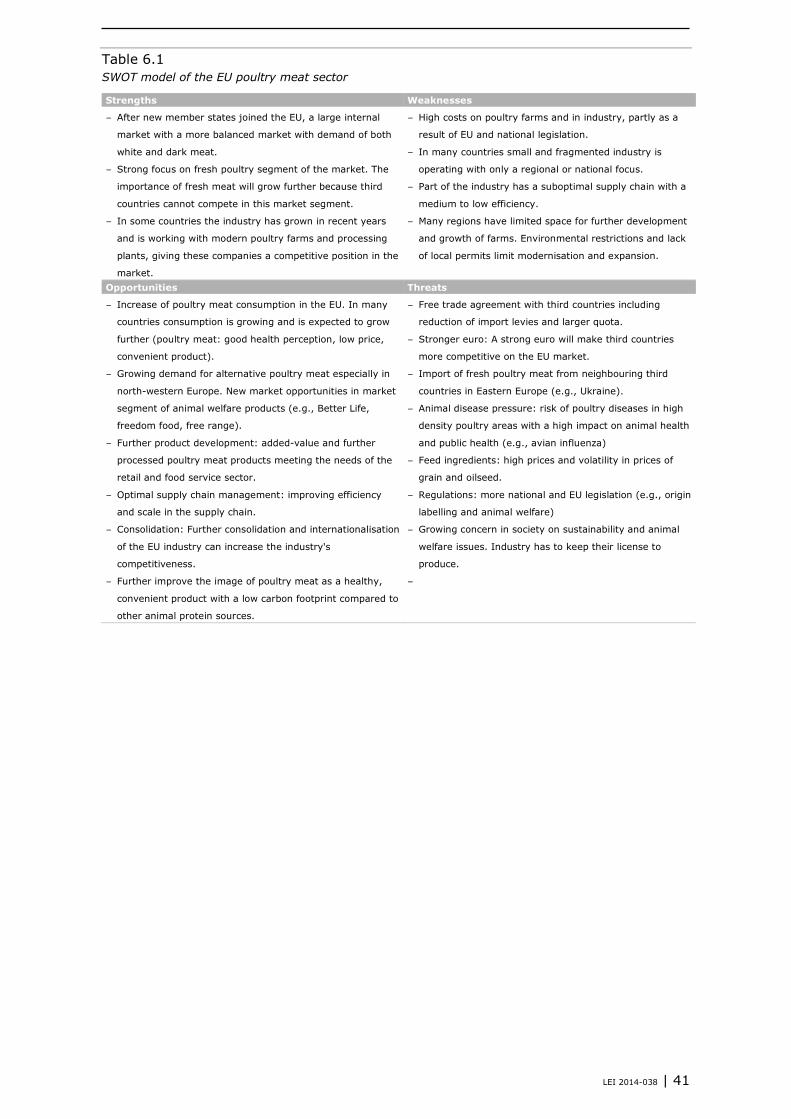
Table 6.1 SWOT model of the EU poultry meat sector
Strengths Weaknesses
After new member states joined the EU, a large internal
market with a more balanced market with demand of both
white and dark meat.
Strong focus on fresh poultry segment of the market. The
importance of fresh meat will grow further because third
countries cannot compete in this market segment.
In some countries the industry has grown in recent years
and is working with modern poultry farms and processing
plants, giving these companies a competitive position in the
market.
High costs on poultry farms and in industry, partly as a
result of EU and national legislation.
In many countries small and fragmented industry is
operating with only a regional or national focus.
Part of the industry has a suboptimal supply chain with a
medium to low efficiency.
Many regions have limited space for further development
and growth of farms. Environmental restrictions and lack
of local permits limit modernisation and expansion.
Opportunities Threats
Increase of poultry meat consumption in the EU. In many
countries consumption is growing and is expected to grow
further (poultry meat: good health perception, low price,
convenient product).
Growing demand for alternative poultry meat especially in
north-western Europe. New market opportunities in market
segment of animal welfare products (e.g., Better Life,
freedom food, free range).
Further product development: added-value and further
processed poultry meat products meeting the needs of the
retail and food service sector.
Optimal supply chain management: improving efficiency
and scale in the supply chain.
Consolidation: Further consolidation and internationalisation
of the EU industry can increase the industry's
competitiveness.
Further improve the image of poultry meat as a healthy,
convenient product with a low carbon footprint compared to
other animal protein sources.
Free trade agreement with third countries including
reduction of import levies and larger quota.
Stronger euro: A strong euro will make third countries
more competitive on the EU market.
Import of fresh poultry meat from neighbouring third
countries in Eastern Europe (e.g., Ukraine).
Animal disease pressure: risk of poultry diseases in high
density poultry areas with a high impact on animal health
and public health (e.g., avian influenza)
Feed ingredients: high prices and volatility in prices of
grain and oilseed.
Regulations: more national and EU legislation (e.g., origin
labelling and animal welfare)
Growing concern in society on sustainability and animal
welfare issues. Industry has to keep their license to
produce.
LEI 2014-038 | 41
References and websites
Aarnink, A.J.A. and H.H. Ellen, 2008. 'Processes and factors affecting dust emissions from livestock production'. In: Dust Conf 2007. How to improve air quality. International conference, 23-24.4,2008, Maastricht, The Netherlands.
Agra CEAS, December 2012. Study on various methods of stunning for poultry. Final report for EC DG
for Health and Consumers. DG Sanco, Brussel. http://ec.europa.eu/food/animal/welfare/slaughter/index_en.htm
AVEC, October 2013. Annual report 2013. Brussels. Backus, G., P. Berkhout, D. Eaton, T. de Klijn, E. van Mil, P. Roza and W. Uffelmann, 2008. EU policy
on GMOs. A quick scan of the economic consequences. Report 2008-070. LEI Wageningen UR, The Hague.
Bracke, M. (editor), September 2009. Animal welfare in a global perspective. Wageningen UR
Livestock Research. Report 240. Lelystad. Baltussen, W. et al., June 2013. Study on mandatory origin labelling for pig, poultry and sheep & goat
meat. Study by LEI Wageningen UR and commissioned by European Commission. June 2013. http://ec.europa.eu/agriculture/external-studies/origin-labelling-2013_en.htm
Chotteau, Ph., N. Beaumond, C. Deblitz, R. Hoste, P. Magdelaine, A. Mottet, K. De Roest, C. Roguet,
P. Sarzeaud, M. Topliff and P. Van Horne. 2009. The impact of increased operating costs on meat livestock in the EU. Study for the European Parliament. Paris, Institut de l'Elevage. http://www.europarl.europa.eu/RegData/etudes/etudes/join/2009/419109/IPOL-AGRI_ET(2009)419109_EN.pdf
DIW, December 2012. Die volkswirtschaftliche Bedeutung der Deutschen Geflügelwirtschaft. German
Institute for Economic Research, Berlin. Eurostat, 2010. Survey on number of farms and farm size.
http://epp.eurostat.ec.europa.eu/portal/page/portal/eurostat/home Hiemstra, S.J. en J. ten Napel, February. Study of the impact of genetic selection on the welfare of
chickens bred and kept for meat production. Implemented by IBF and Wageningen UR. DG. Horne, P.L.M. van, C.P.A. van Wagenberg, M.A. de Winter, R. Hoste, S.I. Senesi, M.M. Barilatti, M.
Daziano, L.D.C. Martino and M.M.T. Becerra, February 2010. The poultry and pig sector in Argentina: husbandry practice and animal welfare. The Hague: LEI Wageningen UR.
Horne, P.L.M. van, November 2012. Competitiveness of the EU egg industry. Report 2012-065. The
Hague: LEI Wageningen UR. Horne, P.L.M van and N. Bondt. December 2013. Competitiveness of the EU poultry meat sector.
Report 2013-068. The Hague: LEI Wageningen UR. Horne, P.L.M. van, May 2013. Competitiveness of the Dutch Poultry meat sector (in Dutch). Report
2013-037. LEI Wageningen UR, The Hague. ITAVI, 2012. La compétitivité agricole du Mercosur Le cas des filieres d'élevage brésiliennes. Rapport
DGPAAT 11-02. Institute de l'elevage, IFIP and ITAVI. France.
42 | LEI 2014-025
http://agriculture.gouv.fr/competitivite-agricole-Mercosur ITAVI, March 2013. Information on number of companies and employment. Paris. MEG, May 2013. Marktbilanz Eier und Geflügel. Bonn. Mulder and Nan Dirk, 2011. Crossroads for Growth. The International Poultry Sector Towards 2020.
Rabobank. Utrecht. The Netherlands. PVE, August 2012. Statistical Annual Report. Zoetermeer. www.pve.nl Wagenberg, C.P.A. van, F.M. Brouwer, R. Hoste and M.L. Rau, 2012. Comparative analysis of EU
standards in food safety, environment, animal welfare and other non-trade concerns with some selected countries. European Union. LEI Wageningen UR. http://www.europarl.europa.eu/RegData/etudes/etudes/join/2012/474542/IPOL-AGRI_ET(2012)474542_EN.pdf
LEI 2014-038 | 43
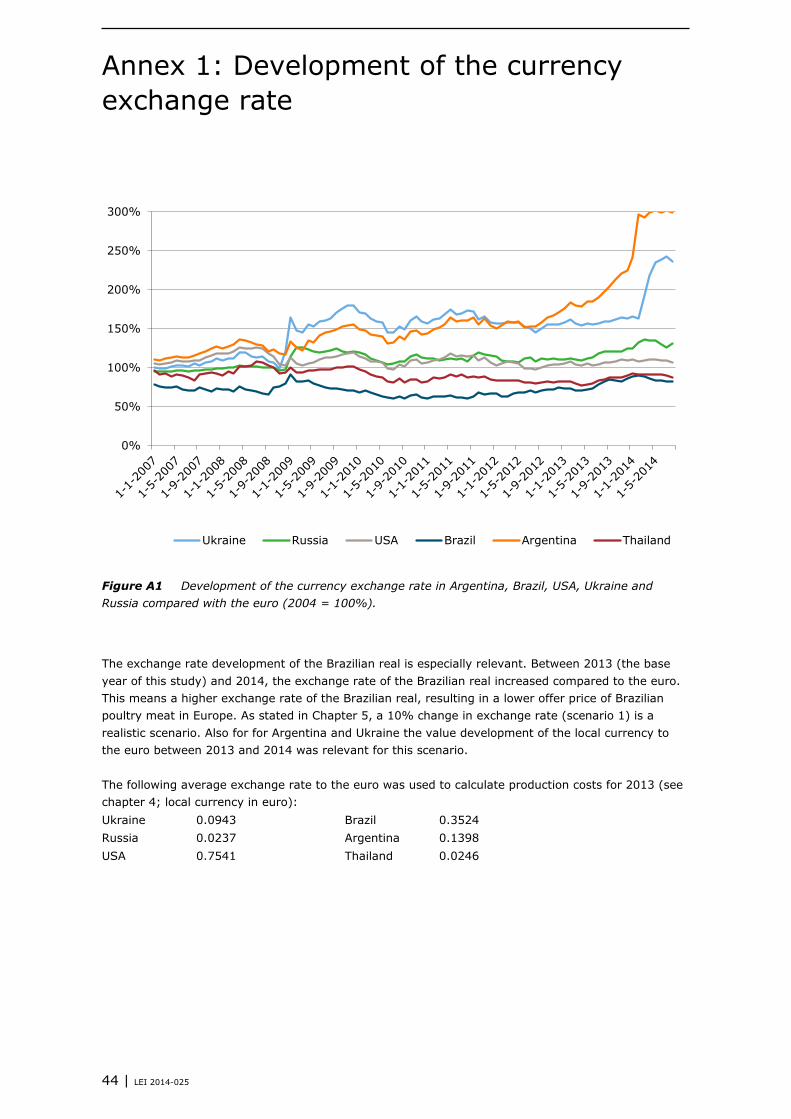
Annex 1: Development of the currency exchange rate
Figure A1 Development of the currency exchange rate in Argentina, Brazil, USA, Ukraine and Russia compared with the euro (2004 = 100%).
The exchange rate development of the Brazilian real is especially relevant. Between 2013 (the base year of this study) and 2014, the exchange rate of the Brazilian real increased compared to the euro. This means a higher exchange rate of the Brazilian real, resulting in a lower offer price of Brazilian poultry meat in Europe. As stated in Chapter 5, a 10% change in exchange rate (scenario 1) is a realistic scenario. Also for for Argentina and Ukraine the value development of the local currency to the euro between 2013 and 2014 was relevant for this scenario. The following average exchange rate to the euro was used to calculate production costs for 2013 (see chapter 4; local currency in euro): Ukraine 0.0943 Brazil 0.3524 Russia 0.0237 Argentina 0.1398 USA 0.7541 Thailand 0.0246
0%
50%
100%
150%
200%
250%
300%
Ukraine Russia USA Brazil Argentina Thailand
44 | LEI 2014-025
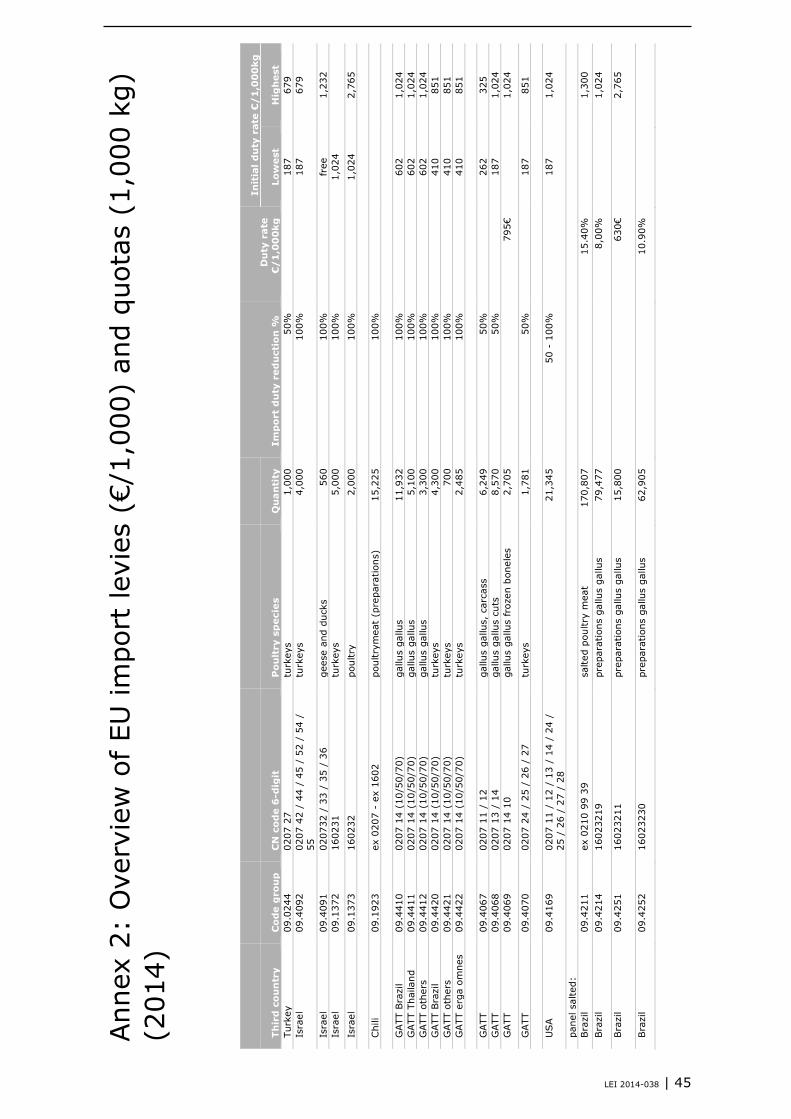
LEI 2014-038 | 45
Ann
ex 2
: O
verv
iew
of EU
impo
rt le
vies
(€/
1,00
0) a
nd q
uota
s (1
,000
kg)
(2
014)
Imp
ort
du
ty r
edu
ctio
n %
D
uty
rat
e €
/1
,00
0kg
Init
ial
du
ty r
ate
€/
1,0
00
kg
Th
ird
co
un
try
Co
de
gro
up
C
N c
od
e 6
-dig
it
Po
ult
ry s
pec
ies
Qu
an
tity
Lo
wes
t H
igh
est
Turk
ey
09.0
244
0207
27
turk
eys
1,00
0 50
%
18
7 67
9 Is
rael
09
.409
2 02
07 4
2 /
44 /
45
/ 52
/ 5
4 /
55
turk
eys
4,00
0 10
0%
18
7 67
9
Isra
el
09.4
091
0207
32 /
33
/ 35
/ 3
6 ge
ese
and
duck
s 56
0 10
0%
fr
ee
1,23
2 Is
rael
09
.137
2 16
0231
tu
rkey
s 5,
000
100%
1,02
4
Isra
el
09.1
373
1602
32
poul
try
2,00
0 10
0%
1,
024
2,76
5
Chi
li 09
.192
3 ex
020
7 -
ex 1
602
poul
trym
eat
(pre
para
tions
) 15
,225
10
0%
GATT
Bra
zil
09.4
410
0207
14
(10/
50/7
0)
gallu
s ga
llus
11,9
32
100%
602
1,02
4 G
ATT
Tha
iland
09
.441
1 02
07 1
4 (1
0/50
/70)
ga
llus
gallu
s 5,
100
100%
602
1,02
4 G
ATT
oth
ers
09.4
412
0207
14
(10/
50/7
0)
gallu
s ga
llus
3,30
0 10
0%
60
2 1,
024
GATT
Bra
zil
09.4
420
0207
14
(10/
50/7
0)
turk
eys
4,30
0 10
0%
41
0 85
1 G
ATT
oth
ers
09.4
421
0207
14
(10/
50/7
0)
turk
eys
700
100%
410
851
GATT
erg
a om
nes
09.4
422
0207
14
(10/
50/7
0)
turk
eys
2,48
5 10
0%
41
0 85
1
GATT
09
.406
7 02
07 1
1 /
12
gallu
s ga
llus,
car
cass
6,
249
50%
262
325
GATT
09
.406
8 02
07 1
3 /
14
gallu
s ga
llus
cuts
8,
570
50%
187
1,02
4 G
ATT
09
.406
9 02
07 1
4 10
ga
llus
gallu
s fr
ozen
bon
eles
2,
705
79
5€
1,
024
GATT
09
.407
0 02
07 2
4 /
25 /
26
/ 27
tu
rkey
s 1,
781
50%
187
851
U
SA
09.4
169
0207
11
/ 12
/ 1
3 /
14 /
24
/ 25
/ 2
6 /
27 /
28
21,3
45
50 -
100
%
18
7 1,
024
pane
l sal
ted:
Bra
zil
09.4
211
ex 0
210
99 3
9 sa
lted
poul
try
mea
t 17
0,80
7
15.4
0%
1,
300
Bra
zil
09.4
214
1602
3219
pr
epar
atio
ns g
allu
s ga
llus
79,4
77
8,
00%
1,02
4
Bra
zil
09.4
251
1602
3211
pr
epar
atio
ns g
allu
s ga
llus
15,8
00
63
0€
2,
765
Bra
zil
09.4
252
1602
3230
pr
epar
atio
ns g
allu
s ga
llus
62,9
05
10
.90%
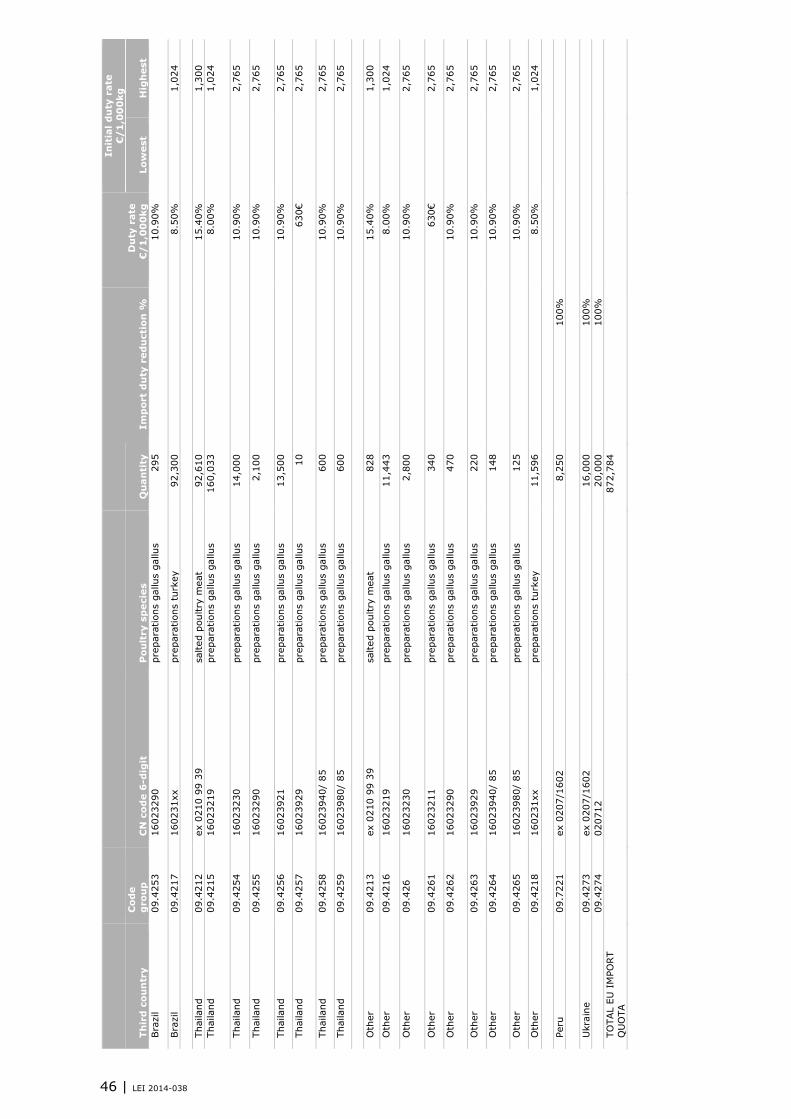
46 | LEI 2014-038
Imp
ort
du
ty r
edu
ctio
n %
D
uty
rat
e €
/1
,00
0kg
Init
ial
du
ty r
ate
€/
1,0
00
kg
Th
ird
co
un
try
Co
de
gro
up
C
N c
od
e 6
-dig
it
Po
ult
ry s
pec
ies
Qu
an
tity
Lo
wes
t H
igh
est
Bra
zil
09.4
253
1602
3290
pr
epar
atio
ns g
allu
s ga
llus
295
10
.90%
Bra
zil
09.4
217
1602
31xx
pr
epar
atio
ns t
urke
y 92
,300
8.50
%
1,
024
Th
aila
nd
09.4
212
ex 0
210
99 3
9 sa
lted
poul
try
mea
t 92
,610
15.4
0%
1,
300
Thai
land
09
.421
5 16
0232
19
prep
arat
ions
gal
lus
gallu
s 16
0,03
3
8.00
%
1,
024
Thai
land
09
.425
4 16
0232
30
prep
arat
ions
gal
lus
gallu
s 14
,000
10.9
0%
2,
765
Thai
land
09
.425
5 16
0232
90
prep
arat
ions
gal
lus
gallu
s 2,
100
10
.90%
2,76
5
Thai
land
09
.425
6 16
0239
21
prep
arat
ions
gal
lus
gallu
s 13
,500
10.9
0%
2,
765
Thai
land
09
.425
7 16
0239
29
prep
arat
ions
gal
lus
gallu
s 10
630€
2,76
5
Thai
land
09
.425
8 16
0239
40/
85
prep
arat
ions
gal
lus
gallu
s 60
0
10.9
0%
2,
765
Thai
land
09
.425
9 16
0239
80/
85
prep
arat
ions
gal
lus
gallu
s 60
0
10.9
0%
2,
765
O
ther
09
.421
3 ex
021
0 99
39
salte
d po
ultr
y m
eat
828
15
.40%
1,30
0
Oth
er
09.4
216
1602
3219
pr
epar
atio
ns g
allu
s ga
llus
11,4
43
8.
00%
1,02
4
Oth
er
09.4
26
1602
3230
pr
epar
atio
ns g
allu
s ga
llus
2,80
0
10.9
0%
2,
765
Oth
er
09.4
261
1602
3211
pr
epar
atio
ns g
allu
s ga
llus
340
63
0€
2,
765
Oth
er
09.4
262
1602
3290
pr
epar
atio
ns g
allu
s ga
llus
470
10
.90%
2,76
5
Oth
er
09.4
263
1602
3929
pr
epar
atio
ns g
allu
s ga
llus
220
10
.90%
2,76
5
Oth
er
09.4
264
1602
3940
/ 85
pr
epar
atio
ns g
allu
s ga
llus
148
10
.90%
2,76
5
Oth
er
09.4
265
1602
3980
/ 85
pr
epar
atio
ns g
allu
s ga
llus
125
10
.90%
2,76
5
Oth
er
09.4
218
1602
31xx
pr
epar
atio
ns t
urke
y 11
,596
8.50
%
1,
024
Pe
ru
09.7
221
ex 0
207/
1602
8,25
0 10
0%
Ukr
aine
09
.427
3 ex
020
7/16
02
16
,000
10
0%
09.4
274
0207
12
20
,000
10
0%
TO
TAL
EU I
MPO
RT
QU
OTA
872,
784

LEI Wageningen UR P.O. Box 29703 2502 LS Den Haag The Netherlands T +31 (0)70 335 83 30 E [email protected] www.wageningenUR.nl/en/lei REPORT LEI 2014-038
LEI Wageningen UR is one of the world's leading independent socio-economic research institutes. LEI's unique data, models and knowledge offer clients insight and integrated advice on policy and decision-making in an innovative manner, and ultimately contribute to a more sustainable world. LEI is part of Wageningen UR (University and Research centre). forming the Social Sciences Group together with the Department of Social Sciences and Wageningen UR Centre for Development Innovation. The mission of Wageningen UR (University & Research centre) is ‘To explore the potential of nature to improve the quality of life’. Within Wageningen UR. nine specialised research institutes of the DLO Foundation have joined forces with Wageningen University to help answer the most important questions in the domain of healthy food and living environment. With approximately 30 locations. 6.000 members of staff and 9.000 students. Wageningen UR is one of the leading organisations in its domain worldwide. The integral approach to problems and the cooperation between the various disciplines are at the heart of the unique Wageningen Approach.

LEI Wageningen UR is one of the world’s leading independent socio-economic research institutes. LEI’s unique data, models and knowledge offer clients insight and integrated advice on policy and decision-making in an innovative manner, and ultimately contribute to a more sustainable world. LEI is part of Wageningen UR (University and Research centre), forming the Social Sciences Group together with the Department of Social Sciences and Wageningen UR Centre for Development Innovation.
The mission of Wageningen UR (University & Research centre) is ‘To explore the potential of nature to improve the quality of life’. Within Wageningen UR, nine specialised research institutes of the DLO Foundation have joined forces with Wageningen University to help answer the most important questions in the domain of healthy food and living environment. With approximately 30 locations, 6,000 members of staff and 9,000 students, Wageningen UR is one of the leading organisations in its domain worldwide. The integral approach to problems and the cooperation between the various disciplines are at the heart of the unique Wageningen Approach.
LEI Wageningen URP.O. Box 297032502 LS Den HaagThe NetherlandsE [email protected]/lei
REPORT LEI 2014-038ISBN/EAN 978-90-8615-691-765
P.L.M. van Horne and N. Bondt
International comparison base year 2013
Competitiveness of the EU poultry meat sector