components & experiments toward a pollen neutralization system · abstract pollen...
TRANSCRIPT
Components & ExperimentsToward a Pollen Neutralization System
Ziqi Guo, Mel Siegel
CMU-RI-TR-18-10
April 2018
Robotics InstituteCarnegie Mellon University
Pittsburgh, Pennsylvania 15213
c© Carnegie Mellon University


AbstractPollen Neutralization System aims to maintain desired indoor temperature, humidity and pollen density, based on
the hypothesis that certain temperature and humidity help reduce pollen density.The system displays real-time values of temperature and humidity sensor (DHT22), dust sensor (DSM501A), and
predicts the trends of temperature and humidity. Fuzzy control strategy was used to eliminate overshoot of temperaturecontrol. Relay ports were reserved to control Heating Ventilation and Air Conditioning (HVAC), Humidifier, andHigh Efficiency Particle Arrestance Filter (HEPA). Moreover, a previously published experiment by Barnes et al. wasreferred to testify the relationship between temperature, humidity and pollen density. Another self-designed experimentwas compared and analyzed, where pollen density is surrogated by dust ratio. Those two experiments demonstrate thattemperature and humidity have minimal influence on pollen density and dust ratio.
I

AcknowledgementI would like to show my gratitude to Dr. Mel Siegel and Rachel Burcin who always provide great help and support.
I am honored to have them as my mentors. Special thanks to Dr. Mel Siegel for his detailed instructions on PollenNeutralization System and valuable comments on this Technical Report.
I also thank for Suryansh and Isaac who provided insight and experience of how to detect practical problemswhich need to be solved and propose research topics. Pollen Neutralization System was proposed during discussionwith them.
II

Contents1 Introduction 1
2 Hardware components 12.1 DHT22 . . . . . . . . . . . . . . . . . . . . . . . . . . . . . . . . . . . . . . . . . . . . . . . . . . 22.2 DSM501A . . . . . . . . . . . . . . . . . . . . . . . . . . . . . . . . . . . . . . . . . . . . . . . . . 4
3 Software 63.1 Trend Prediction . . . . . . . . . . . . . . . . . . . . . . . . . . . . . . . . . . . . . . . . . . . . . 63.2 Fuzzy Control . . . . . . . . . . . . . . . . . . . . . . . . . . . . . . . . . . . . . . . . . . . . . . . 6
4 Experiment 84.1 Barnes Experiment . . . . . . . . . . . . . . . . . . . . . . . . . . . . . . . . . . . . . . . . . . . . 84.2 Self-Designed Experiment . . . . . . . . . . . . . . . . . . . . . . . . . . . . . . . . . . . . . . . . 84.3 Analysis . . . . . . . . . . . . . . . . . . . . . . . . . . . . . . . . . . . . . . . . . . . . . . . . . . 12
5 Conclusion 13
6 Appendix 146.1 DHT22 Datasheet . . . . . . . . . . . . . . . . . . . . . . . . . . . . . . . . . . . . . . . . . . . . 146.2 DSM501A Datasheet . . . . . . . . . . . . . . . . . . . . . . . . . . . . . . . . . . . . . . . . . . . 14
III


1 Introduction
Nowadays, roughly 7.8% of people 18 and over in the U.S. have hay fever.[1]
Some of people get hay fever becauseof the exposure to pollen for a period of time, usually 3-5 years. Hay fever is a type of inflammation in the nose whichoccurs when the immune system overreacts to allergens in the air. Signs and symptoms include a runny or stuffynose, sneezing, red, itchy, and watery eyes, and swelling around the eyes.
[2]The fluid from the nose is usually clear.
Symptoms onset is often within minutes following exposure and they can affect sleep, the ability to work, and theability to concentrate at school.
[3]
It is also inevitable that indoor room exists pollen. People may gradually get hay fever and suffer from it, evenalways stay indoor. Therefore a Pollen Neutralization System is needed. The system should be able to maintain desiredenvironment to prevent hay fever.
For this project, Pollen Neutralization System detects temperature, humidity and pollen density. It also predictstrends of temperature and humidity. Fuzzy control strategy was utilized for temperature control. Based on the hypoth-esis that temperature, humidity affect pollen density, a previously published experiment
[5]was referred to testify the
relationship between temperature, humidity and pollen density. Another self-designed experiment was compared andanalyzed.
The report is organized as the following. Section 2 shows hardware components of Pollen Neutralization Sys-tem. In section 3, methods of trend prediction and fuzzy control strategy are introduced. Section 4 describes twoexperiments. Section 5 gives conclusion. And section 6 includes appendix documents: codes for Pollen NeutralizationSystem, Arduino Mega documents, DHT22 and DSM501A sensor data-sheets.
2 Hardware components
The system, Figure 1, is composed by Arduino Mega with LCD screen, temperature and humidity sensor (DHT22),dust sensor (DSM501A), and relay. Detailed information of Arduino Mega, DHT22 and DSM501A are referred in Ap-pendix.
Figure 1: The sub-pictures include overview of Pollen Neutralization System (left-top), Arduino Mega with shieldedLCD and protection (right-top), DSM501A and DHT22 sensors (left-bottom), relay (right-bottom).
1

2.1 DHT22
Figure 2: temperature and humidity sensor (DHT22)
AM2303/DHT22 is digital-output temperature humidity sensor. It outputs calibrated digital signal, and utilizesexclusive digital-signal-collecting-technique and humidity sensing technology, assuring its reliability and stability.DHT22 will directly output temperature (Celsius), relative humidity (Percentage) and display through LCD screenwithout noise.
Technical details of DHT22:
• Supply Voltage: 3-5V
• Current: 2.5mA
• Humidity: 0-100%, 2-5% accuracy
• Temperature: -40 to 80oC, 0.5oC accuracy
To display data through LCD, LiquidCrystal and DHT libraries need to be downloaded from Arduino Libraries.Here is the test code from Arduino Tutorials, circuit is shown as Figure 3, result is shown as Figure 4:
1 # i n c l u d e <L i q u i d C r y s t a l . h> / / i n c l u d e s t h e L i q u i d C r y s t a l L i b r a r y2 # i n c l u d e <d h t . h> / / i n c l u d e s t h e D i g i t a l Humid i t y & Tempera ture L i b r a r y f o r
DHT22345 # d e f i n e d a t a P i n 226 Liqu idCrys ta l l c d ( 1 , 2 , 4 , 5 , 6 , 7 ) ; / / C r e a t e s an LCD o b j e c t . Parame ter s : ( rs
, enab le , d4 , d5 , d6 , d7 )7 dht DHT;89 void se tup ( ) {
10 l c d . begin ( 1 6 , 2 ) ; / / I n i t i a l i z e s t h e i n t e r f a c e t o t h e LCD screen , ands p e c i f i e s t h e d i m e n s i o n s ( w i d t h and h e i g h t ) o f t h e d i s p l a y
11 }1213 void loop ( ) {14 i n t readData = DHT . read22 ( dataPin ) ;15 f l o a t t = DHT . temperature ;16 f l o a t h = DHT . humidity ;17 l c d . se tCursor ( 0 , 0 ) ; / / S e t s t h e l o c a t i o n a t which s u b s e q u e n t t e x t w r i t t e n t o
t h e LCD w i l l be d i s p l a y e d18 l c d . p r i n t ( ”Temp . : ” ) ; / / P r i n t s s t r i n g ”Temp . ” on t h e LCD
2

19 l c d . p r i n t ( t ) ; / / P r i n t s t h e t e m p e r a t u r e v a l u e from t h e s e n s o r20 l c d . p r i n t ( ” C” ) ;21 l c d . se tCursor ( 0 , 1 ) ;22 l c d . p r i n t ( ”Humi . : ” ) ;23 l c d . p r i n t ( h ) ;24 l c d . p r i n t ( ” %” ) ;25 de lay ( 2 0 0 0 ) ;26 }
Figure 3: This is the circuit of DHT22 on Arduino UNO and proto-board. Pollen Neutralization System uses ArduinoMega instead.
Figure 4: This is the result of DHT22 test code.
3

2.2 DSM501A
Figure 5: dust sensor (DSM501A)
Since a pollen sensor which specifically responses to pollen and acheives accurate measurement for pollen den-sity is too expensive, we used dust sensor DSM501A instead. The dust sensor module DSM501A is a low-cost andcompact-sized particle density sensor. As Figure 5, DSM501 consists of : Light Emitting Diode (LED) Lamp; De-tector; Signal amplifier circuit; Output drive circuit 1; Output drive circuit 2; Heater (Resistor). The sensor displays amaximally high signal when no dust particles are present in the sampling volume of its optics, and a low signal whendust is present. The measure of dust concentration is based on the ratio of low signal time to overall sampling time of30000 milliseconds.
Technical details of DSM501A:
• Supply Voltage: 4.5-5.5V
• Current: 2.5mA
• Detectable Particle Size: 1µm(munimum)
Here is the test code from seeed WIKI:
1 # inc lude<s t r i n g . h>23 i n t pin = 8 ; / / DSM501A i n p u t D84 unsigned long durat ion ;5 unsigned long s t a r t t i m e ;6 unsigned long endtime ;7 unsigned long sampletime ms = 30000 ; / / o v e r a l l s a m p l i n g t i m e ( m i l l i s e c o n d )8 unsigned long lowpulseoccupancy = 0 ;9 f l o a t r a t i o = 0 ; / / r a t i o o f low s i g n a l t i m e t o o v e r a l l sa m p l i n g t i m e o f 30000
m i l l i s e c o n d s10 f l o a t c o n c e n t r a t i o n = 0 ;1112 i n t i =0;13 void se tup ( )14 {15 S e r i a l . begin ( 9 6 0 0 ) ;16 pinMode ( 8 , INPUT ) ;17 s t a r t t i m e = m i l l i s ( ) ;18 }19 void loop ( )20 {21
4

22 durat ion = p u l s e I n ( pin , LOW) ; / / o b t a i n d u r a t i o n t i m e o f one low s i g n a l fromp i n ( mic rosecond )
23 lowpulseoccupancy += durat ion ;24 endtime = m i l l i s ( ) ;25 i f ( ( endtime−s t a r t t i m e ) > sampletime ms )26 {27 S e r i a l . p r i n t ( ” d u r a t i o n : ” ) ;28 S e r i a l . p r i n t ( durat ion ) ;29 S e r i a l . p r i n t ( ”\n ” ) ;30 r a t i o = lowpulseoccupancy / ( sampletime ms ∗1 0 . 0 ) ; / / p e r c e n t a g e 0˜100% (
o n l y o u t p u t i n t e g e r−b i t s i n P o l l e n N e u t r a l i z a t i o n Sys tem )31 c o n c e n t r a t i o n = 1 . 1∗pow ( r a t i o , 3 ) −3.8∗pow ( r a t i o , 2 ) +520∗ r a t i o + 0 . 6 2 ; / / u s i n g
spec s h e e t c u r v e32 S e r i a l . p r i n t ( ” l o w p u l s e o c c u p a n c y : ” ) ;33 S e r i a l . p r i n t ( lowpulseoccupancy ) ;34 S e r i a l . p r i n t ( ”\n ” ) ;35 S e r i a l . p r i n t ( ” r a t i o : ” ) ;36 S e r i a l . p r i n t ( r a t i o ) ;37 S e r i a l . p r i n t ( ”\n ” ) ;38 S e r i a l . p r i n t ( ”DSM501A : ” ) ;39 S e r i a l . p r i n t l n ( c o n c e n t r a t i o n ) ;40 S e r i a l . p r i n t ( ” ;\ n\n ” ) ;4142 lowpulseoccupancy = 0 ;43 s t a r t t i m e = m i l l i s ( ) ;44 }4546 }
Figure 6: This is the result of DSM501A test code in Arduino UNO Serial Monitor without LCD screen. PollenNeutralization System uses Arduino Mega with shielded LCD screen instead.
5

3 Software
3.1 Trend Prediction
Take temperature prediction for example. Select 6 consecutive values of temperature and compute the differencebetween each consecutive two. We obtain 5 gaps which would be‘increase (↑)’, ‘decrease (↓)’ or ‘stable (=)’. Weconsider the mode of the 5 gaps as the trend prediction. Two examples are given as Table 1.
1 2 3 4 5 Trend↑ ↑ ↑ ↓ ↓ increase
1 2 3 4 5 Trend= = = ↓ = stable
Table 1: examples of trend prediction
3.2 Fuzzy Control
Pollen Neutralization System integrates fuzzy control strategy for temperature control. Fuzzy control is a controlsystem based on fuzzy logic mathematical system that analyzes analog input values in terms of logical variables thattake on continuous values between 0 and 1.
[4]The expectation was to eliminate overshooting of temperature control.
Future experiments could be done to testify actual control effect.Fuzzy Logic Toolbox in matlab was utilized to implement fuzzy control. Fuzzy control steps are as the following:
• Document the system’s operational specifications and inputs and outputs.
NL: Negative Large;
NM: Negative Medium;
NS: Negative Small;
Z: Zero;
PS: Positive Small;
PM: Positive Medium;
PL: Positive Large;
Inputs: e is the error between current Temperature and desired Temperature,
error = currentTemperature− desiredTemperature
ec is error rate,
errorRate = errort − errort−1
Output: u is the control result, whose domain of discourse is [-3 -2 -1 0 1 2 3], which means [COOL LARGE,COOL MED, COOL SMALL, OFF, HEAT SMALL, HEAT MED, HEAT LARGE].
• Determine Membership functions, including Me, Mec, Mu, shown as Figure 7.
Me: Membership Function of error;
Mec: Membership Function of error rate;
Mu: Membership Function of output;
6

Figure 7: Membership Functions
• Document the rule set, shown as Figure 8.
UC is the rule table for inputs, for example, if e is Positive Large and ec is Positive, then UC is Positive Largewhich needs cooler on.
Figure 8: UC: the rule table for inputs
• Determine the defuzzification method.R =Me×Mec×Mu
We obtain fuzzy vectorU
′= e
′× ec
′◦R
e′
and ec′
is the fuzzy vector of e and ec. For example, e = -15, ec = -10, then e′
= [1 0 0 0 0 0 0], ec′
= [1 0 0 00].
7

Finally, we use weighted mean method as defuzzification method. For example, U′=[ 0 0 0 0.3 0.3 0.5 1], domain
of discourse of U is [-3 -2 -1 0 1 2 3]. We obtain u=U′U/sum(U
′)=2, which means COOL MED.
And we obtain output table for temperature, shown as Figure 9:
Figure 9: Fuzzy control strategy for temperature.
4 ExperimentWe suppose that proper temperature, humidity will help alleviate pollen allergy, and pollen allergy simply depends
on airborne pollen concentration. Therefore, the experiment is based on two hypothesis. First, the presence of hightemperatures tends to result in increased airborne pollen concentrations. Second, the coincidence of periods of highrelative humidity result in lowered airborne pollen concentrations.
4.1 Barnes Experiment
Barnes designed his experiment[5]
to testify weather precipitation, wind speed, temperature and relative humidityinfluence airborne pollen concentrations, as the following:
“During the ragweed (RW) season for the years 1997 and 1998, 10 minute pollen collections were taken at leastevery 4 hours using an Allergenco MK-3 spore trap. Slides were fixed, and counted microscopically at 400X. Duringthis same period, weather parameters were monitored by an Automated Weather Systems recording station locatedwithin a few meters of the collector. The ragweed season for this region begins in mid August and ends by mid October.Temperature patterns for the period demonstrated usual daily fluctuations with highs 13 to 35 C and lows 8 to 24 C.Relative humidity readings for the period varied between 25 and 100%. Highest RW values were seen after seasonalcooling in September. Daily rainfall for the period varied between 0 and 100 mm.All samples from the collector were examined microscopically. And meteorological data was monitored within 20meters of the collection site using a station obtained from Automated Weather Source (Gaithersburg, MD, USA).”
Barnes concluded that under normal weather conditions, temperature and relative humidity have minimal effectson pollen density; however, unstable atmospheric conditions such as the passing of a cold front has the greatest impactof all the weather-related events on airborne pollen density. Also, airborne ragweed pollen counts are generally lowestat 6:00 AM right around dawn and highest around noon after pollen grains dry out and become airborne.
4.2 Self-Designed Experiment
• Use incense to produce smoke, as Figure 10.
Firstly, we would like to make dust ratio above normal state and record data of temperature, humidity anddust ratio. As shown in Figure 11, after incense was ignited, dust ratio increased. To visualize data, we could
8
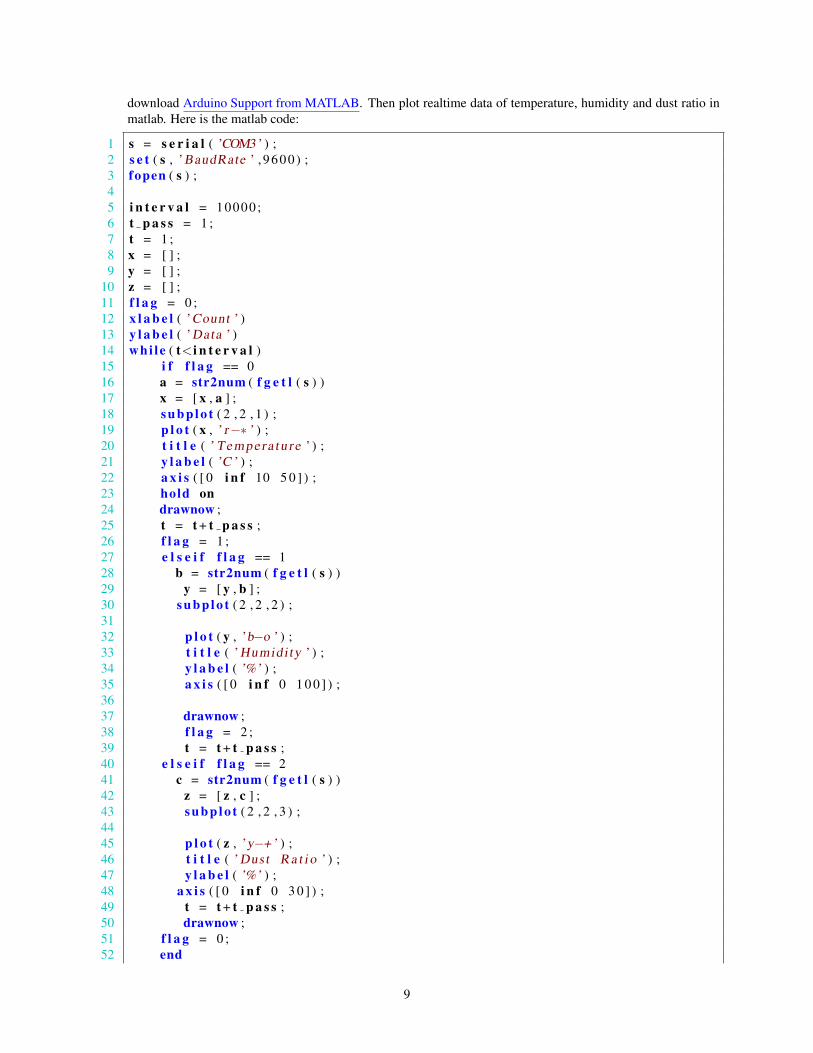
download Arduino Support from MATLAB. Then plot realtime data of temperature, humidity and dust ratio inmatlab. Here is the matlab code:
1 s = s e r i a l ( ’COM3’ ) ;2 s e t ( s , ’ BaudRate ’ , 9 6 0 0 ) ;3 fopen ( s ) ;45 i n t e r v a l = 10000 ;6 t p a s s = 1 ;7 t = 1 ;8 x = [ ] ;9 y = [ ] ;
10 z = [ ] ;11 f l a g = 0 ;12 x l a b e l ( ’ Count ’ )13 y l a b e l ( ’ Data ’ )14 whi le ( t<i n t e r v a l )15 i f f l a g == 016 a = str2num ( f g e t l ( s ) )17 x = [ x , a ] ;18 s u b p l o t ( 2 , 2 , 1 ) ;19 p l o t ( x , ’ r−∗ ’ ) ;20 t i t l e ( ’ Tempera tu r e ’ ) ;21 y l a b e l ( ’C ’ ) ;22 a x i s ( [ 0 i n f 10 5 0 ] ) ;23 hold on24 drawnow ;25 t = t + t p a s s ;26 f l a g = 1 ;27 e l s e i f f l a g == 128 b = str2num ( f g e t l ( s ) )29 y = [ y , b ] ;30 s u b p l o t ( 2 , 2 , 2 ) ;3132 p l o t ( y , ’b−o ’ ) ;33 t i t l e ( ’ Humidi ty ’ ) ;34 y l a b e l ( ’%’ ) ;35 a x i s ( [ 0 i n f 0 1 0 0 ] ) ;3637 drawnow ;38 f l a g = 2 ;39 t = t + t p a s s ;40 e l s e i f f l a g == 241 c = str2num ( f g e t l ( s ) )42 z = [ z , c ] ;43 s u b p l o t ( 2 , 2 , 3 ) ;4445 p l o t ( z , ’y−+ ’ ) ;46 t i t l e ( ’ Dust R a t i o ’ ) ;47 y l a b e l ( ’%’ ) ;48 a x i s ( [ 0 i n f 0 3 0 ] ) ;49 t = t + t p a s s ;50 drawnow ;51 f l a g = 0 ;52 end
9

53 end54 f c l o s e ( s ) ;55 }
Figure 10: To increase dust ratio, incense was used to produce smoke.Compared with other kinds of smoke, like rope and cigarette, incense has no pollution and smells good.
Figure 11: Output real time data of temperature, humidity and dust ratio in matlab.
• Use a 100W incandescent bulb to increase temperature. The result is shown as Figure 13.
10

Figure 12: One incandescent bulb (120v 100W) with extension cord was controlled by 5v relay.The bulb was used as a heater to increase temperature.
Figure 13: This is the result when temperature increased. One-degree polynomial of dust ratio (right-bottom curve)was given to observe the trend of dust ratio. The bulb was not able to only control temperature. It increased
temperature, and decreased humidity simultaneously. But this does not influence experiment result. The slope wasapproximately zero.
• Use tissue with water and a 5v mini fan to increase humidity. The result is shown as Figure 15.
11
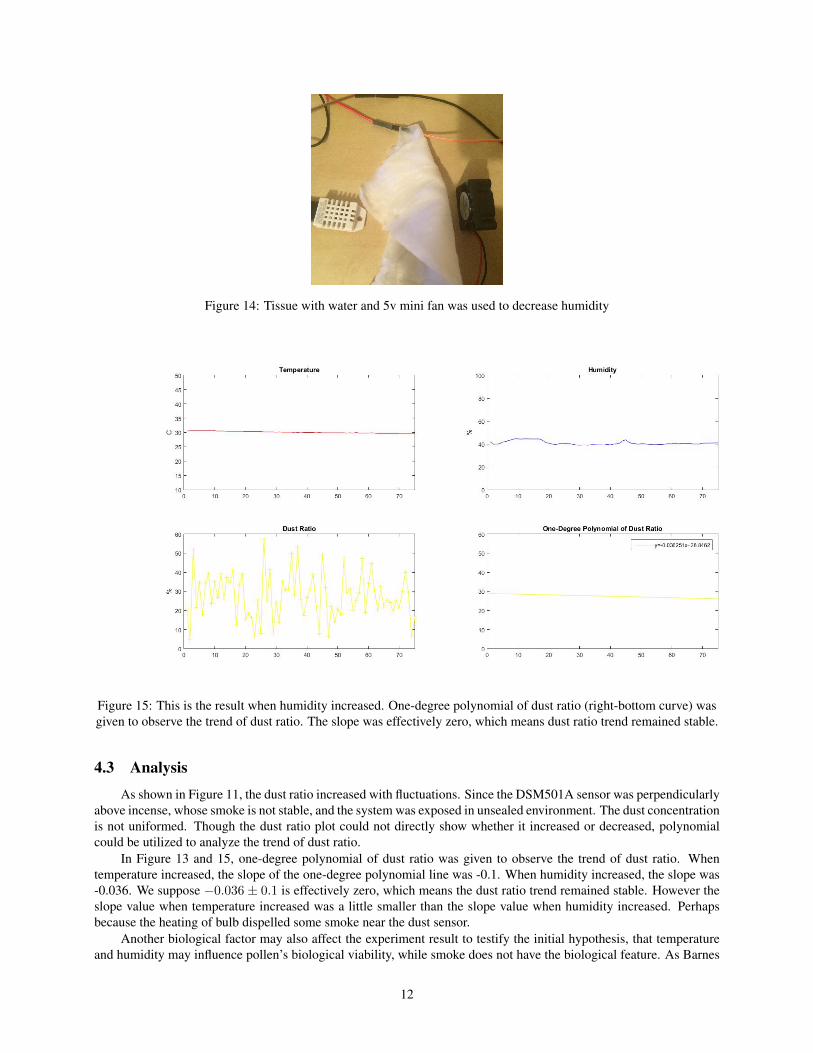
Figure 14: Tissue with water and 5v mini fan was used to decrease humidity
Figure 15: This is the result when humidity increased. One-degree polynomial of dust ratio (right-bottom curve) wasgiven to observe the trend of dust ratio. The slope was effectively zero, which means dust ratio trend remained stable.
4.3 Analysis
As shown in Figure 11, the dust ratio increased with fluctuations. Since the DSM501A sensor was perpendicularlyabove incense, whose smoke is not stable, and the system was exposed in unsealed environment. The dust concentrationis not uniformed. Though the dust ratio plot could not directly show whether it increased or decreased, polynomialcould be utilized to analyze the trend of dust ratio.
In Figure 13 and 15, one-degree polynomial of dust ratio was given to observe the trend of dust ratio. Whentemperature increased, the slope of the one-degree polynomial line was -0.1. When humidity increased, the slope was-0.036. We suppose −0.036 ± 0.1 is effectively zero, which means the dust ratio trend remained stable. However theslope value when temperature increased was a little smaller than the slope value when humidity increased. Perhapsbecause the heating of bulb dispelled some smoke near the dust sensor.
Another biological factor may also affect the experiment result to testify the initial hypothesis, that temperatureand humidity may influence pollen’s biological viability, while smoke does not have the biological feature. As Barnes
12
mentioned, numerous investigators (Solomon and Mathews, 1990[6]
; Bianchi et al., 1959[7]
; Ogden et al., 1969[8]
)observed that ragweed pollen is expelled from the flower about sunrise (around 6:00 AM) and becomes airborne as thepollen dries out and the ambient wind distributes the grains. This is why pollen density usually gets lowest around dawnand reaches highest during the noon. Temperature and humidity may influence dry-out progress for pollen. However,smoke of incense does not share this feature.
5 ConclusionPollen Neutralization System displays real-time values of dust sensor (DSM501A), temperature and humidity
sensor (DHT22) on LCD screen, and predicts the trends of temperature and humidity. Fuzzy control strategy wasused for temperature control. Humidity and pollen density control could be developed in the future. Relay portswere reserved to control Heating Ventilation and Air Conditioning (HVAC), Humidifier, and High Efficiency ParticleArrestance Filter (HEPA). Furthermore, the scientific experiment shows that temperature and humidity have minimaleffect on pollen density. And the self-designed experiment indicates that temperature and humidity do not influencedust ratio.
13

6 Appendix
6.1 DHT22 Datasheet
6.2 DSM501A Datasheet
14

References[1] Summary Health Statistics for U.S. Adults: National Health Interview Survey, 2010. By Jeannine S. Schiller,
M.P.H., Jacqueline W. Lucas, M.P.H., Brian W. Ward, PhD and Jennifer A. Peregory, M.P.H., Division of HealthInterview Statistics.
[2] ”Environmental Allergies: Symptoms”. NIAID. April 22, 2015. Retrieved 19 June 2015.
[3] Wheatley, LM; Togias, A (29 January 2015). ”Clinical practice. Allergic rhinitis.”. The New England Journal ofMedicine. 372 (5): 45663.
[4] Introduction to Fuzzy Control
[5] The effect of temperature, relative humidity and rainfall on airborne ragweed pollen concentrations. Aerobiologia,2001, Volume 17, Number 1, Page 61 Charles Barnes, Freddy Pacheco, Julie Landuyt, Frank Hu, Jay Portnoy
[6] Solomon W. and Mathews K.: 1990, Aerobiology and inhalant aller- gens. In: Middelton Reed, Ellis Adkinsonand Yunginger (eds), Allergy Principles and Practice, Volume 1 Third edition. Mosby, St Louis, pp. 312372.
[7] Bianchi D., Schwemmin D. and Wagner W.: 1959, Pollen release in common Ragweed (Ambrosia Artimesifolia).Botanical Gazzet 4, 253.
[8] Ogden E. and Raynor G.: 1960, Field evaluation of ragweed pollen samplers. Journal of Allergy 31, 307316.
15