composite materials handbook mil-hdbk-17-4a volume 4
TRANSCRIPT

MIL-HDBK-17-4A Volume 4 of 5 17 JUNE 2002 Superseding MIL-HDBK-17-4 21 September 1999
DEPARTMENT OF DEFENSE HANDBOOK
COMPOSITE MATERIALS HANDBOOK
VOLUME 4. METAL MATRIX COMPOSITES
This handbook is for guidance only. Do not cite this document as a requirement. AMSC N/A AREA CMPS DISTRIBUTION STATEMENT A. Approved for public release; distribution is unlimited.
NOT MEASUREMENT SENSITIVE

MIL-HDBK-17-4A Volume 4, Foreword
ii
FOREWORD 1. This Composite Materials Handbook Series, MIL-HDBK-17, are approved for use by all Departments
and Agencies of the Department of Defense. 2. This handbook is for guidance only. This handbook cannot be cited as a requirement. If it is, the con-
tractor does not have to comply. This mandate is a DoD requirement only; it is not applicable to the Federal Aviation Administration (FAA) or other government agencies.
3. Every effort has been made to reflect the latest information on polymer (organic), metal, and ceramic
composites. The handbook is continually reviewed and revised to ensure its completeness and cur-rentness. Documentation for the secretariat should be directed to: Materials Sciences Corporation, MIL-HDBK-17 Secretariat, 500 Office Center Drive, Suite 250, Fort Washington, PA 19034.
4. MIL-HDBK-17 provides guidelines and material properties for polymer (organic), metal, and ceramic
matrix composite materials. The first three volumes of this handbook currently focus on, but are not limited to, polymeric composites intended for aircraft and aerospace vehicles. Metal matrix compos-ites (MMC) and ceramic matrix composites (CMC), including carbon-carbon composites (C-C), are covered in Volume 4 and Volume 5 , respectively.
5. This standardization handbook has been developed and is being maintained as a joint effort of the
Department of Defense and the Federal Aviation Administration. 6. The information contained in this handbook was obtained from materials producers, industry, reports
on Government sponsored research, the open literature, and by contact with research laboratories and those who participate in the MIL-HDBK-17 coordination activity.
7. All information and data contained in this handbook have been coordinated with industry and the U.S.
Army, Navy, Air Force, NASA, and Federal Aviation Administration prior to publication. 8. Copies of this document and revisions thereto may be obtained from the Document Automation and
Production Service (DAPS), Bldg. 4D, (DODSSP/ASSIST), 700 Robbins Avenue, Philadelphia, PA 19111-5094.
9. Beneficial comments (recommendations, additions, deletions) and any pertinent data which may be of
use in improving this document should be addressed to: U.S. Army Research Laboratory, Weapons and Materials Research Directorate, ATTN: AMSRL-WM-MA, Aberdeen Proving Ground, MD 21005-5069, by using the Standardization Document Improvement Proposal (DD Form 1426) appearing at the end of this document or by letter.

MIL-HDBK-17-4A Volume 4, Table of Contents PARAGRAPH PAGE
iii
FOREWORD ................................................................................................................................................. ii
SUMMARY OF CHANGES...........................................................................................................................xi
1. GUIDELINES.......................................................................................................................................... 1
1.1 GENERAL INFORMATION.............................................................................................................. 1 1.1.1 INTRODUCTION ................................................................................................................ 1 1.1.2 PURPOSE .......................................................................................................................... 1 1.1.3 SCOPE ............................................................................................................................... 1
1.1.3.1 Section 1: Guidelines............................................................................................... 2 1.1.3.2 Section 2: Utilization of data .................................................................................... 3 1.1.3.3 Section 3: Material property data............................................................................. 3
1.1.4 USE OF THE DOCUMENT AND LIMITATIONS................................................................. 3 1.1.4.1 Source of information ............................................................................................... 3 1.1.4.2 Use of data and guidelines in applications ............................................................... 3 1.1.4.3 Strength properties and allowables terminology....................................................... 4 1.1.4.4 Use of References.................................................................................................... 4 1.1.4.5 Use of tradenames and product names ................................................................... 4 1.1.4.6 Toxicity, health hazards, and safety.......................................................................... 4 1.1.4.7 Ozone depleting chemicals ...................................................................................... 4
1.1.5 APPROVAL PROCEDURES............................................................................................... 5 1.1.6 SYMBOLS, ABBREVIATIONS, AND SYSTEMS OF UNITS............................................... 5
1.1.6.1 Symbols and abbreviations ...................................................................................... 5 1.1.6.1.1 Constituent properties ...........................................................................11 1.1.6.1.2 Laminae and laminates.........................................................................11 1.1.6.1.3 Subscripts ............................................................................................ 12 1.1.6.1.4 Superscripts ......................................................................................... 13 1.1.6.1.5 Acronyms ............................................................................................. 13
1.1.6.2 Material system codes............................................................................................ 15 1.1.6.3 System of units ....................................................................................................... 15
1.1.7 DEFINITIONS ................................................................................................................... 17 REFERENCES .............................................................................................................................. 31
1.2 INTRODUCTION TO MMC MATERIALS ...................................................................................... 32 1.2.1 INTRODUCTION .............................................................................................................. 32 1.2.2 MMC SYSTEMS ............................................................................................................... 32
1.2.2.1 Systems definitions................................................................................................. 32 1.2.2.2 Distinction from other materials/composites .......................................................... 32
1.2.3 MATRIX MATERIALS ....................................................................................................... 32 1.2.3.1 Role of matrix materials.......................................................................................... 33 1.2.3.2 Forms of matrix materials....................................................................................... 33 1.2.3.3 Types of matrix materials ....................................................................................... 34
1.2.3.3.1 Aluminum ............................................................................................. 34 1.2.3.3.2 Copper ................................................................................................. 36 1.2.3.3.3 Iron ....................................................................................................... 36 1.2.3.3.4 Magnesium........................................................................................... 36 1.2.3.3.5 Nickel ................................................................................................... 36 1.2.3.3.6 Titanium................................................................................................ 36
1.2.4 REINFORCEMENT MATERIALS ..................................................................................... 36 1.2.4.1 Types of reinforcement........................................................................................... 37 1.2.4.2 Role of reinforcement ............................................................................................. 37
1.2.5 REINFORCEMENT COATINGS....................................................................................... 37 1.2.5.1 Role of coatings...................................................................................................... 37 1.2.5.2 Types of coatings.................................................................................................... 37

MIL-HDBK-17-4A Volume 4, Table of Contents PARAGRAPH PAGE
iv
1.2.6 MANUFACTURING PROCESSES ................................................................................... 38 1.2.6.1 Overview and General Information......................................................................... 38 1.2.6.2 Assembly and consolidation ................................................................................... 38
1.2.6.2.1 Powder blending and consolidation...................................................... 38 1.2.6.2.2 Consolidation diffusion bonding ........................................................... 38 1.2.6.2.3 Vapor deposition................................................................................... 38 1.2.6.2.4 Squeeze casting and squeeze infiltration............................................. 39 1.2.6.2.5 Spray deposition................................................................................... 39 1.2.6.2.6 Slurry casting (compocasting).............................................................. 39 1.2.6.2.7 Reactive processing (in-situ composites) ............................................ 39
1.2.6.3 Thermomechanical processing .............................................................................. 39 1.2.6.4 Near net shape manufacturing processes ............................................................. 40
1.2.7 PRODUCT FORMS .......................................................................................................... 40 1.2.7.1 Intermediate............................................................................................................ 40 1.2.7.2 Standard ................................................................................................................. 40 1.2.7.3 Selectively reinforced components......................................................................... 40
1.2.8 SECONDARY MANUFACTURING PROCESSES ........................................................... 40 1.2.8.1 Overview and general information.......................................................................... 40 1.2.8.2 Forming .................................................................................................................. 40 1.2.8.3 Machining ............................................................................................................... 40 1.2.8.4 Joining .................................................................................................................... 40
1.2.8.4.1 Qualitative assessment for MMC joining methods............................... 40 1.2.8.4.2 Potential issues in joining MMCs ......................................................... 41 1.2.8.4.3 Classification and discussion of selected joining methods .................. 43
1.2.8.5 Thermal treatment ................................................................................................. 47 1.2.8.6 Coatings and surface treatments ........................................................................... 47
1.2.9 QUALITY ASSURANCE ................................................................................................... 48 1.2.9.1 Constituents............................................................................................................ 48 1.2.9.2 Preform................................................................................................................... 48 1.2.9.3 Final product........................................................................................................... 48 1.2.9.4 Statistical process control ....................................................................................... 48
1.2.10 REPAIR............................................................................................................................. 48 1.2.10.1 In-process ............................................................................................................ 48 1.2.10.2 In-service ............................................................................................................. 48
REFERENCES .............................................................................................................................. 49
1.3 TEST PLANS FOR MATERIALS CHARACTERIZATION.............................................................. 51 1.3.1 INTRODUCTION .............................................................................................................. 51
1.3.1.1 Objective................................................................................................................. 51 1.3.1.2 Classes of data....................................................................................................... 51
1.3.2 REQUIREMENTS............................................................................................................. 51 1.3.2.1 Test method selection............................................................................................. 51 1.3.2.2 Test conditions selection ........................................................................................ 52 1.3.2.3 Specimen number and sampling............................................................................ 52 1.3.2.4 Specimen preparation............................................................................................. 53 1.3.2.5 Data documentation Requirements Checklist ........................................................ 58
1.3.3 MATERIALS PEDIGREE .................................................................................................. 63 1.3.3.1 Reinforcement ........................................................................................................ 63 1.3.3.2 Reinforcement sizing.............................................................................................. 63 1.3.3.3 Reinforcement coatings.......................................................................................... 63 1.3.3.4 Matrix...................................................................................................................... 63 1.3.3.5 Intermediate forms characterization ....................................................................... 63
1.3.3.5.1 Metallized fibers ................................................................................... 63 1.3.3.5.2 Monotapes ........................................................................................... 63 1.3.3.5.3 Lamina other than monotapes ............................................................. 63

MIL-HDBK-17-4A Volume 4, Table of Contents PARAGRAPH PAGE
v
1.3.3.5.4 Specialized forms ................................................................................. 63 1.3.3.6 Composite materials............................................................................................... 63
1.3.4 CONTINUOUS FIBER REINFORCED MMC CONSTITUENT MATERIAL PROPERTIES................................................................................................................... 64
1.3.4.1 Screening ............................................................................................................... 64 1.3.4.2 Acceptance testing of composite materials ............................................................ 64
1.3.4.2.1 Composite static properties tests ......................................................... 64 1.3.4.2.2 Composite fatigue properties tests ...................................................... 65 1.3.4.2.3 Composite thermal mechanical tests ................................................... 65 1.3.4.2.4 Composite physical properties tests .................................................... 66
1.3.4.3 Intermediate forms characterization ....................................................................... 66 1.3.4.3.1 Metallized fibers ................................................................................... 66 1.3.4.3.2 Monotapes ........................................................................................... 66 1.3.4.3.3 Lamina other than monotapes ............................................................. 66 1.3.4.3.4 Specialized forms ................................................................................. 66
1.3.4.4 Constituent characterization ................................................................................... 66 1.3.4.4.1 Fiber properties tests ........................................................................... 67 1.3.4.4.2 Matrix ................................................................................................... 67
1.3.5 DISCONTINUOUS REINFORCED MMC & CONSTITUENT MATERIAL PROPERTIES................................................................................................................... 68
1.3.5.1 Screening ............................................................................................................... 68 1.3.5.2 Acceptance testing of composite materials ............................................................ 68
1.3.5.2.1 Composite static properties tests ......................................................... 68 1.3.5.2.2 Composite fatigue properties tests ...................................................... 68 1.3.5.2.3 Composite thermal mechanical tests ................................................... 68 1.3.5.2.4 Composite physical properties tests .................................................... 68
REFERENCES .............................................................................................................................. 69
1.4 COMPOSITE TESTING AND ANALYTICAL METHODS............................................................... 70 1.4.1 INTRODUCTION .............................................................................................................. 70 1.4.2 CONTINUOUS FIBER REINFORCED MMC MECHANICAL PROPERTY
TEST METHODS.............................................................................................................. 70 1.4.2.1 Tension ................................................................................................................... 70 1.4.2.2 Compression .......................................................................................................... 70 1.4.2.3 Shear (in-plane)...................................................................................................... 71 1.4.2.4 Fatigue.................................................................................................................... 71
1.4.2.4.1 Scope ................................................................................................... 71 1.4.2.4.2 Specimen design.................................................................................. 71 1.4.2.4.3 Waveforms........................................................................................... 71 1.4.2.4.4 Control mode........................................................................................ 71 1.4.2.4.5 Compressive loading............................................................................ 72 1.4.2.4.6 Failure .................................................................................................. 72 1.4.2.4.7 Data reporting ...................................................................................... 72
1.4.2.5 Fatigue crack growth rate....................................................................................... 72 1.4.2.6 Creep/stress rupture............................................................................................... 77 1.4.2.7 Pin bearing tension................................................................................................. 77 1.4.2.8 Pin bearing compression........................................................................................ 77 1.4.2.9 Filled hole tension................................................................................................... 77 1.4.2.10 Open hole tension/notch sensitivity ..................................................................... 77 1.4.2.11 Flexure (three-point bend) ................................................................................... 77 1.4.2.12 Filled hole compression ....................................................................................... 77 1.4.2.13 Fiber pushout tests .............................................................................................. 77
1.4.2.13.1 Background .......................................................................................... 77 1.4.2.13.2 General................................................................................................. 78 1.4.2.13.3 Description of the method .................................................................... 79

MIL-HDBK-17-4A Volume 4, Table of Contents PARAGRAPH PAGE
vi
1.4.2.13.4 Significance and use ............................................................................ 79 1.4.2.13.5 Apparatus ............................................................................................. 79 1.4.2.13.6 Indenter ................................................................................................ 80 1.4.2.13.7 Support plate ........................................................................................ 82 1.4.2.13.8 Acoustic emission sensor..................................................................... 82 1.4.2.13.9 Displacement sensor............................................................................ 82 1.4.2.13.10 Remote viewing using a microscope/camera ...................................... 83 1.4.2.13.11 Test specimen preparation ................................................................... 83 1.4.2.13.12 Test procedure ..................................................................................... 85 1.4.2.13.13 Effects of environment ......................................................................... 85 1.4.2.13.14 Analysis of results ................................................................................ 86
1.4.2.14 Microhardness ..................................................................................................... 89 1.4.2.15 Thermomechanical fatigue (TMF) (in-phase/out-of-phase)................................. 89
1.4.2.15.1 Scope ................................................................................................... 89 1.4.2.15.2 Specimen design.................................................................................. 89 1.4.2.15.3 Temperature control and measurement ............................................... 89 1.4.2.15.4 Waveforms........................................................................................... 90 1.4.2.15.5 Phasing ................................................................................................ 90 1.4.2.15.6 Pre-test measurements........................................................................ 91 1.4.2.15.7 Starting the test .................................................................................... 92 1.4.2.15.8 Data reporting....................................................................................... 92
1.4.2.16 Residual strength and stiffness............................................................................ 93 1.4.2.17 Bearing fatigue..................................................................................................... 93 1.4.2.18 Open hole fatigue................................................................................................. 93 1.4.2.19 Filled hole fatigue................................................................................................. 93 1.4.2.20 Corrosion fatigue.................................................................................................. 93 1.4.2.21 Stress corrosion cracking..................................................................................... 93 1.4.2.22 Wear .................................................................................................................... 93 1.4.2.23 Impact .................................................................................................................. 93 1.4.2.24 Damping............................................................................................................... 93
1.4.3 DISCONTINUOUS REINFORCED MMC MECHANICAL PROPERTY TEST METHODS.............................................................................................................. 93
1.4.3.1 Tension ................................................................................................................... 93 1.4.3.2 Compression .......................................................................................................... 94 1.4.3.3 Shear (in-plane)...................................................................................................... 94 1.4.3.4 Fracture toughness ................................................................................................ 94 1.4.3.5 Fatigue.................................................................................................................... 94 1.4.3.6 Fatigue crack growth .............................................................................................. 94 1.4.3.7 Creep/stress rupture............................................................................................... 94 1.4.3.8 Corrosion fatigue .................................................................................................... 94 1.4.3.9 Stress corrosion cracking ....................................................................................... 94 1.4.3.10 Wear .................................................................................................................... 94 1.4.3.11 Impact .................................................................................................................. 94 1.4.3.12 Damping............................................................................................................... 94
1.4.4 PHYSICAL PROPERTY TEST METHODS ...................................................................... 94 1.4.4.1 Density.................................................................................................................... 94 1.4.4.2 Fiber volume fraction.............................................................................................. 94
1.4.5 MICROSTRUCTURAL ANALYSIS TECHNIQUES ........................................................... 95 1.4.5.1 Titanium matrix composites.................................................................................... 95
1.4.6 CHEMICAL ANALYSIS TECHNIQUES............................................................................. 97 1.4.6.1 Analysis of carbon and sulfur ................................................................................. 97 1.4.6.2 Analysis for oxygen and nitrogen by inert gas fusion ............................................. 98
1.4.7 NON-DESTRUCTIVE EVALUATION TEST METHODS................................................... 98 1.4.8 ENVIRONMENTAL EFFECTS TEST METHODS............................................................. 99 1.4.9 INTERPHASES AND INTERFACES TEST METHODS ................................................... 99

MIL-HDBK-17-4A Volume 4, Table of Contents PARAGRAPH PAGE
vii
REFERENCES ............................................................................................................................ 100
1.5 INTERMEDIATE FORMS TESTING AND ANALYTICAL METHODS.......................................... 105 1.5.1 INTRODUCTION ............................................................................................................ 105 1.5.2 MECHANICAL PROPERTY TEST METHODS............................................................... 105 1.5.3 PHYSICAL PROPERTY TEST METHODS .................................................................... 105 1.5.4 MICROSTRUCTURAL ANALYSIS TECHNIQUES ......................................................... 105 1.5.5 CHEMICAL ANALYSIS TECHNIQUES........................................................................... 105 1.5.6 NON-DESTRUCTIVE EVALUATION TEST METHODS................................................. 105
1.6 FIBER TESTING AND ANALYTICAL METHODS........................................................................ 106 1.6.1 INTRODUCTION ............................................................................................................ 106 1.6.2 MECHANICAL PROPERTY TEST METHODS............................................................... 106
1.6.2.1 Tensile tests.......................................................................................................... 106 1.6.2.2 Creep and creep rupture ...................................................................................... 106 1.6.2.3 Bend stress relaxation.......................................................................................... 107
1.6.3 PHYSICAL PROPERTY TEST METHODS .................................................................... 107 1.6.3.1 Density.................................................................................................................. 107
1.6.4 MICROSTRUCTURAL ANALYSIS TECHNIQUES ......................................................... 107 1.6.5 CHEMICAL ANALYSIS TECHNIQUES........................................................................... 107 1.6.6 ENVIRONMENTAL EFFECTS TEST METHODS........................................................... 107 REFERENCES ............................................................................................................................ 108
1.7 FIBER SIZING TESTING AND ANALYTICAL METHODS........................................................... 109 1.7.1 INTRODUCTION ............................................................................................................ 109 1.7.2 PHYSICAL PROPERTY TEST METHODS .................................................................... 109 1.7.3 CHEMICAL ANALYSIS TECHNIQUES........................................................................... 109
1.8 FIBER COATINGS, INTERFACES AND INTERPHASES TESTING AND ANALYTICAL METHODS...................................................................................................................................110
1.8.1 INTRODUCTION .............................................................................................................110 1.8.2 MECHANICAL PROPERTY TEST METHODS................................................................110 1.8.3 PHYSICAL PROPERTY TEST METHODS .....................................................................110 1.8.4 MICROSTRUCTURAL ANALYSIS TECHNIQUES ..........................................................110 1.8.5 CHEMICAL ANALYSIS TECHNIQUES............................................................................110
1.9 MATRIX TESTING AND ANALYTICAL METHODS ...................................................................... 111 1.9.1 INTRODUCTION ............................................................................................................. 111 1.9.2 MECHANICAL TEST METHODS .................................................................................... 111
1.9.2.1 Tension .................................................................................................................. 111 1.9.2.2 Creep..................................................................................................................... 111 1.9.2.3 Stress relaxation.................................................................................................... 111 1.9.2.4 Fatigue...................................................................................................................112
1.9.3 PHYSICAL TEST METHOD.............................................................................................112 1.9.3.1 Density...................................................................................................................112
1.9.4 MICROSTRUCTURAL ANALYSIS TECHNIQUES ..........................................................112 1.9.4.1 Microstructural analysis techniques titanium .........................................................112 1.9.4.2 Microstructural analysis techniques aluminum......................................................112
1.9.5 CHEMICAL ANALYSIS TECHNIQUES............................................................................112 1.9.6 ENVIRONMENTAL EFFECTS TEST METHODS............................................................112 REFERENCES .............................................................................................................................113
1.10 STRUCTURE SENSITIVE PROPERTIES CHARACTERIZATION ..............................................114 1.10.1 INTRODUCTION .............................................................................................................114 1.10.2 MECHANICALLY-FASTENED JOINTS............................................................................114 1.10.3 BONDED, BRAZED, AND WELDED JOINTS .................................................................114 1.10.4 CURVED SHAPES ..........................................................................................................114

MIL-HDBK-17-4A Volume 4, Table of Contents PARAGRAPH PAGE
viii
1.10.5 STRUCTURAL DESIGN DETAILS ..................................................................................114 1.10.6 TRANSITION AND OTHER SPECIAL REGIONS ...........................................................114 1.10.7 SIZE EFFECTS................................................................................................................114 1.10.8 OTHER TOPICS..............................................................................................................114
1.11 ANALYSIS OF DATA.....................................................................................................................115 1.11.1 GENERAL........................................................................................................................115 1.11.2 PROCEDURES OF CALCULATION OF STATISTICALLY-BASED
MATERIAL PROPERTIES ...............................................................................................115 1.11.3 SAMPLES OF COMPUTATIONAL PROCEDURES ........................................................115 1.11.4 STATISTICAL TABLES ....................................................................................................115
2. DESIGN GUIDELINES FOR METAL MATRIX MATERIALS ...............................................................116
2.1 GENERAL INFORMATION...........................................................................................................116 2.1.1 INTRODUCTION .............................................................................................................116 2.1.2 PURPOSE, SCOPE, AND ORGANIZATION OF SECTION 2 .........................................116
2.2 USE OF DATA...............................................................................................................................116
2.3 STRUCTURAL DESIGN AND ANALYSIS.....................................................................................116 2.3.1 Introduction ......................................................................................................................116
2.3.1.1 Analysis methodology classifications ....................................................................117 2.3.1.2 Basic concepts ......................................................................................................117
2.3.2 GENERAL DESIGN GUIDELINES ..................................................................................119 2.3.3 ANALYSIS APPROACHES (CONTINUOUS FIBER MMC) ............................................ 120
2.3.3.1 Micromechanics ................................................................................................... 120 2.3.3.1.1 General relationships ......................................................................... 120 2.3.3.1.2 Effective elastic properties ................................................................. 122 2.3.3.1.3 Residual stresses............................................................................... 126 2.3.3.1.4 Fiber-matrix bond strength................................................................. 126 2.3.3.1.5 Overall inelastic strain ........................................................................ 127
2.3.3.2 Viscoplastic constitutive relations ......................................................................... 127 2.3.3.2.1 Axial tensile response ........................................................................ 127 2.3.3.2.2 Axial compressive response .............................................................. 127 2.3.3.2.3 Transverse tensile response .............................................................. 127 2.3.3.2.4 Transverse compressive response .................................................... 127
2.3.3.3 Macromechanics .................................................................................................. 127 2.3.3.3.1 Effective elastic properties ................................................................. 127 2.3.3.3.2 Effective strength ............................................................................... 127 2.3.3.3.3 Creep ................................................................................................. 127 2.3.3.3.4 Multiaxial effects................................................................................. 127
2.3.3.4 Damage tolerance ................................................................................................ 127 2.3.3.5 Durability............................................................................................................... 127 2.3.3.6 Life prediction ....................................................................................................... 127
2.3.4 DESIGN GUIDELINES (DISCONTINUOUS FIBER REINFORCED MMC).................... 128 2.3.4.1 Micromechanics ................................................................................................... 128
2.3.4.1.1 General relationships ......................................................................... 128 2.3.4.1.2 Effective elastic properties ................................................................. 128 2.3.4.1.3 Fiber-matrix bond strength................................................................. 128 2.3.4.1.4 Inelastic mechanisms and damage.................................................... 128
2.3.4.2 Viscoplastic constitutive relations ......................................................................... 128 2.3.4.2.1 Tensile response ................................................................................ 128 2.3.4.2.2 Compressive response ...................................................................... 128 2.3.4.2.3 Shear response.................................................................................. 128
2.3.4.3 Crack growth behavior.......................................................................................... 128

MIL-HDBK-17-4A Volume 4, Table of Contents PARAGRAPH PAGE
ix
2.3.4.4 Durability............................................................................................................... 128 2.3.4.5 Life prediction ....................................................................................................... 128
2.4 APPLICATIONS AND CASE STUDIES ....................................................................................... 129 2.4.1 COMPONENTS FOR STRUCTURAL APPLICATIONS ................................................. 129 2.4.2 COMPONENTS FOR TRIBOLOGICAL APPLICATIONS ............................................... 129 2.4.3 COMPONENTS FOR THERMAL MANAGEMENT APPLICATIONS.............................. 129 2.4.4 COMPONENTS FOR THERMAL EXPANSION CONTROL........................................... 129 2.4.5 OTHER MISCELLANEOUS APPLICATIONS................................................................. 129 REFERENCES ............................................................................................................................ 130
3. MATERIALS PROPERTIES DATA ..................................................................................................... 131
3.1 GENERAL INFORMATION.......................................................................................................... 131 3.1.1 INTRODUCTION ............................................................................................................ 131 3.1.2 PURPOSE, SCOPE, AND ORGANIZATION OF SECTION........................................... 131 3.1.3 PRESENTATION OF DATA ............................................................................................ 131
3.1.3.1 Properties and definitions ..................................................................................... 131 3.1.3.1.1 Sign convention.................................................................................. 131
3.1.3.2 Table formats........................................................................................................ 131 3.1.3.3 Fatigue data.......................................................................................................... 142
REFERENCES ............................................................................................................................ 142
3.2 REINFORCEMENT PROPERTIES ............................................................................................. 143 3.2.1 INTRODUCTION ............................................................................................................ 143 3.2.2 ALUMINA FIBERS .......................................................................................................... 143
3.2.2.1 Introduction........................................................................................................... 143 3.2.2.2 Virgin Nextel TM 610 fiber ...................................................................................... 144
3.2.3 BORON FIBERS............................................................................................................. 147 3.2.4 BORON CARBIDE FIBERS............................................................................................ 147 3.2.5 CARBON AND GRAPHITE FIBERS............................................................................... 147 3.2.6 SILICON CARBIDE FIBERS........................................................................................... 147
3.2.6.1 Virgin SCS-6 Fiber* .............................................................................................. 148 3.2.7 STEEL FIBERS............................................................................................................... 150 3.2.8 TUNGSTEN FIBERS ...................................................................................................... 151 3.2.9 OTHER FIBERS ............................................................................................................. 151 3.2.10 OTHER REINFORCEMENTS ........................................................................................ 151
3.3 PROPERTIES OF MATRIX MATERIALS .................................................................................... 152 3.3.1 INTRODUCTION ............................................................................................................ 152 3.3.2 ALUMINUMS .................................................................................................................. 152 3.3.3 COPPERS ...................................................................................................................... 152 3.3.4 MAGNESIUMS ............................................................................................................... 152 3.3.5 TITANIUMS..................................................................................................................... 152
3.3.5.1 Ti-15V-3Cr-3Al-3Sn (NASA-GRC)........................................................................ 152 3.3.6 OTHERS......................................................................................................................... 165
3.4 FIBER COATING PROPERTIES................................................................................................. 166 3.4.1 INTRODUCTION ............................................................................................................ 166 3.4.2 CARBON......................................................................................................................... 166 3.4.3 TITANIUM DIBORIDE..................................................................................................... 166 3.4.4 YTTRIA ........................................................................................................................... 166 3.4.5 OTHERS......................................................................................................................... 166
3.5 ALUMINUM MATRIX COMPOSITE PROPERTIES..................................................................... 167 3.5.1 INTRODUCTION ............................................................................................................ 167 3.5.2 ALUMINA/ALUMINUM.................................................................................................... 167

MIL-HDBK-17-4A Volume 4, Table of Contents PARAGRAPH PAGE
x
3.5.2.1 Nextel 610/pure Al panel ...................................................................................... 167 3.5.3 BORON/ALUMINUM....................................................................................................... 172 3.5.4 BORON CARBIDE/ALUMINUM...................................................................................... 172 3.5.5 GRAPHITE/ALUMINUM ................................................................................................. 172 3.5.6 SILICON CARBIDE/ALUMINUM .................................................................................... 172 3.5.7 STEEL/ALUMINUM ........................................................................................................ 172 3.5.8 TUNGSTEN/ALUMINUM................................................................................................ 172 3.5.9 OTHERS/ALUMINUM..................................................................................................... 172
3.6 COPPER MATRIX COMPOSITE PROPERTIES......................................................................... 173 3.6.1 INTRODUCTION ............................................................................................................ 173 3.6.2 GRAPHITE/COPPER ..................................................................................................... 173 3.6.3 OTHERS/COPPER......................................................................................................... 173
3.7 MAGNESIUM MATRIX COMPOSITE PROPERTIES.................................................................. 174 3.7.1 INTRODUCTION ............................................................................................................ 174 3.7.2 GRAPHITE/MAGNESIUM .............................................................................................. 174 3.7.3 ALUMINA/MAGNESIUM................................................................................................. 174 3.7.4 OTHER/MAGNESIUM .................................................................................................... 174
3.8 TITANIUM MATRIX COMPOSITE PROPERTIES....................................................................... 175 3.8.1 INTRODUCTION ............................................................................................................ 175 3.8.2 SILICON CARBIDE/TITANIUM....................................................................................... 175
3.8.2.1 SiC/Ti-15-3 ........................................................................................................... 175 3.8.2.1.1 SiC/Ti-15-3 Tension............................................................................ 175 3.8.2.1.2 SiC/Ti-15-3 Fatigue ............................................................................ 199
3.8.2.2 TRIMARC-1/Ti-6Al-2Sn-4Zr-2Mo wire/fiber wound plate*.................................... 206 3.8.2.2.1 TRIMARC-1/Ti-6Al-2Sn-4Zr-2Mo tension .......................................... 206 3.8.2.2.2 TRIMARC-1/Ti-6Al-2Sn-4Zr-2Mo compression ................................. 228
3.8.3 ALUMINA/TITANIUM ...................................................................................................... 243 3.8.4 OTHER/TITANIUM ......................................................................................................... 243
3.9 OTHER MATRIX COMPOSITES................................................................................................. 243
APPENDIX A. TYPICAL PUSHOUT TEST DATA............................................................................... 244 A1. FIBER PUSHOUT ................................................................................................................ 244
APPENDIX B. RAW DATA TABLES FOR MATRIX MATERIALS ....................................................... 247 B1. ALUMINUMS ........................................................................................................................ 247 B2. COPPERS ............................................................................................................................ 247 B3. MAGNESIUMS ..................................................................................................................... 247 B4. TITANIUMS .......................................................................................................................... 247
B4.1 Ti 15V 3Cr 3Al-3Sn (Section 3.3.5.1) ...................................................................... 248
APPENDIX C. RAW DATA TABLES FOR METAL MATRIX COMPOSITE MATERIALS.................... 252 C1. ALUMINUMS ........................................................................................................................ 252
C1.1 Nextel 610 / SP Al (Section 3.5.2.1)........................................................................ 253 C2. COPPER .............................................................................................................................. 263 C3. MAGNESIUMS..................................................................................................................... 263 C4. TITANIUMS .......................................................................................................................... 264
C4.1 SiC/TI-15-3 (Section 3.8.2.1.1 and 3.8.2.1.2) ......................................................... 264 C4.2. TRIMARC-1/Ti 6-2-4-2 (Section 3.8.2.2.1 and 3.8.2.2.2) ...................................... 286
INDEX ....................................................................................................................................................... 300 CONCLUDING MATERIAL……................................................................................................... ..303

MIL-HDBK-17-4A Volume 4, Table of Contents
xi
SUMMARY OF CHANGES
Section and Title Sub-section
Title Change type
1 Guidelines
1.7 Definitions revision
3.2.5 Data Documentation requirements checklist revision
2 Design Guidelines for MMC
3.1-3.3 Structural Design and Analysis Introduction General Design Guidelines Analysis Approaches (continuous fiber
MMC)
new
3 Material Properties Data
1.3 Presentation of Data revision
1.3.3 Fatigue Data new
2.2.1-.2 Alumina Fibers Introduction Virgin Nextel 610 fiber
new
2.6.1 SCS-6 Fiber new
5.2.1 Nextel 610/pure Al new
3.8.2.1.1-.2 SiC/Ti-15-3 SiC/Ti-15-3 Tension SiC/Ti-15-3 Fatigue
new
3.8.2.2 TRIMARC-1/Ti-6Al-2Sn-4Zr-2Mo new

MIL-HDBK-17-4A Volume 4, Table of Contents
xii
This page intentionally left blank

MIL-HDBK-17-4A Volume 4, Section 1 Guidelines
1
1. GUIDELINES 1.1 GENERAL INFORMATION This handbook documents engineering methodologies for the development of standardized, statisti-cally-based material property data for continuous and discontinuous metal matrix composite (MMC) mate-rials. Also provided are data summaries for a number of relevant composite material systems for which available data meets specific MIL-HDBK-17 requirements for publication. Additionally, supporting engi-neering and manufacturing technologies and common practices related to composite materials are sum-marized. 1.1.1 INTRODUCTION It is generally understood that standardized, statistically-based, material property data are essential to an efficient engineering development process; such data are needed by material suppliers, engineering users, and system end-users alike. Since the inherent properties of materials are independent of specific applications, data development methodologies and material property data are applicable to a wide variety of industries; they also form much of the technical basis for establishment of statistically-based design values acceptable to procuring or certifying agencies.1 This evaluation of the inherent properties of com-posite materials, as shown in Figure 1.1.1, is the focus of MIL-HDBK-17. 1.1.2 PURPOSE The primary purpose of MIL-HDBK-17 Volume 4 is the standardization of engineering data develop-ment methodologies related to characterization testing, data reduction, and data reporting of properties for metal matrix composite materials. In support of this objective MIL-HDBK-17 Volume 4 publishes proper-ties on composite material systems for which data meeting specific requirements is available. In addition, MIL-HDBK-17 provides selected guidance on other technical topics related to composites, including mate-rial selection, material specification, material processing, design, analysis, quality control, and repair of typical metal matrix composite materials. Thus, MIL-HDBK-17 is published in three major sections, and serves as a source for the following:
• Section 1 - Guidelines: Documents material characterization data development methodology guidelines adaptable to a wide variety of needs, as well as specific requirements to be met by data published in the handbook. Most procuring and certifying agencies prefer, and some may require, that composite material systems used in critical applications either be characterized in accor-dance with Section 1 guidelines or selected from material systems published in Section 3.
• Section 2 - Utilization of Data: This section provides guidance on statistical analysis of metal ma-
trix composite data. In addition, methodologies and recommendations for design, modeling, join-ing, structural reliability, and repair are given.
• Section 3 - Materials Property Data: Provides a repository of potential design data. The docu-
mented property summaries for material systems provide data meeting the criteria for any of the two MIL-HDBK-17 data documentation classes, screening and fully approved.
1.1.3 SCOPE Volume 4 of MIL-HDBK-17 serves as a general Reference source for technical information on metal matrix composites, including:
1An example of a procuring agency is a branch of the U.S. Department of Defense (DoD). An example of a certifying agency is an office of the Federal Aviation Administration (FAA).
MIL-HDBK-17-4A Volume 4, Section 1 Guidelines
2
MIL-HDBK-17
MATRIX MATERIAL CHARACTERIZATION
FIBER CHARACTERIZATION
INTERMEDIATE FORMS EVALUATION
COMPOSITE SYSTEMS CHARACTERIZATION
NOTCHED/DAMAGED COMPOSITE EVALUATION
JOINT EVALUATION
DETERMINATION OF STRUCTURAL DESIGN VALUES
CERTIFICATION OF THE COMPOSITE STRUCTURE
FIGURE 1.1.1 Focus of MIL-HDBK-17 Volume 4 indicated by shaded block. 1.1.3.1 Section 1: Guidelines This volume contains guidelines for determining the properties of composite material systems, their constituents, and generic structural elements, including test planning, test matrices, sampling, condition-ing, test procedure selection, data reporting, data reduction, statistical analysis, and other related topics. Special attention is given to the statistical treatment and analysis of data. Section 1 contains guidelines for general development of material characterization data as well as specific requirements for publication of metal matrix composite material data in MIL-HDBK-17. It must be emphasized that this handbook differentiates between material basis values (material al-lowables) and design allowable values. Material basis values, being an intrinsic property of a composite material system, are the focus of this handbook. Design allowable values, while often rooted in material basis values, are application dependent, and consider and include specific additional considerations that

MIL-HDBK-17-4A Volume 4, Section 1 Guidelines
3
may further affect the strength or stiffness of the structure. Also, when establishing application design val-ues there may be additional certification or procurement agency requirements that go beyond MIL-HDBK-17. 1.1.3.2 Section 2: Utilization of data [Materials Usage, Design, and Analysis Guidelines] Section 2 provides methodologies and lessons learned for the design, manufacture, analysis, and supportability of composite structures, and for utilization of the material data provided in Section 3 consis-tent with the guidance provided in Section 1. Topics discussed in Section 2 include materials and processing, quality control, design and analysis, joints, reliability, and supportability. 1.1.3.3 Section 3: Material property data Section 3 contains statistically-based data meeting specific MIL-HDBK-17 population sampling and data documentation requirements, covering constituents and material systems of general interest. Data published in Section 3 are under the jurisdiction of the Data Review Working Group and are approved by the overall Coordination Group (the MIL-HDBK-17 Coordination Group and Working Groups are dis-cussed in Section 1.1.5). New material systems will be included and additional material data for existing systems will be added as data become available and are approved. The material properties in Section 3 are defined over a range of potential use conditions, focusing, when possible, on the upper and lower material environmental limits so that application-specific environ-ments do not limit use of the data. Data at intermediate environmental conditions, when available, provide additional definition of the relation between material response and environment. While the process of establishing structural design values for specific applications can begin with the data contained in Section 3, most applications require collection of additional data, especially if there are requirements for data from the laminate or higher structural complexity levels (structural complexity level is discussed in 2.1.2.1). Also, the ability to manufacture material equivalent to that from which the data in Section 3 were obtained typically must be proven to the procuring or certifying agency, which usually in-volves limited testing and data comparison. The details of such an evaluation remain at the discretion of the procuring or certifying agency. 1.1.4 USE OF THE DOCUMENT AND LIMITATIONS 1.1.4.1 Source of information The information contained in MIL-HDBK-17 Volume 4 is obtained from materials producers and fabri-cators, manufacturers, reports on government-sponsored research, the open literature, direct contacts with researchers, and from participants in MIL-HDBK-17 coordination activities. All information published in this document has been coordinated and reviewed by representatives from industry, the U.S. Army, U.S. Navy, U.S. Air Force, NASA, and Federal Aviation Administration. Every effort has been made to reflect the most up-to-date information on the use of composite materials, with particular emphasis on use of composites in structures. The handbook is continually reviewed and revised to keep current with the state-of-the-art and insure completeness and accuracy. 1.1.4.2 Use of data and guidelines in applications All data contained herein are based on small-scale test specimens for specific environmental condi-tions, largely limited to uniaxial loading.1 It is the user's responsibility to determine if handbook data is ap-propriate for a given application, and if selected, to translate or scale the data as necessary for use:
1Unless otherwise noted, tests were conducted in conformance with the particular test method noted. The emphasis is on data obtained from ASTM standard test methods for advanced composites, but where an ASTM test method has been deemed inappro-priate or is not yet available, or when data from a nonstandard but commonly practiced test procedure is available, then data from a non-standard test method may have been accepted for publication. The specific test method used is noted in the data documenta-tion. See also the statement on test method acceptance criteria in Section 1.3.2.1.

MIL-HDBK-17-4A Volume 4, Section 1 Guidelines
4
• in a multi-directional laminate, • on a structure of different characteristic size and geometry, • under a multi-directional stress state, • when exposed to a different environment, and/or • when subjected to non-static loading.
Further discussions of these and other issues are provided in Section 2. Specific uses of handbook data are beyond the scope and responsibility of MIL-HDBK-17, and applicability and interpretation of specific provisions of this handbook may require approval by an appropriate procurement or certification agency. 1.1.4.3 Strength properties and allowables terminology The handbook intent is to provide guidelines for generating material property data, including statisti-cally-based strength data at environmental extremes that bracket most intermediate application-specific environments. The philosophy is to avoid having application-specific issues govern generic material prop-erty characterization programs. If data are also available at intermediate environmental conditions, they can be used to more completely define the relationship between the property and the effect of the envi-ronment on that property. However, in some cases an environmental limit for a composite material system may be application dependent, and in others, data at environmental limits may not be available. Available statistically-based strength data are useful as a starting point for establishing structural de-sign allowable values when stress and strength analysis capabilities permit lamina-level margin-of-safety calculations. For such cases the MIL-HDBK-17 strength basis value may also be termed a material de-sign allowable. Depending on the application, some structural design allowables may have to be empiri-cally determined from additional laminate, element, or higher-level test data not provided by MIL-HDBK-17. 1.1.4.4 Use of References While many References are provided at the end of each chapter, note that the information in these citations may not necessarily comply in every respect either with the general guidelines for data develop-ment or with the specific requirements for publication of data in the handbook. The References are simply intended to be helpful, but not necessarily complete or authoritative sources of additional related informa-tion on specific subject areas. 1.1.4.5 Use of tradenames and product names Use of tradenames or proprietary product names does not constitute an endorsement of those prod-ucts by the U.S. Government or by the MIL-HDBK-17 Coordination Group. 1.1.4.6 Toxicity, health hazards, and safety Certain processing and test methods discussed in MIL-HDBK-17 may involve hazardous materials, operations, or equipment. These methods may not address safety problems, if any, associated with their use. It is the responsibility of the user of these methods to establish appropriate safety and health prac-tices and to determine the applicability of regulatory limitations prior to use. The user is referred to the Advanced Composite Materials U.S. Army Interim Health and Safety Guidance for a discussion of the health and safety issues involved in the processing and use of composite materials. This document is generated by the U.S. Army Environmental Hygiene Agency, Aberdeen Proving Ground, MD. Material manufacturers, as well as various composites user groups, may also provide guidance on health and safety issues pertinent to composite materials. 1.1.4.7 Ozone depleting chemicals Restrictions on the use of ozone depleting chemicals are detailed in the U.S. Clean Air Act of 1991.

MIL-HDBK-17-4A Volume 4, Section 1 Guidelines
5
1.1.5 APPROVAL PROCEDURES The content of the handbook is developed and approved by the MIL-HDBK-17 MMC Coordination Group, which meets every eight months to consider changes and additions to the handbook. This Group consists of the Coordination Group Co-Chairs, Coordinator, Secretariat, Working Group Chairs, and the ac-tive Working Group participants, which include representatives from various United States procuring and certifying agencies, in addition to the producing industries, academic, and research institutions. MIL-HDBK-17 MMC Coordination Group meetings are announced on the MIL-HDBK-17 homepage (http://www.mil17.org). While each of the Working Groups functions similarly, they are of three types: Executive, a single Working Group with oversight responsibility composed of the Working Group Chairs, the handbook Co-Chairs, Coordinator, and Secretariat; Standing, including Data Review, Materials and Processing, Statis-tics, and Testing Working Groups; and Specialty, which will be established as needed. The makeup and organization of the Coordination Group and Working Groups, as well as the procedures followed for document change approval, are summarized in the MIL-HDBK-17 homepage. Proposals for addition to, deletion from, or modification to the handbook should be submitted to both the appropriate Working Group and the Secretariat well in advance of the announcement mailing date, and should include specific notation of the proposed changes and adequate documentation of supporting data or analytical procedures. Reproducible copies of Figures, drawings, or photographs proposed for publication in the document should be furnished to the Secretariat. Following approval by the appropriate Working Group, the proposed changes are published in the next minutes of the Coordination Group, in a special section of the minutes called the "yellow pages", and all participants are allowed comment on the proposed changes. If no substantive comments are received on any individual item by the posted re-sponse date, then that item is considered approved by the Coordination Group and is considered effective as of that date. (Prior to publication in the next revision of the handbook the collected changes are re-viewed by various branches of the U.S. DoD. Additional proposals for revision may result from this U.S. DoD review.) Requests for inclusion of material property data into MIL-HDBK-17 should be submitted to either the Coordinator or the Secretariat, accompanied by the documentation specified in Section 1.3.2.5. A Data Source Information Package has been created to aid those considering submitting data for inclusion in MIL-HDBK-17, and is available from either the Coordinator or the Secretariat. The Secretariat reviews and analyzes each data submission and at the next available meeting of the Coordination Group presents a summary for evaluation by the Data Review Working Group. The choice of new materials to be included herein is governed by the MIL-HDBK-17 Coordination Group. Practical considerations preclude inclusion of all advanced composite materials, but reasonable attempts will be made to add new material systems of interest in a timely manner. 1.1.6 SYMBOLS, ABBREVIATIONS, AND SYSTEMS OF UNITS This section defines the symbols and abbreviations which are used within MIL-HDBK-17 and de-scribes the system of units which is maintained. Common usage is maintained where possible. Refer-ences 1.1.6(a) through 1.1.6(c) served as primary sources for this information. 1.1.6.1 Symbols and abbreviations The symbols and abbreviations used in this document are defined in this section with the exception of statistical symbols. These latter symbols are defined in Section 1.11. The lamina/laminate coordinate axes used for all properties and a summary of the mechanical property notation are shown in Figure 1.1.6.1.
• The symbols f and m, when used as either subscripts or superscripts, always denote fiber and matrix, respectively.
• The type of stress (for example, cy - compressive yield) is always used in the superscript position.

MIL-HDBK-17-4A Volume 4, Section 1 Guidelines
6
• Direction indicators (for example, x, y, z, 1, 2, 3, and so on) are always used in the subscript posi-
tion.
• Ordinal indicators of laminae sequence (for example, 1, 2, 3, and so on) are used in the superscript position and must be parenthesized to distinguish them from mathematical exponents.
• Other indicators may be used in either subscript or superscript position, as appropriate for clarity. • Compound symbols (such as, basic symbols plus indicators) which deviate from these rules are
shown in their specific form in the following list. The following general symbols and abbreviations are considered standard for use in MIL-HDBK-17. Where exceptions are made, they are noted in the text and Tables. A - (1) area (m2,in2) - (2) ratio of alternating stress to mean stress - (3) A-basis for mechanical property values Ann - Annealed a - (1) length dimension (mm,in) - (2) acceleration (m/sec2,ft/sec2) - (3) amplitude - (4) crack or flaw dimension (mm, in.) ac - critical half crack length ao - initial half crack length B - (1) B-basis for mechanical property values - (2) biaxial ratio Btu - British thermal unit(s) BUS - individual or typical bearing ultimate strength BYS - individual or typical bearing yield strength b - (1) width dimension (mm, in.), for example, the width of a bearing or compression panel nor-
mal to load, or breadth of beam cross-section - (2) width of sections; subscript “bending” br - subscript “bearing” C - (1) specific heat (kJ/kg °C, Btu/lb °F) - (2) Celsius CC - center cracked CEM - consumable electrode melted CF - centrifugal force (N, lbf)CPF CPF - crossply factor CG - (1) center of mass, "center of gravity" - (2) area or volume centroid CL - centerline
CT - compact tension c - column buckling end-fixity coefficient cpm - cycles per minute D - (1) diameter (mm, in.) - (2) hole or fastener diameter (mm, in.) - (3) plate stiffness (N-m, lbf-in) d - mathematical operator denoting differential E - modulus of elasticity in tension, average ratio of stress to strain for stress below proportional limit (GPa, Msi) Ec - modulus of elasticity in compression, average ratio of stress to strain for stress below proportional limit (GPa, Msi)

MIL-HDBK-17-4A Volume 4, Section 1 Guidelines
7
FIGURE 1.1.6.1 Mechanical property notation.

MIL-HDBK-17-4A Volume 4, Section 1 Guidelines
8
c’E - modulus of elasticity of honeycomb core normal to sandwich plane (GPa, Msi)
Esec - secant modulus (GPa, Msi) Etan - tangent modulus (GPa, Msi) ELI - extra low interstitial (grade of titanium alloy) ER - equivalent round ESR - electro-slag remelted e - (1) minimum distance from a hole center to the edge of the sheet (mm, in.)
- (2) elongation in percent, a measure of the ductility of a material based on a tension test - (3) unit deformation or strain - (4) subscript “fatigue or endurance”
e/D - ratio of edge distance to hole diameter (bearing strength) F - (1) stress (MPa, ksi) - (2) Fahrenheit Fb - bending stress (MPa, ksi) Fccr - crushing or crippling stress (upper limit of column stress for failure) (MPa, ksi) Fpl - proportional limit (MPa, ksi) Fsu - ultimate stress in pure shear (this value represents the average shear stress over the cross-section) (MPa, ksi) Ftu - ultimate stress in tension (MPa, ksi) FV - fiber volume (%) f - (1) internal (or calculated) stress (MPa, ksi) - (2) stress applied to the gross flawed section (MPa, ksi) - (3) creep stress (MPa, ksi) f c - internal (or calculated) compressive stress (MPa, ksi) fc - (1) maximum stress at fracture (MPa, ksi) - (2) gross stress limit (for screening elastic fracture data (MPa, ksi) ft - foot, feet G - modulus of rigidity (shear modulus) (GPa, Msi) GPa - gigapascal(s) g - (1) gram(s) - (2) acceleration due to gravity (m/s2, ft/s2) H/C - honeycomb (sandwich) h - height dimension (mm, in.) for example, the height of a beam cross-section hr - hour(s) I - area moment of inertia (mm4, in.4) i - slope (due to bending) of neutral plane in a beam, in radians in. - inch(es) J - (1) torsion constant (= Ip for round tubes) (m4, in.4) - (2) Joule K - (1) Kelvin - (2) stress intensity factor (MPa/m, ksi/in.) - (3) coefficient of thermal conductivity (W/m °C, Btu/ft2/hr/in./°F) - (4) correction factor - (5) dielectric constant Kapp - apparent plane strain fracture toughness or residual strength (MPa/m, ksi/in.) Kc - critical plane strain fracture toughness, a measure of fracture toughness at point of crack growth instability (MPa/m, ksi/in.) KIc - plane strain fracture toughness (MPa/m, ksi/in.) KN - empirically calculated fatigue notch factor Ks - plate or cylinder shear buckling coefficient Kt - (1) theoretical elastic stress concentration factor - (2) tw/c ratio in H/C sandwich Kv - dielectric strength (KV/mm, V/mil) Kx,Ky - plate or cylinder compressive buckling coefficient k - strain at unit stress (m/m, in./in.)

MIL-HDBK-17-4A Volume 4, Section 1 Guidelines
9
ksi - kips (1,000 pounds) per square inch L - cylinder, beam, or column length (mm, in.) L' - effective column length (mm, in.) LT - long transverse (grain direction) lb. - pound
o - gage length M - applied moment or couple (N-m, in.-lbf) Mg - megagram(s) MIG - metal-inert-gas (welding) MPa - megapascal(s) MS - military standard M.S. - margin of safety MW - molecular weight MWD - molecular weight distribution m - (1) mass (kg, lb.) - (2) number of half wave lengths - (3) metre - (4) slope mm - millimetre(s) N - (1) number of fatigue cycles to failure - (2) number of laminae in a laminate - (3) distributed in-plane forces on a panel (lbf/in.) - (4) Newton - (5) normalized NA - neutral axis n - (1) number of times in a set - (2) number of half or total wavelengths - (3) number of fatigue cycles endured
- (4) subscript “normal”; - (5)cycles applied to failure - (6) shape parameter for the standard stress-strain curve (Ramberg-Osgood parameter)
P - (1) applied load (N, lbf) - (2) exposure parameter - (3) probability - (4) specific resistance (Ω) Pu - test ultimate load, (N, lb. per fastener) Py - test yield load, (N, lb per fastener) p - normal pressure (Pa, psi) psi - pounds per square inch Q - area static moment of a cross-section (mm3, in.3) Q&T - quenched and tempered q - shear flow (N/m, lbf/in.) R - (1) algebraic ratio of minimum load to maximum load in cyclic loading - (2) reduced ratio RA - reduction of area R.H. - relative humidity RMS - root-mean-square RT - room temperature r - (1) radius (mm, in.) - (2) root radius (mm, in.) - (3) reduced ratio (regression analysis) S - (1) shear force (N, lbf) - (2) nominal stress in fatigue (MPa, ksi) - (3) S-basis for mechanical property values Sa - stress amplitude in fatigue (MPa, ksi) Se - fatigue limit (MPa, ksi)

MIL-HDBK-17-4A Volume 4, Section 1 Guidelines
10
Sm - mean stress in fatigue (MPa, ksi) Smax - highest algebraic value of stress in the stress cycle (MPa, ksi) Smin - lowest algebraic value of stress in the stress cycle (MPa, ksi) SR - algebraic difference between the minimum and maximum stresses in one cycle (MPa, ksi) S.F. - safety factor SCC - stress-corrosion cracking ST - short transverse (grain direction) STA - solution treated and aged S-N - stress vs. fatigue life s - (1) arc length (mm, in.) - (2) H/C sandwich cell size (mm, in.) T - (1) temperature (°C, °F) - (2) applied torsional moment (N-m, in.-lbf) TIG - tungsten-inert-gas (welding) TF - exposure temperature TF - exposure temperature (°C, °F) Tm - melting temperature (°C, °F) t - (1) thickness (mm, in.) - (2) exposure time (s) - (3) elapsed time (s) V - (1) volume (mm3, in.3) - (2) shear force (N, lbf) W - (1) weight (N, lbf) - (2) width (mm, in.) - (3) Watt x - distance along a coordinate axis Y - nondimensional factor relating component geometry and flaw size y - (1) deflection (due to bending) of elastic curve of a beam (mm, in.) - (2) distance from neutral axis to given point - (3) distance along a coordinate axis Z - section modulus, I/y (mm3, in.3) z - distance along a coordinate axis α - coefficient of thermal expansion (m/m/°C, in./in./°F) γ - shear strain (m/m, in./in.)
∆ - difference (used as prefix to quantitative symbols) Φ - angular deflection δ - elongation or deflection (mm, in.) ε - strain (m/m, in./in.) εe - elastic strain (m/m, in./in.) εp - plastic strain (m/m, in./in.) µ - permeability η - plasticity reduction factor ν - Poisson's ratio ρ - (1) density (g/cm3, lb/in.3) - (2) radius of gyration (mm, in.) - (3) radius of gyration; Neuber constant (block length)
′ρc - H/C sandwich core density (kg/m3, lb/in.3)
Σ - total, summation σ - standard deviation σij, τ ij - stress in j direction on surface whose outer normal is in i direction (i, j = 1, 2, 3 or x, y, z) (MPa, ksi) Τ - applied shear stress (MPa, ksi) ω - angular velocity (radians/s) ∞ - infinity

MIL-HDBK-17-4A Volume 4, Section 1 Guidelines
11
1.1.6.1.1 Constituent properties The following symbols apply specifically to the constituent properties of a typical composite material. Ef - Young's modulus of fiber (MPa, ksi) Em - Young's modulus of matrix material (MPa, ksi) ER - Young’s modulus of reinforcement (MPa, ksi) Gf - shear modulus of fiber (MPa, ksi) Gm - shear modulus of matrix (MPa, ksi) GR - shear modulus of reinforcement (MPa, ksi)
′Gcx - shear modulus of sandwich core along X-axis (MPa, ksi)
′Gcy - shear modulus of sandwich core along Y-axis (MPa, ksi)
- fiber length (mm, in.) α f - coefficient of thermal expansion for fiber material (m/m/°C, in./in./°F) α m - coefficient of thermal expansion for matrix material (m/m/°C, in./in./°F) ν f - Poisson's ratio of fiber material ν m - Poisson's ratio of matrix material σ - applied axial stress at a point, as used in micromechanics analysis (MPa, ksi) τ - applied shear stress at a point, as used in micromechanics analysis (MPa, ksi) 1.1.6.1.2 Laminae and laminates The following symbols, abbreviations, and notations apply to composite laminae and laminates. Aij (i,j = 1,2,6) - extensional rigidities (N/m, lbf/in.) Bij (i,j = 1,2,6) - coupling matrix (N, lbf) Cij (i,j = 1,2,6) - elements of stiffness matrix (Pa, psi) Dx, Dy - flexural rigidities (N-m, lbf-in.) Dxy - twisting rigidity (N-m, lbf-in.) Dij (i,j = 1,2,6) - flexural rigidities (N-m, lbf-in.) E1 - Young's modulus of lamina parallel to fiber or warp direction (GPa, Msi) E2 - Young's modulus of lamina transverse to fiber or warp direction (GPa, Msi) Ex - Young's modulus of laminate along x Reference axis (GPa, Msi) Ey - Young's modulus of laminate along y Reference axis (GPa, Msi) G12 - shear modulus of lamina in 12 plane (GPa, Msi) Gxy - shear modulus of laminate in xy Reference plane (GPa, Msi) hi - thickness of ith ply or lamina (mm, in.) Mx, My, Mxy - bending and twisting moment components (N-m/m, in.-lbf/in. in plate and shell analysis) nf - number of fibers per unit length per lamina Qx, Qy - shear force parallel to z axis of sections of a plate perpendicular to x and y axes, respectively (N/m, lbf/in.) Qij (i,j = 1,2,6) - reduced stiffness matrix (Pa, psi) ux, uy, uz - components of the displacement vector (mm, in.)
xo
yo
zou , u , u - components of the displacement vector at the laminate's midsurface (mm, in.)
Vv - void content (% by volume) Vf - fiber content or fiber volume (% by volume) Vm - matrix content (% by volume) Vx, Vy - edge or support shear force (N/m, lbf/in.) Wf - fiber content (% by weight) Wm - matrix content (% by weight) Ws - weight of laminate per unit surface area (N/m2, lbf/in.2) α1 - lamina coefficient of thermal expansion along 1 axis (m/m/°C, in./in./°F) α 2 - lamina coefficient of thermal expansion along 2 axis (m/m/°C, in./in./°F) α x - laminate coefficient of thermal expansion along general Reference x axis

MIL-HDBK-17-4A Volume 4, Section 1 Guidelines
12
(m/m/°C, in./in./°F) α y - laminate coefficient of thermal expansion along general Reference y axis
(m/m/°C, in./in./°F) α xy - laminate shear distortion coefficient of thermal expansion (m/m/°C, in./in./°F)
θ - angular orientation of a lamina in a laminate, that is, angle between 1 and x axes (°) λ xy - product of ν xy and ν yx
ν12 - Poisson's ratio relating contraction in the 2 direction as a result of extension in the 1 direction1 ν 21 - Poisson's ratio relating contraction in the 1 direction as a result of extension in the 2 direction1 ν xy - Poisson's ratio relating contraction in the y direction as a result of extension in the x
direction1 ν yx - Poisson's ratio relating contraction in the x direction as a result of extension in the y
direction1 ρc - (1) density of a single lamina (g/cm3, lb/in.3) - (2) density of a laminate (g/cm3, lb/in.3) φ - (1) general angular coordinate, (°) - (2) angle between x and load axes in off-axis loading (°) 1.1.6.1.3 Subscripts The following subscript notations are considered standard in MIL-HDBK-17. 1, 2, 3 - laminae natural orthogonal coordinates (1 is fiber) A - axial a - (1) adhesive - (2) alternating app - apparent byp - bypass c - (1) composite system, specific fiber/matrix composition. - (2) critical - (3) compression cf - centrifugal force e - fatigue or endurance eff - effective eq - equivalent f - fiber H - hoop i - ith position in a sequence L - lateral m - (1) matrix - (2) mean max - maximum min - minimum n - (1) nth (last) position in a sequence - (2) normal p - polar s - symmetric st - stiffener T - transverse t - value of parameter at time t x, y, z - general coordinate system
1The convention for Poisson’s ratio should be checked before comparing different sources as different conventions are used.

MIL-HDBK-17-4A Volume 4, Section 1 Guidelines
13
∑ - total, or summation o - initial or Reference datum ( ) - format for indicating specific, temperature associated with term in parentheses. RT - room
temperature (21°C, 70°F); all other temperatures in °F unless specified. 1.1.6.1.4 Superscripts The following superscript notations are considered standard in MIL-HDBK-17. b - bending br - bearing c - (1) compression - (2) creep cc - compressive crippling cr - compressive buckling e - elastic f - fiber (i) - ith ply or lamina lim - limit, used to indicate limit loading m - matrix ohc - open hole compression oht - open hole tension p - plastic pl - proportional limit rup - rupture s - shear scr - shear buckling sec - secant (modulus) so - offset shear T - temperature or thermal t - tension tan - tangent (modulus) u - ultimate y - yield ' - secondary (modulus), or denotes properties of H/C core when used with subscript c 1.1.6.1.5 Acronyms The following acronyms are used in MIL-HDBK-17, Volume 4 AA Atomic Absorption AES Auger Electron Spectroscopy AIA Aerospace Industries Association AISI American Iron & Steel institute AMPTIAC Advanced Materials & Processes Technical Information and Analysis Center AMS Aerospace Materials Specification ANOVA Analysis of Variance ARL Army Research Laboratory ASM ASM International CAD Computer Aided Design CAI Compression After Impact CAT Computer Aided Tomography CIP Cold Isostatic Pressing CTE Coefficient of Thermal Expansion CV Coefficient of Variation CVD Chemical Vapor Deposition

MIL-HDBK-17-4A Volume 4, Section 1 Guidelines
14
CVI Chemical Vapor Infiltration DCB Double Cantilever Beam DLL Design Limit Load DOD Department of Defense DOE Department of Energy DRA Discontinuously Reinforced Aluminum DSC Differential Scanning Calorimetry DTA Differential Thermal Analysis EAC Environmentally Assisted Cracking EDM Electric Discharge Machining ENF End Notched Flexure ESCA Electron Spectroscopy for Chemical Analysis FAA Federal Aviation Administration FEA Finite Element Analysis FEM Finite Element Method FOD Foreign Object Damage GC Gas Chromatography GTAW Gas Tungsten Arc Welding HAC Hydrogen Assisted Cracking HIP Hot Isostatic Pressing ICP Inductively Coupled Plasma IGA Intergranular Attack LMI Liquid metal Infiltration LPT Laminate Plate Theory LSS Laminate Stacking Sequence MMB Mixed Mode Bending MMC Metal Matrix Composite MOL Material Operational Limit MS Mass Spectroscopy MSDS Material Data Safety Sheets MTBF Mean Time Between Failure NAS National Aerospace Standard NASA National Aeronautics & Space Administration NDC Nondestructive Characterization NDE Nondestructive Evaluation NDI Nondestructive Inspection NDT Nondestructive Testing PEL Precision Elastic Limit RT Room Temperature SACMA Suppliers of Advanced Composite Materials Association SAE Society of Automotive Engineers SAMPE Society for the Advancement of Materials & Process Engineering SBS Short Beam Shear Strength SCC Stress Corrosion Cracking SEM Scanning Electron Microscopy SI International System of Units (Le Système International d’Unités) SIMS Secondary Ion Mass Spectroscopy TEM Transmission Electron Microscopy TMA Thermomechanical Analysis TMS The Metals, Minerals & Materials Society TMP Thermomechanical Processing VNB V-notched Beam WOF Work Of Fracture XRF X-Ray Fluorescence XRD X-Ray Diffraction

MIL-HDBK-17-4A Volume 4, Section 1 Guidelines
15
1.1.6.2 Material system codes The materials systems codes which are used in the handbook consist of a fiber system code and a matrix material code separated by a virgule (/), for example, AIO/Al for alumina reinforced aluminum. The codes for the fiber and matrix materials appear in Table 1.1.6.2(a) and (b).
TABLE 1.1.6.2(a) Fiber system codes.
Al2O3 Alumina B Boron B4C Boron Carbide C Carbon Gr Graphite SiC Silicon Carbide -- Steel W Tungsten
TABLE 1.1.6.2.(b) Matrix material codes.
Al Aluminum Cu Copper Fe Iron Mg Magnesium Ni Nickel Ti Titanium
1.1.6.3 System of units To comply with Department of Defense Instructive 5000.2, Part 6, Section M, "Use of the Metric Sys-tem," dated February 23, 1991, the data in MIL-HDBK-17 are generally presented in both the International System of Units (SI units) and the U. S. Customary (English) system of units. ASTM E380, Standard for Metric Practice, provides guidance for the application for SI units which are intended as a basis for world-wide standardization of measurement units (Reference 1.1.6.3(a)). Further guidelines on the use of the SI system of units and conversion factors are contained in the following publications (References 1.1.6.3(b) through 1.1.6.3(f)):
(1) DARCOM P 706-470, “Engineering Design Handbook: Metric Conversion Guide”, July 1976. (2) NBS Special Publication 330, "The International System of Units (SI)”, National Bureau of Stan-
dards, 1986 edition. (3) NBS Letter Circular LC 1035, "Units and Systems of Weights and Measures, Their Origin, Devel-
opment, and Present Status”, National Bureau of Standards, November 1985. (4) NASA Special Publication 7012, "The International System of Units Physical Constants and Con-
version Factors", 1964.

MIL-HDBK-17-4A Volume 4, Section 1 Guidelines
16
(5) IEEE SI 10, “International System of Units (SI): The Modern Metric System”, Institute of Electrical and Electronic Engineers (IEEE), November 1997.
English to SI conversion factors pertinent to MIL-HDBK-17 data are contained in Table 1.1.6.3.
TABLE 1.1.6.3 English to SI conversion factors. To convert from to Multiple by*
Btu (thermochemical)/in.2-s watt/meter2 (W/m2) 1.634 246 E+06 Btu-in/(s-ft2-°F) W/(m K) 5.192 204 E+02 Btu/lb.-F Joule/gram-Kelvin 4.1868** (or Btu≅lb.-1≅F-1) (J/g≅K) or J≅g-1≅K-1) Btu/[(hr)(ft2)(F)/ft] Watt/metre-Kelvin 1.7307 (or Btu≅hr-1≅ft-2≅F-1≅ft) W/(m≅K) or W≅m-1≅K-1) degree Fahrenheit degree Celsius (°C) T = (T - 32)/1.8 degree Fahrenheit kelvin (K) T = (T + 459.67)/1.8 foot meter (m) 3.048 000 E-01 ft2 m2 9.290 304 E-02 foot/second meter/second (m/s) 3.048 000 E-01 ft/s2 m/s2 3.048 000 E-01 inch meter (m) 2.540 000 E-02 in.2 meter2 (m2) 6.451 600 E-04 in.3 m3 1.638 706 E-05 in./in./F Metre/metre/Kelvin 1.8 (or in.≅in.-1≅F-1) m/(m≅K) or (m≅m-1≅K≅-1) kilogram-force (kgf) newton (N) 9.806 650 E+00 kgf/m2 pascal (Pa) 9.806 650 E+00 kip (1000 lbf) newton (N) 4.448 222 E+03 ksi (kip/in.2) MPa 6.894 757 E+00 ksi√in. megapascal √meter 1.0989 (MPa≅m 1/2)*** lbf-in. N-m 1.129 848 E-01 lbf-ft N-m 1.355 818 E+00 lbf/in.2 (psi) pascal (Pa) 6.894 757 E+03 lb./in.2 gm/m2 7.030 696 E+05 lb./in.3 kg/m3 2.767 990 E+04 Msi (106 psi) GPa 6.894 757 E+00 pound-force (lbf) newton (N) 4.488 222 E+00 pound-mass (lb. avoirdupois) kilogram (kg) 4.535 924 E-01 torr pascal (Pa) 1.333 22 E+02
*The letter “E” following the conversion factor stands for exponent and the two digits after the letter “E” indicate the power of 10 by which the number is to be multiplied. **One Pascal (Pa) = one newton/metre2. ***Conversion factor is exact.

MIL-HDBK-17-4A Volume 4, Section 1 Guidelines
17
1.1.7 DEFINITIONS The following definitions are used within MIL-HDBK-17. This glossary of terms is not totally compre-hensive but it does represent nearly all commonly used terms. Where exceptions are made, they are noted in the text and Tables. For ease of identification the definitions have been organized alphabetically. A-Basis (or A-Value) -- A statistically-based material property; a 95% lower confidence bound on the first percentile of a specified population of measurements. Also a 95% lower tolerance bound for the up-per 99% of a specified population. Accuracy -- The degree of conformity of a measured or calculated value to some recognized stan-dard or specified value. Accuracy involves the systematic error of an operation. ADK -- Notation used for the k-sample Anderson-Darling statistic, which is used to test the hypothesis that k batches have the same distribution. Aging – A heat treatment process involving precipitation of a second phase in a metal matrix, in gen-eral leading to hardening; artificial aging is conducted a an elevated temperature while natural aging may occur at room temperature. Ambient -- The surrounding environmental conditions such as pressure or temperature. Angleply -- Lamina orientation not coinciding with load axis. Anisotropic -- Not isotropic; having mechanical and/or physical properties which vary with direction relative to natural Reference axes inherent in the material. Aspect Ratio -- In an essentially two-dimensional rectangular structure (e.g., a panel), the ratio of the long dimension to the short dimension. However, in compression loading, it is sometimes considered to be the ratio of the load direction dimension to the transverse dimension. Also, with reinforcement, it is the ratio of length to diameter. B-Basis (or B-Value) -- A statistically-based material property; a 95% lower confidence bound on the tenth percentile of a specified population of measurements. Also a 95% lower tolerance bound for the upper 90% of a specified population. (See Volume 1, Section 8.1.4) Balanced Laminate -- A composite laminate in which all laminae at angles other than 0 degrees and 90 degrees occur only in ± pairs (not necessarily adjacent). Bearing Area -- The product of the pin diameter and the specimen thickness. Bearing Load -- A compressive load on an interface. Bearing Yield Strength -- The bearing stress at which a material exhibits a specified limiting devia-tion from the proportionality of bearing stress to bearing strain. Bend Test -- A test of ductility by bending or folding, usually with steadily applied forces. In some in-stances the test may involve blows to a specimen having a cross section that is essentially uniform over a length several times as great as the largest dimension of the cross section. Binomial Random Variable -- The number of successes in independent trials where the probability of success is the same for each trial. Brittleness – tendency to fracture with little or no plastic deformation and with little energy absorbed.
MIL-HDBK-17-4A Volume 4, Section 1 Guidelines
18
Buckling (Composite) -- A mode of structural response characterized by an out-of-plane material deflection due to compressive action on the structural element involved. In advanced composites, buck-ling may take the form not only of conventional general instability and local instability but also a micro-instability of individual fibers. Bundle -- A general term for a collection of essentially parallel fibers or fibers. Casting – The process of making a shape by the transfer of a liquid material into a mold and allowing it to solidify. Carbon Fibers – Fibers produced by the pyrolysis of organic precursor fibers such as rayon, polyacry-lonitrile (PAN), and pitch in an inert atmosphere. Censoring -- Data is right (left) censored at M, if, whenever an observation is less than or equal to M (greater than or equal to M), the actual value of the observation is recorded. If the observation exceeds (is less than) M, the observation is recorded as M. CMC – Ceramic Matrix Composite. A material consisting of two or more constituents where a ceramic matrix is normally the principal component and the additional constituents are incorporated to strengthen, toughen, and / or enhance the thermophysical properties. Coating – A material applied to the surface of another material, known as the substrate, for the pur-pose of modifying the properties of the substrate; the process of applying a coating. Coefficient of Linear Thermal Expansion -- The change in length per unit length resulting from a one-degree rise in temperature. Coefficient of Variation -- The ratio of the population (or sample) standard deviation to the population (or sample) mean. Collimated -- Rendered parallel. Composite Material -- Composites are considered to be combinations of materials differing in com-position or form on a macroscale. The materials retain their identities in the composite; that is, they do not dissolve or otherwise merge completely into each other although they act in concert. Normally, these ma-terials can be physically identified and exhibit an interface between one another. Confidence Coefficient -- See Confidence Interval. Confidence Interval -- A confidence interval is defined by a statement of one of the following forms:
(1) P a < ≤ −θ αk p 1 (2) P bθ α< ≤ −k p 1 (3) P a b< < ≤ −θ αk p 1
where 1-α is called the confidence coefficient. A statement of type (1) or (2) is called a one-sided confi-dence interval and a statement of type (3) is called a two-sided confidence interval. In (1) a is a lower con-fidence limit and in (2) b is an upper confidence limit. With probability at least 1-α , the confidence interval will contain the parameter θ. Consolidation -- The process of creating a composite material or structure by combining matrix and reinforcement constituents into a single solid material form. Constituent -- In metal matrix composites, an element of a larger grouping. In advanced composites, the principal constituents are the reinforcement and the matrix.

MIL-HDBK-17-4A Volume 4, Section 1 Guidelines
19
Continuous Fiber -- A yarn or monofilament which spans the dimension of the test specimen. Corrosion -- A process of deterioration by chemical reaction in an environment containing a liquid. Creep -- The time dependent part of permanent strain resulting from an applied stress. Creep, Rate Of -- The slope of the creep-time curve at a given time. Critical Value(s) -- When testing a one-sided statistical hypothesis, a critical value is the value such that, if the test statistic is greater than (less than) the critical value, the hypothesis is rejected. When Cumulative Distribution Function -- See Volume 1, Section 8.1.4. Chemical Vapor Deposition -- A process for depositing a solid material on a surface as a result of chemical reactions at the surface involving gaseous reactants. Crossply -- Any filamentary laminate which is not uniaxial. Same as Angleply. In some References, the term crossply is used to designate only those laminates in which the laminae are at right angles to one another, while the term angleply is used for all others. Debond -- A deliberate separation of a bonded joint or interface, usually for repair or rework pur-poses. Any separation of an interface between constituents in a composite. testing a two-sided statistical hypothesis, two critical values are determined. If the test statistic is either less than the smaller critical value or greater than the larger critical value, then the hypothesis is rejected. In both cases, the critical value chosen depends on the desired risk (often 0.05) of rejecting the hypothesis when it is true. Deformation -- The change in shape of a material. Degradation -- A deleterious change in chemical structure, physical properties or appearance. Delamination -- The separation of the layers of material in a laminate. This may be local or may cover a large area of the laminate. It may occur at any time in the fabrication or subsequent life of the laminate and may arise from a wide variety of causes. Denier -- A direct numbering system for expressing linear density, equal to the mass in grams per 9000 meters of yarn, fiber, fiber, or other textile strand. Density -- The mass per unit volume. Deviation -- Variation from a specified dimension or requirement, usually defining the upper and lower limits. Diffusion Bonding -- A process of joining two materials in the solid state by bring their two surfaces into close contact and allowing chemical diffusion to aid in developing an interface bond. Discontinuous Reinforcement -- Reinforcement constituents with aspect ratios less than 50 to 1; eg., particles or whiskers; may also designate fibers which do not span a dimension of the material. Distribution -- A formula which gives the probability that a value will fall within prescribed limits. (See Normal, Weibull, and Lognormal Distributions, also Volume 1, Section 8.1.4). Ductility -- The ability of a material to deform plastically before fracturing; a measure of ductility ex-pressed as a percentage of elongation in a tensile test. Elasticity -- The property of a material which allows it to recover its original size and shape immedi-ately after removal of the force causing deformation.

MIL-HDBK-17-4A Volume 4, Section 1 Guidelines
20
Elastic Limit -- The apparent stress value at which elastic behavior is no longer observed; value of which is dependent upon the precision of strain measurement. Elongation -- The increase in gage length or extension of a specimen during a tension test, usually expressed as a percentage of the original gage length. End -- A single fiber, strand, roving or yarn being or already incorporated into a product. An end may be an individual warp yarn or cord in a woven fabric. In referring to aramid and glass fibers, an end is usually an untwisted bundle of continuous fibers. Extensometer -- A device for measuring linear strain. Fatigue -- Phenomena involving the accumulation of material damage under cyclic loading conditions. Fatigue Crack Propagation Rate -- The rate of extension of a fatigue crack per cycle of stain; fre-quently referred to as da/dn. Fatigue Damage -- Cumulative deterioration in the form of either microscopic or macroscopic defects introduced by cyclic stressing. Fatigue Limit -- Cyclic stress amplitude below which fatigue failure does not occur. F-Distribution -- See Volume 1, Section 8.1.4. Fiber -- A general term used to refer to filamentary materials. Often, fiber is used synonymously with filament. It is a general term for a fiber of finite length. A unit of matter, either natural or manmade, which forms the basic element of fabrics and other textile structures. Fiber Content -- The amount of fiber present in a composite. This is usually expressed as a percent-age volume fraction or weight fraction of the composite. Fiber Count -- The number of fibers per unit width of ply present in a specified section of a compos-ite. Fiber Direction -- The orientation or alignment of the longitudinal axis of the fiber with respect to a stated Reference axis. Fiber System -- The type and arrangement of fibrous material which comprises the fiber constituent of an advanced composite. Examples of fiber systems are collimated fibers or fiber yarns, woven fabric, randomly oriented short-fiber ribbons, random fiber mats, whiskers, etc. Filament -- The smallest unit of a fibrous material. The basic units formed during spinning and which are gathered into strands of fiber, (for use in composites). Filaments usually are of extreme length and of very small diameter. Filaments normally are not used individually. Some textile filaments can function as a yarn when they are of sufficient strength and flexibility. Filamentary Composites -- A major form of advanced composites in which the fiber constituent con-sists of continuous filaments. Specifically, a filamentary composite is a laminate comprised of a number of laminae, each of which consists of a nonwoven, parallel, uniaxial, planar array of filaments (or filament yarns) embedded in the selected matrix material. Individual laminae are directionally oriented and com-bined into specific multiaxial laminates for application to specific envelopes of strength and stiffness re-quirements. Fixed Effect -- A systematic shift in a measured quantity due to a particular level change of a treat-ment or condition. (See Volume 1, Section 8.1.4.)

MIL-HDBK-17-4A Volume 4, Section 1 Guidelines
21
Flash -- Excess material which forms at the parting line of a mold or die, or which is extruded from a closed mold. Foil-Fiber-Foil -- Fabrication approach for continuously reinforced MMCs in which fibers are affixed between two layers of metal foil and diffusion bonded to create a sandwich like structure. Forming -- A secondary manufacturing process which employs temperature and mechanical force to induce permanent plastic deformation and change of shape. Fracture Ductility -- The true plastic strain at fracture. Fracture Toughness -- A material property that reflects the material’s resistance to crack propaga-tion; often refers to the plain strain fracture toughness, KIC. Gage Length -- the original length of that portion of the specimen over which strain or change of length is determined. Graphite Fibers -- See Carbon Fibers. Hand Lay-up -- A process in which components are applied either to a mold or a working surface, and the successive plies are built up and worked by hand. Hardness -- Resistance to deformation; usually measured by indention. Types of standard tests in-clude Brinell, Rockwell, Knoop, and Vickers. Heterogeneous -- Descriptive term for a material consisting of dissimilar constituents separately iden-tifiable; a medium consisting of regions of unlike properties separated by internal boundaries. (Note that all nonhomogeneous materials are not necessarily heterogeneous). Homogeneous -- Descriptive term for a material of uniform composition throughout; a medium which has no internal physical boundaries; a material whose properties are constant at every point, in other words, constant with respect to spatial coordinates (but not necessarily with respect to directional coordi-nates). Horizontal Shear -- Sometimes used to indicate interlaminar shear. This is not an approved term for use in this handbook. Hot Pressing – Manufacturing process using temperature and uniaxial pressing to achieve consolida-tion of a composite material. Humidity, Relative -- The ratio of the pressure of water vapor present to the pressure of saturated water vapor at the same temperature. Hybrid -- A composite laminate comprised of laminae of two or more composite material systems. Or, a combination of two or more different fibers such as carbon and glass or carbon and aramid into a structure (tapes, fabrics and other forms may be combined). Hysteresis -- The energy absorbed in a complete cycle of loading and unloading. Inclusion -- A physical and mechanical discontinuity occurring within a material or part, usually con-sisting of solid, encapsulated and undesirable second phase material. Inclusions are often capable of transmitting some structural stresses and energy fields, but in a noticeably different manner from the par-ent material.

MIL-HDBK-17-4A Volume 4, Section 1 Guidelines
22
Integral Composite Structure -- Composite structure in which several structural elements, which would conventionally be assembled by bonding or with mechanical fasteners after separate fabrication, are instead laid up and cured as a single, complex, continuous structure; e.g., spars, ribs, and one stiff-ened cover of a wing box fabricated as a single integral part. The term is sometimes applied more loosely to any composite structure not assembled by mechanical fasteners. Interface -- The boundary between the individual, physically distinguishable constituents of a composite; often refers to the boundary between the reinforcement and the matrix. Interlaminar -- Descriptive term pertaining to some object (e.g., voids), event (e.g., fracture), or po-tential field (e.g., shear stress) Referenced as existing or occurring between two or more adjacent lami-nae. Interlaminar Shear -- Shearing force tending to produce a relative displacement between two laminae in a laminate along the plane of their interface. Intermediate Bearing Stress -- The bearing stress at the point on the bearing load-deformation curve where the tangent is equal to the bearing stress divided by a designated percentage (usually 4%) of the original hole diameter. Intralaminar -- Descriptive term pertaining to some object (e.g., voids), event (e.g., fracture), or po-tential field (e.g., temperature gradient) existing entirely within a single lamina without Reference to any adjacent laminae. Isostatic Pressing -- Application of hydrostatic pressure in the process of densifying a solid material; typically accomplished at RT (CIP) by pressurizing with a liquid medium or at elevated temperature (HIP) by pressurizing with a gaseous medium. Isotropic -- Having uniform properties in all directions. The measured properties of an isotropic ma-terial are independent of the axis of testing. k-Sample Data -- A collection of data consisting of values observed when sampling from k batches. Lamina -- A single ply or layer in a laminate made up of a series of layers or unidirectional ply(ies). Laminae -- Plural of lamina. Laminate -- A product made by bonding together two or more laminae non-unidirectionally. Laminate Orientation -- The configuration of a crossplied composite laminate with regard to the an-gles of crossplying, the number of laminae at each angle, and the exact sequence of the lamina lay-up. Lay-up -- A process of fabrication involving the assembly of successive layers of fiber matrix. Liquid Metal Infiltration -- A fabrication process in which liquid metal is introduced into the interstices of reinforcement constituents to form a composite material. Lognormal Distribution -- A probability distribution for which the probability that an observation se-lected at random from this population falls between a and b (0 < a < b < B) is given by the area under the normal distribution between log a and log b. The common (base 10) or the natural (base e) logarithm may be used. (See Volume 1, Section 8.1.4.) Lot – A reinforcement, matrix or composite formed during the same manufacturing process. A com-posite lot by definition is made up of the same lots of reinforcements and matrix. Lower Confidence Bound -- See Confidence Interval.

MIL-HDBK-17-4A Volume 4, Section 1 Guidelines
23
Macro -- In relation to composites, denotes the gross properties of a composite as a structural ele-ment but does not consider the individual properties or identity of the constituents. Macrostrain -- The mean strain over any finite gage length of measurement which is large in com-parison to the material's interatomic distance. Mandrel – A fixture or male mold used for the base in the production of a part by lay-up, filament winding or braiding. Material Acceptance -- The testing of incoming material to ensure that it meets requirements. Material Qualification -- The procedures used to accept a material by a company or organization for production use. Material System -- A specific composite material made from specifically identified constituents in specific geometric proportions and arrangements and possessed of numerically defined properties. Material System Class -- As used in this handbook, a group consisting of material systems catego-rized by the same generic constituent materials, but without defining the constituents uniquely; e.g., the carbon/epoxy class. Material Variability -- A source of variability due to the spatial and consistency variations of the mate-rial itself and due to variation in its processing. Matrix -- The essentially homogeneous material in which the fiber system of a composite is embed-ded. Mean -- See Sample Mean and Population Mean. Mechanical Properties -- The properties of a material that are associated with elastic and inelastic reaction when force is applied, or the properties involving the relationship between stress and strain. Median -- See Sample Median and Population Median. Meso --In relation to composites, denotes an intermediate scale of structure between micro- and macro-. Micro -- In relation to composites, denotes the properties of the constituents, i.e., matrix and rein-forcement and interface only, as well as their effects on the composite properties. Microhardness -- measurement of hardness in a material at a microscale level; typically involves ex-amining individual phases or grains. Microstrain -- The strain over a gage length comparable to the material's interatomic distance. Microstructure -- the structure of a material at the microscopic level; prefix micro- designates 1 part in a million. Modulus, Chord -- The slope of the chord drawn between any two specified points on the stress-strain curve. Modulus, Initial -- The slope of the initial straight portion of a stress-strain curve. Modulus, Secant -- The slope of the secant drawn from the origin to any specified point on the stress-strain curve.

MIL-HDBK-17-4A Volume 4, Section 1 Guidelines
24
Modulus, Tangent -- The ratio of change in stress to change in strain derived from the tangent to any point on a stress-strain curve. Modulus, Young's -- The ratio of change in stress to change in strain below the elastic limit of a ma-terial. (Applicable to tension and compression). Modulus of Rigidity (also Shear Modulus or Torsional Modulus) -- The ratio of stress to strain below the proportional limit for shear or torsional stress. Modulus of Rupture, in Bending -- The maximum tensile or compressive stress (whichever causes failure) value in the extreme fiber of a beam loaded to failure in bending. The value is computed from the flexure equation:
bF = Mc
I 1.1.7(a)
where M = maximum bending moment computed from the maximum load and the original moment arm, c = initial distance from the neutral axis to the extreme fiber where failure occurs, I = the initial moment of inertia of the cross section about its neutral axis. Modulus of Rupture, in Torsion -- The maximum shear stress in the extreme fiber of a member of circular cross section loaded to failure in torsion calculated from the equation:
sF = Tr
J 1.1.7(b)
where T = maximum twisting moment, r = original outer radius, J = polar moment of inertia of the original cross section. Monolayer -- The basic laminate unit from which crossplied or other laminates are constructed. Monotape -- the simplest form of a continuously reinforced composite in which a single layer of rein-forcement is imbedded in a metal matrix to produce a tape or ribbon like material. NDE -- Nondestructive evaluation. Broadly considered synonymous with NDI. NDI -- Nondestructive inspection. A process or procedure for determining the quality or characteris-tics of a material, part, or assembly without permanently altering the subject or its properties. NDT -- Nondestructive testing. Broadly considered synonymous with NDI. Neat Matrix -- Unreinforced matrix manufactured similar to the composite. Necking -- A localized reduction in cross-sectional area which may occur in a material under tensile stress. Negatively Skewed -- A distribution is said to be negatively skewed if the distribution is not symmetric and the longest tail is on the left. Nominal Specimen Thickness -- The nominal ply thickness multiplied by the number of plies. Nominal Value -- A value assigned for the purpose of a convenient designation. A nominal value ex-ists in name only.

MIL-HDBK-17-4A Volume 4, Section 1 Guidelines
25
Normal Distribution -- A two parameter (µ,σ) family of probability distributions for which the probabil-ity that an observation will fall between a and b is given by the area under the curve between a and b. (See Volume 1, Section 8.1.4.)
f(x) = 1
2exp -
(x- )
2
2
2σ πµσ
LNMM
OQPP 1.1.7(c)
Normalization -- A mathematical procedure for adjusting raw test values for fiber-dominated proper-ties to a single (specified) fiber volume content. Normalized Stress -- Stress value adjusted to a specified fiber volume content by multiplying the measured stress value by the ratio of specimen fiber volume to the specified fiber volume. This ratio may be obtained directly by experimentally measuring fiber volume, or indirectly by calculation using specimen thickness and fiber areal weight. Observed Significance Level (OSL) -- The probability of observing a more extreme value of the test statistic when the null hypotheses is true. Offset Shear Strength --- (from valid execution of a material property shear response test) the value of shear stress at the intersection between a line parallel to the shear chord modulus of elasticity and the shear stress/strain curve, where the line has been offset along the shear strain axis from the origin by a specified strain offset value. One-Sided Tolerance Limit Factor -- See Tolerance Limit Factor. Orthotropic -- Having three mutually perpendicular planes of symmetry. PAN Fibers -- Reinforcement fiber derived from the controlled pyrolysis of poly(acrylonitrile) fiber. Parallel Laminate -- A laminate of woven fabric in which the plies are aligned in the same position as originally aligned in the fabric roll. Particulate -- In relation to composites, refers to the finely divided form of either matrix or reinforce-ment material characterized by a low aspect ratio near unity. pH -- A measure of acidity or alkalinity of a solution, with neutrality represented by a value of 7, with increasing acidity corresponding to progressively smaller values, and increasing alkalinity corresponding to progressively higher values. Phase Transformation -- A change in either the physical state ( i.e., Liquid to solid) or solid-to-solid changes such as in precipitation during heat treatment. Physical Properties -- Material properties other than mechanical properties such as thermal expan-sion coefficient, magnetic susceptibility, heat capacity, density, etc. Pitch Fibers -- Reinforcement fiber derived from petroleum or coal tar pitch. Plasma Spray -- a manufacturing process in which fully or partially melted material is projected through a plasma arc at a surface on which it solidifies. Plied Yarn -- A yarn formed by twisting together two or more single yarns in one operation. Poisson's Ratio -- The absolute value of the ratio of transverse strain to the corresponding axial strain resulting from uniformly distributed axial stress below the proportional limit of the material.

MIL-HDBK-17-4A Volume 4, Section 1 Guidelines
26
Population -- The set of measurements about which inferences are to be made or the totality of pos-sible measurements which might be obtained in a given testing situation. For example, "all possible ulti-mate tensile strength measurements for carbon/epoxy system A, conditioned at 95% relative humidity and room temperature". In order to make inferences about a population, it is often necessary to make as-sumptions about its distributional form. The assumed distributional form may also be referred to as the population. (See Volume 1, Section 8.1.4.) Population Mean -- The average of all potential measurements in a given population weighted by their relative frequencies in the population. (See Volume 1, Section 8.1.4.) Population Median -- That value in the population such that the probability of exceeding it is 0.5 and the probability of being less than it is 0.5. (See Volume 1, Section 8.1.4.) Population Variance -- A measure of dispersion in the population. Porosity -- A condition of trapped pockets of air, gas, or vacuum within a solid material, usually ex-pressed as a percentage of the total nonsolid volume to the total volume (solid plus nonsolid) of a unit quantity of material. Positively Skewed -- A distribution is said to be positively skewed if the distribution is not symmetric and the longest tail is on the right. Powder -- see Particulate; the term powder is commonly used in powder metallurgy referring to the particulate form of the metal. Precision -- The degree of agreement within a set of observations or test results obtained. Precision involves repeatability and reproducibility. Preform -- An assembly of fibers which has been prepared for one of several different infiltration methods. A preform may be stitched or stabilized in some other way to hold its shape. Pressure -- The force or load per unit area in triaxial loading condition. Probability Density Function -- See Volume 1, Section 8.1.4. Proportional Limit -- The maximum stress that a material is capable of sustaining without any devia-tion from the proportionality of stress to strain (also known as Hooke's law). Quasi-Isotropic Laminate -- A laminate approximating isotropy by orientation of plies in several or more directions. Random Effect -- A shift in a measured quantity due to a particular level change of an external, usu-ally uncontrollable, factor. Random Error -- That part of the data variation that is due to unknown or uncontrolled factors and that affects each observation independently and unpredictably. Reduction of Area -- The difference between the original cross sectional area of a tension test specimen and the area of its smallest cross section, usually expressed as a percentage of the original area. Reinforcement -- In relation to MMCs, the reinforcement is the constituent added to achieve benefi-cial composite properties such as stiffness, strength, hardness, etc. Roving -- A number of strands, tows, or ends collected into a parallel bundle with little or no twist. In spun yarn production, an intermediate state between sliver and yarn.

MIL-HDBK-17-4A Volume 4, Section 1 Guidelines
27
Run-out – A terminated fatigue test where the applied cycles meet or exceed a predetermined cycle limit that represents demonstration of being at or below a fatigue limit stress level. S-Basis (or S-Value) -- The mechanical property value which is usually the specified minimum value of the appropriate government specification or SAE Aerospace Material Specification for this material. Sample -- A small portion of a material or product intended to be representative of the whole. Statisti-cally, a sample is the collection of measurements taken from a specified population. Sample Mean -- The arithmetic average of the measurements in a sample. The sample mean is an estimator of the population mean. Sample Median -- Order the observation from smallest to largest. Then the sample median is the value of the middle observation if the sample size is odd; the average of the two central observations if n is even. If the population is symmetric about its mean, the sample median is also an estimator of the population mean. Sample Standard Deviation -- The square root of the sample variance. Sample Variance -- The sum of the squared deviations from the sample mean, divided by n-1. Sandwich Construction -- A structural panel concept consisting in its simplest form of two relatively thin, parallel sheets of structural material bonded to, and separated by, a relatively thick, light-weight core. Set -- The strain remaining after complete release of the force producing the deformation. Shear Fracture (for crystalline type materials) -- A mode of fracture resulting from translation along slip planes which are preferentially oriented in the direction of the shearing stress. Short Beam Strength (SBS) -- A test result from valid execution of ASTM test method D 2344. Significant -- Statistically, the value of a test statistic is significant if the probability of a value at least as extreme is less than or equal to a predetermined number called the significance level of the test. Significant Digit -- Any digit that is necessary to define a value or quantity. Skewness -- See Positively Skewed, Negatively Skewed. Slenderness Ratio -- The unsupported effective length of a uniform column divided by the least ra-dius of gyration of the cross-sectional area. Sliver -- A continuous strand of loosely assembled fiber that is approximately uniform in cross-sectional area and has no twist. Slurry Infiltration -- A manufacturing process in which partially solidified metal matrix material is in-troduced into the interstices of the reinforcement. Solidification -- A phase change from liquid to solid that occurs at a fixed, constant temperature for a pure substance and normally over a temperature range for a multi-component alloy. Specific Gravity -- The ratio of the weight of any volume of a substance to the weight of an equal vol-ume of another substance taken as standard at a constant or stated temperature. Solids and liquids are usually compared with water at 39°F (4°C).

MIL-HDBK-17-4A Volume 4, Section 1 Guidelines
28
Specific Heat -- The quantity of heat required to raise the temperature of a unit mass of a substance one degree under specified conditions. Specimen -- A piece or portion of a sample or other material taken to be tested. Specimens normally are prepared to conform with the applicable test method. Standard Deviation -- See Sample Standard Deviation. Staple -- Either naturally occurring fibers or lengths cut from fibers. Strain -- The per unit change, due to force, in the size or shape of a body referred to its original size or shape. Strain is a nondimensional quantity, but it is frequently expressed in inches per inch, meters per meter, or percent. Strand -- Normally an untwisted bundle or assembly of continuous fibers used as a unit, including slivers, tow, ends, yarn, etc. Strength -- The maximum stress which a material is capable of sustaining. Stress -- The intensity at a point in a body of the forces or components of forces that act on a given plane through the point. Stress is expressed in force per unit area (pounds-force per square inch, mega-pascals, etc.). Stress Relaxation -- The time dependent decrease in stress in a solid under given constraint condi-tions. Stress-Strain Curve (Diagram) -- A graphical representation showing the relationship between the change in dimension of the specimen in the direction of the externally applied stress and the magnitude of the applied stress. Values of stress usually are plotted as ordinates (vertically) and strain values as ab-scissa (horizontally). Structural Element -- a generic element of a more complex structural member (for example, skin, stringer, shear panels, sandwich panels, joints, or splices). Structured Data -- see Volume 1, Section 8.1.4 Symmetrical Laminate -- A composite laminate in which the sequence of plies below the laminate midplane is a mirror image of the stacking sequence above the midplane. Tenacity -- The tensile stress expressed as force per unit linear density of the unstrained specimen i.e., grams-force per denier or grams-force per tex. Terminated Test – A test that was stopped prior to failure. Tex -- A unit for expressing linear density equal to the mass or weight in grams of 1000 meters of fiber, yarn or other textile strand. Thermal Conductivity -- Ability of a material to conduct heat. The physical constant for quantity of heat that passes through unit cube of a substance in unit time when the difference in temperature of two faces is one degree. Thermal Fatigue -- The process of fatigue under thermal cycling conditions. Tolerance -- The total amount by which a quantity is allowed to vary.

MIL-HDBK-17-4A Volume 4, Section 1 Guidelines
29
Tolerance Limit -- A lower (upper) confidence limit on a specified percentile of a distribution. For ex-ample, the B-basis value is a 95% lower confidence limit on the tenth percentile of a distribution. Tolerance Limit Factor -- The factor which is multiplied by the estimate of variability in computing the tolerance limit. Toughness – See Fracture Toughness. The term toughness is also sometimes used to designate the area under the load-elongation curve from the origin to the breaking point. Tow -- An untwisted bundle of continuous fibers. Commonly used in referring to man-made fibers, particularly carbon and graphite fibers, in the composites industry. Transformation (Data) -- A transformation of data values is a change in the units of measurement accomplished by applying a mathematical function to all data values. For example, if the data is given by x, then y = x + 1, x , 1/x, log x, and cos x are transformations. Transformation ( Phase ) -- See Phase Transformation Transversely Isotropic -- Descriptive term for a material exhibiting a special case of orthotropy in which properties are identical in two orthotropic dimensions, but not the third; having identical properties in both transverse directions but not the longitudinal direction. Twist -- The number of turns about its axis per unit of length in a yarn or other textile strand. It may be expressed as turns per inch (tpi) or turns per centimeter (tpcm). Twist, Direction of -- The direction of twist in yarns and other textile strands is indicated by the capital letters S and Z. Yarn has S twist if, when held in a vertical position, the visible spirals or helices around its central axis are in the direction of slope of the central portion of the letter S, and Z twist is in the other di-rection. Typical Basis -- A typical property value is a sample mean. Note that the typical value is defined as the simple arithmetic mean which has a statistical connotation of 50% reliability with a 50% confidence. Ultimate Strength -- The maximum stress ( tensile, compressive or shear) a material can sustain without fracture; determined by dividing the maximum load in such a test by the original cross sectional area of the specimen. Unidirectional Laminate -- A laminate with all layers laid up in the same direction. Unstructured Data -- See Volume 1, Section 8.1.4. Upper Confidence Limit -- See Confidence Interval. Variance -- See Sample Variance. Viscosity -- The property of resistance to fluid-like flow exhibited within the body of a material Void -- A physical and mechanical discontinuity occurring within a material or part which may be two-dimensional (e.g., disbonds, delaminations) or three-dimensional (e.g., vacuum-, air-, or gas-filled pock-ets). Porosity is an aggregation of micro-voids. Voids are essentially incapable of transmitting structural stresses or nonradiative energy fields. (See Inclusion.) Weibull Distribution (Two - Parameter) -- A probability distribution for which the probability that a randomly selected observation from this population lies between a and b (0 < a < b < ∞) is given by Equa-tion 1.1.7(d) where α is called the scale parameter and β is called the shape parameter. (See Volume 1, Section 8.1.4.)

MIL-HDBK-17-4A Volume 4, Section 1 Guidelines
30
exp -a
- exp -bβ β
α αFHGIKJ
LNMMOQPP
FHGIKJ
LNMMOQPP 1.1.7(d)
Whisker -- A short single fiber. Whiskers have diameters typically from 1 to 25 microns, and have aspect ratios less than 50. Yarn -- A generic term for strands or bundles of continuous fibers, usually twisted and suitable for making textile fabric. Yarn, Plied -- Yarns made by collecting two or more single yarns together. Normally, the yarns are twisted together though sometimes they are collected without twist. Yield Strength -- The stress at which a material exhibits a specified limiting deviation from the propor-tionality of stress to strain. (The deviation is expressed in terms of strain such as 0.2 percent for the Off-set Method or 0.5 percent for the Total Extension Under Load Method.) X-Axis -- In composite laminates, an axis in the plane of the laminate which is used as the 0 degree Reference for designating the angle of a lamina. X-Y Plane -- In composite laminates, the Reference plane parallel to the plane of the laminate. Y-Axis -- In composite laminates, the axis in the plane of the laminate which is perpendicular to the x-axis. Z-Axis -- In composite laminates, the Reference axis normal to the plane of the laminate.

MIL-HDBK-17-4A Volume 4, Section 1 Guidelines
31
REFERENCES 1.1.6(a) Military Standardization Handbook, Metallic Materials and Elements for Aerospace Vehicle
Structures, MIL-HDBK-5F, 1 November 1990. 1.1.6(b) DoD/NASA Advanced Composites Design Guide, Air Force Wright Aeronautical Laboratories,
Dayton, OH, prepared by Rockwell International Corporation, 1983 (distribution limited). 1.1.6(c) ASTM E 206, "Definitions of Terms Relating to Fatigue Testing and the Statistical Analysis of
Fatigue Data," Annual Book of ASTM Standards, Vol 3.01, American Society for Testing and Materials, West Conshohocken, PA, 1984.
1.1.6.3(a) ASTM E 380, "Standard for Metric Practice," Annual Book of ASTM Standards, Vol 14.01,
American Society for Testing and Materials, West Conshohocken, PA, 1984. 1.1.6.3(b) Engineering Design Handbook: Metric Conversion Guide, DARCOM P 706-470, July 1976. 1.1.6.3(c) The International System of Units (SI), NBS Special Publication 330, National Bureau of Stan-
dards, 1986 edition. 1.1.6.3(d) Units and Systems of Weights and Measures, Their Origin, Development, and Present Status,
NBS Letter Circular LC 1035, National Bureau of Standards, November 1985. 1.1.6.3(e) The International System of Units Physical Constants and Conversion Factors, NASA Special
Publication 7012, 1964.

MIL-HDBK-17-4A Volume 4, Section 1 Guidelines
32
1.2 INTRODUCTION TO MMC MATERIALS 1.2.1 INTRODUCTION This Materials and Processes, M&P, Section 1.2, is intended to provide a condensed, designer ori-ented, introduction and overview of the various MMC materials (including their constituent matrices and reinforcements) and the typical processes used in their consolidation and subsequent fabrication. The emphasis in Section 1.2 is on making clear the distinctions between the various M&P considera-tions in MMC, polymer matrix composites (PMC), and ceramic matrix composites (CMC). Just as there are very significant differences between the monolithic unreinforced metals and monolithic polymers and ceramics, similar differences exist between MMC, PMC, and CMC. Such differences are manifested in: a.) the nature and type of constituents, b.) the consolidation and processing approaches and c.) their re-sulting engineering physical and mechanical property attributes and liabilities. Although MMCs are relative newcomers to the regime of modern engineered materials for advanced design, one can expect continuing improvements in both the understanding and predictability of their de-sign and performance characteristics. Improvements in their affordability and availability will also lead to significant future design utilization. The scope of MMCs included in this Section 1.2 includes all MMC materials either currently available commercially or under advanced development and of current or anticipated future design interest. Not included in this section are those "model" system MMC materials developed for basic research and not intended for commercialization and technology transfer/implementation in their present form. 1.2.2 MMC SYSTEMS 1.2.2.1 Systems definitions A metal matrix composite system is generally designated simply by the metal alloy designation of the matrix and the material type, volume fraction and form of the ceramic reinforcement. For example, 6061Al/ 30v/o SiCp designates a discontinuously reinforced 6061 Aluminum Alloy with 30 volume percent Silicon
Carbide particulate reinforcement. A continuously reinforced MMC may be designated by SiCf, for example. These designations do not fully describe the composite system since they provide no information on the basic consolidation process ( ingot or powder metallurgical consolidation), subsequent thermal treatment, or specific fiber orientations , for example. 1.2.2.2 Distinction from other materials/composites MMCs differ from other composite materials in several ways. Some of these general distinctions are as follows:
1. The matrix phase of an MMC is either a pure or alloy metal as opposed to a polymer or ceramic. 2. MMCs evidence higher ductility and toughness than ceramics or CMCs, although they have lower
ductility and toughness than their respective unreinforced metal matrix alloys. 3. The role of the reinforcement in MMCs is to increase strength and modulus as is the case with
PMCs. Reinforcement in CMCs is generally to provide improved damage tolerance. 4. MMCs have a temperature capability generally higher than polymers and PMCs but less than ce-
ramics and CMCs. 5. Low to moderately reinforced MMCs are formable by processes normally associated with unrein-
forced metals. 1.2.3 MATRIX MATERIALS Metals are extremely versatile engineering materials. A metallic material can exhibit a wide range of readily controllable properties through appropriate selection of alloy composition and thermomechanical

MIL-HDBK-17-4A Volume 4, Section 1 Guidelines
33
processing method. The extensive use of metallic alloys in engineering reflects not only their strength and toughness but also the relative ease and low cost of fabrication of engineering components by a wide range of manufacturing processes. The development of MMCs has reflected the need to achieve property combinations beyond those attainable in monolithic metals alone. Thus, tailored composites resulting from the addition of reinforcements to a metal may provide enhanced specific stiffness coupled with im-proved fatigue and wear resistance, or perhaps increased specific strength combined with desired thermal characteristics (e.g., reduced thermal expansion coefficient and conductivity) in the resulting MMC. How-ever, the cost of achieving property improvements remains a challenge in many potential MMC applica-tions. MMCs involve distinctly different property combinations and processing procedures as compared to either PMCs or CMCs. This is largely due to the inherent differences among metals, polymers and ceram-ics as matrix materials and less so to the nature of the reinforcements employed. Pure metals are opaque, lustrous chemical elements and are generally good conductors of heat and electricity. When pol-ished, they tend to reflect light well. Also, most metals are ductile but are relatively high in density. These characteristics reflect the nature of atom bonding in metals, in which the atoms tend to lose electrons; the resulting free electron "gas" then holds the positive metal ions in place. In contrast, ceramic and poly-meric materials are chemical compounds of elements. Bonding in ceramics and intramolecular bonding in polymers is characterized by either sharing of electrons between atoms or the transfer of electrons from one atom to another. The absence of free electrons in ceramics and polymers (no free electrons are formed in polymers due to intermolecular van der Waals bonding) results in poor conductivity of heat and electricity, and lower deformability and toughness in comparison to metallic materials. 1.2.3.1 Role of matrix materials The choice of a matrix alloy for an MMC is dictated by several considerations. Of particular impor-tance is whether the composite is to be continuously or discontinuously reinforced. The use of continuous fibers as reinforcements may result in transfer of most of the load to the reinforcing filaments and hence composite strength will be governed primarily by the fiber strength. The primary roles of the matrix alloy, then are to provide efficient transfer of load to the fibers and to blunt cracks in the event that fiber failure occurs and so the matrix alloy for a continuously reinforced MMC may be chosen more for toughness than for strength. On this basis, lower strength, more ductile, and tougher matrix alloys may be utilized in con-tinuously reinforced MMCs. For discontinuously reinforced MMCs, the matrix may govern composite strength. Then, the choice of matrix will be influenced by consideration of the required composite strength and higher strength matrix alloys may be required. Additional considerations in the choice of the matrix include potential reinforcement/matrix reactions, either during processing or in service, that might result in degraded composite performance; thermal stresses due to thermal expansion mismatch between the reinforcements and the matrix; and the influ-ence of matrix fatigue behavior on the cyclic response of the composite. Indeed, the behavior of MMCs under cyclic loading conditions is an area requiring special consideration. In MMCs intended for use at elevated temperatures, an additional consideration is the difference in melting temperatures between the matrix and the reinforcements. A large melting temperature difference may result in matrix creep while the reinforcements remain elastic, even at temperatures approaching the matrix melting point. However, creep in both the matrix and reinforcement must be considered when there is a small melting point differ-ence in the composite. 1.2.3.2 Forms of matrix materials Metals are routinely available in a wide variety of product forms intended for subsequent manufactur-ing operations. These forms include remelting stock for casting, wrought materials including wire, foil, sheet, bar, plate, a wide variety of extruded shapes, and powder. Many of these different forms are em-ployed in the manufacturing of MMCs. Melt processing methods such as liquid metal infiltration require remeltable compositions. Foil/fiber/foil methods require matrix foil in appropriate thicknesses (typically 0.1 mm or 0.004 inch); in general, foil refers to a flat rolled product of thickness less than 0.012 inch (0.3 mm). Such thickness is readily attainable by rolling of many ductile matrix alloys but may require special rolling methods for less workable alloys. Most metals can be reduced to powder by a variety of methods.

MIL-HDBK-17-4A Volume 4, Section 1 Guidelines
34
1.2.3.3 Types of matrix materials Many MMC applications involve considerations other than strength alone - e.g., electrical contacts - and so there are corresponding requirements for many types of matrix materials. Pure metals generally are soft and weak as well as being high in electrical and thermal conductivity. This is because the factors which result in easy plastic deformation and low strength with high ductility also allow for ready motion of free electrons and, therefore, high electrical and thermal conductivity. Thus, applications requiring high thermal or electrical conductivity combined with high strength and resistance to wear, e.g., contact points, may employ pure metal matrices with ceramic reinforcements. In recent years there has been a growing emphasis on alloy compositions near to those of certain in-termetallic compounds such as Titanium Aluminides. Such intermetallic compounds and the alloys based on them often exhibit attractive combinations of low density, high melting point and high strength at ele-vated temperatures. On the other hand, the ductility of such compounds is generally poor since bonding is often covalent or ionic in character rather than metallic. Matrix alloys are also classified according to melting temperature. Exceptionally high melting tem-peratures such as found with Mo, Nb, and W are termed refractory, meaning difficult to melt. Metals such as Fe, Ni, and Cu are considered to exhibit ordinary melting behavior while Al and Mg are relatively lower temperature melting materials. Many different metals have been employed in MMCs and the choice of matrix material provides the basis for further classification of these composites. Alloy systems including aluminum, copper, iron (steels), magnesium, nickel, and titanium have been utilized as matrices and each of these are discussed further in following sections. 1.2.3.3.1 Aluminum A wide range of aluminum alloys in various forms have been incorporated in MMCs. The density of most aluminum alloys is near that of pure aluminum, approximately 0.1 lb/in3 (2698 kg/m3). Pure alumi-num melts at 1220°F (660°C); this relatively low melting temperature in comparison to most other potential matrix metals facilitates processing of Al-based MMCs by solid state routes, such as powder metallurgy, and by casting methods. Aluminum alloys are broadly classified as either wrought or cast materials; fur-thermore, many wrought compositions are also available in powder form. The term “wrought” indicates that the material is available primarily in the form of mechanically worked products such as rolled sheet, plate or foil, various extruded shapes, tubing, forgings, wire, rod, or bar. The ready availability of alumi-num alloy foils and relatively low processing temperatures allowed the foil-fiber-foil method to be success-fully developed and utilized during the 1970s to produce aluminum alloys reinforced with continuous boron or SiC-coated boron fibers for aerospace applications. The 6061 Al-Mg-Si alloy in foil form was employed in many instances and this same alloy composition has also been used in cast form as the matrix in con-tinuously reinforced Al-graphite composites. Many wrought aluminum alloy compositions are well suited for extrusion and most discontinuously reinforced aluminum (DRA) MMCs, whether initially consolidated via powder metallurgy or casting methods, are processed in this manner. Aluminum alloys intended for use in production of castings are generally available as ingots of varying size or in other forms suitable for remelting. Applications of such cast materials have included the production of cast components using DRA, with stirring to suspend particles in the liquid metal prior to casting and solidification of the article. The designation schemes for both wrought and cast alloys are based on the major alloying additions. Wrought alloys are designated by four digits while cast compositions are designated by three digits (Table 1.2.3.3.1). Further details of compositions are available from many sources. Both wrought and cast alloy compositions may be further classified according to the method of obtaining mechanical properties: heat treatable or non-heat treatable. Heat treatable refers to alloys that can be strengthened by thermal treat-ment. Wrought alloys of the 2XXX, 6XXX and 7XXX series are generally heat treatable and those that contain major additions of lithium (e.g., some 8XXX alloys) are also heat treatable. Typical heat treatment operations may include solution heat treatment, quenching in a liquid medium and subsequent aging. A temper designator is appended to the alloy designation to describe the resulting condition of heat treat-

MIL-HDBK-17-4A Volume 4, Section 1 Guidelines
35
ment. Thus, -T4 refers to material allowed to naturally age at room temperature following solution heat treatment and quenching, while -T6 describes artificial aging to the peak strength. Additional digits may be used to indicate further details of processing such as straightening operations. Further details of heat treatments and their effect on properties are available in numerous References. The addition of rein-forcements (especially particles and whiskers) has been shown to have a significant effect on the aging response of the matrix composition for many DRA MMCs. The aging response may be either accelerated or retarded and the effect is both material and process specific. For this reason the aging treatment for a MMC with a heat treatable matrix alloy may differ significantly from that for the unreinforced matrix. Fur-thermore, most wrought alloys contain minor alloy additions. For example, Zr is added to various alloys to control recrystallization during hot working. However, the presence of reinforcing particles in an MMC may also aid in grain refinement and obviate the need for some of the minor additions often found in wrought alloys.
TABLE 1.2.3.3.1 Designations for Aluminum Alloys (Aluminum Association - AA and American National Standards Institute - ANSI).
Designation
Major Alloying Element(s) Wrought Cast
1XXX 1XX None 2XXX 2XX Cu 3XXX ---- Mn
3XX Si + Mg; Si +Cu; Si + Mg +Cu 4XXX 4XX Si 5XXX 5XX Mg 6XXX ---- Mg + Si 7XXX 7XX Zn 8XXX ---- Other than above
8XX Sn Non-heat treatable alloys are those that are not appreciably strengthened by heat treatment. The strength of the material is determined by the presence of alloying elements present in solid solution and by the extent of any cold working. Wrought alloys of the 1XXX, 3XXX, 4XXX and 5XXX series are generally non-heat treatable. The appended temper designators for these alloys are generally either -O, referring to a fully annealed and softened condition, or -H (with additional digits). The H refers to the use of plastic deformation, typically by cold rolling, to strengthen the material, and the additional digits describe the ex-tent of strain hardening and related annealing treatments to control strength, ductility and susceptibility to stress corrosion. Temper designators similar to those employed with wrought heat treatable alloys are employed with heat treatable (2XX, 3XX, 7XX and 8XX series) casting alloys. Since castings will not ex-perience appreciable mechanical deformation in manufacture, the non-heat treatable 1XX, 4XX and 5XX series cast aluminum alloys are either designated -F (as-cast) or -O (cast and annealed for stress relief). Aluminum-silicon alloys (3XX and 4XX series) are predominant among cast aluminum alloys because they generally exhibit high fluidity when molten and, thus, are well suited for complex shapes and thin sections. Such fluidity is an important consideration in selection of matrix compositions for cast MMCs where, for example, it may be necessary to completely fill the mold volume. The presence of silicon in aluminum significantly lessens the tendency of aluminum to react chemically and reduce SiC and form Al4C. This latter compound severely embrittles SiC-reinforced Al MMCs even when present in small quantities. For this reason cast aluminum MMCs incorporating SiC particles as reinforcements utilize alloys such as AA 359 as the matrix material. Alternatively, SiC can be incorporated into aluminum alloys by powder metallurgy methods; lower processing temperatures in the solid state reduce the tendency to formation of

MIL-HDBK-17-4A Volume 4, Section 1 Guidelines
36
Al4C and this affords a wider range of choice of matrix composition. Many AA3XX die casting alloys em-ployed in MMCs also contain an iron addition (approximately one weight percent) to reduce the reaction between molten aluminum and steel die surfaces. 1.2.3.3.2 Copper This section is reserved for future use. 1.2.3.3.3 Iron This section is reserved for future use. 1.2.3.3.4 Magnesium This section is reserved for future use. 1.2.3.3.5 Nickel This section is reserved for future use. 1.2.3.3.6 Titanium Titanium matrix composites have been successfully produced from a wide range of beta, alpha-beta and alpha-phase titanium alloy compositions. Since titanium alloys range in density from approximately 0.18 lb/in3 (4317 kg/m3), they are typically 60% higher in density than aluminum alloys and 40% lower in density than low alloy steels at strength levels comparable to annealed steel. Titanium alloys typically maintain good structural properties and oxidation resistance at temperatures up to 315°C (600°F). Since these alloys will provide higher matrix property contributions to a composite system than previously ob-served in continuous fiber reinforced aluminum composites, there is a greater interest in specific alloy se-lection. Although titanium alloys are available in most wrought product forms, its high (approximately 3200°F (1750°C)) melting temperature and work hardening characteristics make some alloys more difficult to pro-cess than others. In general, beta-phase alloys can be mechanically worked to higher reduction ratios than alpha-beta alloys, while alpha-beta alloys exhibit greater elevated temperature strength retention. In addition, titanium is a highly reactive element and, therefore, difficult to handle and process at elevated temperatures. Titanium melting/pouring and rapid solidification operations must be performed in vacuum environments. Titanium alloys are typically identified by their major alloying constituents (e.g., Ti-6Al-4V, Ti-15V-3Cr-3Al-3Sn), although several specific alloys have registered trade names (e.g., Timetal-21, Ti-1100). The most common alloys used in titanium compositing have been Ti-6-4, Ti-15-3-3-3, Ti-6-2-4-2 and Timetal-21. There has been significant interest in a variety of titanium aluminide alloys, including alpha-2, super alpha-2, gamma, and most recently orthorhombic alloys. These alloys offer higher elevated temperature strength, creep strength, and microstructural stability and are attractive for some gas turbine engine applications, however, low ductility and low tolerance for interstitial contaminants makes processing much more difficult. 1.2.4 REINFORCEMENT MATERIALS Reinforcement materials in MMCs are discrete fibers or second phase additions to a metallic matrix that result in a net improvement in some properties, typically an increase in strength and/or stiffness. Most often reinforcement materials for MMCs are ceramics (oxides, carbides, nitrides, etc.) which are characterized by their high strength and stiffness both at ambient and elevated temperatures. Examples of common MMC reinforcements are SiC, Al2O3, TiB2, B4C, and graphite. Metallic reinforcements are used less frequently.

MIL-HDBK-17-4A Volume 4, Section 1 Guidelines
37
1.2.4.1 Types of reinforcement Reinforcements can be divided into two major groups: (a) particulates or whiskers; and (b) fibers. Fi-ber reinforcements can be further divided into continuous and discontinuous. Fibers enhance strength in the direction of their orientation. Lower strength in the direction perpendicular to the fiber orientation is characteristic of continuous fiber reinforced MMCs. Discontinuously reinforced MMCs, on the other hand, display more isotropic characteristics. 1.2.4.2 Role of reinforcement The role of the reinforcement depends upon its type in structural MMCs. In particulate and whisker reinforced MMCs, the matrix is the major load bearing constituent. The role of the reinforcement is to strengthen and stiffen the composite through prevention of matrix deformation by mechanical restraint. This restraint is generally a function of the ratio of interparticle spacing to particle diameter. In continuous fiber reinforced MMCs, the reinforcement is the principal load-bearing constituent. The metallic matrix serves to hold the reinforcing fibers together and transfer as well as distribute the load. Discontinuous fiber reinforced MMCs display characteristics between those of continuous fiber and particulate reinforced composites. Typically, the addition of reinforcement increases the strength, stiffness and temperature ca-pability while reducing the thermal expansion coefficient of the resulting MMC. When combined with a metallic matrix of higher density, the reinforcement also serves to reduce the density of the composite, thus enhancing properties such as specific strength. 1.2.5 REINFORCEMENT COATINGS 1.2.5.1 Role of coatings In many MMCs, it is necessary to apply a thin coating on the reinforcements prior to their incorporation into the metal matrix. In general, coatings on the fibers offer the following advantages:
1. Protection of fiber from reaction and diffusion with the matrix by serving as a diffusion barrier 2. Prevention of direct fiber-fiber contact 3. Promotion of wetting and bonding between the fiber and the matrix 4. Relief of thermal stresses or strain concentrations between the fiber and the matrix 5. Protection of fiber during handling
In some instances particulates are coated to enhance composite processing by enhancing wetting and reducing interfacial reactions. 1.2.5.2 Types of coatings Given the major role of coatings, there are several techniques available for the deposition of thin coat-ings on long fibers and, to a much lesser extent, on short fiber and particulate reinforcement. One such process is chemical vapor deposition (CVD). In this process, hot fiber is traversed through a reaction zone in which a vaporized species either decomposes thermally or reacts with another vapor so as to form a deposit on the fiber. Sometimes, the deposition process is enhanced by generating an electric dis-charge plasma (plasma-assisted CVD). Physical vapor deposition (PVD), plating and spraying are some of the other techniques used to produce fiber coatings. When the objective is to increase wettability, the integrity and structure of the coating is less of a concern than if it were to be used as a protective layer. Barrier coatings to protect fibers from chemical attack by the matrix must, in addition to having thermody-namic stability, impair transport of reactants through it. Fluxing action by a reactive salt coating such as K2ZrF6 have been found to promote wettability particularly for C and SiC fibers in aluminum. Sizing of tow based ceramic fibers may be used to enhance handling characteristics.
MIL-HDBK-17-4A Volume 4, Section 1 Guidelines
38
1.2.6 MANUFACTURING PROCESSES 1.2.6.1 Overview and General Information Choice of the primary manufacturing process for the fabrication of any MMC is dictated by many fac-tors, the most important of which are:
1. Preservation of reinforcement strength 2. Minimization of reinforcement damage 3. Promotion of wetting and bonding between the matrix and reinforcement 4. Flexibility that allows proper backing, spacing and orientation of the reinforcements within the ma-
trix These primary industrial manufacturing processes can be classified into liquid phase and solid state processes. Liquid phase processing is characterized by intimate interfacial contact and hence strong bond-ing, but can lead to the formation of a brittle interfacial layer. Solid state processes include powder blending followed by consolidation, diffusion bonding and vapor deposition. Liquid phase processes include squeeze casting and squeeze infiltration, spray deposition, slurry casting (compocasting), and reactive processing (in-situ composites). 1.2.6.2 Assembly and consolidation 1.2.6.2.1 Powder blending and consolidation Powder blending and consolidation is a commonly used method for the preparation of discontinuously reinforced MMCs. In this process, powders of the metallic matrix and reinforcement are first blended and fed into a mold of the desired shape. Blending can be carried out dry or in liquid suspension. Pressure is then applied to further compact the powder (cold pressing). The compact is then heated to a temperature which is below the melting point but high enough to develop significant solid state diffusion (sintering). After blending, the mixture can also be consolidated directly by hot pressing or hot isostatic pressing (HIP) to obtain high density. The consolidated composite is then available for secondary processing. Achieving a homogeneous mixture during blending is a critical factor because the discontinuous reinforcement tends to persist as agglomerates with interstitial spaces too small for penetration of matrix particles. 1.2.6.2.2 Consolidation diffusion bonding This method is normally used to manufacture fiber reinforced MMCs from sheets, foils, powder, pow-der tape or wire of matrix material, or matrix coated fibers. The methods of assembling reinforcement fibers and matrix alloys depend upon fiber type and fiber array preform method. In the case of monofila-ments, such as SiC and boron, parallel arrays with controlled fiber-to-fiber spacing are generated via drum winding, weaving with metallic ribbons, or feeding one or more filaments into a continuous process. Tow-based fibers, such as alumina or graphite (carbon), are typically drum wound or creeled for continuous payout. Matrix materials can be supplied to the composite assembly as separate constituents (e.g., foils, powder mat or tape, wires) or applied directly to the fiber array (e.g., vapor deposition, plasma spray). The composite elements (plies) are assembled by layering (or wrapping for cylindrical or ring shapes) the fiber array and matrix plies to achieve a predetermined fiber orientation and composite thickness. Composite consolidation is achieved by applying a high pressure in a direction normal to the ply surfaces and a tem-perature sufficient to produce atomic diffusion of the applicable matrix alloy. This process is performed in a vacuum environment. 1.2.6.2.3 Vapor deposition Prominent among the vapor deposition techniques for the fabrication of MMCs is electron beam/ physi-cal vapor deposition (EB/PVD). This process involves continuous passage of fiber through a region of high partial vapor pressure of the metal to be deposited, where condensation takes place so as to produce a rela-tively thick coating on the fiber. The vapor is produced by directing a high power (~ 10kW) electron beam onto the end of a solid bar feedstock. One advantage of this technique is that a wide range of alloy compo-

MIL-HDBK-17-4A Volume 4, Section 1 Guidelines
39
sitions can be used. Another advantage worth noting is that there is little or no mechanical disturbance of the interfacial region which may be quite significant when the fibers have a diffusion barrier layer or a tai-lored surface chemistry. Composite fabrication is usually completed by assembling the coated fibers into a bundle or array and consolidating in a hot press or HIP operation. 1.2.6.2.4 Squeeze casting and squeeze infiltration Porous preforms of reinforcement material are infiltrated by molten metal under pressure to produce metal matrix composites. Reinforcement materials include carbon, graphite, and ceramics, such as ox-ides, carbides, or nitrides. Reinforcement forms include continuous fiber, discontinuous fiber, and particu-late. Metals used include aluminum, magnesium, copper, and silver. The volume fraction of reinforce-ment in the metal matrix composites varies from 10 to 70 v/o depending on the particular application for the material. Generally, the preform, which is shaped to match the contours of the mold, is not wet by the molten metal and must be infiltrated under pressure. In squeeze casting, a hydraulically activated ram applies a low controlled pressure to the molten metal to attain infiltration of the preform without damaging it. Infiltra-tion may or may not be vacuum assisted. Once infiltration is complete, a high pressure is applied to elimi-nate the shrinkage porosity that can occur when the liquid metal contracts as it transforms into the solid state. This complete consolidation, or absence of porosity, provides the squeeze cast metal matrix com-posite materials with excellent mechanical properties. 1.2.6.2.5 Spray deposition A number of processes have evolved under this category in which a stream of metal droplets impinges on a substrate in such a way as to build up a composite. If the reinforcement is particulate, it can be fed into the spray. Matrix only spray can be applied to an array of fibers. The techniques employed fall into two distinct classes, depending on whether the droplet stream is produced from the molten bath (e.g., the Osprey process), or by continuous feeding of cold metal into a zone of rapid heat injection (e.g., thermal spray processes). In general, spray deposition methods are characterized by rapid solidification, low ox-ide contents, and significant porosity levels. Depositions of this type are typically consolidated to full den-sity in subsequent processing. 1.2.6.2.6 Slurry casting (compocasting) Liquid metal is stirred as solid reinforcement particles are added to the melt to produce a slurry. Stir-ring continues as the melt is cooled until the metal itself becomes semi-solid and traps the reinforcement particles in a uniform dispersion. Further cooling and solidification then takes place without additional stir-ring. The slurry may be transferred directly to a shaped mold prior to complete solidification, or it may be allowed to solidify in billet or rod shape so that it can be reheated to the slurry form for further processing by techniques, such as die casting. 1.2.6.2.7 Reactive processing (in-situ composites) There are several different processes that would fall under this category. Directional solidification of eutectics in which one of the phases solidifies in the form of fibers is one such process. Inherent limita-tions in the nature and volume fraction of the reinforcement and the morphological instabilities associated with thermal gradients have resulted in a decrease in the interest in these types of composites. Exother-mic reactions, such as directed metal oxidation, are one family of processes for the production of in-situ composites. The major advantage of this class of composites is that the in-situ reaction products are thermodynamically stable. 1.2.6.3 Thermomechanical processing This section is reserved for future use.

MIL-HDBK-17-4A Volume 4, Section 1 Guidelines
40
1.2.6.4 Near net shape manufacturing processes This section is reserved for future use. 1.2.7 PRODUCT FORMS 1.2.7.1 Intermediate This section is reserved for future use. 1.2.7.2 Standard This section is reserved for future use. 1.2.7.3 Selectively reinforced components This section is reserved for future use. 1.2.8 SECONDARY MANUFACTURING PROCESSES 1.2.8.1 Overview and general information This section is reserved for future use. 1.2.8.2 Forming This section is reserved for future use. 1.2.8.3 Machining This section is reserved for future use. 1.2.8.4 Joining In order to fabricate structures from MMCs, effective joining methods must be developed to join MMCs to the same or different materials. This section reviews the potential adaptability of standard join-ing practices used for monolithic metals to the joining of MMCs. Since MMCs utilize a variety of non-metallic reinforcements such as silicon carbide, graphite, aluminum oxide, boron carbide, etc., these rein-forcements will impose limitations and may require some modifications to standard joining methods for monolithic metals. This section provides a brief summary of the candidate joining methods and a qualita-tive assessment of their joint performances. 1.2.8.4.1 Qualitative assessment for MMC joining methods 1.2.8.4.1.1 Qualitative performance assessment As a general rule, the adaptability of conventional joining techniques to MMCs will depend on the combination of the following factors: (1) the volume percent and types of reinforcements, (2) metal matrix melting temperatures, and (3) the thermal energy management control. A brief summary of these three factors is given as follow: Factor 1: Since MMCs utilize a variety of non-metallic reinforcements, the higher the reinforcement vol-
ume fraction, the less likely for standard metal joining techniques to adapt to the MMC. Discontinu-ously reinforced MMCs are easier to join than continuously reinforced MMCs.
Factor 2: The prolonged contact between a molten metal matrix and a reinforcement can lead to undesir-
able chemical reactions which are accelerated as the molten metal temperature is increased. There-

MIL-HDBK-17-4A Volume 4, Section 1 Guidelines
41
fore, the metal matrix-reinforcement chemical compatibility is a material and temperature dependent factor. For this reason, the higher the metal matrix melting temperature, the less likely fusion welding techniques will be applicable.
Factor 3: Although high thermal energy is required for many conventional joining processes, excessive
thermal energy input is undesirable. Therefore, the use of an automated joining process or a special joining method which can offer a well controlled thermal energy input in a minimum process time will likely improve the joining adaptability for MMCs.
1.2.8.4.1.2 Joint adaptability, applications and selection A qualitative estimate of the adaptability of 17 monolithic joining practices to MMCs is shown in Table 1.2.8.4.1.2. Further details of each process and classification are provided in subsequent sections. It is important to realize that MMC joining is not a mature technology and many important joining technical de-tails are still lacking. Consequently, the precise knowledge of the adaptability for a specific joining method is a specific material and process dependent factor which must be determined experimentally. However, as a general observation, the use of solid state and other low temperature processes are often more adaptable for joining of MMCs than the use of high temperature fusion processes. From the designer’s viewpoint, selecting a joining method can be qualitatively accomplished by using a set of criteria for joint applications, in conjunction with its adaptability for joining MMCs. Table 1.2.8.4.1.2 shows the proposed criteria for joint applications which are grouped into 8 categories such as joint’s stiff-ness, strength, thermal and electrical conductivity, etc. Each of these joint performance criteria is qualita-tively rated in terms of high, medium, or low. From this Table, the designer could qualitatively select a can-didate joining method which is adaptable for MMCs and has the highest rating score for a particular joining application. 1.2.8.4.2 Potential issues in joining MMCs In general, MMCs utilize a variety of non-metallic reinforcements with a typical volume fraction ranging from 5% to 60%. For this reason, there are a number of potential joining issues that are peculiar to MMCs. 1.2.8.4.2.1 Solidification effects For discontinuously reinforced MMCs, most non-metallic reinforcements have different densities from the metal matrix and this can lead to pronounced particle segregation effects when the matrix is in the molten state. In general, the composite weld pool has a higher viscosity and does not flow as well as the unreinforced metal matrix. High viscosity can often lead to a lower heat transfer by convection mecha-nism in the weld pool which can affect the resulting microstructures and the stress distributions in the MMCs. Techniques which avoid reinforcement material dissolution and non-uniform packing density due to migration of the reinforcement into the welded regions should be employed. 1.2.8.4.2.2 Chemical reactions In general, the joining process temperature and time must be carefully controlled such that the contact between molten metal matrix and the reinforcements during joining will not lead to dissolution of the rein-forcement material, interdiffusion, and the formation of undesirable metallurgical phases. The chemical stability of the metal matrix-reinforcement for a specific joining method is material and process specific. Consequently, final process parameters for a specific process must be experimentally determined. 1.2.8.4.2.3 Joint preparation Because of their non-metallic reinforcements, most MMCs have very high wear resistance and are brittle to cut using standard steel-cutting tools and saw blades in the preparation of the joint. Cutting and drilling operations must be carefully controlled in order to avoid composite panel edge tear out problems and excessive damage to the continuous fiber reinforcements.

MIL-HDBK-17-4A Volume 4, Section 1 Guidelines
42
TABLE 1.2.8.4.1.2 Qualitative rating for joining adaptability, applications and selection.
Inertia Friction Welding
Friction Stir Welding
Ultrasonic Welding
Diffusion Bonding
Transient Liquid Phase
Rapid Infrared Joining
Laser Beam Welding
Electron Beam Welding
Gas Metal Arc Welding
Gas Tungsten Arc Welding
Resistance Spot Welding
Capacitor Discharge Welding
Brazing
Soldering
Adhesive Bonding
Mechanical Fastening
Cast-insert Joining
stre
ngth
driv
enhi
gh te
mpe
ratu
re
diss
imila
r mat
eria
ls
stiff
ness
driv
enth
erm
al c
ondu
ctio
n
elec
trica
l con
duct
ion
com
plex
shap
es
dim
ensi
onal
sta
ble
Joint Applications
Joining Methods Ada
ptab
ility
for
MM
Cs
Joint Performance Rating: LowMediumHigh
1.2.8.4.2.4 Post-joining heat treatment A post-joining heat treatment should be considered. to achieve maximum properties following joint fabrication and to reduce or eliminate residual stresses.

MIL-HDBK-17-4A Volume 4, Section 1 Guidelines
43
1.2.8.4.3 Classification and discussion of selected joining methods MMC joining methods can be classified into three main groups: solid state, fusion, and other proc-esses. In solid state processes, joining occurs at temperatures below melting of the base metals by the use of either mechanical deformation or the diffusion mechanism. A solid state process often results in the elimination of the original joint interface. In fusion processes, the joining is achieved by melting the base metals of substantially similar compositions and allow the molten metal mixture to solidify. A fusion weld can be fundamentally considered as a miniature casting with different boundary conditions. In other processes, joining usually occurs at temperatures below the melting of the base metals being joined with the use of intermediate filler materials. For processes such as brazing and soldering, special alloys or filler materials are placed in the clearance between the base materials to be joined. A variety of means may be used to heat the assembly. When the resulting filler materials become liquid, they coat the base metal and form a metallurgical bond. MMCs may also be joined by adhesives, mechanical inserts, and fasteners. MMC joining is not yet a mature technology and many important details are still being developed. Therefore, the applicability of a specific MMC joining method depends on the types of MMC materials be-ing joined. This section provides a qualitative review of selected joining methods, performed mostly for aluminum MMCs, that are described in the open literature as shown in Figure 1.2.8.4.3.
Joining Methods
Fusion ProcessesSolid State Processes Other Processes
Inertia Friction Welding
Friction Stir Welding
Ultrasonic Welding
Diffusion Bonding
Laser Beam Welding
Electron Beam Welding
Gas Metal Arc Welding
Gas Tungsten Arc Welding
Resistance Spot Welding
Capacitor Discharge Welding
Brazing
Soldering
Adhesive Bonding
Mechanical Fastening
Cast-insert Joining
Transient Liquid Phase
Rapid Infrared Joining
FIGURE 1.2.8.4.3 Classification of selected joining methods for MMCs.
1.2.8.4.3.1 Inertia friction (IF) welding Friction welding produces a joint by using the friction force between components to generate heat. There are two conventional versions of this process: the direct drive and inertia friction welding. In gen-eral, conventional friction welding is applicable only to certain types of component sizes and shapes with appropriate joint cross-sectional geometries. Friction welding has been proven successful in making sound joints for discontinuously reinforced MMCs (References 1.2.8.4.3.1(a) and (b)). In IF welding, a part attached to a rapidly rotating flywheel is forced into contact with a part held stationary. A soft layer of material is formed at the interface due to frictional heating. This is the bonding layer that exists between

MIL-HDBK-17-4A Volume 4, Section 1 Guidelines
44
the two components and the bond is normally allowed to cool under the contact pressure. IF welding is a solid state welding process and the processing temperature is lower than the melting temperature of the matrix materials. For these reasons, the welding technique does not tend to produce undesirable chemi-cal reactions and may even promote a uniform particulate distribution at the friction weld interface. Joint formation is accompanied by upset forging and extrusion of materials from the interface. For joining of MMCs, the applied force is usually higher than for conventional alloys since the reinforcement particles substantially increase the flow stress of the MMCs. 1.2.8.4.3.2 Friction stir (FS) welding Friction stir welding is a special type of conventional friction welding and was invented by The Welding Institute (Reference 1.2.8.4.3.2(a)) from the U.K. in 1991. FS welding is a relatively new technique even for the joining of monolithic materials. Although the technique is still in the development stage, it has a potential for joining some dissimilar materials and MMCs (References 1.2.8.4.3.2(b) and (c)). In FS weld-ing, the parts to be joined are clamped to a backing plate in order to prevent the joint faces from being forced apart. A specially profiled cylindrical tool is rotated and slowly plunged into the joint line to produce a plasticized material zone around the tool through frictional heating. As the tool continues to rotate and moves slowly forward in the direction of welding, plasticized material surrounding the tool is forced to move from the front to the back of the tool thus forming a weld on consolidation. FS welding is a solid state welding which enables the retention of chemistry and uniform distribution of reinforcement materials in the matrix. The welding occurs at temperatures lower than the melting of the matrix and thus minimizes the potential for matrix-reinforcement chemical reactions. Proper fixturing is required. For joining of MMCs, the applied force is usually higher than conventional alloys since the reinforcement particles sub-stantially increase the flow stress. The FS welding’s tool must be made from materials of high strength, high wear resistance, and toughness. 1.2.8.4.3.3 Ultrasonic (US) welding Ultrasonic welding produces a joint by applying high frequency vibration to the weldment as it is held under a moderately high clamping force without significant melting of the base materials. In contrast with the friction welding which has a high localized plastic deformation at the joint interface, US welding is a mechanically fused joint that may not provide enough localized plastic deformation for joining of some MMCs. However, the induced thermal energy from ultrasonic welding is relatively low such that it will not promote unwanted reinforcement-to-matrix chemical reactions. For some continuously reinforced MMCs, the clamping pressures can result in fiber damage and face sheet delamination. On the other hand, weld-ing may not be achieved if the clamping forces are reduced in order to minimize composite damage. US welding can induce fiber bundle damage from the shearing action of the high frequency vibration (Refer-ences 1.2.8.4.3.3(a) and (b)). In general, conventional US welding is a low temperature process that has limited application for joining MMCs. 1.2.8.4.3.4 Diffusion bonding (DFB) Diffusion bonding is a solid state process which is commonly referred to by trade names such as Acti-vated Diffusion Bonding (ADB) and Activated Diffusion Healing (ADH). In each case, the result is actually a diffusion bond. A critical aspect of DFB is that an extensive diffusion penetration of the metallic filler into the base metal must occur and is only achieved with correct joint preparation and cleanliness. For this reason, the DFB process often results in the elimination of the original joint interface. In ADB, chemical compatibility between the MMCs and the metallic filler must be chosen to prevent liquid metal embrittle-ment (LME) effects. ADB can produce high joint strength for high temperature applications if LME effects are not encountered. Temperature and time must be minimized to control the formation of undesirable chemical reactants. Joint properties are material dependent and DFB joints can offer high thermal and electrical conductivity. DFB is commonly used for heat transfer applications such as heat pipes, fins, ra-diators, and heat exchangers. However, high temperature DFB may degrade the mechanical properties of some MMCs and may also induce some structural thermal distortion (References 1.2.8.4.3.4(a) and (b)).

MIL-HDBK-17-4A Volume 4, Section 1 Guidelines
45
1.2.8.4.3.5 Laser beam (LB) welding Laser beam welding is a rapid thermal joining process that minimizes re-distribution of reinforcements and results in a very fine metal matrix grain size. The LB welding focuses the thermal energy into a very narrow beam resulting in a very narrow weld and heat-affected-zone (HAZ). Microstructural analysis of this region of high heat flux has shown that some reinforcements such as SiC and graphite are completely reacted to form undesirable metal-carbide phases. Other reinforcement types such as B4C and Al2O3, do not present a similar problem. Experimental data suggested that the laser energy is preferentially ab-sorbed by most non-metallic reinforcements in MMCs, relative to the metal matrices. Therefore, me-chanically sound joints are not easily obtained by LB welding for most MMC materials containing SiC, car-bon or graphite as reinforcement (References 1.2.8.4.3.3(b) and 1.2.8.4.3.4(a)). 1.2.8.4.3.6 Electron beam (EB) welding This technique usually requires the electron beam and focusing devices, as well as the workpieces, to be placed in a vacuum chamber. The welding quality for MMCs obtained from the EB welding is some-what similar to those obtained from the LB welding. Both EB and LB welding processes are fusion proc-esses capable of providing very rapid thermal cycles and localized heating. In contrast with LB welding which can be performed in air, EB welding is more complex to set up due to vacuum requirements. Faster electron beam travel and sharper beam focus would tend to produce less aluminum-carbide phases. Generally, EB welding process produces somewhat less unwanted phases than the LB welding using the same welding speed. EB welding has had limited success with aluminum and titanium-based MMCs which are reinforced by silicon-carbide (References 1.2.8.4.3.3(b) and 1.2.8.4.3.6). However, some im-provement in joining quality may be achieved through the use of high speed and temperature controlled welding automation. 1.2.8.4.3.7 Gas-tungsten arc (GTA) welding GTA is an arc welding process wherein heat is produced by an arc between a single tungsten elec-trode and the workpiece. Filler metal, if used, is preplaced in the weld joint or fed into the arc from an ex-ternal source during welding. An arc weld involves a significant melting of the parent materials. Conse-quently, some degradation of the microstructures and properties of MMCs are often observed. In general, GTA is not easily applied to continuous fiber reinforced MMCs. However for discontinuously reinforced MMCs, the GTA welding process offers a commercially viable joining process. Butt joints, rather than lap joints, can be produced readily using GTA in these systems (References 1.2.8.4.3.3(b) and 1.2.8.4.3.7). 1.2.8.4.3.8 Gas-metal arc (GMA) welding GMA is an arc welding process which is similar to the GTA, except that a consumable filler metal elec-trode (either monolithic alloy or MMC) is used instead of the tungsten electrode. The consumable elec-trode is fed through the welding torch and provides filler metal for making the weld joint. GMA welding process is often automated with high welding speed and has been found to be somewhat more adaptable for MMCs welding than the GTW. For discontinuous reinforcement, GMA welding has proven fairly suc-cessful in joining Al-MMCs reinforced with alumina particulates (References 1.2.8.4.3.4(b) and 1.2.8.4.3.8). For multi-pass welds, removing surface contaminants and degassing the MMCs may be re-quired in order to reduce porosity and defects in the heat affected zone. The GMA welding process offers a commercially viable joining process for MMCs. 1.2.8.4.3.9 Resistance spot (RS) welding A process wherein the heat at the joint interface is generated by a short time flow of low voltage but very high electrical current. An external force is usually applied during the application of the current to as-sure a continuous electrical contact and to forge the heated parts together to form a joint. RS welding for MMCs typically requires substantially less electrical current than non-reinforced metals due to the increase in bulk electrical resistivity associated with the non-metallic reinforcements. Because the thermal input is very localized, RS produces minimal unwanted reactions. For some continuously reinforced MMCs, the clamping pressures could induce the migration of reinforcement fibers into the weld nugget. This could be

MIL-HDBK-17-4A Volume 4, Section 1 Guidelines
46
a favorable effect in weld nugget reinforcement by enhancing the fiber bundle-to-face sheet peel strength. However, fiber motion is often unpredictable and may lead to complex stress distributions. Important RS welding parameters to control weld nugget cracking are current density, clamping force, contact time be-tween two components and post-forge cycles (References 1.2.8.4.3.3(b) and 1.2.8.4.3.6). 1.2.8.4.3.10 Capacitor discharge (CD) welding CD is a welding technique similar to electrical resistance welding in that thermal energy is imported to the workpiece by direct electrical contact. In CD welding, the energy is introduced by the rapid discharge of electrical capacitors while force is applied. This assures a continuous electrical circuit and to forge the heated parts together to form a joint. Because capacitive discharge rates are short (on the order of 5 to 25 milliseconds), the process may produce fewer unwanted reactions and provide slightly better properties than interface resistance spot welding (RSW). In the CD welding process, some localized expulsion of molten metal from the interface is common and must be considered in the selection of this process. Ex-perimental work on CD welding has shown that aluminum-carbide compound formation can be precluded on several types of silicon-carbide aluminum MMCs (Reference 1.2.8.4.3.10). 1.2.8.4.3.11 Brazing (BZ) The two most common production brazing methods are vacuum furnace brazing and dip brazing. Vacuum brazing is somewhat limited to flat-on-flat applications where a large normal pressure can be ap-plied to the surface during the braze cycle. Dip brazing is accomplished with chemical fluxes, and is best suited to self-fixturing assemblies. All brazing processes occur at elevated temperatures which may in-duce some structural thermal distortion. Long contact times at high process temperatures may cause degradation of joint properties due to the formation of deleterious phases. Surface oxidation must be re-moved prior to brazing aluminum MMCs. The chemical compatibility between the MMCs and the metallic brazing alloy must be considered to prevent the occurrence of liquid metal embrittlement (LME). Brazing can offer superior thermal and electrical conductivity due to use of a thin metallic filler. Brazing processes are commonly used for thermal applications such as joining of metallic heat pipes, radiators and heat ex-changers (References 1.2.8.4.3.3(b) and 1.2.8.4.3.11). 1.2.8.4.3.12 Soldering (SD) This is a relatively low temperature joining process in comparison with brazing, DFB, and fusion weld-ing, but will result in much lower joint strength. However, a lower processing temperature may be benefi-cial in the fabrication of a dimensionally stable structure. Low temperature soldering will not degrade alu-minum MMCs in the heat treated condition. The tenacious oxide layer formed on the metal matrix must be removed to allow a metallurgical bonding between the solder and the base metals. In general, highly corrosive chemical fluxes are commonly used to enhance surface wetting. Care must be taken to remove these chemical fluxes because they can cause in-service galvanic corrosion and liquid metal embrittle-ment (LME), if allowed to remain in the joint. Therefore, it is preferred to use solder along with a flux re-moval technique or a fluxless soldering process (References 1.2.8.4.3.4(a) and 1.2.8.4.3.12). 1.2.8.4.3.13 Adhesive bonding (AB) This technique offers the lowest risk against potential physical damage of MMCs during joining. LME and metallic corrosion effects associated with joining of MMCs are not encountered when using the AB process. Since most curing temperatures for adhesives will be below 350°F (180°C), adhesive bonding is applicable to aluminum MMCs in the heat treated conditions. In general, strong chemical bonds can be achieved using standard adhesive bonding procedures with appropriate MMCs surface preparation. As with all adhesive bonding applications, outgassing of adhesive compound is a consideration. Vacuum out-gassing could contaminate optical mirrors and photonic sensitive equipment if they are mounted onto an MMC adhesively bonded structure. AB technique is not recommended for applications with high thermal or electrical conductivity across the adhesive joint interface. High conductivity joints are more likely to be achieved with thin metal fillers as commonly used in soldering, brazing, and diffusion bonding (References 1.2.8.4.3.3(b) and 1.2.8.4.3.4(a)).

MIL-HDBK-17-4A Volume 4, Section 1 Guidelines
47
1.2.8.4.3.14 Mechanical fastening (MF) This is a joining process using a non-melting agent such as mechanical inserts, bolts, nuts, and fas-teners. Although mechanical fastening is easy to apply, this method has some disadvantages. For in-stance, high temperature MMC applications are often sensitive to thermal stresses resulting from the dif-ferences in the thermal expansion between the MMC and the fasteners. The size and location of fastener holes in relation to the composite’s panel edges and corners must be carefully chosen to avoid panel edge tear out problems during fastener hole machining. It is important to minimize the damage to adjacent fi-bers when cutting holes through the composite structure. For discontinuous fiber reinforced MMCs, panel delamination and edge tearout problems are usually not encountered for MF. However, fastener sizes and the threshold torque for fastening should be selected to prevent delamination and deformation from over-tightening the fasteners. MF is not recommended for the assembly of very low distortion, high dimension-ally stable structures and high stiffness MMCs components (References 1.2.8.4.3.14(a) and (b)). DRMMCs have very high pin bearing properties and readily lend themselves to mechanical fastening. 1.2.8.4.3.15 Cast-insert joining (CI) Cast-insert joining is a method of near net shape casting of MMC components with built-in metallic inserts to provide a site for joining with conventional techniques. Moreover, the inserts can be designed to transfer the imposed load to the fiber reinforcements which may result in stronger and stiffer cast MMC structures. The metallic insert’s thermal expansion must be compatible with the cast MMC’s to minimize thermal stress during casting (Reference 1.2.8.4.3.15). 1.2.8.4.3.16 Transient liquid phase (TLP) bonding TLP bonding is a process which employs a filler material to produce a transient liquid layer at the inter-face to be joined. Since bonding of the joint occurs as a result of diffusion, surface oxides must be re-moved from the joined areas to facilitate wetting. This process generally requires the application of pres-sure to improve the interlayer-substrate contact. Process time and temperature must be minimized to pre-vent microstructural damage. In general, joint quality is material dependent. TLP joints can offer high thermal and electrical conductivity. However, high temperature TLP bonding may degrade the mechanical properties of some MMCs and induce structural thermal distortion. TLP bonding has been demonstrated for joining aluminum MMCs reinforced with silicon carbide and aluminum oxide particulates (References 1.2.8.4.3.16(a) and (b)). 1.2.8.4.3.17 Rapid infrared (RI) joining This is a relatively new MMC joining process that can produce heating and cooling rates on the order of 212°F/second (100°C/second). Such rapid rates of thermal input could decrease the adverse effects associated with prolonged heating for MMC joining. This technique was developed to minimize the proc-essing time in the transient-liquid-phase joining of high temperature titanium MMCs (Reference 1.2.8.4.3.17). RI process requires that MMC parts, with a metallic filler material, are placed in a special infrared furnace in an appropriate joint configuration. During the entire RIJ process an inert gas, such as argon, is purged through the heating chamber to prevent oxidation. After joining, the MMC parts are cooled naturally in the protective atmosphere. Similar to most diffusion bonding processes, RI can offer high thermal and electrical conductivity. 1.2.8.5 Thermal treatment This section is reserved for future use. 1.2.8.6 Coatings and surface treatments This section is reserved for future use.

MIL-HDBK-17-4A Volume 4, Section 1 Guidelines
48
1.2.9 QUALITY ASSURANCE 1.2.9.1 Constituents This section is reserved for future use. 1.2.9.2 Preform This section is reserved for future use. 1.2.9.3 Final product This section is reserved for future use. 1.2.9.4 Statistical process control This section is reserved for future use. 1.2.10 REPAIR 1.2.10.1 In-process This section is reserved for future use. 1.2.10.2 In-service This section is reserved for future use.

MIL-HDBK-17-4A Volume 4, Section 1 Guidelines
49
REFERENCES
1.2.8.4.3.1(a) Ahearn, J. S., and Cooke, D. C., “Joining Discontinuous SiC Reinforced Al Composites,”
Martin Marietta Co., Report No: NSWC TR-86-36, September 1, 1985. 1.2.8.4.3.1(b) Cola, M. J., Martin, G., and Albright, C. E., “Inertia Friction Welding of 6061-T6/Al2O3
MMCs,” Research Report MR9108, Edison Welding Institute, June 1991. 1.2.8.4.3.2(a) Thomas et al., “Friction Stir Welding,” U. S. Patent 5,460,317. 1.2.8.4.3.2(b) Dawes, C. J., and Thomas, W. M., “Friction Stir Process Welds Aluminum Alloys,”
Welding Journal, March 1996, pp. 41-45. 1.2.8.4.3.2(c) Rhodes, C. G., Mahoney, M. W. and et al., “Effects of Friction Stir Welding on
Microstructure of 7075 Al,” Script Metall., Vol 36, 1997, pp. 69-75. 1.2.8.4.3.3(a) Harrigan, W. C., and Dolowy, J. F., “Investigation of Joining Concepts for Graphite Fiber
Reinforced Aluminum Composites,” DWA Inc., NSWC TR- 284-9, March 1980. 1.2.8.4.3.3(b) Luhman, T. S., and Williams R. L., “Development of Joint and Joining Techniques for
Metal Matrix Composites,” Boeing Co., Report: AMMRC TR-84-35, August 1984. 1.2.8.4.3.4(a) Nedervelt, P. D., and Burns R. A., “Metal Matrix Composites Joining and Assembly
Technology,” Boeing Defense & Space, Report No. WL-TR-93-4083, September 1993. 1.2.8.4.3.4(b) Lienert, T., Lane, C., and Gould, J., “Selection and Weldability of Al. Metal Matrix
Composites,” ASM Handbook, Vol 6, Materials Park, OH, ASM, 1995, pp. 555-559. 1.2.8.4.3.6 Kissinger, R.D., “Advanced Titanium Based Material Joining Technology,” G.E. Aircraft
Engines, Naval Air Warfare Center, Phase 1 Report No. 8, January 1994. 1.2.8.4.3.7 Goddard, D. M., and Pepper, R. T., “A Preliminary Investigation of Joining Methods for
Gr/Al Composites,” Aerospace Corp., SAMSO-TR-71-149, August 1971. 1.2.8.4.3.8 Altshuller, B., Christy, W., and Wiskel, B., “GMA Welding of Al-Alumina MMCs,”
Weldability of Materials, Materials Park, OH, ASM, 1990, pp. 305-309. 1.2.8.4.3.10 Devletian, J. H., “SiC/Al MMC Welding by a Capacitor Discharge Process,” Welding
Journal, pp. 33-39, 1987. 1.2.8.4.3.11 Rosenwasser, S. N., and Auvil, A. J., “Development of Low-Temp, Solid-State Bonding
Approach for MMC Joints,” Sparta Inc., NSWC-TR-89-302, Oct. 24, 1989. 1.2.8.4.3.12 Nowitzky, A. M., and Supan, E. C., “Space Structures Concepts and Materials,” SBIR
Phase 2 Final Report, DWA Inc., NASA-MSFC, Contract No. NAS8-37257, June 1988. 1.2.8.4.3.14(a) Kiely, J. D., “Performance of Graphite Fiber Reinforced Aluminum Under Fastening
Compression Loads,” Naval Surface Warfare Center, NAVSWC-TR-91-408, July 1991. 1.2.8.4.3.14(b) Sawyer, J. W. and Rothgeb, T. M., “Thermal-Mechanical Test of TMC Highly Loaded
Joints,” NASP TM-1176, April 1994. 1.2.8.4.3.15 Lee, J. A., and Kashalika, U., “Casting of Weldable Gr/Mg MMC with Built-in Metallic
Inserts,” NASA Conf. 3249, Vol 1, p. 371, Dec. 7-9, 1993, Anaheim, CA.

MIL-HDBK-17-4A Volume 4, Section 1 Guidelines
50
1.2.8.4.3.16(a) Sudhakar, K., “Joining of Aluminum Based Particulate-Reinforced MMCs,” Dissertation, The Ohio State University, 1990.
1.2.8.4.3.16(b) Klehn, R., “Joining of 6061 Aluminum Matrix Ceramic Particulate Reinforced
Composites,” M.S. thesis, Massachusetts Institute of Technology, Sept 1991. 1.2.8.4.3.17 Lin, R. Y., Warrier, S. G., and et. al., “The Infrared Infiltration and Joining of Advanced
Materials,” JOM, Vol 46, March 1994, pp. 26-30.

MIL-HDBK-17-4A Volume 4, Section 1 Guidelines
51
1.3 TEST PLANS FOR MATERIALS CHARACTERIZATION 1.3.1 INTRODUCTION 1.3.1.1 Objective The objective of these guidelines is to make recommendations regarding minimum handbook proper-ties data that are required for establishing A-Basis, B-Basis and S-Basis mechanical properties for MMC systems. These recommendations cover the composites in final form, the constituents, and intermediate forms. One of the benefits of composite materials is the ability to tailor their properties to meet design criteria for specific applications. For this reason, the recommendations which follow have been developed to pro-vide flexibility in selecting the applicable test matrices, and number of tests. However, the need remains for statistically valid data in all critical orientations under the anticipated temperature and stress regime for each component. It is recommended that specific end-use data be reported even if it covers only a small portion of the plans defined in the handbook. Frequently, testing outside that listed is completed. This data can provide very useful information and should be reported. In instances where testing methods used are not Refer-enced in this handbook, the specimens and test methods should be described in detail. 1.3.1.2 Classes of data Material property data sets submitted for possible publication are classified by one of the two MIL-HDBK-17 data classes described below, and are examined to see that material and process (Section 1.2.6), sampling (Section 1.3.2), test methods (Section 1.4), and data documentation (Section 1.3.2.5) requirements are meet for the properties discussed in Sections 1.3.4.2 and 1.3.5.2. B-basis values are presented in the handbook only for fully approved data. (A-basis values may also be presented if suffi-cient data are available.) The two MIL-HDBK-17 data classes for MMCs are:
• Fully Approved Data Statistically-based material properties that meet the most stringent handbook level of population sampling (1.3.4.2 and 1.3.5.2), data documentation (1.3.2.5), and test method requirements.
• Screening Data
Any submission that does not meet fully approved requirements will be defined as screening data. Minimum data and documentation requirements will be determined by the Data Review Working Group on a case-by-case basis.
1.3.2 REQUIREMENTS 1.3.2.1 Test method selection Specific test method criteria apply when submitting data to MIL-HDBK-17 for consideration for inclu-sion in Section 3 of the Handbook, based on the following concepts. Ideally, a test method should have undergone a rigorous review of its applicability, precision and bias by an independent voluntary consensus standards organization that may include representatives from material suppliers, end-users, academia, or government. This review, and the test method, should be available in a Referenceable, open-literature publication, and include interlaboratory (round robin) testing. Many times test methods meeting the above criteria are not available, and methods which meet less rigorous criteria (2 below) must be selected for data submittal. The MIL-HDBK-17 MMC Coordination Group has identified specific test methods to be used when submitting data for consideration for inclusion in Section 3 of the Handbook. These methods are desig-nated or described in Sections 1.4 through 1.10, and meet one or more of the following criteria:
MIL-HDBK-17-4A Volume 4, Section 1 Guidelines
52
1. Methods, applicable to advanced composites and in common use, which have completed the fol-lowing: • Round robin testing under sponsorship of a recognized standards-making organization • Rigorous review of precision and bias • Publication in the open literature of a recognized standards-making organization
2. Where no standards meeting the above criteria exist for specific structures or process/product
forms, other test methods may have been selected by consensus of the MIL-HDBK-17 MMC Co-ordination Group. Such methods may have been developed within the MIL-HDBK-17 Working Groups, or by other organizations, and will have begun the process toward formal standardization.
The test methods used for generating data submitted to the handbook must meet the handbook recom-mendations, current at the time the tests were performed. 1.3.2.2 Test conditions selection The selection of conditions at which testing is performed is driven by many factors. In general, testing is best performed under the actual service conditions for which the material will be used. However, testing at each and every set of service conditions is cost and time prohibitive. Therefore, a compromise must be made which covers the usable range of the material, yet minimizes testing. This is usually accomplished by testing at the extremes of the application for the material, allowing the user to interpolate for applica-tions between these extremes. This assumes that the properties vary somewhat linearly between these extremes. This is not always the case, as local maxima or minima are sometimes observed (for example, ductility minimum). If such anomalies occur, then an additional set of tests should be conducted at those conditions. In addition to service conditions, there are other goals which may influence the choice of test condi-tions selection. If testing is performed to characterize a model, then that specific model should dictate the types of tests and conditions at which to conduct the tests. Testing is sometimes performed beyond the useful range of the material capabilities in order to understand the material behavior under extreme ser-vice conditions (that is, overloads, overtemperatures, and so on). Therefore, testing may be performed under conditions where the material incurs excessive amounts of creep, plasticity, oxidation, or other forms of damage. An excessive amount of testing should not be performed in ranges where the material is nominally elastic, where no thermal effects apply, or where limited damage accumulates. 1.3.2.3 Specimen number and sampling General: Generation of design allowables for metal matrix composite systems usually imply that data have been pooled from different batches, locations, or even slightly different processes. For computa-tional purposes, the definition of a population must be sufficiently restrictive to ensure that the calculated design variables are realistic and useful. A homogeneous population for data pooling should not include more than one composite system of fiber and matrix constituents, heat treat condition, test temperature, fiber orientation, fiber volume fraction, and test method. Statistical analysis of the pooled data should then be performed to confirm that they represent the same population. A decision will then be made after dis-cussions with the certifying agency or, for MIL-HDBK-17, by the Data Review Group. Sampling for Continuous Fiber Reinforced Metal Matrix Composites For all continuous fiber reinforced metal matrix composites, samples should be taken from every panel to ensure that there is a homogeneity of properties in the entire batch or lot. The sample should be obtained from randomly selected areas of the panel so as to accurately represent the rest of the material. At least one specimen needs to be taken from each panel that is 6” x 6” (15 cm x 15 cm) or less. For composite panels larger that 6” x 6”, at least two specimens should be removed. A test method should be chosen by mutual agreement between the manufacturer and the end user. Tensile or low cycle fatigue are often used for such screening tests. These screening tests are in addition to the testing requirements out-lined in Sections 1.3.3 and 1.3.4 of the Handbook.

MIL-HDBK-17-4A Volume 4, Section 1 Guidelines
53
1.3.2.4 Specimen preparation This description is for the machining of composite test specimens. These test specimens will be sub-jected to cyclic and monotonic loads in order to characterize the behavior of these advanced, state-of-the-art materials. The mechanical properties of the materials will then be used to characterize models and provide data for design. Therefore, it is imperative that the machining process does not introduce any damage that will adversely affect the properties of the material. These materials are usually supplied in plate form approximately one sq. ft. in size. Portions of the plate may be delivered if specimens have previously been machined from them. The thicknesses of the plates vary from 0.04" (0.1 cm) (for a 4-ply composite) to 0.30" (0.8 cm) (for a 32-ply composite). These materials are very expensive (approx. $10,000/sq. ft.) and require long lead times to purchase. The con-cern, therefore, is to get good quality specimens from these plates with no mistakes and minimal material waste. Due to the inhomogeneity (that is, hard ceramic fibers and soft matrix) and the extreme anisotropy of these materials, they are not easily machined. This is exacerbated by the fact that the plates are often slightly warped due to the high residual stresses (due to the CTE mismatch between the fibers and the matrix, as well as from irregular lay-ups, that is, fiber misalignment, non-uniform matrix layers) from manu-facturing of the plates. For these reasons, conventional machining practices do not work. Non-conventional machining methods have been successfully used for these materials. There are three ways in which these materials have typically been machined: wire electro-discharge machining, abrasive water-jet machining, or diamond cutting/grinding of the entire specimen. All of these methods have been used successfully for thinner materials (8-ply or less). For thicker materials, abrasive water-jet cutting does not have a sufficient force to cut through the material and maintain accurate geome-tries; therefore, one of the other machining methods must be used. The machining method chosen should be maintained throughout the entire test program, if possible, to eliminate machining as a possible lurking variable in the data. When preparing 0° specimens, care must be taken to ensure that the fibers are aligned parallel to the specimen axis. Likewise, when preparing specimens with off-axis or cross-ply fiber orientations, good alignment should also be maintained between the specimen axis and the desired orientation. Large devia-tions could result in errors in the mechanical properties. Typically, an alignment of ±1° is desired. Larger deviations in alignment should be reported. If damage on the edge of the gage section (this is a machined surface) is of concern either because it is too rough to support an extensometer, too irregular to get an accurate measurement of the cross-sectional area, or because there is a concern with machining damage influencing the test results, then the specimens can be cut oversized by approximately 0.020 inches (0.050 cm) in the gage and radius sec-tions and be subsequently diamond ground to final dimensions. Final grinding passes should be done in the longitudinal direction (that is, the direction of loading) to avoid scratches that may initiate damage (cracks). Specimen edges (that is, machined surfaces) may be polished to aid in the viewing of cracks either by optical or replicative means. The faces of the specimen, which consist of a layer of matrix material above the outer most plies of fibers, are usually not prepared in any way. The reason for this is that the matrix face layer is often thin, and there is a good chance that through the preparation process, fibers will be ex-posed to the surface. This could damage the fibers, or at the least will provide an easy access for the en-vironment into the material (note that the fiber coating on the SCS-6 fiber is an easy diffusion path for oxy-gen). In either case, the mechanical properties could be compromised. However, polishing may be re-quired to facilitate matrix-crack detection during fatigue and fatigue crack growth testing. If polishing of the faces of the specimen is required, care should be taken to remove a minimum of matrix material. Light polishing can be conducted with the following procedure: 320, 400, then 600 grit abrasive paper fol-lowed by 6 and 3 micron diamond paste. A sample of typical machining instructions is given in Figure 1.3.2.4(a) for the sample geometry given in Figure 1.3.2.4(b). This sample design is used for uniaxial loading. Its design originated from a finite element analysis, constructed to prevent failure in the transition area by minimizing and separating the

MIL-HDBK-17-4A Volume 4, Section 1 Guidelines
54
shear and axial stress concentrations which occur at the transition between the radius and the gage sec-tion (Reference 1.3.2.4(a)). This geometry is proposed in the revision of ASTM Standard D3552-77 (the latest version is ASTM D3552/D3552M-96), Test Method for Tensile Properties of Fiber-Reinforced Metal Matrix Composites, as the recommended design for specimens of unidirectional composites. Other sam-ple geometries may be used. Figure 1.3.2.4(c) shows a dogbone-shaped specimen which has been used successfully and has the added advantage that it uses less material. The key to an adequate specimen design is that the specimen must fail in the gage section. If failure frequently occurs in the transition, ra-dius or grip areas, then the data from these specimens should be labeled as suspect and a new specimen geometry sought.
Rectangular cross-section gage
1) Wire EDM material approximately 0.020" oversized on gage and radius cuts before grinding. 2) Diamond grind on gage and radius to final dimensions as per detail dimensions shown. 3) Remove final stock with a series of light passes to minimize the depth of damage and work
hardening. 4) Material supplied is unique and not easily replaced; therefore, take extra care to set up correct
dimensions before making any cuts. 5) The reduced gage section width (0.390") should be centered relative to the width (0.500") of the
specimen ends within + 0.001". 6) The reduced gage section should be also centered with respect to the length (6”) of the speci-
men within ± 0.001” 7) Cut surfaces marked A [gage edge and end edge] should be true and square. Also, A surfaces
should be parallel to specimen centerline within + 0.001". 8) All radii must blend without undercuts or steps. 9) Number each specimen with permanent ink and identify the unique position of the plate from
which it came. 10) The one inch straight gage section and the radii must have a 32 rms finish or better. 11) Thickness as supplied 12) Return ALL material and scraps. Protect ground surfaces of specimen from damage.
FIGURE 1.3.2.4(a) Machining instructions.
For specimens which contain off-axis plies, there is an additional factor in determining the gage width/length of the specimen. A study has shown that when off-axis fibers in the gage begin, end, or begin and end in either the radius or the grips, there is additional constraint on the specimen, thus affecting at least the room temperature tensile properties (Reference 1.3.2.4(b)). Thus, while the gage width may maintain a value identical to that of the unidirectional specimens, the gage width-to-length must be sized such that there are few fibers from the gage ending in either the radius or grips. In other words, the fibers in the gage section should begin and end in the straight gage section. Depending on the inclination of the fibers with respect to the specimen axis, this may necessitate a longer gage section.

MIL-HDBK-17-4A Volume 4, Section 1 Guidelines
55
Specimens will often require a heat treatment to either age the in-situ matrix or to simulate some thermomechanical treatment which the component may experience. The heat treatment should be per-formed after machining for several reasons. First, the heat treatment may help relieve machining residual stresses. Second, if only a few specimens are heat treated at a time and if there is a problem with the heat treatment, then only a few specimens will be ruined and not the entire plate. Lastly, due to the high residual stresses in the composite, the specimens may warp when cut out of the plate. This can be cured by subsequent heat treating of the specimen under weight for creep flattening. It should be noted that due to the high residual stresses in the composite, initially flat specimens may not come out of the heat treat furnace as flat. In some cases, specimens have been observed to be so severely bent and warped that they were rendered useless. Again, weighting the specimens during heat treatment should solve this problem.

MIL-HDBK-17-4A Volume 4, Section 1 Guidelines
56
FIGURE 1.3.2.4(b) MMC/IMC dogbone specimen - 14.5” radius.
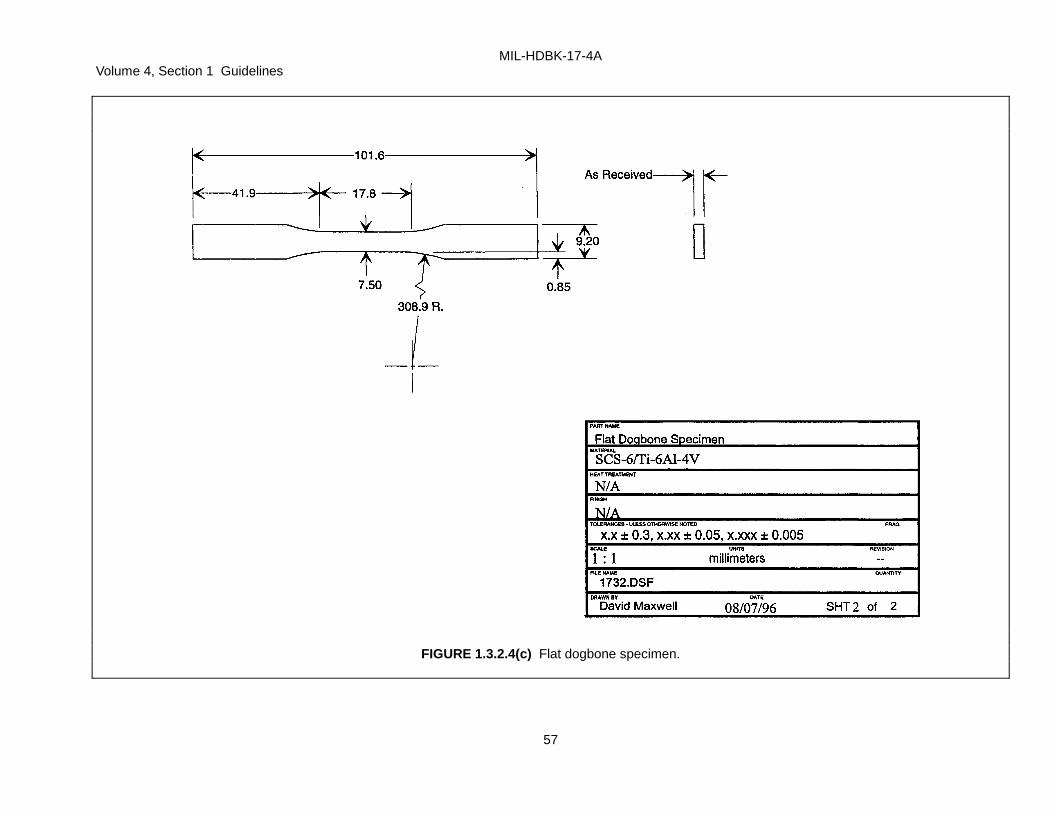
MIL-HDBK-17-4A Volume 4, Section 1 Guidelines
57
FIGURE 1.3.2.4(c) Flat dogbone specimen.

MIL-HDBK-17-4A Volume 4, Section 1 Guidelines
58
1.3.2.5 Data documentation Requirements Checklist
MIL-HDBK-17 (MMC’s) Data Documentation Requirements Checklist
Material Name: __________________________________
Data Submitted by: __________________________________
Date Submitted: ___________________ Does Data meet MIL-HDBK-17 requirements for fully approved data? Yes ___ No ___ For fully approved data, the requirements listed in Volume 4, Section 1.3.4 (Continuous Fiber Reinforced Metal Matrix Composites) or Section 1.3.5 (Discontinuous Reinforced Metal Matrix Composites) must be fulfilled. In addition, all the items listed below marked by an arrow must be provided either on the Submit-ter’s data Tables or on this checklist in order to meet the handbook’s Full Documentation Requirements. Otherwise, the data will be considered as Screening Data if those items marked by an arrow are not sup-plied. Name (POC): ___________________________
Organization: ___________________________
Telephone: _____________________
MATERIAL IDENTIFICATION
Reinforcement ID
Matrix ID
Continuous or Discontinuous
REINFORCEMENT INFORMATION
Form (fiber, whisker, particulate, etc.)
Commercial Name
Manufacturer
Chemical Composition
Core Material (If Continuous)
Processing Method
Diameter
Nominal Density
Lot Number(s)
Processing Date
= For Full Documentation Requirements 6/00

MIL-HDBK-17-4A Volume 4, Section 1 Guidelines
59
Material Name: __________________________________
Data Submitted by: __________________________________
Date Submitted: ___________________
REINFORCEMENT INFORMATION (Continued)
Nominal Filament Count (If Applicable)
Fiber Alignment Material (crossweave)
Fiber, Tow, or Yarn Count (per inch)
Aspect Ratio (If Discontinuous)
Shape (If Discontinuous)
Size Distribution (If Discontinuous)
MATRIX INFORMATION
Matrix Composition
Matrix Supplier
Matrix Heat No.
CONSOLIDATION PROCESS INFORMATION
Manufacturer
Manufacture Date
Process Sequence Description
Process Temperature/Pressure/Time
COMPOSITE INFORMATION
Product Form
Material Lot/Serial/Part No.
Product Form Dimensions
Reinforcement Volume Fraction
Lay-Up & Ply Count (If Applicable)
Nominal Density (g/cc)
Void Content (If Cast Process)
= For Full Documentation Requirements 7/21/00

MIL-HDBK-17-4A Volume 4, Section 1 Guidelines
60
Material Name: __________________________________
Data Submitted by: __________________________________
Date Submitted: ___________________
SPECIMEN INFORMATION
Machining Method
Specimen Geometry
Specimen Overall Dimensions
Surface Condition
Specimen Orientations
Pre-Test Exposure
Tabbing Method (If Applicable)
MECHANICAL TESTING
Type of Test(s)
Test Method/Procedure
Number of Specimens
Gauge Length
Test Date
Test Temperature
Test Environment
Failure Mode and Location
= For Full Documentation Requirements 7/21/00

MIL-HDBK-17-4A Volume 4, Section 1 Guidelines
61
Static Properties Documentation
For static properties, the following information should be provided for each specimen in tabular (spread-sheet) form as shown on the data Table templates provided by MIL-HDBK-17 Secretariat:
Specimen No. Yield Strength @ 0.2%, (F y 0.2 ) (ksi)
Fiber Volume % Ultimate Strength, (F u ) (ksi)
Lot I.D. (Plate No.) Elongation, (εf ) (%)
Test Temp. ( oF ) Reduction in Area, RA (%)
Strain rate (1/s) Gage Length (in)
Modulus, (E) (Msi) Gage Diameter (in)
Proportional Limit (ksi) Gage Width (in)
Yield Strength @ 0.02%, (F y 0.02 ) (ksi) Gage Thickness (in)
In addition, the data submitter should include all information they have readily available for each speci-men. Additional columns should be added to the right of the standard data Table as needed. Examples of such information are:
Test Date Specimen Size (in)
Failure Location Cross Sectional Area (in2)
Failure Mode Poisson’s Ratio, (ν)
Stress-Strain Curve
= For Full Documentation Requirements 7/21/00
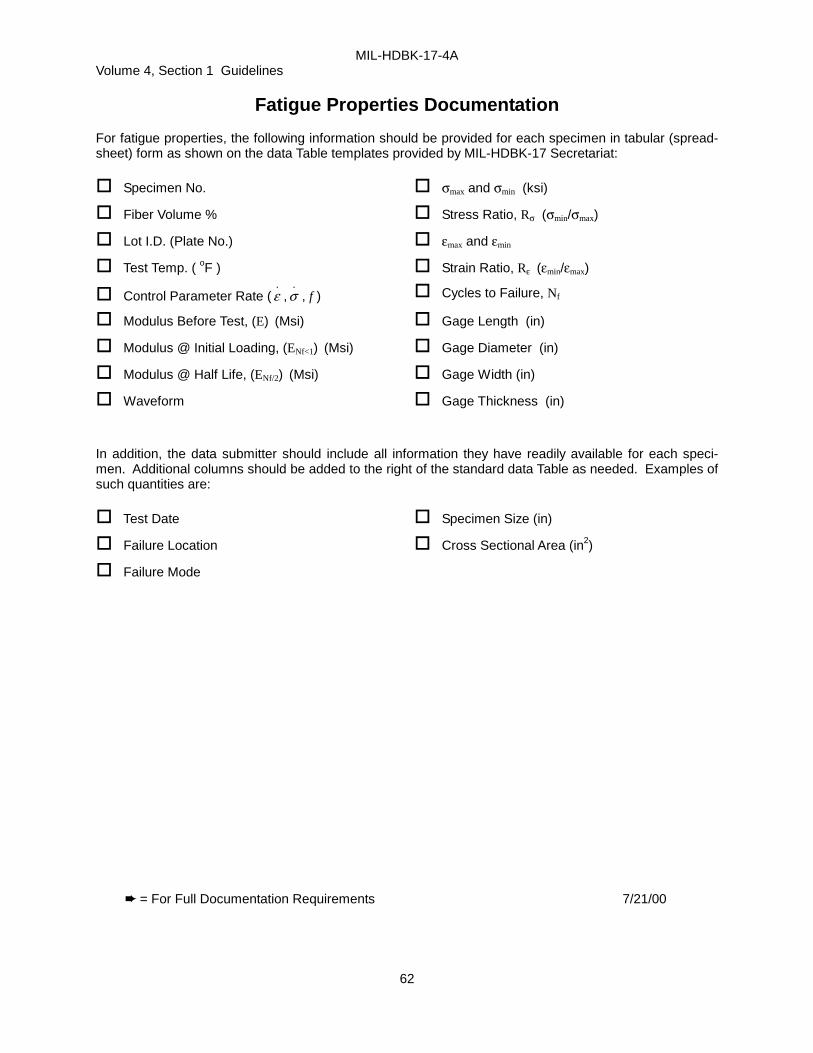
MIL-HDBK-17-4A Volume 4, Section 1 Guidelines
62
Fatigue Properties Documentation
For fatigue properties, the following information should be provided for each specimen in tabular (spread-sheet) form as shown on the data Table templates provided by MIL-HDBK-17 Secretariat:
Specimen No. σmax and σmin (ksi)
Fiber Volume % Stress Ratio, Rσ (σmin/σmax)
Lot I.D. (Plate No.) εmax and εmin
Test Temp. ( oF ) Strain Ratio, Rε (εmin/εmax)
Control Parameter Rate (.ε ,
.σ , f ) Cycles to Failure, Nf
Modulus Before Test, (E) (Msi) Gage Length (in)
Modulus @ Initial Loading, (ENf<1) (Msi) Gage Diameter (in)
Modulus @ Half Life, (ENf/2) (Msi) Gage Width (in)
Waveform Gage Thickness (in)
In addition, the data submitter should include all information they have readily available for each speci-men. Additional columns should be added to the right of the standard data Table as needed. Examples of such quantities are:
Test Date Specimen Size (in)
Failure Location Cross Sectional Area (in2)
Failure Mode
= For Full Documentation Requirements 7/21/00

MIL-HDBK-17-4A Volume 4, Section 1 Guidelines
63
1.3.3 MATERIALS PEDIGREE When submitting data to the Handbook, a complete set of pedigree information is required. This is to establish the validity of a manufacturer’s material system’s physical, chemical, and mechanical property database. The requirements are necessary to establish justification for the inclusion of data into MIL-HDBK-17. Documentation requirements ensure complete traceability and control of the database devel-opment process from material production through procurement, fabrication, machining, heat treating, gag-ing, and testing. Data submitted must include a completed Data Documentation Checklist (see Section 1.3.2.5). Test methods used must meet handbook recommendations at the time the tests were performed. All items in this checklist are desired. Items marked with arrows are required for full approval. All information should be traceable and available to the Secretariat. The Data Documentation Checklist is based on the informa-tion necessary for composite level mechanical property testing. The information required for other tests or material levels is similar. 1.3.3.1 Reinforcement This section is reserved for future use. 1.3.3.2 Reinforcement sizing This section is reserved for future use. 1.3.3.3 Reinforcement coatings This section is reserved for future use. 1.3.3.4 Matrix This section is reserved for future use. 1.3.3.5 Intermediate forms characterization This section is reserved for future use. 1.3.3.5.1 Metallized fibers This section is reserved for future use. 1.3.3.5.2 Monotapes This section is reserved for future use. 1.3.3.5.3 Lamina other than monotapes This section is reserved for future use. 1.3.3.5.4 Specialized forms This section is reserved for future use. 1.3.3.6 Composite materials This section is reserved for future use.
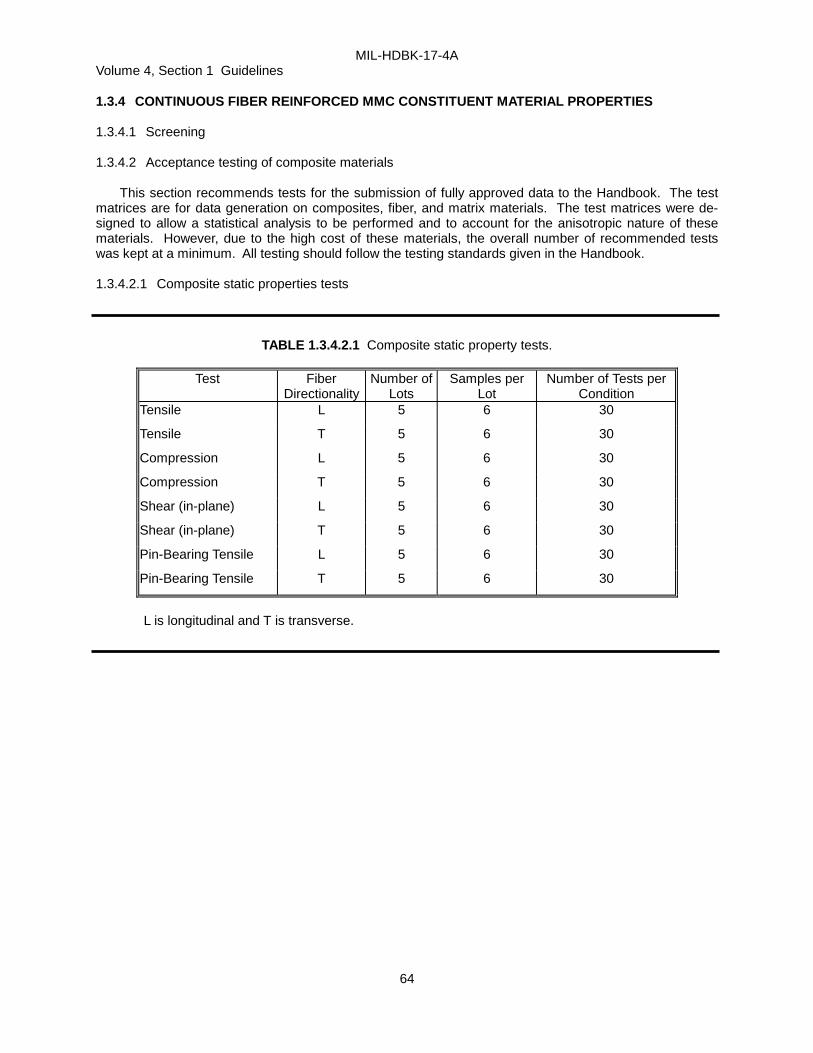
MIL-HDBK-17-4A Volume 4, Section 1 Guidelines
64
1.3.4 CONTINUOUS FIBER REINFORCED MMC CONSTITUENT MATERIAL PROPERTIES 1.3.4.1 Screening 1.3.4.2 Acceptance testing of composite materials This section recommends tests for the submission of fully approved data to the Handbook. The test matrices are for data generation on composites, fiber, and matrix materials. The test matrices were de-signed to allow a statistical analysis to be performed and to account for the anisotropic nature of these materials. However, due to the high cost of these materials, the overall number of recommended tests was kept at a minimum. All testing should follow the testing standards given in the Handbook. 1.3.4.2.1 Composite static properties tests
TABLE 1.3.4.2.1 Composite static property tests.
Test Fiber Directionality
Number of Lots
Samples per Lot
Number of Tests per Condition
Tensile L 5 6 30
Tensile T 5 6 30
Compression L 5 6 30
Compression T 5 6 30
Shear (in-plane) L 5 6 30
Shear (in-plane) T 5 6 30
Pin-Bearing Tensile L 5 6 30
Pin-Bearing Tensile T 5 6 30
L is longitudinal and T is transverse.

MIL-HDBK-17-4A Volume 4, Section 1 Guidelines
65
1.3.4.2.2 Composite fatigue properties tests
TABLE 1.3.4.2.2 Composite fatigue tests.
Test Fiber Directionality
Number of Lots
Stress Levels Replicates Number of Tests per Condition
High-Cycle Fatigue L 3 5 2 30
High-Cycle Fatigue T 3 5 2 30
Low-Cycle Fatigue L 3 5 2 30
Low-Cycle Fatigue T 3 5 2 30
Fatigue Crack Growth Rate L 3 5 2 30
Fatigue Crack Growth Rate T 3 5 2 30
Creep/Stress Rupture L 3 5 2 30
Creep/Stress Rupture T 3 5 2 30
L is longitudinal and T is transverse.
1.3.4.2.3 Composite thermal mechanical tests
TABLE 1.3.4.2.3 Composite thermal mechanical tests.
Test Fiber Directionality
Number of Lots
Stress Levels
Replicates Number of Tests per condition
TMF in-phase (IP) L 2 3 2 12
TMF in-phase (IP) T 2 3 2 12
TMF out-of-phase (OP) L 2 3 2 12
TMF out-of-phase (OP) T 2 3 2 12
Tensile (after thermal cycling) L 5 - 6 30
Tensile (after thermal cycling) T 5 - 6 30
L is longitudinal and T is transverse.

MIL-HDBK-17-4A Volume 4, Section 1 Guidelines
66
1.3.4.2.4 Composite physical properties tests
TABLE 1.3.4.2.4 Composite physical properties tests.
Test Number of Lots
Samples per Lot
Number of Tests per condition
Coefficient of Thermal Expansion (a) 5 1 15 min. per dir.
Specific Heat (b) 5 1 5
Thermal Conductivity (a) 5 1 15
Electrical Conductivity (a) 5 1 15
Density (c) 5 1 5
Volume Fraction (c) 5 1 15
(a) Taken in the L (longitudinal), LT (long transverse), and WT (wide transverse)
directions (b) Property taken parallel to the fiber direction only (c) Property is independent of fiber orientation
1.3.4.3 Intermediate forms characterization This section is reserved for future use. 1.3.4.3.1 Metallized fibers This section is reserved for future use. 1.3.4.3.2 Monotapes This section is reserved for future use. 1.3.4.3.3 Lamina other than monotapes This section is reserved for future use. 1.3.4.3.4 Specialized forms This section is reserved for future use. 1.3.4.4 Constituent characterization This section is reserved for future use.

MIL-HDBK-17-4A Volume 4, Section 1 Guidelines
67
1.3.4.4.1 Fiber properties tests
TABLE 1.3.4.4.1 Fiber property tests.
Test Number of Lots
Samples per Lot
Number of Tests per condition
Tensile 5 30 150
Microstructure (with magnification) 5 3 15
Chemical Analysis 5 3 15
Axial Thermal Expansion 5 3 15
Diameter (range) 5 10 50
Density 5 1 5
Electrical Conductivity 1 1 1
Thermal Conductivity 1 1 1
1.3.4.4.2 Matrix
TABLE 1.3.4.4.2 Matrix Property Tests.
Test Number of Lots
Samples per Lot
Number of Tests per condition
Tensile 5 3 15
Fatigue 5 3 15
Creep 5 3 15
Crack Growth 5 3 15
Hardness 5 3 15
Microstructure (with magnification) 5 3 15
Chemical Analysis 5 3 15
Coefficient of Thermal Expansion 5 3 15
Density 5 1 5
Electrical Conductivity 1 1 1
Thermal Conductivity 1 1 1

MIL-HDBK-17-4A Volume 4, Section 1 Guidelines
68
1.3.5 DISCONTINUOUS REINFORCED MMC & CONSTITUENT MATERIAL PROPERTIES 1.3.5.1 Screening This section is reserved for future use. 1.3.5.2 Acceptance testing of composite materials This section is reserved for future use. 1.3.5.2.1 Composite static properties tests This section is reserved for future use. 1.3.5.2.2 Composite fatigue properties tests This section is reserved for future use. 1.3.5.2.3 Composite thermal mechanical tests This section is reserved for future use. 1.3.5.2.4 Composite physical properties tests This section is reserved for future use.

MIL-HDBK-17-4A Volume 4, Section 1 Guidelines
69
REFERENCES 1.3.2.4(a) Worthem, D.W., "Flat Tensile Specimen Design for Advanced Composites,” NASA CR-
185261, 1990. 1.3.2.4(b) Lerch, B.A. and Saltsman, J.F., "Tensile Deformation Damage in SiC Reinforced Ti-15V-3Cr-
3Al-3Sn, NASA TM-103620, 1991.

MIL-HDBK-17-4A Volume 4, Section 1 Guidelines
70
1.4 COMPOSITE TESTING AND ANALYTICAL METHODS 1.4.1 INTRODUCTION Section 1.4 contains test and analytical methods for characterizing metal matrix composites. The pur-pose of this section is to provide standardized methods and commonly used techniques to pedigree the material and to generate material property data. The test methods and techniques are representative of procedures used in the composite materials industry. Existing standards are cited when they exist and are applicable. When there are no such standards available, a test method has been proposed. The pro-posed test methods are ones that are widely used within industry, academia, or government. Most of these test methods are taken directly from usage on monolithic metals. However, since there are special concerns regarding the testing of MMCs due to their brittle reinforcement phase and their highly anisot-ropic nature, special consideration must be given when adapting such methods. Cautionary notes have been added to many of the monolithic standards in order that they can be applied to MMCs. 1.4.2 CONTINUOUS FIBER REINFORCED MMC MECHANICAL PROPERTY TEST METHODS 1.4.2.1 Tension General: Tensile testing of MMC laminates should be conducted in accordance with ASTM Test Method D3552/D3552M Tensile Properties of Fiber Reinforced Metal Matrix Composites (Reference 1.4.2.1). The following additional points should also apply:
1. A failure location within the area of one specimen width away from the grip or the specimen tab should be considered as an "at grip" failure and these data should be "flagged" as such.
2. When preparing [0] specimens, care must be taken to ensure that the fibers are aligned parallel to
the coupon axis. Likewise, when preparing specimens with off-axis or cross-ply fiber orientations, good alignment should also be maintained between the coupon axis and the desired orientation. Large deviations could result in errors in the strength and modulus values. Typically, an alignment of ±0.5° is desired. Larger deviations in alignment should be reported.
1.4.2.2 Compression This test procedure covers the preferred manner to determine compressive mechanical properties of MMCs. At the present, there are no standardized methods for such testing however, techniques devel-oped for metals and polymer composites have been used with success. Various test fixtures have been designed to introduce compressive loads to the test specimen while minimizing stress concentrations due to gripping and misalignment. These fixtures include the Modified Celanese Fixture, The Illinois Institute of Technology Research Institute (IITRI) Fixture, and the Sendeckyj-Rolfes Fixture. To date, the IITRI test fixture is the most commonly used. Compression tests on MMC's should be conducted in accordance with ASTM Standard D3410-87 (the latest version is ASTM D3410/D3410M-95) "Standard Test Method for Compressive Properties of Unidi-rectional or Crossply Fiber-Resin Composites" (Reference 1.4.2.2). The following additional points should also apply:
1. The IITRI compressive test fixture is the preferred test setup for continuous reinforcement metal matrix composite. However, a desirable specimen dimension may be chosen for straight-sided coupons. Use of end tabs is not an absolute necessity.
2. Strain gages should be affixed to the specimen using the manufacturer's recommended proce-
dures. Two strain gages (one on each face of the test specimen) should be used to determine the magnitude of bending taking place during each test. The use of two gages will provide redun-dancy and will help pinpoint problems that arise during testing. Strain readings that diverge from the beginning of the test suggest specimen bending caused by test specimen/fixture misalign-

MIL-HDBK-17-4A Volume 4, Section 1 Guidelines
71
ments. A sudden divergence between the two readings suggests the onset of specimen buckling. A sharp discontinuity in either or both readings suggests a grip/wedge seating anomaly.
3. Fixture alignment is extremely critical when testing MMC's. The maximum allowable percent
bending stress (PBS), as defined below, may not exceed five percent at failure. Tests with per-cent bending stresses between three and five percent should be flagged as such.
PBS = ABS((G1-G2)/(G1+G2)) x 100 1.4.2.2
where G1 and G2 are the values from strain gages #1 and #2.
4. A failure location within the area of one specimen width away from the grip or specimen tab should
be considered an "at grip" failure. These data should be "flagged" as such. 1.4.2.3 Shear (in-plane) This test procedure covers the preferred manner to determine the in-plane shear properties of MMC. Shear tests on MMCs should be conducted in accordance with ASTM Standard D5379/D5379M "Standard Test Method for Shear Properties of Composite Materials by the V-Notched Beam Method" (Reference 1.4.2.3). The following additional points should also apply:
1. Strain gages should be affixed to the specimen using the manufacturer's recommended proce-dures. It is strongly suggested that two strain gages (one on each face of the test specimen) be used to determine the magnitude of twisting taking place during each test. The use of two gages will provide redundancy, will allow signal averaging if required, and will help pinpoint problems that arise during testing. Strain readings that diverge from the beginning of the test suggest specimen twisting caused by test specimen/fixture misalignments.
1.4.2.4 Fatigue 1.4.2.4.1 Scope This standard addresses isothermal fatigue testing of metal matrix composites. These tests may be performed in either load or strain control and at any constant load (or strain) ratio (Rσ or Rε). In general, the tests should follow ASTM Test Methods E466 (Reference 1.4.2.4.1(a)) and E606 (Reference 1.4.2.4.1(b)). The following notes should also apply: 1.4.2.4.2 Specimen design The specimen design and preparation should follow the recommendations given in Section 1.3.2.4. 1.4.2.4.3 Waveforms Either a triangular (that is, linear ramp) or sinusoidal waveform may be used for cyclic loading. Any constant loading/unloading rate may be employed. Slower loading rates will tend to facilitate creep or stress relaxation of the constituents. Loading rates that are greater than approximately 10 Hz may cause frictional heating between the fibers and the matrix due to interfacial sliding. These loading rates should be avoided unless the material application dictates such rates. 1.4.2.4.4 Control mode Either load or strain control modes may be used in fatigue testing. When using load control, speci-men strain will typically ratchet towards the tensile direction. This is particularly true for high positive load ratios and laminates which do not contain a 0-ply.

MIL-HDBK-17-4A Volume 4, Section 1 Guidelines
72
Strain controlled tests typically show stress relaxation during the test, and in fact can lead to relaxation into the compressive field. This can lead to buckling of thin plate specimens (see Section 1.4.2.4.5). Also, the definition of failure under strain control is frequently a problem (see Section 1.4.2.4.6). 1.4.2.4.5 Compressive loading Testing of thin plate MMCs under compressive loads can lead to unstable buckling of the test speci-men. This can be caused either by the applied compressive load, or due to the fact that the load has re-laxed into compression during a strain controlled test. To avoid buckling, two options exist. The first is to test thicker materials which can withstand compressive loads. This may not be an option due to the high cost of thick materials or difficulties in manufacturing thick composites. The second option is to employ buckling guides. These guides minimally constrain the lateral surfaces of the specimen to prevent buck-ling. They have been used successfully in the fully reversed loading of thin plate TMC specimens (Refer-ences 1.4.2.4.5(a) and (b)). In addition, specimens tested with these buckling guides have been shown to have equivalent lives to thick specimens which were tested under identical conditions without buckling guides. It should be cautioned that improperly designed buckling guides can either erroneously increase the fatigue lives by assuming too much of the axial load or erroneously decrease fatigue lives by introducing frictional wear on the contact surfaces. Therefore, the experimentalist must verify that use of buckling guides is not affecting specimen fatigue life (see Reference 1.4.2.4.5(c) for guidance). 1.4.2.4.6 Failure Testing should continue until failure has occurred. The failure criterion which is used to define failure should be clear. Note 1: With load controlled tests, the specimens should fail in two pieces if there is a tension load in the cycle. Therefore, two pieces is often used as a failure criterion. However, other definitions of failure, particularly for strain controlled tests, can be used (see Reference 1.4.2.4.1(b) for examples). 1.4.2.4.7 Data reporting
1. Stress-strain hysteresis loops should be recorded at periodic times during the test either digitally and/or with analog recorders.
2. The maximum and minimum loads (or strains, which ever are the non-controlled parameters)
should be plotted for each specimen as a function of cycles. 3. The failure location and failure criterion should be reported as well as the reason for any anoma-
lous crack initiation (for example, thermocouple attachment). 1.4.2.5 Fatigue crack growth rate General: This standard allows the determination of fatigue crack growth rates in composite materials using middle-tension, M(T), or single-edge-notch, SE(T) specimens. The results of crack growth rates are expressed in terms of the cyclic range of the applied stress intensity factor, the crack length, or the cyclic range of the effective crack tip stress intensity factor using one of the fiber bridging models such as a shear lag model (References 1.4.2.5(a) through 1.4.2.5(c)), a spring model (References 1.4.2.5(d) and (e)) or a fiber pressure model (References 1.4.2.5(e) and (f)), if a bridging zone develops during the fa-tigue crack growth experiment. This standard should apply only to composite materials which promote self-similar crack extension such as [0], [90], or [0/90] fiber lay-ups. In other fiber lay-ups, complex failure modes usually develop near the machined notch causing a large network of micro-cracks, multiple cracks, delamination, and non self-similar crack extension.

MIL-HDBK-17-4A Volume 4, Section 1 Guidelines
73
The fatigue crack growth tests should be conducted in accordance with ASTM Standard E647 Stan-dard Test Method for Measurement of Fatigue Crack Growth Rates (Reference 1.4.2.5(g)). The following notes should also apply: Specimen Configuration: 1. The thickness of the specimen is controlled by the available composite material, since the available
plate material is generally not machined to a specific thickness. All other dimensions will then be based upon this available thickness and will be determined by the equations for the specimen dimen-sions given in ASTM E647.
2. Direct pin-loading of a unidirectional MMC specimen is not recommended due to the likelihood of a
local bearing failure in the vicinity of the machined holes. Therefore, a wedge loading fixture, similar to those described in ASTM E647, is recommended. The specimen depth in the wedge zone should be greater than 0.5W for a middle-tension M(T) specimen and W for the single-edge-notch tension SE(T) specimen. This distance is dictated primarily by frictional effects and the amount of specimen needed to be clamped by the wedge grips to prevent slippage.
3. Middle-Tension Specimen, M(T):
Standard ASTM E647 M(T) specimens (Figure 1.4.2.5(a)) can be used for specimens which will be tested in a wedge loaded fixture. A wider and longer gripping area can be accommodated, as long as the length of the specimen between the grips is greater than or equal to 3W.
4. Single-Edge-Notch Tension Specimen, SE(T):
The SE(T) specimen (Figure 1.4.2.5(b)) is basically a M(T) specimen which has been sliced in half longitudinally. The length of the specimen between the grips (H) should be greater than 2W. The ap-plied stress intensity factor range, Kapplied, for the SE(T) specimen is very sensitive to the loading method and special attention should be given to the gripping and data reduction when using the SE(T).
The pinned load-train transfers load through a clevis-pin arrangement as shown in Figure 1.4.2.5(c). The grip is free to rotate, creating a uniform stress boundary condition. The applied stress intensity factor range, Kapplied, for the SE(T) specimen with a pinned load-train is calculated as follows: appliedK ( a) F( )σ π α∆ = ∆ • 1.4.2.5(a)
where ∆σ is the applied stress range and:
30.752 2.02( ) 0.37(1 sin( / 2))
F( ) (2 / ) tan( / 2)cos( / 2)
α παα πα παπα
+ + −= • 1.4.2.5(b)
where α = a W/ ; expression valid within ±0.5% for any α (Reference 1.4.2.5(h)). SE(T) with fixed load-train: The SE(T) geometry with a fixed load-train (Figure 1.4.2.5(d)) has different boundary conditions than the pin loaded configuration. The specimen is constrained from rotation, having a uniform displacement boundary condition instead of a uniform stress boundary condition. In this configuration, the applied stress intensity factor, Kapplied, is very sensitive to the ratio of specimen height, H over specimen width, W, and only approaches the pinned load-train configuration for very large values of H/W (References 1.4.2.5(h) through 1.4.2.5(k)). The appropriate Kapplied and crack mouth opening solutions for the SE(T) specimen with a fixed load-train are given in Reference 1.4.2.5(k) for H/W ranging from 2 to 10.

MIL-HDBK-17-4A Volume 4, Section 1 Guidelines
74
FIGURE 1.4.2.5(a) Middle tension specimen, M (T).
FIGURE 1.4.2.5(b) Single-edge tension specimen, SE (T).

MIL-HDBK-17-4A Volume 4, Section 1 Guidelines
75
FIGURE 1.4.2.5(c) Pin-loaded gripping arrangement.
FIGURE 1.4.2.5(d) Rigid gripping arrangement.

MIL-HDBK-17-4A Volume 4, Section 1 Guidelines
76
Compact-Tension Specimen C(T): The C(T) geometry is not recommended for testing unidirectional composites where the reinforcement is parallel to the direction of loading. Anisotropy and the presence of large bending stresses may lead to non-self-similar crack extension (Reference 1.4.2.5(l)). The C(T) geometry can, however, be successfully used for testing relatively thick unidirectional composites in the transverse (that is, [90]) orientation (Refer-ence 1.4.2.5(m)). Consideration should be made for the possibility of local bearing failure in the vicinity of the machined holes as mentioned above. Notch Configuration: 1. The machined notch detail is crucial to ensure self-similar crack extension. A narrow sawcut or EDM
slot having a length less than 0.0625W and terminated by a 30 degree taper at the crack tip is rec-ommended as described in ASTM E647. If a circular notch (hole) is used, multiple cracks will most probably initiate making the crack opening displacement monitoring more complex.
Crack Length Measurements 1. The standard method of determining the crack length using a compliance gage is not valid in the
presence of a fiber-bridged crack, since the bridging fibers shield the crack tip. In addition, the direct current electric potential technique (DCEP) will not yield accurate crack length measurements due to the influence of unbroken, bridging fibers. Therefore, high resolution optical measurements must be made during crack growth testing to accurately determine the crack tip location. For automated test-ing, the direct current electric potential technique (DCEP) may be used to monitor crack growth ac-cording to ASTM E647 Annex 3; however, post-test correction of the DCEP crack lengths to the optical measurements is required paying special attention to fiber failures in the crack wake.
2. When bridging does not occur, errors in the crack length estimated from the compliance reading can
be introduced due to material anisotropy. Therefore, an effective modulus must be used to calculate the crack length from the isotropic compliance.
Bridging Zone Measurements Although the length of the bridging zone (if it exists) is a crucial parameter for calculating the effective crack tip driving force, an expedient method for measuring it in-situ is not yet available. Prior to any fiber failures, the bridging zone (abridged) corresponds to the difference between the current matrix crack tip (a) and the machined notch length (a0): a a abridged = − 0 1.4.2.5(c)
After fibers start failing, the bridged zone decreases suddenly, causing a rapid change in the crack opening profile. Acoustic emission can be used to detect fiber failure and provide a criteria for interrupting the test to evaluate the new bridging zone. NDE techniques such as the scanning acoustic microscope can then be used to determine the length of the bridged zone. The length of the bridged zone can also be determined during the test using a periodic comparison of the crack opening profile along the full crack length with those predicted for an unbridged crack. These measurements require special optical devices due to the small magnitude of the crack displacements in the bridged region. Differences in the crack opening profiles between the bridged and unbridged crack provide a qualitative indication of the extent of bridging and can be used in conjunction with available crack bridging models to deduce the bridged length (Reference 1.4.2.5(n)). Effective Crack Tip Stress Intensity Factor When bridging occurs, the crack tip is shielded from the global applied load, since some of the load is still carried through the bridging fibers. Therefore, the effective crack tip stress intensity factor is given by:

MIL-HDBK-17-4A Volume 4, Section 1 Guidelines
77
effective applied bridgingK K K= − 1.4.2.5(d)
Kbridging corresponds to the closure stress intensity factor caused by the effect of the bridging fibers which act as a closure pressure to the matrix crack tip. If no fiber bridging occurs, then Kbridging = 0. Otherwise, Kbridging is given by:
( ) ( )0
abridging aK C x g x dx= • •∫ 1.4.2.5(e)
where C(x) is the closure load of the bridging fibers in the bridging zone, and g(x) is the weight function of the stress intensity factor for a unit point load applied at a distance x from the crack tip. The function is geometry dependent and is available in the literature for standard geometries (for example, References 1.4.2.5(h) and (k)). If the assumed fiber pressure formulation relates the closure load to the crack opening displacement (that is, C(x) = f(u(x)), where u(x) is the crack opening displacement), an iterative technique is required to solve for the unknown closure load and crack opening displacement. References 1.4.2.5(a) through (f) and 1.4.2.5(o) provide detailed methodologies to calculate the bridging stress intensity factor for various clo-sure formulations. 1.4.2.6 Creep/stress rupture This section is reserved for future use. 1.4.2.7 Pin bearing tension This section is reserved for future use. 1.4.2.8 Pin bearing compression This section is reserved for future use. 1.4.2.9 Filled hole tension This section is reserved for future use. 1.4.2.10 Open hole tension/notch sensitivity This section is reserved for future use. 1.4.2.11 Flexure (three-point bend) This section is reserved for future use. 1.4.2.12 Filled hole compression This section is reserved for future use. 1.4.2.13 Fiber pushout tests 1.4.2.13.1 Background Since being introduced by Marshall (Reference 1.4.2.13.1(a)), fiber indentation techniques have evolved into several variations that have become useful in determining both frictional and bonding contri-butions to the fiber/matrix interfacial shear strength. For small diameter fibers (<50 µm), the thick sample
MIL-HDBK-17-4A Volume 4, Section 1 Guidelines
78
configuration originally used by Marshall (Reference 1.4.2.13.1(a)) is usually followed. In this fiber push-in configuration, only the top portion of the total fiber length experiences any debonding and sliding, and the resultant top-end fiber displacement is related to the compressive strain introduced along the length of debonded fiber. For large diameter fibers (>50 µm), a thin-sample fiber push-out (or push-through) con-figuration, initially demonstrated by Laughner et al. (References 1.4.2.13.1(b) and (c)) for CMCs and later applied towards MMCs (References 1.4.2.13.1(d) and (e)) is usually favored. In this thin-specimen con-figuration, the entire fiber length slides at a critical load. The fiber push-out approach applied to large-diameter fibers will be the test method described herein. Several refinements of the fiber push-out test have improved the quality of data as well as conven-ience of operation. The most important advance was the change from dead-weight loading of fibers to driving the indenter with a constant-displacement-rate mechanism. This allows acquisition of continuous load vs. time or load vs. displacement curves. Bright et al. (Reference 1.4.2.13.1(f)) first demonstrated this approach using an Instron testing machine to control the indenter motion. In-situ video imaging and acoustic emission detection to aid identification of fiber debonding and sliding events were additional fea-tures incorporated into a desktop testing version by Eldridge (Reference 1.4.2.13.1.(g)); this apparatus used a small motorized vertical translation stage instead of an Instron as the constant-displacement-rate mechanism. Direct displacement measurements rather than crosshead speed determinations have been very useful for more reliable interpretation of the portion of the push-out curves before complete fiber debonding (References 1.4.2.13.1(h) and (i)). In some cases, direct measurements of fiber-end dis-placements have been made (References 1.4.2.13.1(j) and (k)), eliminating the need for any compliance corrections to the measured displacements. Another significant improvement in testing large diameter fibers has been the use of flat-bottomed tapered (Reference 1.4.2.13.1(f)) or cylindrical (Reference 1.4.2.13.1(d)) indenters. The flat-bottomed indenters apply the load more uniformly over the fiber end and allows higher applied loads without fiber damage compared to the commonly used pointed microhardness indenters (for example, Vickers). The cylindrical flat-bottomed indenters allow fiber displacements to much greater distances than tapered indenters; however, the tapered flat-bottomed indenters can sustain higher loads. Additional capabilities such as high-temperature testing (References 1.4.2.13.1(l) through (n)) as well as SEM-based instruments (Reference 1.4.2.13.1(o)) provide significant benefits but will not be discussed here. 1.4.2.13.2 General This method covers the basic requirements and procedures for determining interfacial properties of composites using the fiber pushout test method. The method described is recommended for composites reinforced by continuous fibers having a diameter, df, in the range 50mm<df<200mm. Although this method has been used successfully in a wide variety of MMCs (SiC/Ti, SiC/Al, Al2O3/NiAl) and CMCs (SiC/SiC, SiC/SiN3), it may not be suitable for all composite systems. The most important factor limiting the use of this method is the strength of the indenter (punch) with respect to the strength of the interface. Fiber pushout testing may not be applicable to composite systems with a high interface strength since the punch may fail prior to interfacial debonding. In such cases, further reducing the thickness of the composite slice (test specimen) is not recommended as this may result in undesirable failure modes such as matrix cracking, fiber fragmentation, and matrix deformation. It is not in the scope of this work to determine the criteria or provide guidelines to assess the applica-bility of this method for various composite systems. However, Tables A1(a) and A1(b) in Appendix A pro-vide some useful information on the SCS-6/Ti-24-11 composite system, in addition to giving properties of tungsten carbide indenters having flute lengths 2-3 times its diameter.

MIL-HDBK-17-4A Volume 4, Section 1 Guidelines
79
1.4.2.13.3 Description of the method In the fiber pushout test method an indenter (punch) is used to apply axial compressive loading on a fiber in order to debond the fiber and force the fiber to slide relative to the matrix. The fiber to be pushed out is typically situated over a support member with a hole or groove which will accommodate the fiber displacement. This method is shown schematically in Figure 1.4.2.13.3. The load measured at the onset of displacement of the full fiber length is used to determine the shear strength of the interface.
FIGURE 1.4.2.13.3 Schematic of the fiber pushout test method. 1.4.2.13.4 Significance and use In general, there are many reasons that make this method attractive for determining interfacial proper-ties of composites. Preparation of the sample is relatively easy and test specimens are small and can be taken directly from an already manufactured composite. Test samples can also be taken from specimens previously tested or subjected to various heat treatments and exposures. This insures that the residual stress states and conditions of the interface in the pushout specimen will be very similar to those found in the composite or tested specimen where they were obtained. The interfacial shear strength values obtained by this method are particularly useful in the direct com-parison of interfacial properties and failure modes of various composites. This method is also very useful in ascertaining the effects of a particular treatment or mechanical loading on the interface properties, how-ever, the use of the values obtained through this method as an absolute physical property of the interface is not recommended since the stress state present during the pushout test is not well understood. Fur-thermore, the stress state may vary among different composite systems. 1.4.2.13.5 Apparatus A schematic of the apparatus needed to perform a fiber pushout test is shown in Figure 1.4.2.13.5(a). A stand-alone Table top pushout test frame developed by J. Eldridge and used at NASA-GRC is shown in Figure 1.4.2.13.5(b). The size and configuration of the pushout testing apparatus is very compact. There-fore, most commercially available testing frames can be easily and temporarily modified to accommodate fiber pushout testing.

MIL-HDBK-17-4A Volume 4, Section 1 Guidelines
80
The fiber pushout test is usually performed using stroke (displacement) control. Displacement rates are generally in the 60mm/min range. Any commercially available load cell with a load range of 25-50 lbs in compression is adequate. The load cell should be calibrated according to ASTM Standard E4 (Practices for Load Verification of Testing Machines). An x-y stage is required for moving and aligning the sample under the punch. A fine x-y movement (micrometer type) is necessary to facilitate easy alignment of the indenter with the fiber. Any commercially available precision positioning stage is adequate for this purpose.
FIGURE 1.4.2.13.5(a) Typical configuration of the pushout test.
1.4.2.13.6 Indenter A detailed diagram of the indenter (punch) is shown in Figure 1.4.2.13.6. The bottom of the indenter should be flat and perpendicular to the axis in order to assure a uniform compression loading to the fiber, and to prevent premature failure of the punch. The diameter of the punch will depend on the diameter of the fiber tested and should typically be on the order of 0.75-0.80 times the fiber diameter, df. The flute length of the punch becomes important only after the debonding event, in which case the longer the flute length the further the fiber can be pushed out. However, punches with long flute lengths are inherently weaker than those with shorter flute lengths and, therefore, it is advisable to keep the flute length to the minimum required for the desired fiber sliding distances.
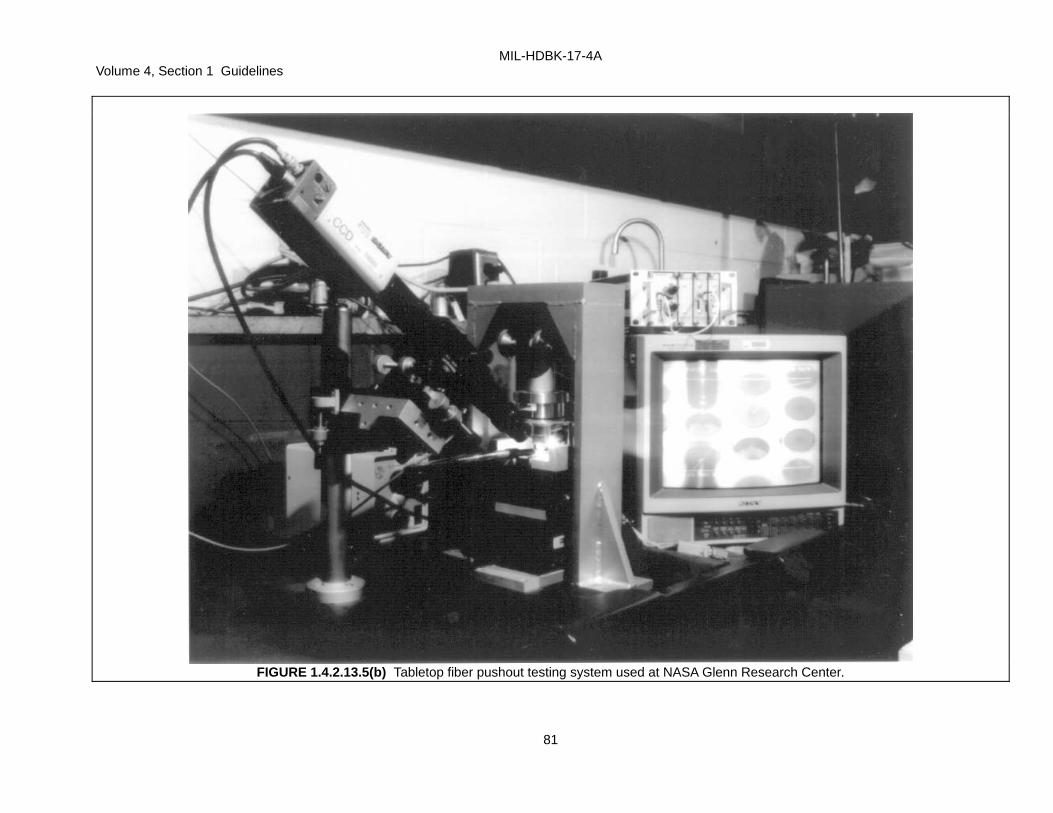
MIL-HDBK-17-4A Volume 4, Section 1 Guidelines
81
FIGURE 1.4.2.13.5(b) Tabletop fiber pushout testing system used at NASA Glenn Research Center.

MIL-HDBK-17-4A Volume 4, Section 1 Guidelines
82
Punches are usually made from WC (tungsten carbide) or SiC (silicon carbide), however, any suitable material can be used provided the punch does not plastically deform or buckle during testing. Flat-bottomed conical diamond indenters are capable of applying much higher loads than cylindrical punches, but displacements are limited to several microns and the diamond indenters are more likely to damage the fiber.
FIGURE 1.4.2.13.6 Typical punch. 1.4.2.13.7 Support plate A typical support plate is shown in Figure 1.4.2.13.7. The support plate can have any configuration required to perform the test. A wide variety of grooves or holes can be incorporated on the support plate in order to accommodate a wide variety of specimen orientations. The width of the grooves will depend on the composite and test specimen geometry. In general, groove widths should be kept to the minimum re-quired to perform the test, in order to minimize bending of the test specimen. Typically groove widths should be on the order of 2-3 df or approximately the thickness of the test specimen. The depth of the grooves is arbitrary, however, the depth should accommodate the desired fiber sliding distances or even the complete removal of the fiber. 1.4.2.13.8 Acoustic emission sensor An acoustic emission sensor can be placed on the punch support, specimen support block, or any other suitable location, in order to record the acoustical emissions associated with the debonding event. The use of this sensor is optional, however, it can prove to be very useful in determining the loads at the onset and completion of debonding. 1.4.2.13.9 Displacement sensor In the fiber pushout test, the relative fiber/matrix displacements are inherently difficult to record. As a result, the pushout behavior is usually recorded as load vs. time. If displacements are required, load vs. stroke can be recorded if the test is performed on a commercially available test frame. Otherwise, an ex-ternally mounted displacement gage, such as a proximity gage, can be employed. It is advisable to mount two proximity gauges on opposite sides of the indenter (180° apart) in order to average out any errors due to slight tilting in the load train during the test. These errors tend to be most significant when the direction of travel is reversed, for example during cyclic testing. It is important to note that the displacements measured in this manner do not represent the actual fiber/matrix relative displacements, since the meas-ured displacements still include the compliance from a portion of the load train, such as compression of the indenter.

MIL-HDBK-17-4A Volume 4, Section 1 Guidelines
83
FIGURE 1.4.2.13.7 Typical support plate. 1.4.2.13.10 Remote viewing using a microscope/camera Due to the size of the fibers, accurate alignment under the punch usually cannot be accomplished by the naked eye. In most cases, moderate magnification in the order of 50X is required. Due to the configu-ration of the loading train, a microscope is usually mounted at an angle with respect to the punch, there-fore requiring a focal length greater than 1.5" (3.8 cm). A microscope with a mounted camera is preferred due to the ease of operation and the additional magnification provided by the camera. The use of a cam-era also makes it possible to obtain a video image record of the test. Alternatively, a two-station configura-tion can be used. One station is the microscope viewing station where the sample is viewed at normal incidence, and the fiber to be tested is positioned at the center of the field of view. The second station is the test station where the fiber is pushed out. The alignment of the two stations is maintained so that the indenter contacts the specimen at the location corresponding to the center of the field of view observed through the viewing microscope. This two-station approach allows superior imaging of the specimen sur-face due to closer proximity of the microscope objective and the normal incident-viewing, but does not provide viewing during the test. This makes the two-station approach the configuration of choice for small-diameter (< 25 µm) fiber testing. 1.4.2.13.11 Test specimen preparation A thin composite slice should be obtained from any region of interest from either the bulk composite material or a test specimen. Since thin slices are generally required for the pushout test, special care should be taken throughout the specimen preparation process to insure that interfacial damage is not in-
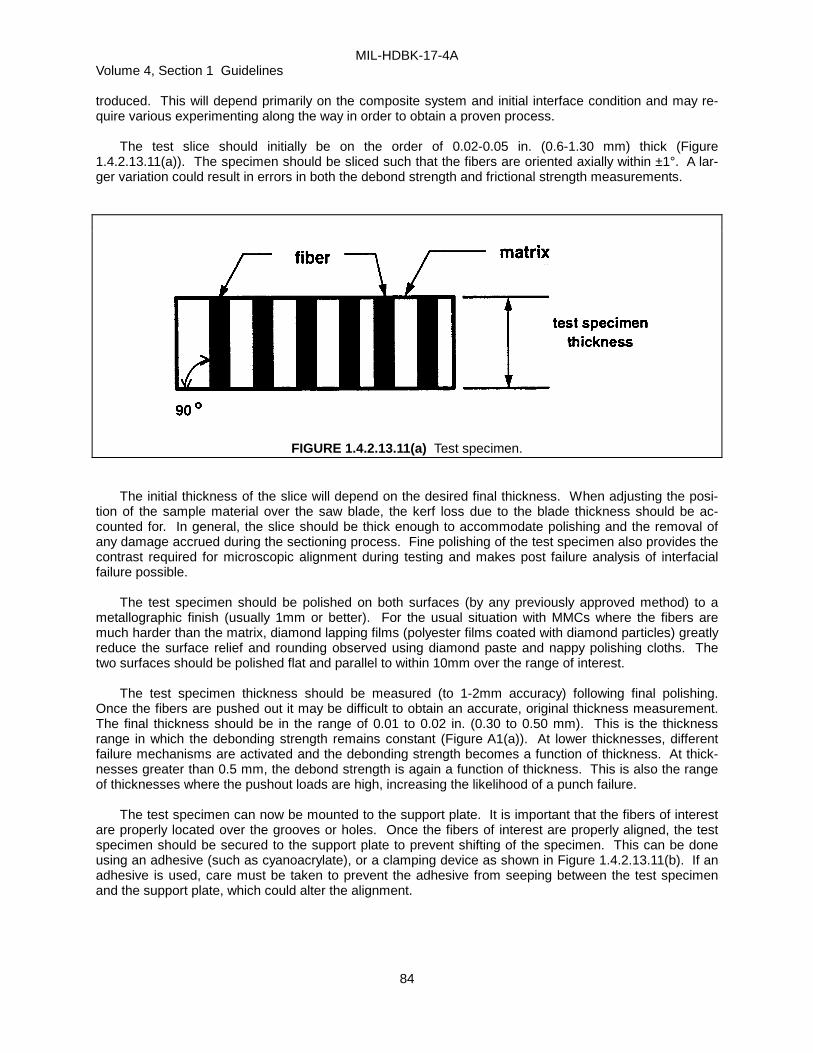
MIL-HDBK-17-4A Volume 4, Section 1 Guidelines
84
troduced. This will depend primarily on the composite system and initial interface condition and may re-quire various experimenting along the way in order to obtain a proven process. The test slice should initially be on the order of 0.02-0.05 in. (0.6-1.30 mm) thick (Figure 1.4.2.13.11(a)). The specimen should be sliced such that the fibers are oriented axially within ±1°. A lar-ger variation could result in errors in both the debond strength and frictional strength measurements.
FIGURE 1.4.2.13.11(a) Test specimen. The initial thickness of the slice will depend on the desired final thickness. When adjusting the posi-tion of the sample material over the saw blade, the kerf loss due to the blade thickness should be ac-counted for. In general, the slice should be thick enough to accommodate polishing and the removal of any damage accrued during the sectioning process. Fine polishing of the test specimen also provides the contrast required for microscopic alignment during testing and makes post failure analysis of interfacial failure possible. The test specimen should be polished on both surfaces (by any previously approved method) to a metallographic finish (usually 1mm or better). For the usual situation with MMCs where the fibers are much harder than the matrix, diamond lapping films (polyester films coated with diamond particles) greatly reduce the surface relief and rounding observed using diamond paste and nappy polishing cloths. The two surfaces should be polished flat and parallel to within 10mm over the range of interest. The test specimen thickness should be measured (to 1-2mm accuracy) following final polishing. Once the fibers are pushed out it may be difficult to obtain an accurate, original thickness measurement. The final thickness should be in the range of 0.01 to 0.02 in. (0.30 to 0.50 mm). This is the thickness range in which the debonding strength remains constant (Figure A1(a)). At lower thicknesses, different failure mechanisms are activated and the debonding strength becomes a function of thickness. At thick-nesses greater than 0.5 mm, the debond strength is again a function of thickness. This is also the range of thicknesses where the pushout loads are high, increasing the likelihood of a punch failure. The test specimen can now be mounted to the support plate. It is important that the fibers of interest are properly located over the grooves or holes. Once the fibers of interest are properly aligned, the test specimen should be secured to the support plate to prevent shifting of the specimen. This can be done using an adhesive (such as cyanoacrylate), or a clamping device as shown in Figure 1.4.2.13.11(b). If an adhesive is used, care must be taken to prevent the adhesive from seeping between the test specimen and the support plate, which could alter the alignment.

MIL-HDBK-17-4A Volume 4, Section 1 Guidelines
85
At this time, if the test specimen has more than one fiber that requires testing, a low magnification photograph of the specimen mounted on the support plate should be taken. This photograph will serve as a Reference for locating the fibers of interest during and after testing.
FIGURE 1.4.2.13.11(b) Typical test specimen mountings on support plate.
1.4.2.13.12 Test procedure The test procedure described does not apply universally to all composite systems, however, it can serve as a basic guideline for determining a proper test procedure. The following procedure is also based on test specimens where many fibers are available and a large fiber population is required. The order of testing can be very important if more than one fiber per test sample needs to be tested. Neighboring fibers should be avoided, because in some cases previously tested fibers may influence the results of adjacent, untested fibers. The fibers to be tested should be chosen at random and at a safe distance from previously tested fibers. If the effects of previously tested fibers on the adjacent fibers is not known, and a large fiber population per test sample is required, then a testing sequence should be em-ployed that reveals the influence of neighboring tests. The testing sequence will be dependent on the test specimen and fiber arrangement. A simple example of a testing sequence is shown in Figure 1.4.2.13.12. This testing order will help determine if there is an effect of neighboring fibers. For example, if the aver-age of tests 7, 8, and 9, are statistically different from the average of 1, 2, 3, 4, 5, and 6, then previously tested fibers probably influence adjacent fiber results. Likewise, if the average of tests 1, 2, 3, 4 is statisti-cally different from the average of tests 5, 6, 10, and 11, an edge effect may be present. It is obvious that several baseline tests are required to obtain a good understanding of the pushout behavior and the factors which affect the results. 1.4.2.13.13 Effects of environment Most fiber push-out tests are performed in room (laboratory) air without considering the effects that moisture or other constituents of air may have on the test results. Recent studies (References 1.4.2.13.1(n) and 1.4.2.13.13) have suggested that the presence of moisture and/or oxygen in the testing environment can substantially alter fiber sliding behavior in some composite materials. As an example, Figure 1.4.2.5(e) shows a set of seven push-out curves obtained in laboratory air and seven tests per-formed in dry nitrogen on the same SCS-6/Ti-24-11 specimen. These curves show that frictional sliding loads were consistently lower and the decrease in load after debonding much more abrupt in the tests per-formed in room air compared to tests performed in nitrogen. Such large differences appear to be associ-ated with interfacial failure in a carbon-rich zone, where fiber sliding would be expected to show similar environmental sensitivity to sliding graphite surfaces, which need adsorbed moisture to maintain low fric-tion. These results dictate that an awareness of possible environmental effects is necessary for a reliable

MIL-HDBK-17-4A Volume 4, Section 1 Guidelines
86
comparison of test results, and, as a minimum, the recording of the humidity level for room air tests is rec-ommended.
FIGURE 1.4.2.13.12 Sample testing sequences.
FIGURE 1.4.2.13.13 Effect of environment on the interfacial properties of SC-6/T-24-11 at room temperature. 1.4.2.13.14 Analysis of results An example of a basic data sheet for recording information during testing is given in Figure A1(b) in Appendix A.

MIL-HDBK-17-4A Volume 4, Section 1 Guidelines
87
It is not in the scope of this report to distinguish between accepTable and unacceptable data results, since for the pushout test even unacceptable results can be useful for qualitative comparisons. The fol-lowing section should serve only as a guideline for interpreting the results. Figure 1.4.2.13.14 shows typical pushout behaviors as observed in various MMC and CMC systems. The behaviors shown in Figure 1.4.2.13.14, a thru d, are accepTable; behaviors in Figure 1.4.2.13.14, e and f, are difficult to interpret. In general, the load increases linearly until the debonding occurs, which is usually associated with a load drop as the fiber is pushed out of the bottom of the specimen. This is often associated with an acoustic emissions event. The debond load, Pdebond, is defined as the maximum load prior to the load drop. Following the debonding, the fibers slide out of the matrix, being restricted by the frictional resistance be-tween the fiber and the matrix. The applied load generally decreases as the fiber displacement increases, since the contact area between the fiber and matrix, and hence the frictional resistance, is decreasing. The frictional load, Pfriction, is usually taken at the secondary peak (if available) as shown in Figure 1.4.2.13.14, a and b, or directly following the load drop as shown in Figure 1.4.2.13.14, c and d. Occasionally, the load will again increase after the fiber has debonded, as shown in Figure 1.4.2.13.14, e and f. Pushout behavior such as this is more difficult to interpret, since following the debonding event the fiber does not slide freely. In such cases, extreme interface roughness or interfacial debris results in interlocking, which further resists fiber displacement. As a result the load increases and may even surpass the initial debond load. Therefore, true frictional behavior is not present in these inter-faces and the frictional load will depend on the extent of interlocking and/or the amount of interfacial debris present. In these cases, the load at the first peak may still be considered as the debond load, however, it should be realized that the degree of interlocking may also influence the debonding event. The usefulness of such results become obvious after a baseline data set has been obtained. The average interfacial shear stress at complete fiber debonding, τdebond, can be calculated from the experimentally obtained debond load using the following equation:
debonddebond
f
P
2 R tτ
π= 1.4.2.13.14
where Rf is the fiber radius and t is the specimen thickness. This stress is an average over the entire fiber length, and thus, does not reflect actual (local) shear stresses, which have been shown to vary significantly along the fiber length (References 1.4.2.13.14(a) and (b)). While useful for comparison between similar thickness specimens, τdebond does not correspond directly to an easily identifiable interfacial property; it contains contributions from both the interfacial debond strength (or fracture energy) as well as frictional resistance to fiber sliding (as partial fiber debond-ing and sliding precedes complete debonding). More sophisticated approaches (References 1.4.2.13.14(c) and (d)) can be used that incorporate residual stresses and fiber roughness; however, care must be taken in modeling the interfacial failure sequence because thin-slice push-outs of MMCs often show interfacial failure initiation at the specimen backface, (References 1.4.2.13.14(a) and (d)), opposite the indenter, and can also show effects of matrix plasticity (Reference 1.4.2.13.14(e)). The analysis must then be tailored to allow/predict this sequence of failure (References 1.4.2.13.14(f) and (g)). The interfacial friction strength, τfriction, can also be obtained using the above equation by substituting Pfriction and τfriction for Pdebond and τdebond. In contrast to the τdebond calculation, the τfriction calculation is a much better approximation to the actual shear stresses present, because when the entire fiber is moving, the resistance to fiber movement is purely frictional and the interfacial shear stress is near uniform along the length of the fiber. It should be pointed out that τfriction is a function of fiber sliding distance rather than a single value. For some tests (Fig-ure 1.4.2.13.14. a thru d), τfriction is fairly constant with continued fiber sliding, but for others (Figure

MIL-HDBK-17-4A Volume 4, Section 1 Guidelines
88
1.4.2.13.14, e thru f), due to severe interfacial wear, τfriction changes rapidly with fiber sliding distance. Therefore, it can sometimes be useful to report τfriction at several sliding distances (References 1.4.2.13.13 and 1.4.2.13.14(h)).
FIGURE 1.4.2.13.14 Typical pushout behavior (A.E. represents the acoustic emissions).

MIL-HDBK-17-4A Volume 4, Section 1 Guidelines
89
1.4.2.14 Microhardness General: This procedure covers the determination of the microhardness of the in-situ matrix material of a MMC. Such information may be desired for determining the state of the in-situ matrix. Microhardness readings may be related to other mechanical properties (for example, strength and modulus), which would be needed for micromechanical modeling purposes, and therefore hardness may be used as a method to estimate the in-situ matrix properties. Some reasons for measuring the microhardness are:
1. To see if the hardness has been modified by matrix and/or composite processing and/or subse-quent heat treatment.
2. To study changes in the reaction zone or the matrix adjacent to the fiber/matrix interface. Fiber
dissolution or intermetallic phase formation may affect these regions. 3. To measure interstitial embrittlement due to interactions with the environment. 4. To measure hardness of individual phases.
Microhardness testing should be conducted in accordance with ASTM Standard E384, “Standard Test Method for Microhardness of Materials” (Reference 1.4.2.14). The following notes should also apply:
1. If the hardness indentations are not to be affected by the fibers and interphase, the indentation should be positioned and sized appropriately. This is done by allowing the distance of approxi-mately two indentation diagonals between the fiber and the indentations.
2. If information is desired regarding the microhardness of the intragranular regions of the in-situ ma-
trix grains, then the indentation should be placed in the center of the grain. If possible, the inden-tation should be sized such that there is a distance of two indentation diagonals between the in-dentation and the grain boundaries. This will ensure that the grain boundary has a minimal influ-ence on the microhardness readings.
1.4.2.15 Thermomechanical fatigue (TMF) (in-phase/out-of-phase) 1.4.2.15.1 Scope This standard describes the procedure for conducting TMF tests on MMC coupon specimens. These tests are performed in load-control and at any constant load-ratio with any constant phasing. This stan-dard applies to composite materials containing any fiber lay-up. The tests should follow, in general, ASTM Standard E466 (Reference 1.4.2.4.1(a)). The following exceptions and notes should also apply. 1.4.2.15.2 Specimen design Specimen design and preparation should follow the recommendations given in Section 1.3.2.4. 1.4.2.15.3 Temperature control and measurement 1. Specimen temperature should be measured using thermocouples in contact with the specimen sur-
face, or by means of other non-contacting techniques, for example, optical pyrometry, that have been calibrated using specimens instrumented with thermocouples.
2. A sufficient number of thermocouples should be used on a dummy specimen of the same material
and geometry which will be used in the tests, to accurately establish the temperature profile along the uniform gage length of the specimen. Discretion is warranted when deciding on the location and number of thermocouples on actual test specimens (subsequent to the specimen used for tempera-

MIL-HDBK-17-4A Volume 4, Section 1 Guidelines
90
ture calibration). Issues of significance include the sensitivity of the test results to surface anomalies and the ease of thermocouple attachment.
3. For all tests, the maximum allowable axial temperature gradient over the gage section at any given
instant in the cycle should be ±0.015 Tmax , where Tmax is the nominal maximum test temperature given in °C and measured under dynamic conditions.
Note 1: The axial temperature gradient over the gage section, o , should be optimized under dy-namic conditions and minimized at an appropriate point within the given temperature cycle (de-noted as Topp). This will likely allow for the gage section temperature gradients to be no greater than ±0.01 Topp at the time Topp is experienced in the cycle.
Note 2: It is recommended that the parallel section of the specimen design be a minimum length of 2 o unless otherwise restricted by specimen buckling concerns. A minimum length of 2 o will allow all of the temperature gradient calibration thermocouples to be located along a constant ge-ometry section of the specimen, facilitating optimization/minimization of the gage section axial temperature gradients under dynamic conditions. This condition is particularly advantageous when the method of heating is direct induction.
The temperature(s) indicated by the control thermocouple(s) should not vary by more than ±3°C from the initial value(s) at any given instant in time within the cycle, throughout the duration of the test. The temperature(s) indicated by the non-control thermocouple(s) should not vary from the initial value(s) at any given instant in time within the cycle by more than the thermocouple's standard limits of error plus ±2°C, throughout the duration of the test. For example, the standard limits of error for K-type Chromel(+) versus Alumel(-) thermocouples are as follows: Temperature Standard Limits of Error 0 to 326°C ± 2°C 327 to 1310°C ± 0.75 % of T (°C) Therefore, if the temperature indicated by a non-controlled thermocouple at, for example, t = t15 (that is, 15 seconds into the cycle) is 800°C, (standard limits of error = ± 6°C), the temperature measurement at t = t15 in all subsequent cycles should not exceed the range of 792 to 808°C. 1.4.2.15.4 Waveforms 1. The preferred control waveform for both the temperature and load should be a triangular waveform
(that is, linear ramp). This provides for constant loading rates for both the temperature and load throughout the cycle. The use of a sine waveform is not recommended, as both the temperature and loading rates vary continuously throughout the cycle, making rate-related analyses of the data difficult.
2. Both the temperature and the load command waveforms should be of the same type (for example,
sine, triangular). 3. The temperature response waveform should be measured at the center of the gage section. This
may, or may not be the location of the closed-loop temperature control. This measurement should be used for the purpose of quantifying the accuracy of the temperature range (maximum and minimum limits) and load-temperature phasing.
1.4.2.15.5 Phasing 1. Out-of-phase (OP) tests should be conducted such that the load and temperature response wave-
forms are 180-degrees out of synchronization.

MIL-HDBK-17-4A Volume 4, Section 1 Guidelines
91
2. In-phase (IP) tests should be conducted such that the load and temperature waveforms are in syn-chronization with one another.
3. Any other constant phase shift between temperature and load may be used as long as it is clearly de-
scribed and the other guidelines in this standard are followed. 4. Phase-shift error: The two response waveforms should be within a 2-degree phase shift of the pre-
scribed command. For example, for a prescribed 180-degree OP test, the response phase-shift should be between 178 and 182 degrees. Phasing accuracy should be determined based on the re-sponse waveforms, not the command waveforms.
1.4.2.15.6 Pre-test measurements 1. Record the modulus, E, of the specimen as a function of temperature, T, over the range of the tem-
perature which will be applied in the actual test (see ASTM D3039/D3039M Standard Test Method for Tensile Properties of Polymer Matrix Composite Materials (Reference 1.4.2.15.6(a)) for definition of E). This should be done at temperature intervals no greater than 100°C. Smaller intervals are sug-gested if they are needed to accurately define the curve, E vs. T. These data may later be used for calculating the inelastic strains, εin, from the total mechanical strain, εmech, as given by:
in mech / E(T)ε ε σ= − 1.4.2.15.6(a)
where σ is the instantaneous applied stress.
Note 1: The temperature and test system must reach equilibrium at each temperature before the modulus should be measured. If this is not done, then the modulus values can be in error.
Note 2: For the purposes of TMF testing, standard high temperature extensometers should be actively cooled to ensure thermal equilibrium of the extensometer during thermal cycling of the specimen.
Note 3: The variation in modulus for a batch of specimens seeing the same processing may be small. If this can be demonstrated, then the modulus vs. temperature curve for only one speci-men needs to be performed. The pre-test modulus for all other specimens can be restricted to measurements taken only at the minimum and maximum temperature of the cycle.
2. The thermal expansion strain from R.T. to the test initiation temperature, Tinit, should be measured for
the purpose of adjusting the initial gage length, lo, existing at Tinit, that is:
lo (T) = lo (R.T.) + ∆ lth 1.4.2.15.6(b)
where ∆lth is the change in the gage length due to thermal expansion from RT to Tinit.
Note 1: The difference in gage length will be at most 2%. If the actual change is smaller and is not believed to affect the results, then the process of adjusting the gage length can be eliminated.
Note 2: Subsequent to this initial calculation of lo at Tinit, it is not required to continually adjust lo as a function of temperature throughout the temperature cycle for the purpose of calculating real-time strain. That is, it is sufficient to assume that lo remains constant at its Tinit value.
3. Thermal cycling should be performed under zero load over the range of temperatures which will be
used in the actual test. Several thermal cycles should be performed to ensure thermal equilibrium of the test set-up and stabilization of the thermal strain, εth as a function of T. Having established this state of equilibrium, the thermal strain, εth, should be measured as a function of the temperature for

MIL-HDBK-17-4A Volume 4, Section 1 Guidelines
92
both heating and cooling portions of the cycle. This allows the calculation of mechanical strain, εmech, during the post-test data analysis, where:
mech total thε ε ε= − 1.4.2.15.6(c)
where εth is a function of temperature. The point of this cycling is not to document the material prop-erty (CTE), but rather to enable accurate data reduction by confidently measuring the thermal strains in each specimen over the temperature range.
Note 1: This data reduction step is a simplifying assumption which assumes that the thermal ex-pansion behavior of the composite, as measured before the test, remains constant throughout the test (that is, the CTE of the composite material does not change during the test). This assumption has been shown to be in error; the degree of which is dependent upon specific loading conditions, laminate orientation, and damage mechanisms present (Reference 1.4.2.15.6(b)). Ideally, one would record the CTE as a function of cycles and account for the changes accordingly in the data analysis.
Note 2: An attempt should be made to ensure that the number of thermal cycles is kept to the minimum required to obtain a stable εth response. Excessive/prolonged thermal cycling may pro-mote internal damage and/or an undesirable state of initial material oxidation (Reference 1.4.2.15.6(c)).
1.4.2.15.7 Starting the test 1. Subsequent to the measurement of the thermal compensation, thermal cycling should continue, and
the load waveform should be started at the point in the thermal cycle which corresponds to zero load.
Note 1: In a test in which the load does not go through zero (for example, a tension-tension or compression-compression load cycle), subsequent to establishing the thermal dynamic equilib-rium, the load should be ramped to the minimum load desired in the test in time to properly syn-chronize the load and temperature cycles within the required phase-shift error.
2. The test should run until failure has occurred. The failure definition which is used should be clearly defined.
Note 1: With load-controlled tests, the specimens should fail in two pieces if there is a tension load in the cycle. Therefore, two pieces is often used as a failure criterion. However, other defini-tions of failure can be used such as, a percentage change in the original maximum strain or strain range, a percentage change in the modulus at some specified temperature, or buckling of the specimen.
1.4.2.15.8 Data reporting 1. Stress-strain hysteresis loops should be recorded at periodic times during the test either digitally
and/or with analog recorders. 2. The maximum and minimum mechanical strain should be plotted for each specimen as a function of
cycles. 3. The mechanical strain range and the total strain range (∆εtotal = ∆εmech + ∆εth) should be plotted as a
function of cycles. 4. The failure location and failure criterion should be reported as well as the reason for any anomalous
crack initiation (for example, thermocouple attachment).

MIL-HDBK-17-4A Volume 4, Section 1 Guidelines
93
1.4.2.16 Residual strength and stiffness The life of a composite component depends on its ability to withstand damage. Damage can assume many forms in the complicated structure of the composite. Some examples of damage are fiber cracks, matrix cracks, interfacial debonding, interface growth, and oxidation of one or more of the constituents. The designer must be aware of how and to what severity each form of damage affects the composite structure. This is particularly important since composites are often highly anisotropic and damage may only manifest itself in one particular direction. In an attempt to define how much damage has been ac-crued due to some prior loading scheme, residual strength and stiffness tests are often performed. These tests involve subjecting the composite test coupon to some loading sequence such as fatigue loading to various life fractions (that is, N/Nf < 1), or thermal cycling to address damage from the CTE mismatch be-tween the fiber and the matrix. Subsequently, a tensile test is conducted and the stiffness and ultimate strength are measured. The tensile test should be conducted per the instructions found in Section 1.4.2.1 and can be performed at any temperature and strain rate which befits the service conditions. Residual strength and stiffness are then defined as the ratios between those properties in the damaged composite and those in the initial, undamaged state. To completely characterize damage, tensile tests should be run in several directions with respect to the fiber lay-up to account for any anisotropy in the damage state. 1.4.2.17 Bearing fatigue This section is reserved for future use. 1.4.2.18 Open hole fatigue This section is reserved for future use. 1.4.2.19 Filled hole fatigue This section is reserved for future use. 1.4.2.20 Corrosion fatigue This section is reserved for future use. 1.4.2.21 Stress corrosion cracking This section is reserved for future use. 1.4.2.22 Wear This section is reserved for future use. 1.4.2.23 Impact This section is reserved for future use. 1.4.2.24 Damping This section is reserved for future use. 1.4.3 DISCONTINUOUS REINFORCED MMC MECHANICAL PROPERTY TEST METHODS 1.4.3.1 Tension This section is reserved for future use.

MIL-HDBK-17-4A Volume 4, Section 1 Guidelines
94
1.4.3.2 Compression This section is reserved for future use. 1.4.3.3 Shear (in-plane) This section is reserved for future use. 1.4.3.4 Fracture toughness This section is reserved for future use. 1.4.3.5 Fatigue This section is reserved for future use. 1.4.3.6 Fatigue crack growth This section is reserved for future use. 1.4.3.7 Creep/stress rupture This section is reserved for future use. 1.4.3.8 Corrosion fatigue This section is reserved for future use. 1.4.3.9 Stress corrosion cracking This section is reserved for future use. 1.4.3.10 Wear This section is reserved for future use. 1.4.3.11 Impact This section is reserved for future use. 1.4.3.12 Damping This section is reserved for future use. 1.4.4 PHYSICAL PROPERTY TEST METHODS 1.4.4.1 Density Density of the composite should be measured using the Archimedes method described in ASTM D792, “Standard Test Method for Density and Specific Gravity (Relative Density) of Plastics by Displace-ment” (Reference 1.4.4.1). 1.4.4.2 Fiber volume fraction The fiber volume fraction of composites may be obtained by one of two methods. The first is by met-allographic analysis by which the total fiber area is divided by the total specimen area examined (see Sec-
MIL-HDBK-17-4A Volume 4, Section 1 Guidelines
95
tion 1.4.5.1 for details). This method requires a well-polished metallographic sample which has been cut and polished at a right angle to the fiber axis. This method can be simplified by using commercially avail-able image analysis equipment. The second method consists of dissolving the matrix and weighing the remaining, clean fibers. This method can be found in ASTM D3553, “Standard Test Method for Fiber Content by Digestion of Rein-forced Metal Matrix Composites” (Reference 1.4.4.2). 1.4.5 MICROSTRUCTURAL ANALYSIS TECHNIQUES 1.4.5.1 Titanium matrix composites Microstructural details provide important information in characterizing the composite material. Infor-mation such as grain size, phase analysis and distribution, fiber distribution and volume fraction, the status of the fiber/matrix interface, is necessary to pedigree the composite. This section provides methods of performing microstructural analysis for continuous reinforced titanium alloys. Some general metal-lographic practices can be found in References 1.4.5.1(a) through (c). Metallographic preparation of the composite is much more difficult than preparation of monolithic met-als. This is due to the fact that the reinforcement is usually a ceramic, which polishes at a different rate from the matrix. This can lead to rounding of the fiber/matrix interface during polishing, obscuring impor-tant details of this area. Additionally, parts of the fiber can break-off, scratching the surrounding, soft ma-trix material. Damage, such as fiber and interface cracking, can also be induced during metallographic preparation. Therefore, great care must be taken when preparing composite samples to get optically flat, damage-free surfaces. SiC reinforced titanium alloys are best prepared using a fixed grit abrasive, followed by a rolling dia-mond abrasive to remove material. The rolling abrasive is accomplished with a ridged lapping disc to pro-duce the rolling abrasive action for high material removal rates with limited grinding-induced deformation. A common practice method is given below:
1. Diamond grind using successive 181, 68 and 20 micron fixed diamond grits. 2. Grind using successive 6 and 3 micron polycrystalline diamond suspensions using the rolling
abrasive technique. 3. Polish using successive 3 and 1 micron polycrystalline diamond suspensions applied to a hard
synthetic silk polishing cloth. 4. Polish using the above mentioned attack polishing procedure to remove deformation induced from
the diamond polishing steps. 5. Final polish using a vibratory polisher with 0.5 micron diamond with a synthetic high nap polishing
cloth. Etching of most titanium alloys both in the fiberless forms and in the composite can generally be accom-plished by immersion in Kroll's reagent: 1-3 ml hydrofluoric acid 3-6 ml nitric acid 100 ml water Gamma TiAl requires a swab etchant referred to as 30-15-5:

MIL-HDBK-17-4A Volume 4, Section 1 Guidelines
96
30 ml lactic acid 15 ml nitric acid 5 ml water Microstructural details of the fiber are sometimes desired and are easily acquired from polished sec-tions of the composite. To best reveal fiber microstructure in the composite, two methods may be used. The first is an interference layering technique. In this technique, a thin layer of PtO2 or PbO2 is deposited on the polished sample by sputter-coating. The oxide layer changes the samples reflection coefficient. Since each phase has a different reflection coefficient, this gives rise to various colors and enhanced con-trast. More details on this process can be found in (References 1.4.5.1(d) and (e)). The second technique is plasma etching, in which a reactive gas is used as an etchant. This tech-nique has the advantage over more aggressive techniques in that the sample remains cool during the pro-cess. This technique is especially useful for etching SiC (Reference 1.4.5.1(f)). More details on this method can be found in (References 1.4.5.1(g) and (h)). The distribution of the fibers in the composite is of interest to monitor the quality of the manufacturing process. Excessive fiber swimming and touching fibers can be detrimental to the composite properties. Fiber distribution also affects the mechanical properties as is described in Reference 1.4.5.1(i) and fiber distribution should therefore be controlled (when possible) and documented. Fiber distribution can be documented by standard metallographic techniques. Measurements such as center-to-center distance, distance between fibers and plies, and fiber packing array (for example, square, rectangular, and hexagonal) are some of the commonly used measurements. An automated image analy-sis system (References 1.4.5.1(j) and (k)) can aid in the determination of these values. Image analysis systems can also be invaluable in determining fiber volume fraction of the material. In continuously reinforced materials, fiber volume fraction, Vf, can be calculated by measuring the area frac-tion of fibers on a metallographic section taken perpendicular to the long axis of the fibers. Fiber volume fraction is then given by: Vf = (cross-sectional area of fiber) x (number of fibers) / (cross-sectional area of the composite) Although this is a seemingly simple calculation, various values of fiber volume fraction can be calcu-lated depending upon whether or not the outer-most layer of matrix (that is, the face sheets) are included in the cross-sectional area of the composite. This is especially true if the composite material has a clad-ding of matrix material on the outside of the composite. Composite structures often employ a composite core imbedded in a matrix component. In this case, there is the question whether the cross-sectional area is that of the entire part, or only the section which contains fibers. Depending on which cross-sectional area is use, different fiber volume fractions will result. An accurate stress or fatigue life analysis depends on a clear understanding of the fiber volume fraction and therefore, the method of calculating fiber volume fraction should be clearly described. Another source of error in fiber volume fraction measurements occurs when portions of fibers and/or missing fibers exist on the cut edges of the composite sample. Typically, these errors are small and can generally be ignored, as long as the method of calculating the fiber volume fraction has been thoroughly described. The interface is the region between the fiber and the matrix. This region often consists of any coating or sizing which remains on the fiber after consolidation, as well as any reaction zone which may form as a result of the chemical interaction between the matrix and either the fiber or its coating. The interface is important in determining the properties of the composite. This is especially true if off-axis loads are ap-plied to the material, because the interface is critical to the transfer of loads from the matrix to the fiber.

MIL-HDBK-17-4A Volume 4, Section 1 Guidelines
97
The interface is generally very small (for example, <10µm thick) and composite mechanical properties typically decline with increasing thickness of the interface region1. The thickness of the interface can be increased during consolidation if the temperature is too high or the time during consolidation is too long. Additionally, if the composite material is used at elevated temperatures, the interface can grow with time by stress-assisted diffusion mechanisms, thus degrading the composite properties. Therefore, monitoring the thickness of this region is important. If a sample of the composite is properly prepared by, for instance, the metallographic techniques men-tioned above, the thickness of the interface can be measured on an optical micrograph. Likewise, on a well-polished sample, the interface can be inspected for cracking, debonding, oxidation, or change in grain morphology or grain size. Due to the small size of the interface, examination of the polished samples within an SEM is often required due to the enhanced resolution capabilities of the SEM. Detailed chemical information within the interface can sometimes be obtained from an electron microprobe or a chemical analysis in the SEM. However, if an accurate analysis is required, TEM must be used to definitively iden-tify chemistry, phases, and phase morphology in the interface. 1.4.6 CHEMICAL ANALYSIS TECHNIQUES 1.4.6.1 Analysis of carbon and sulfur Test method ASTM E1587 analyzes interstitial carbon and sulfur in composite materials as well and its constituents (Reference 1.4.6.1). To perform this test, a small amount of the subject material is abraded to remove any surface contamination, cut into small pieces (if it is not already in powdered form), de-greased in ether, and placed in an alundum crucible. Accelerators are added to the crucible to ensure and speed up combustion. Runs are then made of the empty alundum crucible, followed by NIST or Leco standards to generate a linear calibration curve. The sample is combusted in a stream of oxygen at temperatures exceeding 2700°F (1500°C) in an induction furnace. Carbon and sulfur in the sample are released and converted to carbon dioxide and sul-fur dioxide, respectively. The sample gases are carried by the oxygen through two infrared detection cells where they absorb energy and produce a spectrum. The energy then passes through a wavelength filter that inhibits all wavelengths except CO2 or SO2, respectively. The detector responds to changes in energy between the carrier gas (oxygen) and the measured gases to determine the concentration of CO2 and SO2. Detector output is converted from an analog to a digital signal which is corrected and adjusted for calibration, specimen container, and weight compensation. Carbon and sulfur values are then displayed and printed out in weight percent. Qualitatively, this combustion method can be used to identify the presence of carbon and sulfur. It cannot, however, distinguish between the various forms of carbon or sulfur. It is useful for samples con-taining either high or low levels of carbon and/or sulfur, since the instrument contains dual-range cells for both elements. The versatility of the dual-range cells enables the accurate measurement of very low lev-els of sulfur and carbon. Quantitatively, the detection range of the instrument for a one gram sample is 0.6 parts per million (ppm) to 5 weight percent (wt%) carbon, and 0.3 ppm to 0.35 wt% sulfur. By reducing the sample weight, the maximum amount of each element that can be detected increases. For more accurate readings at lower concentrations, a larger sample size can be used. This method is useful for all metals, alloys, ceramics, and composites. It can also be used for the analysis of sand and for graphite fibers.
1The exception to this rule is where an interfacial layer is "engineered" to compensate for the mismatch in properties, for example, thermal expansion, between the fiber and the matrix. A compensating or compliant layer may be designed to be thick to better alleviate the high stresses created at the interface, thus improving the overall properties of the composite. The effects of compen-sating layers are described in detail in References 1.4.5.1(l) through (n).

MIL-HDBK-17-4A Volume 4, Section 1 Guidelines
98
1.4.6.2 Analysis for oxygen and nitrogen by inert gas fusion This method is for analyzing interstitial nitrogen and oxygen in composite materials. It can also be used for the neat matrix or reinforcement material (Reference 1.4.2.4.5(a)). To perform this test, a small amount of the subject material is abraded to remove any surface contamination, cut into small pieces (if it is not already in powdered form), and degreased in ether. Samples are then placed into nickel baskets. Powdered samples are first placed in tin capsules and tightly crimped to exclude air before placing them in nickel baskets. The instrument is calibrated with NIST or Leco standards to generate a linear calibration curve. Runs are then made with only the nickel basket (or time capsule and nickel basket) to eliminate elements coming from the containers themselves. The sample is analyzed by sealing a graphite crucible between two electrodes in a furnace and purg-ing it of atmospheric gases. A high current is passed through the crucible to outgas it (remove gases trapped in the graphite). Helium is used as the carrier gas. The sample is then dropped into the crucible and a slightly lower current is passed through the crucible to drive off the sample gases. The oxygen re-leased from the sample combines with the carbon from the crucible to form carbon monoxide. The car-bon monoxide passes through a heated copper oxide and is converted to carbon dioxide. Sample gases then move through an infrared cell where they absorb energy and pass through a wavelength filter that inhibits all wavelengths but CO2. The detector responds to changes in energy between the carrier gas (helium) and the measured gases to determine the concentration of CO2. The detector output is con-verted from an analog to a digital signal which is corrected and adjusted for calibration, specimen con-tainer, and weight compensation. The oxygen value is then displayed and printed out in weight percent. The remaining gases move on to the thermal conductivity cell which consists of a Wheatstone bridge that detects nitrogen by becoming unbalanced due to the difference in thermal conductivity of nitrogen compared to that of helium. The output is converted, integrated, adjusted, and the weight percent nitrogen is displayed and printed out. Qualitatively, this fusion method can be used to identify the presence of nitrogen and oxygen. In cer-tain sample types, it can differentiate between different forms of oxygen and nitrogen by temperature ramping. It is useful for either high or low levels of nitrogen, since the instrument contains dual-range cells for nitrogen. The low range nitrogen cell enables the accurate measurement of very low levels of nitrogen. Quantitatively, the detection range of the instrument for a one gram sample is 0.1 ppm to 0.1 weight percent (wt%) oxygen, and 0.1 ppm to 0.5 wt% nitrogen. By reducing the sample weight, the maximum amount of each element that can be detected increases. For more accurate readings at lower concentra-tions, a larger sample size can be used. This method is useful for all metals, alloys, ceramics, and composites, except those containing Al2O3 fibers. It can also be used to determine high amounts of oxygen (up to approximately 10 wt%) in samples such as Si3N4. 1.4.7 NON-DESTRUCTIVE EVALUATION TEST METHODS A variety of non-destructive testing (NDT) techniques are available for detecting both surface and inte-rior flaws in composites. Visual inspection and liquid penetrant methods can be used for identifying sur-face defects, while more sophisticated techniques are required for detecting internal flaws (that is, voids, inclusions, debonds, fiber non-uniformity). These techniques include ultrasonics, radiography, thermogra-phy, acoustic emission, X-ray, and eddy-current testing. The basic principles and procedures for these methods are covered in the MIL-HDBK-728 series, while more specific information on the theory and in-terpretation of data can be found in the following:
MIL-HDBK-731 Thermography MIL-HDBK-732 Acoustic Emission MIL-HDBK-733 Radiography MIL-HDBK-787 Ultrasonic

MIL-HDBK-17-4A Volume 4, Section 1 Guidelines
99
These documents do not discuss the recent advances in NDT techniques, which are currently an ac-tive field of research and development. 1.4.8 ENVIRONMENTAL EFFECTS TEST METHODS This section is reserved for future use. 1.4.9 INTERPHASES AND INTERFACES TEST METHODS This section is reserved for future use.

MIL-HDBK-17-4A Volume 4, Section 1 Guidelines
100
REFERENCES 1.4.2.1 ASTM Test Method D3552/D3552M, “Tensile Properties of Fiber-Reinforced Metal Matrix
Composites,” Annual Book of ASTM Standards, Vol 15.03, American Society for Testing and Materials, West Conshohocken, PA, 1997, pp. 173-177.
1.4.2.2 ASTM Standard D3410-87, "Standard Test Method for Compressive Properties of
Unidirectional or Crossply Fiber-Resin Composites," Annual Book of ASTM Standards, Vol 15.03, American Society for Testing and Materials, 1995, pp. 131-147.
1.4.2.3 ASTM Standard D5379/D5379M, "Standard Test Method for Shear Properties of
Composite Materials by the V-Notched Beam Method," Annual Book of ASTM Standards, Vol 15.03, American Society for Testing and Materials, 1998, pp. 230-242.
1.4.2.4.1(a) ASTM Test Method E466, “Conducting Force Controlled Constant Amplitude Axial Fatigue
Tests of Metallic Materials,” Annual Book of ASTM Standards, Vol 03.01, American Society for Testing and Materials, West Conshohocken, PA, 1998, pp. 471-475.
1.4.2.4.1(b) ASTM Test Method E606, “Strain-Controlled Fatigue Testing,” Annual Book of ASTM
Standards, Vol 03.01, American Society for Testing and Materials, West Conshohocken, PA, 1998, pp. 528-542.
1.4.2.4.5(a) Sanders, B.P., Mall, S., and Lerch, B.A., “Fatigue Response of the Unidirectional and
Cross-Ply SCS-6/Ti-15-3 MMC,” Proceedings from the Tenth International Conference on Composite Materials, Whistler, B.C. Canada, eds. A. Poursartip and K. Street, Vol I: Fatigue and Fracture, August 1995, pp. 529-536.
1.4.2.4.5(b) Subramanian, S., Lerch, B.A., Castelli, M.G. and Allen, D., “Effect of Fiber Volume
Fraction on Fully-Reversed Isothermal Fatigue Behavior of Unidirectional SCS6/Ti-15-3 Composites,” Composites and Functionally Graded Materials MD-Vol 80, eds., T.S. Srivatsan, A. Zavaliangos, K.I. Jacob, N. Katsube, W. Jones, K. Ramani, S. Sitaraman and S. Yang, ASME, 1997, pp. 131-139.
1.4.2.4.5(c) ASTM Test Method E9, “Compression Testing of Metallic Materials at Room
Temperature,” Annual Book of ASTM Standards, Vol 03.01, American Society for Testing and Materials, West Conshohocken, PA, 1998, pp. 99-106.
1.4.2.5(a) Marshall, D.B., Cox, B.N., and Evans, A.G., “The Mechanics of Matrix Cracking in Brittle-
Matrix Fiber Composites,” Acta Metallurgica, Vol 33, 1985, pp. 2013-2021. 1.4.2.5(b) McCartney, L.N., “Mechanics of Matrix Cracking in Brittle-Matrix Fiber-Reinforced
Composites,” Proceedings of the Royal Society of London, Series A, Vol 409, 1987, pp. 329-350.
1.4.2.5(c) McMeeking, R.M. and Evans, A.G., “Matrix Fatigue Cracking in Fiber Composites,”
Mechanics of Materials, Vol 9, 1990, pp. 217-227. 1.4.2.5(d) Rose, L.R.F., “Crack Reinforcement by Distributed Springs,” J. Mech. Phys. Solids, Vol
35, No. 4, 1987, pp. 383-405. 1.4.2.5(e) Ghosn, L.J., Telesman, J., and Kantzos, P., “Closure Pressure Distributions and Their
Effect on the Crack Driving Force of Bridged Cracks,” 6th Annual HITEMP Review, Vol II: Compressor/Turbine Materials, NASA CP 19117, Oct. 1993, pp. 45-1 to 45-12.
1.4.2.5(f) Ghosn, L.J., Kantzos, P., and Telesman, P., “Modeling of Crack Bridging in a
Unidirectional Metal Matrix Composite,” International Journal of Fracture, Vol 54, 1992, pp. 345-357.

MIL-HDBK-17-4A Volume 4, Section 1 Guidelines
101
1.4.2.5(g) ASTM Standard E647, “Standard Test Method for Measurement of Fatigue Crack Growth
Rates,” Annual Book of ASTM Standards, Vol 3.01, American Society for Testing and Materials, West Conshohocken, PA, 1994, pp. 569-596.
1.4.2.5(h) Tada, H., Paris, P.C., and Irwin, G.R., The Stress Analysis of Cracks Handbook, 2nd
Edition, Paris Production, Inc., St. Louis, Mo., 1985. 1.4.2.5(i) Dao, T., and Metta, S., "Analysis of an Edge-Cracked Specimen Subjected to Rotationally-
Constrained End Displacements,” NASA Johnson Space Center, Report 32171 (LESC 29683), August 1991.
1.4.2.5(j) Blatt, D., John, R., and Coker, D., “Stress Intensity Factor and Compliance Solutions for a
Single Edge Notched Specimen with Clamped Ends,” Engineering Fracture Mechanics, Vol 47, No. 4, 1994, pp. 521-532.
1.4.2.5(k) John, R., and Rigling, B., “Effect of Height to Width Ratio on K and CMOD Solutions for a
Single Edge Cracked Geometry With Clamped Ends,” Engineering Fracture Mechanics, Vol 60, No. 2, 1998, pp. 147-156.
1.4.2.5(l) Kantzos, P., and Telesman, J., “Fatigue Crack Growth Study of SCS6/Ti-15-3 Composite,”
International Journal of Fatigue, Vol 12, No. 5, 1990, pp. 409-415. 1.4.2.5(m) John, R., Lackey, A.F., and Ashbaugh, N.E., “Fatigue Crack Propagation Parallel to Fibers
in Unidirectionally Reinforced SCS-6/Timetal®21S,” Scripta Materialia, Vol 35, No. 6, 1996, pp. 711-716.
1.4.2.5(n) Ghosn, L.J., Kantzos, P., and Telesman, J., “Fatigue Crack Growth and Crack Bridging in
SCS-6/Ti-24-11,” Cyclic Deformation, Fracture and Nondestructive Evaluation of Advanced Materials: Second Volume, ASTM STP 1184, M.R. Mitchell and O. Buck, eds., American Society for Testing and Materials, West Conshohocken, PA, 1994, pp. 64-86.
1.4.2.5(o) Life Prediction Methodology for Titanium Matrix Composites, ASTM STP 1253, Johnson,
W.S. Larsen, J.M. and Cox, B.N., Eds., American Society for Testing and Materials, West Conshohocken, PA, 1996.
1.4.2.13.1(a) Marshall, D.B., “An Indentation Method for Measuring Matrix-Fiber Frictional Stresses in
Ceramic Composites,” J. Am. Ceram. Soc., Vol 67, No. 12, 1984, pp. C258-C259. 1.4.2.13.1(b) Laughner, J.W., Shaw, N.J., Bhatt, R.T., and DiCarlo, J.A., “Simple Indentation Method for
Measurement of Interfacial Shear Strength in SiC/Si3N4 Composites,” Ceram. Eng. Sci. Proc., Vol 7, No. 7-8, 1986, p. 932.
1.4.2.13.1(c) Laughner, J.A., and Bhatt, R.T., “Measurement of Interfacial Shear Strength in SiC-
Fiber/Si3N4 Composites,” J. Am. Ceram. Soc., Vol 72, No. 10, 1989, pp. 2017-2019. 1.4.2.13.1(d) Eldridge, J.I., and Brindley, P.K., “Investigation of Interfacial Shear Strength in a SiC
Fibre/Ti-24Al-11Nb Composite by a Fibre Push-Out Technique,” J. Mater. Sci. Lett., Vol 8, No. 12, 1989, pp. 1451-1454.
1.4.2.13.1(e) Yang, C.J., Jeng, C.J., and Yang, J.M., “Interfacial Properties Measurement for SiC Fiber-
Reinforced Titanium Alloy Composites,” Scripta Metall. Mater., Vol 24, No. 3, 1990, pp. 469-474.
1.4.2.13.1(f) Bright, J.D., Shetty, D.K., Griffin, C.W., and Limaye, S.Y., J. Am. Ceram. Soc., Vol 72, No.
10, 1989, pp. 1891-1898.

MIL-HDBK-17-4A Volume 4, Section 1 Guidelines
102
1.4.2.13.1(g) Eldridge, J.I., “Desktop Fiber Push-Out Apparatus,” NASA TM 105341, December 1991. 1.4.2.13.1(h) Wereszczak, A.A., Ferber, M.K., and Lowden, R.A., “Development of an Interfacial Test
System for the Determination of Interfacial Properties in Fiber Reinforced Ceramic Composites,” Ceram. Eng. Sci. Proc., Vol 14, No. 7-8, 1993, pp. 156-167.
1.4.2.13.1(i) Jero, P.D., Parhasarathy, T.A., and Kerans, R.J., “Interfacial Roughness in Ceramic Matrix
Composites,” Vol 13, No. 7-8, 1992, pp. 64-69. 1.4.2.13.1(j) Warren, P.D., Mackin, T.J., and Evans, A.G., “Design, Analysis and Application of an
Improved Push-Through Test for the Measurement of Interface Properties in Composites,” Acta Metall. Mater., Vol 40, No. 6, 1992, pp. 1243-1249.
1.4.2.13.1(k) Majumdar, B.S., and Miracle, D.B., “Interface Measurements and Applications in Fiber-
Reinforced MMCs,” Key Eng. Mater., Vols. 116-117, 1996 pp. 153-172. 1.4.2.13.1(l) Eldridge, J.I., “Fiber Push-Out Testing of Intermetallic Matrix Composites at Elevated
Temperatures,” in Intermetallic Matrix Composites II, D.B. Miracle, D.L. Anton, and J.A. Graves, Eds., Mater. Res. Soc. Proc., Vol 273, 1992, pp. 325-330.
1.4.2.13.1(m) Eldridge, J.I., and Ebihara, B.T., “Fiber Push-Out Testing Apparatus for Elevated
Temperatures,” J. Mater. Res., Vol 9, No. 4, 1994, pp. 1035-1042. 1.4.2.13.1(n) Eldridge, J.I., “Elevated Temperature Fiber Push-Out Testing,” in Ceramic Matrix
Composites B Advanced High-Temperature Structural Materials, R.A. Lowden et al., Eds., Mater. Res. Soc. Proc., Vol 365, 1995, pp. 283-290.
1.4.2.13.1(o) Daniel, A.M., Smith, S.T., and Lewis, M.H., “A Scanning Electron Microscope Based
Microindentation System,” Rev. Sci. Instrum., Vol 65, No. 3, 1994 pp. 632-638. 1.4.2.13.13 Eldridge, J.I., “Environmental Effects on Fiber Debonding and Sliding in an SCS-6 SiC
Fiber Reinforced Reaction-Bonded Si3N4 Composite,” Scripta Metall. Mater., Vol 32, No. 7, 1995, pp. 1085-1089.
1.4.2.13.14(a) Ghosn, L.J., Eldridge, J.I., and Kantzos, P., “Analytical Modeling of the Interfacial Stress
State During Pushout Testing of SCS-6/Ti-Based Composites,” Acta Metall. Mater., Vol 42, No. 11, 1994, pp. 3895-3908.
1.4.2.13.14(b) Kallas, M.N., Koss, D.A., Hahn, H.T., and Hellmann, J.R., “Interfacial Stress State Present
in a “Thin Slice” Fibre Push-Out Test,” J. Mater. Sci., Vol 27, 1992, pp. 3821-3826. 1.4.2.13.14(c) Parthasarathy, T.A., Marshall, D.B., and Kerans, R.J., “Analysis of the Effect of Interfacial
Roughness on Fiber Debonding and Sliding in Brittle Matrix Composites,” Acta Metall. Mater., Vol 42, No. 11, pp. 3773-3784.
1.4.2.13.14(d) Lara-Curzio, E., and Ferber, M.K., “Methodology for the Determination of the Interfacial
Properties of Brittle Matrix Composites,” J. Mater. Sci., Vol 29, 1994, pp. 6152-6158. 1.4.2.13.14(e) Petrich, R.R., Koss, D.A., Hellmann, J.R., and Kallas, M.N., “On “Large-Scale” Stable
Fiber Displacement During Interfacial Failure in Metal Matrix Composites,” Scripta Metall. Mater., Vol 28, 1993, pp. 1583-1588.
1.4.2.13.14(f) Galbraith, J.M., Rhyne, E.P., Koss, D.A., and Hellmann, J.R., “The Interfacial Failure
Sequence during Fiber Pushout in Metal Matrix Composites,” Scripta Mater., Vol 35, No. 4, pp. 543-549.

MIL-HDBK-17-4A Volume 4, Section 1 Guidelines
103
1.4.2.13.14(g) Chandra, N., and Ananth, C.R., “Analysis of Interfacial Behavior in MMCs and IMCs by
the Use of Thin-Slice Push-Out Tests,” Composites Sci. Technol., Vol 54, 1995, pp. 87-100.
1.4.2.13.14(h) Eldridge, J.I., “Experimental Investigation of Interface Properties in SiC Fiber-Reinforced
Reaction-Bonded Silicon Nitride Matrix Composites,” in Ceramic Matrix Composites-Advanced High-Temperature Structural Materials, R.A. Lowden et al., Eds., Mater. Res. Soc. Proc., Vol 365, 1995, pp. 353-364.
1.4.2.14 ASTM Standard E384, “Standard Test Method for Microhardness of Materials,” Annual
Book of ASTM Standards, Vol 3.01, American Society for Testing and Materials, West Conshohocken, PA, 1995, pp. 390-408.
1.4.2.15.6(a) ASTM Standard D3039/D3039M, “Standard Test Method for Tensile Properties of Polymer
Matrix Composite Materials,” Annual Book of ASTM Standards, Vol 15.03, American Society for Testing and Materials, West Conshohocken, PA, 1995, pp. 114-123.
1.4.2.15.6(b) Castelli, M.G., "An Advanced Test Technique to Quantify Thermomechanical Fatigue
Damage Accumulation in Composite Materials", J. of Composite Technology and Research, Oct., 1994, pp. 323-328.
1.4.2.15.6(c) Revelos, W.C., Jones, J.W., and Dolley, E.J., “Thermal Fatigue of a SiC/Ti-15Mo-2.7Nb-
3Al-0.2Si Composite”, Metallurgical and Materials Transactions A, Vol 26A, May 1995, pp. 1167-1181.
1.4.4.1 ASTM D792, “Standard Test Method for Density and Specific Gravity (Relative Density) of
Plastics by Displacement”, Annual Book of Standards, Vol 8.01, American Society for Testing and Materials, West Conshohocken, PA, 1997, pp. 152-155.
1.4.4.2 ASTM D3553, “Standard Test Method for Fiber Content by Digestion of Reinforced Metal
Matrix Composites”, Annual Book of Standards, Vol 15.03, American Society for Testing and Materials, West Conshohocken, PA, 1997, pp. 169-171.
1.4.5.1(a) Metallography and Microstructures - Volume 9, Metals Handbook, 9th edition, ASM,
Materials Park, OH, 1985. 1.4.5.1(b) Samuels, L.E., Metallographic Polishing by Mechanical Methods, ASM, Materials Park,
OH, 1982. 1.4.5.1(c) Bousfield, B., Surface Preparation and Microscopy of Materials, John Wiley and Sons, NY,
1992. 1.4.5.1(d) Buhler, H.-E., and Houghardy, H.P., Atlas of Interference Layer Metallography, Deutsche
Gesellschaft fuer Metallkunde, Oberursel, Germany, 1980. 1.4.5.1(e) Lerch, B.A., Hull, D.R., and Leonhardt, T.A., "Microstructure of a SiC/Ti-15-3 Composite",
Composites, Vol 21(3), May 1990, pp. 216-224. 1.4.5.1(f) Singh, M., and Leonhardt, T.A., "Microstructural Characterization of Reaction-Formed
Silicon Carbide Ceramics", Materials Characterization, Vol 35, 1995, pp. 221-228. 1.4.5.1(g) Mitomo, M., Sato, Y., Yashima, I., and Tsutsumi, M., "Plasma Etching of Non-oxide
Ceramics", J. Mater. Sci. Lett., Vol 10, 1990, pp. 83-84.

MIL-HDBK-17-4A Volume 4, Section 1 Guidelines
104
1.4.5.1(h) Kirk, R.W., "Applications of Plasma Technology to the Fabrication of Semiconductor Devices", Techniques and Applications of Plasma Chemistry, J.R. Hollahan and A.T. Bell, eds., Wiley, NY, 1974, p. 347.
1.4.5.1(i) Arnold, S.M., Pindera, M.-J., and Wilt, T.E., "Influence of Fiber Architecture on the
Inelastic Response of Metal Matrix Composites", Int. J. of Plasticity, 1996, Vol 12, No. 4, pp. 507-545.
1.4.5.1(j) Russ, J.C., Computer-Assisted Microscopy: The Measurement and Analysis of Images,
Plenum Press, NY, 1990. 1.4.5.1(k) Russ, J.C., The Image Process Handbook, CRC Press, Inc., Boca Raton, FL, 1992. 1.4.5.1(l) Arnold, S.M., Wilt, T.E., "Influence of Engineered Interfaces on Residual Stresses and
Mechanical Response in Metal Matrix Composites", Composite Interfaces, Vol 1(5), 1993, pp. 381-402.
1.4.5.1(m) Salzar, R.S., and Barton, F.W., "Residual Stress Optimization in Metal Matrix Composites
Using Discretely Graded Interfaces", Composite Engineering, Vol 4(1), 1994, pp. 115-128. 1.4.5.1(n) Pindera, M.-J., Arnold, S.M., and Williams, T.O., "Thermoplastic Response of Metal Matrix
Composites with Homogenized and Functionally Graded Interfaces", Composites Engineering, Vol 4(1), 1994, pp. 129-145.
1.4.6.1 ASTM Test Method E1587, “Chemical Analysis of Refined Nickel”, Annual Book of
Standards, Vol 3.06, American Society for Testing and Materials, West Conshohocken, PA, 1997, pp. 512-539.

MIL-HDBK-17-4A Volume 4, Section 1 Guidelines
105
1.5 INTERMEDIATE FORMS TESTING AND ANALYTICAL METHODS 1.5.1 INTRODUCTION This section is reserved for future use. 1.5.2 MECHANICAL PROPERTY TEST METHODS This section is reserved for future use. 1.5.3 PHYSICAL PROPERTY TEST METHODS This section is reserved for future use. 1.5.4 MICROSTRUCTURAL ANALYSIS TECHNIQUES This section is reserved for future use. 1.5.5 CHEMICAL ANALYSIS TECHNIQUES This section is reserved for future use. 1.5.6 NON-DESTRUCTIVE EVALUATION TEST METHODS This section is reserved for future use.

MIL-HDBK-17-4A Volume 4, Section 1 Guidelines
106
1.6 FIBER TESTING AND ANALYTICAL METHODS 1.6.1 INTRODUCTION Composites require strong, stiff fibers with adequate high temperature properties. At many of the pro-jected use temperatures, the matrix material is overextended and is used at temperatures higher than the matrix would normally be used in its monolithic state. Therefore, the fibers must be able to handle the added loads and provide strength in the material. Consequently, fiber development is a crucial part of continued composite improvement. Test methods must be available to determine the properties of the fibers, not only to provide relative properties for fiber development, but also to provide data for microme-chanical composite analyses. Testing fibers is a difficult task since the fibers are very fine (< 150 µm diameter) with some as small as a few microns in diameter. They are consequently difficult to handle and grip in any test rig. Addition-ally, the fibers are generally ceramic and their fracture strength is dependent upon surface and volumetric flaws. Hence, the fiber strength becomes dependent upon the amount of material tested (that is, the length of the gage is important). Such brittle behavior lends a probabilistic nature to fiber fracture and data from many tests have to be statistically analyzed. The test methods in this section describe the proper procedures for dealing with the reinforcing fibers. 1.6.2 MECHANICAL PROPERTY TEST METHODS 1.6.2.1 Tensile tests The recommended procedure for testing single filaments in tension is ASTM D3379 (Reference 1.6.2.1). 1.6.2.2 Creep and creep rupture Since the properties of high temperature composites are strongly influenced by the properties of the reinforcing fibers, the fibers must contain adequate strength at elevated temperatures. Additionally, long term applications require the fibers to have good creep resistance. For the development of high tempera-ture composites and the prediction of long term properties using micromechanics analyses, the creep properties of the fiber must be well-documented. For the evaluation of the creep and creep rupture strength of the fibers, the conventional test proce-dure is to apply a constant tensile load to the fiber at a constant temperature (References 1.6.2.2(a) and (b)). This is typically performed in a dead weight test set-up as described in Reference 1.6.2.2(c). A length of fiber is gripped vertically in cold grips to avoid the possibility of interaction between the grips, fi-ber, and environment if hot grips were employed. A resistance furnace is used to maintain a constant temperature over a specified gage length (typically 1 inch or 25 mm). Elongation and fracture strain are measured using any one of a variety of non-contacting displacement devices. The creep tests can be run in air or in a protective environment by using a suitable chamber surrounding the fiber and heating ele-ments. The creep rupture strength, time, and strain to failure will display a large amount of scatter. This is because fracture of the brittle fiber is probabilistic in nature and the flaw size and distribution can increase with time at load and temperature. For these reasons, many fibers have to be tested and statistically ana-lyzed to gain a good understanding of the rupture properties.
MIL-HDBK-17-4A Volume 4, Section 1 Guidelines
107
1.6.2.3 Bend stress relaxation This procedure provides a simple method to measure the creep and specifically the stress relaxation behavior of fibers. The bend stress relaxation (BSR) method consists of tying the fiber into a loop and then subjecting it in a furnace to a specific time at temperature. After exposure, the fiber loop is returned to room temperature and the diameter is measured. The applied strain is then removed by breaking the loop at one point and any effects due to the exposure are measured in terms of residual loop radius. De-tails of the test method and data on selected fibers are given in References 1.6.2.3(a) and (b). The BSR method has many advantages over the typical tensile creep tests (Section 1.6.2.2), which include the ability to simultaneously study many fibers of small diameter and short length under the same set of conditions (time, temperature, atmosphere). Also, the BSR test gives insight into the ability of the fibers to be creep-formed into woven structures or tight radii. 1.6.3 PHYSICAL PROPERTY TEST METHODS 1.6.3.1 Density The density of a fiber should be measured using one of three techniques found in ASTM D3800, “Standard Test Method for Density of High-Modulus Fibers” (Reference 1.6.3.1). 1.6.4 MICROSTRUCTURAL ANALYSIS TECHNIQUES This section is reserved for future use. 1.6.5 CHEMICAL ANALYSIS TECHNIQUES This section is reserved for future use. 1.6.6 ENVIRONMENTAL EFFECTS TEST METHODS This section is reserved for future use.

MIL-HDBK-17-4A Volume 4, Section 1 Guidelines
108
REFERENCES
1.6.2.1 ASTM D3379, “Standard Test Method for Tensile Strength and Young’s Modulus for High-Modulus Single-Filament Materials,” Annual Book of ASTM Standards, Vol 15.03, American Society for Testing and Materials, West Conshohocken, PA, 1998, pp. 113-116.
1.6.2.2(a) DiCarlo, J.A., “Property Goals and Test Methods for High Temperature Ceramic Fibre Rein-
forcement”, Proceedings of the 8th CIMTEC, Advanced Structural Fiber Composites, eds., P. Vincenzini and G.C. Righini, Techna Publishing, Florence, Italy, 1994.
1.6.2.2(b) Yun, H.M. and DiCarlo, J.A., “Time/Temperature Dependent Tensile Strength of SiC and
Al2O3-Based Fibers”, Ceramic Transactions, Vol 74, eds., N.P. Bansal and J.P. Singh, Ameri-can Ceramic Society, 1996 , pp. 17-26.
1.6.2.2(c) Yun, H.M. and Goldsby, J.C., “Tensile Creep Behaviour of Polycrystalline Alumina Fibres”
NASA TM 106269, 1993. 1.6.2.3(a) Morscher, G.N. and DiCarlo, J.A., “A Simple Test for Thermomechanical Evaluation of Ce-
ramic Fibers”, Journal of the American Ceramic Society, Vol 75, No. 1, 1992, pp. 136-140. 1.6.2.3(b) Youngblood, G.E., Hamilton, M.L., and Jones, R.H., “Technique for Measuring Irradiation
Creep in Polycrystalline SiC Fibers”, Fusion Materials Semiannual Progress Report for the Period ending June 30, 1996. DOE/ER-0313/20, p. 146.
1.6.3.1 ASTM D3800, “Standard Test Method for Density of High-Modulus Fibers”, Annual Book of
ASTM Standards, Vol. 15.03, American Society for Testing and Materials, West Consho-hocken, PA, 1997, pp. 172-176.

MIL-HDBK-17-4A Volume 4, Section 1 Guidelines
109
1.7 FIBER SIZING TESTING AND ANALYTICAL METHODS 1.7.1 INTRODUCTION This section is reserved for future use. 1.7.2 PHYSICAL PROPERTY TEST METHODS This section is reserved for future use. 1.7.3 CHEMICAL ANALYSIS TECHNIQUES This section is reserved for future use.

MIL-HDBK-17-4A Volume 4, Section 1 Guidelines
110
1.8 FIBER COATINGS, INTERFACES AND INTERPHASES TESTING AND ANALYTICAL METHODS 1.8.1 INTRODUCTION This section is reserved for future use. 1.8.2 MECHANICAL PROPERTY TEST METHODS This section is reserved for future use. 1.8.3 PHYSICAL PROPERTY TEST METHODS This section is reserved for future use. 1.8.4 MICROSTRUCTURAL ANALYSIS TECHNIQUES This section is reserved for future use. 1.8.5 CHEMICAL ANALYSIS TECHNIQUES This section is reserved for future use.

MIL-HDBK-17-4A Volume 4, Section 1 Guidelines
111
1.9 MATRIX TESTING AND ANALYTICAL METHODS 1.9.1 INTRODUCTION The matrix is the major constituent in the MMC. Its job is to bind the fibers in place and protect them from mechanical and environmental damage. The matrix also acts to transfer load to the fibers. In addi-tion, it imparts its own properties to the composite, which are characteristic to metals, such as ductility, electrical and thermal conductivity. As the major constituent, the properties of the matrix are influential in dictating the behavior of the composite. Therefore, the matrix should be thoroughly understood and characterized. The following sec-tions give testing techniques for the documentation of matrix properties. This knowledge can be used in both quality control, as well as micromechanics analyses. In general, the testing techniques for the matrix are similar to those used with conventional monolithic materials. However, there are a few additional notes added to account for the idiosyncrasies associated with the non-conventional manufacturing forms of these materials. 1.9.2 MECHANICAL TEST METHODS This section gives test methods for characterizing the mechanical properties of the neat matrix. These properties may be used for input into micromechanics models when analyzing the behavior of the composite. This is particularly useful when no composite data exist and some idea of how the composite will behave is necessary. The matrix materials analyzed under this section are manufactured in a method which is similar to the processing of the composite, including both consolidation and heat treatment. This ensures that the prop-erties of the neat matrix are truly representative of those in the composite. 1.9.2.1 Tension Tensile testing of metallic matrices should be conducted in accordance with ASTM Test Method E8 (Reference 1.9.2.1(a)) for room temperature tests and E 21 (Reference 1.9.2.1(b)) for tests at elevated temperatures. Note: Due to the non-conventional processing of these matrix materials, they may be anisotropic. Therefore, if a detailed characterization of these materials is desired, specimens should be taken from various directions with respect to the geometry of the supplied material. Additionally, transverse strain should be measured on selected tensile specimens. 1.9.2.2 Creep Creep testing of the matrix material should be conducted in accordance with ASTM Test Method E139 (Reference 1.9.2.2). 1.9.2.3 Stress relaxation Stress relaxation is similar to creep testing with the exception that at the maximum load, the strain is held constant and the stress is allowed to relax until a saturation point is finally reached, at which time the test can be terminated. With this exception, all other testing conditions should be conducted in accor-dance with ASTM Test Method E139 (Reference 1.9.2.3). In addition, the relaxation stress versus time data should be reported.

MIL-HDBK-17-4A Volume 4, Section 1 Guidelines
112
1.9.2.4 Fatigue Fatigue testing may be done on the neat matrix in order to predict the fatigue life of the composite us-ing some micromechanical approach. Dependent upon the ultimate goals of the testing and the model used, either load or strain controlled tests can be conducted. This should be done in accordance with ASTM Test Method E466 (Reference 1.9.2.4(a)) for load controlled and E606 (Reference 1.9.2.4(b)) for strain controlled tests. 1.9.3 PHYSICAL TEST METHOD 1.9.3.1 Density The density of the matrix should be measured using the Archimedes method found in ASTM D792, “Standard Test Method for Density and Specific Gravity (Relative Density) of Plastics by Displacement” (Reference 1.9.3.1). 1.9.4 MICROSTRUCTURAL ANALYSIS TECHNIQUES Metallography on the matrix material is performed using standard methods as have been applied to metallic monolithic materials. Some typical procedures can be found in References 1.9.4(a) through (c). Below is a common practice for metallographically preparing titanium alloys:
Monolithic titanium is relatively easy to prepare with semi-automatic polishing equipment and using 150 rpm and a pressure of 5 pounds per sample. Grinding is performed on successive SiC papers of 320, 400, 600, 800, and 1200 grit sizes.
Final preparation is best accomplished by the use of attack polishing during the final polishing step. This process removes material by chemical and mechanical action to produce scratch- and deforma-tion-free microstructures. Typically, a chemotextile polishing cloth is used with a 50 nm colloidal silica suspension as follows:
150 ml water 150 ml 50 nm colloidal silica 30 ml hydrogen peroxide 1 ml nitric acid 1 ml hydrofluoric acid 1.9.4.1 Microstructural analysis techniques titanium This section is reserved for future use. 1.9.4.2 Microstructural analysis techniques aluminum This section is reserved for future use. 1.9.5 CHEMICAL ANALYSIS TECHNIQUES This section is reserved for future use. 1.9.6 ENVIRONMENTAL EFFECTS TEST METHODS This section is reserved for future use.

MIL-HDBK-17-4A Volume 4, Section 1 Guidelines
113
REFERENCES 1.9.2.1(a) ASTM Test Method E8, “Tension Testing of Metallic Materials,” Annual Book of ASTM Stan-
dards, Vol 03.01, American Society for Testing and Materials, West Conshohocken, PA, 1997, pp. 56-76.
1.9.2.1(b) ASTM Test Methods E21, “Elevated Temperature Tension Tests of Metallic Materials,” An-
nual Book of ASTM Standards, Vol 03.01, American Society for Testing and Materials, West Conshohocken, PA, 1997, pp. 129-136.
1.9.2.2 ASTM Test Method E139, “Conducting Creep, Creep-rupture, and Stress-rupture Tests of
Metallic Materials,” Annual Book of ASTM Standards, Vol 03.01, American Society for Test-ing and Materials, West Conshohocken, PA, 1997, pp. 253-265.
1.9.2.4(a) ASTM Test Method E466, “Conducting Force Controlled Constant Amplitude Axial Fatigue
Tests of Metallic Materials,” Annual Book of ASTM Standards, Vol 03.01, American Society for Testing and Materials, West Conshohocken, PA, 1997, pp. 466-470.
1.9.2.4(b) ASTM Test Method E606, “Strain-Controlled Fatigue Testing,” Annual Book of ASTM Stan-
dards, Vol 03.01, American Society for Testing and Materials, West Conshohocken, PA, 1997, pp. 523-537.
1.9.3.1 ASTM D792, “Standard Test Method for Density and Specific Gravity (Relative Density) of
Plastics by Displacement”, Annual Book of ASTM Standards, Vol. 8.01, American Society for Testing and Materials, West Conshohocken, PA, 1997, pp. 152-155.
1.9.4(a) Metallography and Microstructures - Volume 9, Metals Handbook, 9th edition, ASM, Materi-
als Park, OH, 1985. 1.9.4(b) Samuels, L.E., Metallographic Polishing by Mechanical Methods, ASM, Materials Park, OH,
1982. 1.9.4(c) Bousfield, B., Surface Preparation and Microscopy of Materials, John Wiley and Sons, NY,
1992.

MIL-HDBK-17-4A Volume 4, Section 1 Guidelines
114
1.10 STRUCTURE SENSITIVE PROPERTIES CHARACTERIZATION 1.10.1 INTRODUCTION This section is reserved for future use. 1.10.2 MECHANICALLY-FASTENED JOINTS This section is reserved for future use. 1.10.3 BONDED, BRAZED, AND WELDED JOINTS This section is reserved for future use. 1.10.4 CURVED SHAPES This section is reserved for future use. 1.10.5 STRUCTURAL DESIGN DETAILS This section is reserved for future use. 1.10.6 TRANSITION AND OTHER SPECIAL REGIONS This section is reserved for future use. 1.10.7 SIZE EFFECTS This section is reserved for future use. 1.10.8 OTHER TOPICS This section is reserved for future use.

MIL-HDBK-17-4A Volume 4, Section 1 Guidelines
115
1.11 ANALYSIS OF DATA 1.11.1 GENERAL This section is reserved for future use. 1.11.2 PROCEDURES OF CALCULATION OF STATISTICALLY-BASED MATERIAL PROPERTIES This section is reserved for future use. 1.11.3 SAMPLES OF COMPUTATIONAL PROCEDURES This section is reserved for future use. 1.11.4 STATISTICAL TABLES This section is reserved for future use.

MIL-HDBK-17-4A Volume 4, Section 2 Design Guidelines for Metal Matrix Materials
116
2. DESIGN GUIDELINES FOR METAL MATRIX MATERIALS 2.1 GENERAL INFORMATION 2.1.1 INTRODUCTION This section is reserved for future use. 2.1.2 PURPOSE, SCOPE, AND ORGANIZATION OF SECTION 2 This section is reserved for future use. 2.2 USE OF DATA This section is reserved for future use. 2.3 STRUCTURAL DESIGN AND ANALYSIS 2.3.1 Introduction The concept of designing a material to provide a desired set of properties has received impetus from the growing acceptance of composite materials. Inclusion of material design in the structural design proc-ess has had a significant effect on that process, particularly upon the preliminary design phase. In this pre-liminary design, a number of materials will be considered, including materials for which experimental ma-terials property data are not available. Thus, preliminary material selection may have to be based on ana-lytically predicted properties. The analytical methods are the result of studies of micromechanics, that is, the study of the relationship between effective properties of composites and the properties of the constitu-ents of the composite. The inhomogeneous composite is represented by a homogeneous material, which is often anisotropic, with the effective properties of the composite. The purpose of this chapter is to provide an overview of techniques for analysis in the design of com-posite materials. Starting with the micromechanics of the reinforcement (fibers or particles) and matrix phases in a lamina, analyses including simple geometric constructions to obtain laminates are considered. The subject of Section 2.3 is primarily unidirectional fiber composites and symmetric laminates, but discontinuous reinforcement composites are also discussed. It begins with a description of the microme-chanics of basic lamina properties and leads into classical laminate analysis theory in an arbitrary coordi-nate system. It discusses methods that account for the various damage and failure mechanisms in design and analysis. It highlights considerations of translating individual lamina results into predicted laminate behavior. Furthermore, it covers multiaxial loading situations and structural responses such as damage initiation and evolution, creep, relaxation, fatigue, buckling, durability, and vibration. The response of lami-nate structures to more complex loads is also discussed. The strength of any given laminate under a prescribed set of loads is probably best determined by conducting a test. However, when many candidate laminates and different loading conditions are being considered, as in a preliminary design study, analysis methods for estimation of laminate strength become desirable. Because the stress distribution throughout the constituents in each ply of a laminate is quite complex, exact analysis methods are not available. However, reasonable methods do exist which can be used to guide the preliminary design process.

MIL-HDBK-17-4A Volume 4, Section 2 Design Guidelines for Metal Matrix Materials
117
2.3.1.1 Analysis methodology classifications Analysis methods may be grouped into different classes, depending upon the degree of detail of the stresses utilized. The following classes are of practical interest: Laminate level. Average values of the stress components in a laminate coordinate system are utilized. Ply, or lamina, level. Average values of the stress components within each ply are utilized. Constituent level. Average values of the stress components within each phase (reinforcement or ma-trix) of each ply are utilized. Micro-level. Local stresses at each point within each phase are utilized. Micro-level stresses, used in appropriate failure criteria for each constituent, determine the external loads at which local failure initiates. For metal matrix composites, an accurate representation of the micro-level stresses is needed to realistically predict strength. However, the uncertainties due to departures from the assumed regular local geometry and the statistical variability of local strength sometimes make such a process impractical. At the other extreme, laminate level stresses can be useful for translating measured strengths under single stress component tests into anticipated strength estimates for combined stress cases. However, this procedure does not help in the evaluation of alternate laminates for which test data do not exist. Ply level stresses, as predicted from a micro-level analysis, provide a commonly used approach to laminate strength. The average stresses in a given ply are used to calculate first ply failure and then sub-sequent ply failure leading to laminate failure. The analysis of laminates by the use of a ply-by-ply model is presented in Section 2.3.3. Constituent level, or phase average stresses, can also be predicted by a micro-level analysis. In some instances, they represent a useful approach to the strength of a unidirectional composite or ply. The most common approach for accurately analyzing metal matrix composites is known as the local-global method. In this method, loads are applied incrementally and resolved to the micro-level. A micro-mechanics analysis is then performed to determine if and where damage or plasticity occurs. The global material response is then determined by homogenization of the micro-level stress and strain fields and the next increment of load applied. Micromechanics is the study of the relations between the properties of the constituents of a composite and the effective properties of the composite. Starting with the basic constitu-ent properties, Section 2.3.2 develops the micromechanical analysis of a fiber-reinforced lamina. The associated ply-by-ply analysis of a laminate is developed in Section 2.3.3. 2.3.1.2 Basic concepts The methodology employed in a specific application is dictated by several basic concepts, defined below, which characterize the response of the composite. Material homogeneity. Composites, by definition, are heterogeneous materials. Mechanical analysis proceeds on the assumption that the material is homogeneous. This apparent conflict is resolved by con-sidering homogeneity on microscopic and macroscopic scales. Microscopically, composite materials are certainly heterogeneous. However, on the macroscopic scale, they appear homogeneous and respond homogeneously when tested. The analysis of composite materials uses effective properties and homoge-nized stress and strain fields, which are based on the local stress and strain fields. Material anisotropy. Anisotropy is the condition where material properties exhibit a directional de-pendency. An anisotropic material has different properties in each different direction and is characterized

MIL-HDBK-17-4A Volume 4, Section 2 Design Guidelines for Metal Matrix Materials
118
by 21 independent constants. Fortunately, most materials exhibit one or more planes of symmetry. The most common special cases follow.
A monoclinic material (for example, a lamina having off-axis fibers) has one plane of material symmetry and is characterized by 13 constants. An orthotropic material (for example, a lamina having a periodic rectangular array of fibers) has three mutually perpendicular planes of material symmetry and is characterized by nine inde-pendent constants. A transversely isotropic material is a special case of an orthotropic material that has one plane where the properties are independent of direction. For example, a lamina having a large number of very small diameter fibers that are aligned but more or less randomly distributed. A trans-versely isotropic material is characterized by five independent constants. An isotropic material has the same properties in all directions and is characterized by two inde-pendent constants. For example, a matrix reinforced by a random dispersion of spherical parti-cles is usually considered to be isotropic.
Material constituent response. The relationship between stresses and strains describes the response of materials. The overwhelming majority of all mechanics of materials analyses assume a linear elastic material response; that is, one where the state of strain depends only on the current stress (for a given temperature), and the dependence is linear. In general, the state of strain in a metallic material also de-pends on the previous load history and time. The response of the metal matrix can usually be classified as: elastic, elastic-plastic, or elastic-viscoplastic depending on the loading history and environment. The term elastic-plastic refers to a material that has an initial (linear) elastic region followed by plastic deforma-tion that is independent of time and exhibits permanent set after removal of the loads. The elastic-viscoplastic classification is more general in that the plastic deformation is time-dependent. Plastic de-formation in metals is associated with the motion of dislocations through the microstructure. It should be kept in mind that all plastic deformation takes time to develop, but in some instances the applied loading is slow enough such that the plastic deformation has time to fully develop and the response can be consid-ered to be rate-independent. This is often the case for metals at room temperature. Residual stresses. One consequence of the microscopic heterogeneity of a composite material is the thermal expansion mismatch between the reinforcement and the matrix. In composites processed at high temperature, this mismatch causes residual strains, and therefore stresses, in the material after fabrica-tion. The magnitude of the residual stresses depends largely on the coefficient of thermal expansion mis-match between the constituents. However, in some material systems the residual stresses are sufficient to cause permanent deformation during cool-down. Internal Damage. A number of internal damage mechanisms are possible in metal matrix composites; cracking can occur in the matrix, the reinforcement, or at the reinforcement-matrix interface. Additionally, voids can grow in the matrix, and environmental damage such as oxidation near the reinforcement-matrix interface is possible. Depending on the application, one or more of these may need to be considered in design. Physical properties. A unidirectional fiber composite (UDC) consists of aligned continuous fibers, which are embedded in a matrix. The UDC physical properties are functions of the in-situ fiber and matrix physical properties, of their volume fractions, and also of the fiber distribution. The fibers have, in general, circular cross-sections with little variability in diameter. A UDC is clearly anisotropic since properties in the fiber direction are very different from properties transverse to the fibers. Discontinuously reinforced com-posites (DRCs) may be fairly uniform dispersions of particles or aligned chopped fibers in a matrix. As such, a DRC may be isotropic or anisotropic. In either event, the DRC physical properties are functions of the in-situ reinforcement and matrix physical properties, of their volume fractions, and perhaps of the sta-tistical variation in the reinforcement distribution.

MIL-HDBK-17-4A Volume 4, Section 2 Design Guidelines for Metal Matrix Materials
119
Properties of interest for evaluating stresses and strains are: elastic engineering properties, coeffi-cients of thermal expansion, yield strength and hardening parameters, reinforcement-matrix bond strength, material damping, and thermal conductivity. 2.3.2 GENERAL DESIGN GUIDELINES Designing with composite materials can provide a significant advantage over monolithic materials in that the properties of the material can be tailored to reach certain design goals. Although a large number of possibilities may exist to reach design solutions, practicality in terms of material design, cost and manu-facturability of the structural part dictates the selection of the appropriate material system. In the prelimi-nary design phase, available materials and their properties are considered to check if the design require-ments for the structural part can be met. In preliminary design, materials selection becomes an exercise in itself. Any existing material data-base is considered and at the same time, without any restraint on material cost or availability, another par-allel activity that can be initiated is to check if a desirable material system can be designed to meet the design objectives. This exercise helps the designer to seek innovative solutions that are not readily avail-able with monolithics, e.g., a designer may conceive of a hybrid material system, which involves a combi-nation of monolithic and composite materials to meet a design goal in terms of stiffness, strength or frac-ture characteristics. In designing with MMCs, the micromechanics estimation approaches in this section can be utilized to assess the overall composite properties based on the matrix material, reinforcement type and fiber vol-ume fraction. Micromechanics approaches are useful where current data on composite systems are lim-ited. These approaches are also useful for extrapolating uniaxial, isothermal test data to service condi-tions where the mechanical and thermal loads are more complex. Obtaining accurate and reliable material property values is one of the most important steps toward achieving a functional design. However, predicted properties using the calculation procedures shown in this section will allow selecting the appropriate material systems and to point out the weakness of avail-able materials. The following material design considerations can be helpful in preliminary design:
1. Use MMCs where the load is highly directional and ensure that fiber alignment is in the principal stress direction.
2. Ensure compressive stability, which is influenced strongly by shear effects. 3. Recognize that in-plane and out-of-plane failures are often common at notches and free edges. 4. Anticipate progression of damage from existing manufacturing flaws. 5. Assess environmental effects, which can degrade and reduce properties of MMC e.g., in oxidizing
environment. 6. For components experiencing temperature excursions, consider the CTE mismatch between the
matrix and the reinforcement and the resulting thermal strains.
Important strength and stiffness parameters that need to be considered are :
1. Longitudinal tension 2. Longitudinal compression 3. Transverse tension 4. Transverse compression 5. Shear
Continuous fiber MMCs exhibit high compression strength and adequate shear strength, which pro-vide a good window for design. One weakness of currently available MMCs is that their transverse strain to failure is typically low (fibers may debond relatively easily within a strain range of 0.2-0.4%), making any plies oriented at an angle to the loading essentially a burden for the laminate. This is particularly severe

MIL-HDBK-17-4A Volume 4, Section 2 Design Guidelines for Metal Matrix Materials
120
where the load is applied perpendicular to the loading direction, i.e., 90 degree plies. However, 90 degree or off-axis plies are essential in laminates or structures where multiaxial or bi-directional loads are applied. In MMCs, delamination is not a major failure mode as in polymeric composite systems and, therefore, interlaminar stresses are not considered to be critical except in the cases of initiation of damage at edges, holes or cutouts. Delamination growth is not a consideration in MMCs and properties and models in this area are scant as designing with MMCs does not require “delamination” growth considerations. On the other hand, fracture properties are considered important and fatigue crack-growth issues can be consid-ered in design solutions. These involve crack growth considerations in the plane of the laminate and in the through-thickness direction. One benefit of continuous reinforced MMCs is that the fibers can act to bridge cracks or deflect cracks, thus retarding or stopping crack growth. The anisotropic properties in composite structures are the key to developing highly efficient structures. The designer must be experienced with basic mechanics formulations, computerized modeling tech-niques, such as FEA or specialized programs such as “classical lamination theory”, plate analysis, buck-ling analysis and post-buckling response modeling for various geometric structures to predict the perform-ance of anisotropic composite structures. In addition, the designer needs a thorough knowledge of the manufacturing techniques and their limitations so that optimized and cost effective material solutions can be implemented in designing with MMCs. 2.3.3 ANALYSIS APPROACHES (CONTINUOUS FIBER MMC) Continuous fiber composites fail most often due to events that occur at the micro-level. Micromechan-ics provides the link between the ply-level response and the micro-level response. 2.3.3.1 Micromechanics The backbone of a micromechanics analysis is the appropriate choice of a representative volume element (RVE), that is, a subdomain of the composite that is entirely representative of the composite as a whole. From a practical standpoint, the simpler the RVE, the more tractable the analysis will be. An RVE is necessary because it is not feasible to model each individual fiber in the composite. The micromechan-ics analysis homogenizes the local stress and strain fields in the constituents to obtain overall fields that represent the response of a lamina. In so doing, the average response of each constituent can also be determined. Since the stress and strain tensors that describe the local and overall fields are symmetric, they will be contracted to 6×1 column vectors in the following section. Additionally, the elastic stiffness tensor is also symmetric and will be contracted to a 6×6 matrix. MMCs can exhibit nonlinear response due to matrix inelasticity as well as various forms of internal damage. In many applications it is very im-portant to model these nonlinear phenomenon as well as the thermal residual stresses associated with the fabrication of many MMCs . Section 2.3.3.1.1 provides a general framework for doing this. 2.3.3.1.1 General relationships Start with strain and stress vectors that have the form
11 11
22 22
33 33
12 12 12
23 23 23
31 31 31
,2
2
2
ε σε σε σ
ε γ σε γ σε γ σ
= = = =
=
ε σ . 2.3.3.1.1(a)
The essence of micromechanics is the determination of the elastic strain and stress concentration matri-ces (contracted tensors), A and B respectively, for a given RVE. These are defined by, abd

MIL-HDBK-17-4A Volume 4, Section 2 Design Guidelines for Metal Matrix Materials
121
( ) ( )
( ) ( )
el el
,
=
=
ε x A x ε
σ x B x σ 2.3.3.1.1(b)
where the spatial dependence of local quantities is shown explicitly and an overbar denotes a homoge-nized or ply-level quantity. Fortunately, the strain and stress concentration tensors are related through
( ) ( ) ( )( ) ( ) ( ) .
=
=
B x C x A x S*
A x S x B x C* 2.3.3.1.1(c)
where C(x) and S(x) are the pointwise stiffness and compliance matrices and C* and S* are the overall composite stiffness and compliance matrices, respectively. The total overall strain can be decomposed into its elastic, thermal, plastic, and internal damage associated parts;
el th pl daε ε ε ε ε= + + + 2.3.3.1.1(d) where
( ) ( )
( ) ( )
( ) ( )
( ) ( )( ) ( )( ) ( )
( ) ( ) ( ) ( )( ) ( ) ( ) ( )( ) ( ) ( ) ( )
el T el
th T th
pl T pl
1 1
2 2
3 3daS
1 2 2 1
2 3 3 2
3 1 1 3
1ε ε dVV1 ε dVV1 ε dVV
u n
u n
u nε 2 dS.
u n u n
u n u n
u n u n
= ∫
= ∫
= ∫
= − ∫ + +
+
B x x
ε B x x
ε B x x
x x
x x
x x
x x x x
x x x x
x x x x
The surface integral S is evaluated over the length of all cracks. The overall stress-strain law is
el=σ C* ε 2.3.3.1.1(e) where the overall composite stiffness can be written as
( ) ( )TV
1* dV
V= ∫C A x C x . 2.3.3.1.1(f)
Finally, volume average equations apply,
( )
( )
el th plV
V
1dV
V1
x dV.V
σ σ
+ + = ∫
= ∫
ε ε ε ε x 2.3.3.1.1(g)
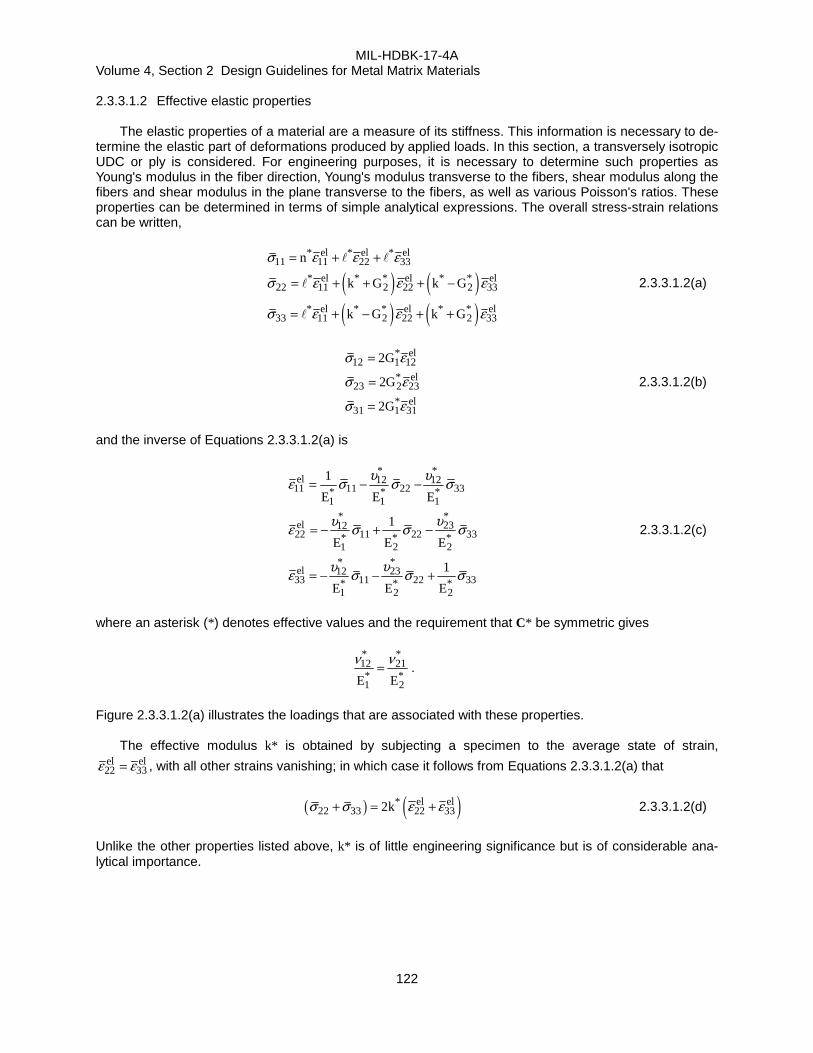
MIL-HDBK-17-4A Volume 4, Section 2 Design Guidelines for Metal Matrix Materials
122
2.3.3.1.2 Effective elastic properties The elastic properties of a material are a measure of its stiffness. This information is necessary to de-termine the elastic part of deformations produced by applied loads. In this section, a transversely isotropic UDC or ply is considered. For engineering purposes, it is necessary to determine such properties as Young's modulus in the fiber direction, Young's modulus transverse to the fibers, shear modulus along the fibers and shear modulus in the plane transverse to the fibers, as well as various Poisson's ratios. These properties can be determined in terms of simple analytical expressions. The overall stress-strain relations can be written,
( ) ( )( ) ( )
* el * el * el11 11 22 33
* el * * el * * el22 11 2 22 2 33
* el * * el * * el33 11 2 22 2 33
n
k G k G
k G k G
σ ε ε ε
σ ε ε ε
σ ε ε ε
= + +
= + + + −
= + − + +
2.3.3.1.2(a)
* el12 1 12
* el23 2 23
* el31 1 31
2G
2G
2G
σ ε
σ ε
σ ε
=
=
=
2.3.3.1.2(b)
and the inverse of Equations 2.3.3.1.2(a) is
* *el 12 12
11 11 22 33* * *1 1 1
**el 231222 11 22 33* * *
1 2 2
**el 231233 11 22 33* * *
1 2 2
1
E E E
1
E E E
1
E E E
υ υε σ σ σ
υυε σ σ σ
υυε σ σ σ
= − −
= − + −
= − − +
2.3.3.1.2(c)
where an asterisk (*) denotes effective values and the requirement that C* be symmetric gives
* *12 21* *1 2E E
ν ν= .
Figure 2.3.3.1.2(a) illustrates the loadings that are associated with these properties. The effective modulus k* is obtained by subjecting a specimen to the average state of strain,
el el22 33ε ε= , with all other strains vanishing; in which case it follows from Equations 2.3.3.1.2(a) that
( ) ( )* el el22 33 22 332kσ σ ε ε+ = + 2.3.3.1.2(d)
Unlike the other properties listed above, k* is of little engineering significance but is of considerable ana-lytical importance.
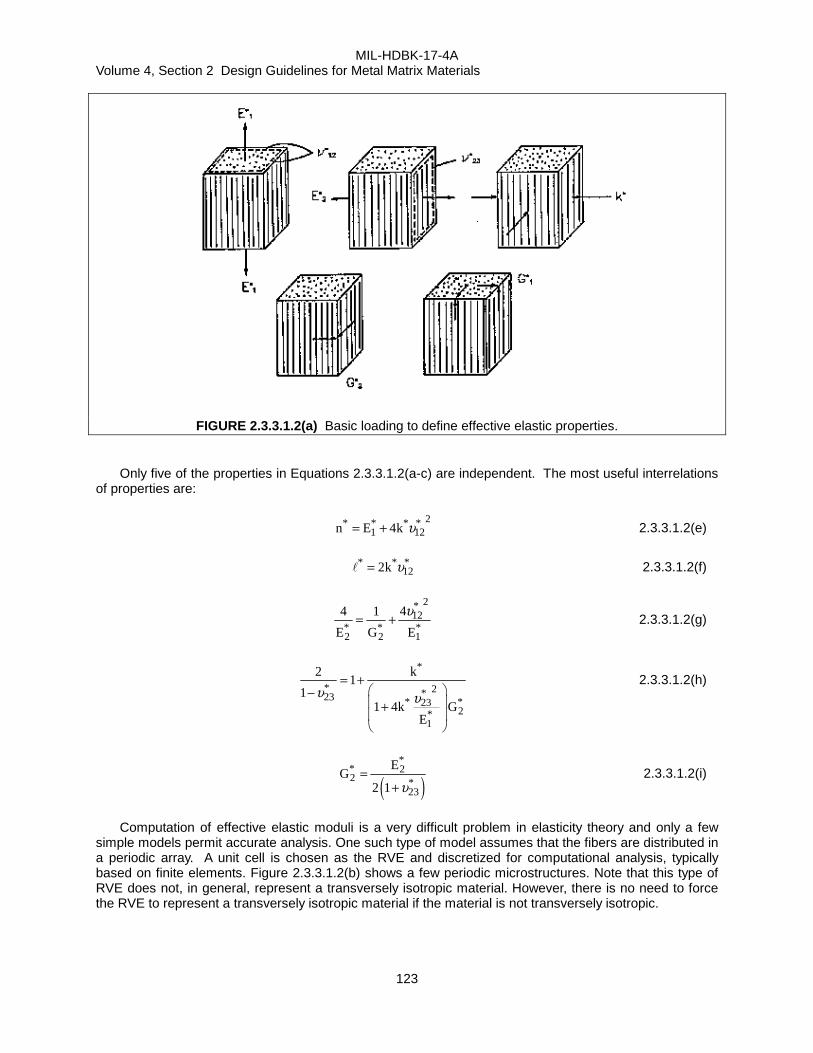
MIL-HDBK-17-4A Volume 4, Section 2 Design Guidelines for Metal Matrix Materials
123
FIGURE 2.3.3.1.2(a) Basic loading to define effective elastic properties.
Only five of the properties in Equations 2.3.3.1.2(a-c) are independent. The most useful interrelations of properties are:
2* * * *
1 12n E 4k υ= + 2.3.3.1.2(e)
* * *122k υ= 2.3.3.1.2(f)
2*
12* * *2 2 1
44 1
E G E
υ= + 2.3.3.1.2(g)
*
* 2*23 * *232*
1
2 k1
11 4k G
E
υ υ= +
− +
2.3.3.1.2(h)
( )*
* 22 *
23
EG
2 1 υ=
+ 2.3.3.1.2(i)
Computation of effective elastic moduli is a very difficult problem in elasticity theory and only a few simple models permit accurate analysis. One such type of model assumes that the fibers are distributed in a periodic array. A unit cell is chosen as the RVE and discretized for computational analysis, typically based on finite elements. Figure 2.3.3.1.2(b) shows a few periodic microstructures. Note that this type of RVE does not, in general, represent a transversely isotropic material. However, there is no need to force the RVE to represent a transversely isotropic material if the material is not transversely isotropic.

MIL-HDBK-17-4A Volume 4, Section 2 Design Guidelines for Metal Matrix Materials
124
Rectangular Array Hexagonal Array Square Diagonal Array
FIGURE 2.3.3.1.2(b) Repeating unit cell representative volume elements.
The composite cylinder assemblage (CCA) permits exact analytical determination of four effective elastic moduli based on the RVE shown in Figure 2.3.3.1.2(c) (Reference 2.3.3.1.2(a)). Consider a collec-tion of composite cylinders, each with a circular fiber core and a concentric matrix cylinder. The size of the cylinders may vary but the ratio of core radius to shell radius is held constant. Therefore, the matrix and fiber volume fractions are the same in each composite cylinder. One strength of this model is the ran-domness of the fiber placement, while an undesirable feature is the large variation of fiber sizes. It can be shown that the latter is not a serious concern.
FIGURE 2.3.3.1.2(c) Composite Cylinder Assemblage model representative volume element
(Reference 2.3.3.1.2(e)). The analysis of the CCA RVE gives closed form results for the effective elastic properties, k*, E1*, υ12*, and G1* and bounds for E2*, υ23*, and G2*. Such results will now be listed for isotropic fibers. The necessary modifications for transversely isotropic fibers can be found in References 2.3.3.1.2(b) and 2.3.3.1.2(c).

MIL-HDBK-17-4A Volume 4, Section 2 Design Guidelines for Metal Matrix Materials
125
( ) ( )( ) ( )
( ) ( )
m f m m f m m f*
f m m m m f
fm
m
f m m m
k k G k k Gk
k G k G
k1
k k k G
ν νν νν
ν
+ + +=
+ + +
= ++
− +
2.3.3.1.2(j)
( )2f m f m*
1 m m f fm f
f m m
m m f f
4E E E
1k k G
E E
ν ν ν νν ν ν ν
ν ν
−= + +
+ +
≈ +
2.3.3.1.2(k)
Since the third term on the right hand side of the first of Equations 2.3.3.1.2(k) is small, the rule of mix-tures gives an excellent approximation for the axial Young’s modulus of all UDC.
( )f m m f
m f*12 m m f f
m f
f m m
1 1k k
1k k G
υ υ ν νυ υ ν υ ν ν ν
− −
= + ++ +
2.3.3.1.2(l)
( )( )
( )
m m f f*1 m
m f f m
fm
m
f m m
G G 1G G
G 1 G
G1
G G 2G
ν νν ν
νν
+ +=
+ +
= ++
−
2.3.3.1.2(m)
As indicated earlier, the CCA analysis for G2* does not result in an exact solution, but only upper and lower bounds, which are in general quite close. A preferred alternative is to use the Generalized Self Con-sistent Scheme (GSCS). According to this method, the transverse shear modulus is obtained by embed-ding a composite cylinder into an infinite media having the overall properties of the composite. The volume fractions of fiber and matrix in the composite cylinder are those of the composite. Such an analysis has been given in Reference 2.3.3.1.2(d) and results in a quadratic equation for G2*. Thus,
2* *2 2
m m
G GA 2B C 0
G G
+ + =
2.3.3.1.2(n)
where
m
2 f ff ff
m m
3f f f fm m f m f f f m m
m m m m
G GA 3 1
G G
G G G G1 1
G G G G
ν ν η
η η η η η ν ν η η
= − +
+ + − − − − +
2.3.3.1.2(o)

MIL-HDBK-17-4A Volume 4, Section 2 Design Guidelines for Metal Matrix Materials
126
( )
( )
2 f ff m f
m m
3f f f fm f m f m f f
m m m m
3f f f fm f m f f
m m m
GB 3 1
G
G G G11 1 1 2
2 G G G
G G G1 1
2 G G G
νν ν ην
ηη ν η η η η νη
ν η η η η ν
= − − +
+ + − + − + − −
+ + − + + −
2.3.3.1.2(p)
2 f ff m f
m m
3f f f fm f f m f f
m m m m
G GC 3 1
G G
G G G G1 1
G G G G
ν ν η
η ν η η η ν
= − +
+ + − + + + −
2.3.3.1.2(q)
f f
m m
3 4
3 4
η υη υ
= −= −
2.3.3.1.2(r)
To compute the associated E2* and υ23*, use Equations 2.3.3.1.2(g-h). It is of interest to note that when the GSCS model is applied to those properties for which CCA results are available (see above Equations 2.3.3.1.2(j- m)), the CCA results are obtained. For transversely isotropic fibers, the following modifications are necessary (References 2.3.3.1.2(c) and 2.3.3.1.2(d)): For k* kf is the fiber transverse bulk modulus
For E1*, υ12* Ef = E1f
υf = υ12f kf is the fiber transverse bulk modulus For G1* Gf = G1f
For G2* Gf = G1f
ηf = 1 + 2G2f/kf . Numerical analysis of the effective elastic properties of the hexagonal array model reveals that the values are extremely close to those predicted by the CCA/GSCS models as given by the above equations. The results are generally in good to excellent agreement with experimental data. The simple analytical results given here predict effective elastic properties with sufficient engineering accuracy. They are of considerable practical importance for two reasons. First, they permit easy determi-nation of effective properties for a variety of matrix properties, fiber properties, volume fractions, and envi-ronmental conditions. Secondly, they provide an approach for evaluating the properties of fibers. 2.3.3.1.3 Residual stresses This section is reserved for future use. 2.3.3.1.4 Fiber-matrix bond strength This section is reserved for future use.

MIL-HDBK-17-4A Volume 4, Section 2 Design Guidelines for Metal Matrix Materials
127
2.3.3.1.5 Overall inelastic strain This section is reserved for future use. 2.3.3.2 Viscoplastic constitutive relations This section is reserved for future use. 2.3.3.2.1 Axial tensile response This section is reserved for future use. 2.3.3.2.2 Axial compressive response This section is reserved for future use. 2.3.3.2.3 Transverse tensile response This section is reserved for future use. 2.3.3.2.4 Transverse compressive response This section is reserved for future use. 2.3.3.3 Macromechanics This section is reserved for future use. 2.3.3.3.1 Effective elastic properties This section is reserved for future use. 2.3.3.3.2 Effective strength This section is reserved for future use. 2.3.3.3.3 Creep This section is reserved for future use. 2.3.3.3.4 Multiaxial effects This section is reserved for future use. 2.3.3.4 Damage tolerance This section is reserved for future use. 2.3.3.5 Durability This section is reserved for future use. 2.3.3.6 Life prediction This section is reserved for future use.

MIL-HDBK-17-4A Volume 4, Section 2 Design Guidelines for Metal Matrix Materials
128
2.3.4 DESIGN GUIDELINES (DISCONTINUOUS FIBER REINFORCED MMC) 2.3.4.1 Micromechanics This section is reserved for future use. 2.3.4.1.1 General relationships This section is reserved for future use. 2.3.4.1.2 Effective elastic properties This section is reserved for future use. 2.3.4.1.3 Fiber-matrix bond strength This section is reserved for future use. 2.3.4.1.4 Inelastic mechanisms and damage This section is reserved for future use. 2.3.4.2 Viscoplastic constitutive relations This section is reserved for future use. 2.3.4.2.1 Tensile response This section is reserved for future use. 2.3.4.2.2 Compressive response This section is reserved for future use. 2.3.4.2.3 Shear response This section is reserved for future use. 2.3.4.3 Crack growth behavior This section is reserved for future use. 2.3.4.4 Durability This section is reserved for future use. 2.3.4.5 Life prediction This section is reserved for future use.

MIL-HDBK-17-4A Volume 4, Section 2 Design Guidelines for Metal Matrix Materials
129
2.4 APPLICATIONS AND CASE STUDIES 2.4.1 COMPONENTS FOR STRUCTURAL APPLICATIONS This section is reserved for future use. 2.4.2 COMPONENTS FOR TRIBOLOGICAL APPLICATIONS This section is reserved for future use. 2.4.3 COMPONENTS FOR THERMAL MANAGEMENT APPLICATIONS This section is reserved for future use. 2.4.4 COMPONENTS FOR THERMAL EXPANSION CONTROL This section is reserved for future use. 2.4.5 OTHER MISCELLANEOUS APPLICATIONS This section is reserved for future use.

MIL-HDBK-17-4A Volume 4, Section 2 Design Guidelines for Metal Matrix Materials
130
REFERENCES
2.3.3.1.2(a) Hashin, Z. and Rosen, B.W., “The Elastic Moduli of Fiber-Reinforced Materials,” J. Appl. Mech., Vol 31, 1964, p. 223.
2.3.3.1.2(b) Hashin, Z., “Theory of Fiber Reinforced Materials,” NASA CR-1974, 1972.
2.3.3.1.2(c) Hashin, Z., “Analysis of Properties of Fiber Composites with Anisotropic Constituents,” J. Appl. Mech., Vol 46, 1979, p. 543.
2.3.3.1.2(d) Christensen, R.M., Mechanics of Composite Materials, Wiley-Interscience, 1979.
2.3.3.1.2(e) Hashin, Z., “Analysis of Composite Materials – A Survey,” J. Appl. Mech., Vol. 50, 1983, p. 481.

MIL-HDBK-17-4A Volume 4, Section 3 Materials Properties Data
131
3. MATERIALS PROPERTIES DATA 3.1 GENERAL INFORMATION 3.1.1 INTRODUCTION This section is reserved for future use. 3.1.2 PURPOSE, SCOPE, AND ORGANIZATION OF SECTION This section is reserved for future use. 3.1.3 PRESENTATION OF DATA This section describes how the data are presented and organized in this volume (MIL-HDBK-17-4). 3.1.3.1 Properties and definitions The properties and their definitions are found in the appropriate chapters of Volume 4. Reinforcement properties and methods for obtaining them are discussed in Section 1.6. Matrix properties are presented in Section 1.9. Methods for characterizing metal matrix composite materials are discussed in Section 1.4. Properties and definitions for laminae and laminates are presented in Section 1.3. The statistical methods used in determining these properties are discussed in Section 1.11. Material system codes and laminate orientation codes are defined in Section 1.1.6.2 3.1.3.1.1 Sign convention All compressive values, represented by a superscript c, are reported as positive numbers. Thus, a positive compression strength indicates failure due to a load applied in the opposite direction of a positive tensile failure. 3.1.3.2 Table formats The Table formats for mechanical property data presentation are given in Tables 3.1.3.2 (a) and 3.1.3.2(c). Table 3.1.3.2(a) shows the summary pages giving information about the material system and the properties for which data are available. The following notes apply to this Table:
Handbook section title and number. Sections are titles using the following information:
Fiber Filament-Count/Matrix Process Sequence Description
The process sequence description includes foil/fiber/foil and any other consolidation process se-quence. If a warning regarding data documentation is included for the data set, an asterisk follows the section title.
The first set of information in a data section is a summary Table containing information on the ma-terials, processing, etc. The box with a heavy border in the upper right-hand corner identifies the first summary Table.

MIL-HDBK-17-4A Volume 4, Section 3 Materials Properties Data
132
Fiber Class/Matrix Class Process Sequence Description
Fiber/Matrix
Summary
This box contains the fiber/matrix class of the material, such as silicon carbide/titanium, identified as SiC/Ti using the material system codes in Section 1.1.6.2 The material identification is summa-rized by the fiber and matrix names.
Material information is presented for the composite, the fiber, and the matrix. Composite material identification is presented as:
Fiber Filament-Count/Matrix Process Sequence Description
Fiber identification includes Manufacturer Commercial Name Continuous/Discontinuous Di-
ameter. Matrix identification is presented as Commercial Name. The consolidation process manufacturer is listed here as well.
Basic processing information is presented. This includes the type of processing sequence, tem-perature, pressure, duration, and any other critical parameters for one or more processing steps. The data source is identified here as well.
Any warning for limited data documentation is presented on each page of data presentation. On the first page of a data section, a warning is shown below the material identification block.
The block below the material identification block presents various dates relevant to the fabrication and testing of the material. The date of data submittal determines the data documentation re-quirements that were used for the data set and the date of analysis determines the statistical analysis that was used. Ranges of dates are presented where appropriate, such as a testing pro-gram which lasted several months.
Lamina properties are summarized with the class of data provided for each property. The col-umns of the lamina property summary Table define the environmental conditions and fiber vol-umes. The first column contains room temperature data in an air environment. The remaining columns are ordered from lowest to highest temperature. For each temperature, the columns are ordered from lowest to highest fiber volume. If there is enough space, a blank column separates the room temperature column from the other columns.
The rows of the lamina summary Table identify the type test and direction. For each test type and direction, the class of data for the strength, modulus, Poisson's ratio, strain-to-failure, proportional limit, 0.02-offset-strength, and 0.2-offset-strength are provided, in that order. For example, if the entry under RT-air-35 and Tension, 1-axis is FF-S---. There is room temperature data tested in an air environment for longitudinal tension strength, modulus, and strain-to-failure, but not Pois-son's ratio, proportional limit, 0.02-offset-strength, or 0.2-offset-strength. The strength and modulus data are fully approved, and the strain-to-failure data are screening. The classes of data approval are defined in Section 1.3.1.2. Fully approved data requires a minimum number of tests as defined in Sections 1.3.4.2 and 1.3.5.2. Screening data represents a smaller number of tests.
Continuing on the second page of summary information (Table 3.1.3.2(a)):
Any warning is placed at the top of this page.

MIL-HDBK-17-4A Volume 4, Section 3 Materials Properties Data
133
The box at the top of the second page of summary information presents basic physical parame-ters for the data set. The first data column contains nominal values, typically specification infor-mation.
The second data column presents the range of values for the data set submitted.
The last column presents the test method used to obtain these data.
Laminate property data are summarized in the lower box in the same way as lamina property data are summarized on the previous page. Families of laminates are provided with properties listed below each laminate family. Specific lay-up information is provided in the detailed Tables which follow. The type of test and direction are included only if data are available and are based on Ta-ble 3.1.3.2(b).

MIL-HDBK-17-4A Volume 4, Section 3 Materials Properties Data
134
TABLE 3.1.3.2(a) Summary Table format, continued on next page. X.X.X Fiber Filament-Count/Matrix Process Sequence Description*
MATERIAL: Fiber Filament-Count/Matrix Process Sequence Description
FIBER: Commercial Name Continu-ous/Discontinuous Diameter
MATRIX: Commercial Name
MANUFACTURER: Consolidation Process Manufacturer PROCESS SEQUENCE: Process PROCESSING: Type of Process: Temperature,
Duration, Pressure Source: Data source
*Warning Date of fiber manufacture MM/YY Date of testing MM/YY
Date of matrix manufacture MM/YY Date of data submittal MM/YY
Date of composite manufacture MM/YY Date of analysis MM/YY
LAMINA PROPERTY SUMMARY
Temperature RT coldest to hottest
Environment
Fiber v/o lowest to highest
Tension, 1-axis
Tension, 2-axis
Tension, 3-axis
Compression, 1-axis
Compression, 2-axis Classes of approval are noted for each type test/direction/environmental
Compression, 3-axis condition/fiber volume combination
Shear, 12-plane
Shear, 23-plane
Shear, 31-plane
Additional type test/direction
.
.
.
Classes of data: F - Fully approved, S - Screening in order: Strength/Modulus/Poisson’s Ratio/Strain-to-failure/Proportional Limit/0.02-offset-strength/0.2-offset-strength.

MIL-HDBK-17-4A Volume 4, Section 3 Materials Properties Data
135
TABLE 3.1.3.2(a) Summary Table format, concluded. Warning Nominal As Submitted Test Method Fiber Density (g/cm3) X.XX Minimum - Maximum Method
Foil Matrix Density (g/cm3) X.XX Minimum - Maximum Method
Composite Density (g/cm3) X.XX Minimum - Maximum Method
Ply Thickness* (in) 0.0XXX Minimum - Maximum Method
* Fiber center to fiber center
LAMINATE PROPERTY SUMMARY
Temperature RT coldest to hottest
Environment
Fiber v/o lowest to highest
Laminate Family
Type test/direction
.
.
. Classes of approval are noted for each type test/direction/environmental
condition/fiber volume combination
Classes of data: F - Fully approved, S - Screening in order: Strength/Modulus/Poisson’s Ratio/Strain-to-failure/Proportional Limit/0.02-offset-strength/0.2-offset-strength.

MIL-HDBK-17-4A Volume 4, Section 3 Materials Properties Data
136
TABLE 3.1.3.2(b) Laminate type test and directions
Type Test Direction
Tension Compression After Impact x-axis xy-plane Compression Bearing y-axis yz-plane Shear CTE z-axis zx-plane Open Hole Tension Open Hole Compression
Unless otherwise noted, the x-axis corresponds to the 0 direction of the laminate lay-up. Data in-cluded for this material are indicated by the class of approval, identified in the footnote.
The format for a data Table containing as-measured material property information is shown in Table 3.1.3.2(c).
Warnings are shown on each page for data sets which do not meet the data documentation re-quirements.
At the top right corner of each page is a box with a heavy border. This box contains information which identifies the data set, the type of test for which results are shown, specimen orientation, test conditions, and the classes of data.
Table Number Fiber Class/Matrix Class Form
Fiber Name/Matrix Name Test Type, Direction
Lay-up Test Temperature, Environment
Classes of Data Approval
Material identification is provided for the composite material as
Fiber Filament-Count/Matrix Process Sequence Description
The range of physical parameters, machining method, fiber volume, fiber spacing, specimen ge-ometry, gage thickness, gage width, and composite density are presented for the data on this particular page.
The test method is identified with the section number in Volume 4 where that test method is de-scribed.
The method of calculating the modulus is presented for mechanical property data. This includes the calculation method, and the location or range of measurements used for the calculation.
Pre-test exposure is identified here as Method Temperature Time Other critical parameters. Surface condition is also presented here
The normalization method is presented for data that have been normalized. The source is identi-fied here as well.

MIL-HDBK-17-4A Volume 4, Section 3 Materials Properties Data
137
At the top of each data column are the test conditions. Temperature (°F), environment (air, helium, etc.), fiber volume (%), and strain rate (1/s) are shown for each column.
Strength data and strain-to-failure data are presented in the handbook with a full set of statistical parameters. The class of data approval is indicated for each property/condition combination. B-values are presented only for fully approved data. A-basis values are presented for fully approved data which meet the batch and specimen number requirements for A-basis values. The distribu-tion method of analysis is presented. The constants, C1 and C2, correspond to the distribution. These are as follows:
C1 C2 Weibull scale parameter shape parameter Normal mean standard deviation Lognormal mean of the natural log of the
data standard deviation of the natural log of the data
Nonparametric rank Hanson-Koopmans coefficient ANOVA tolerance limit factor population standard deviation
Modulus data are presented with only mean, minimum, maximum, coefficient of variation, lot size,
and sample size. Values are presented for both normalized and as-measured data. Where avail-able, Poisson's ratio data are presented with batch size and sample size information.
* Information frequently presented in footnotes include conditioning parameters, reasons for not pre-senting B-values, and deviations from standard test methods.
Symbols for properties are presented with property directions as subscripts and property type, for exam-ple, tension (t), as superscripts. The example Table shows symbols for lamina tension in the fiber direc-tion.
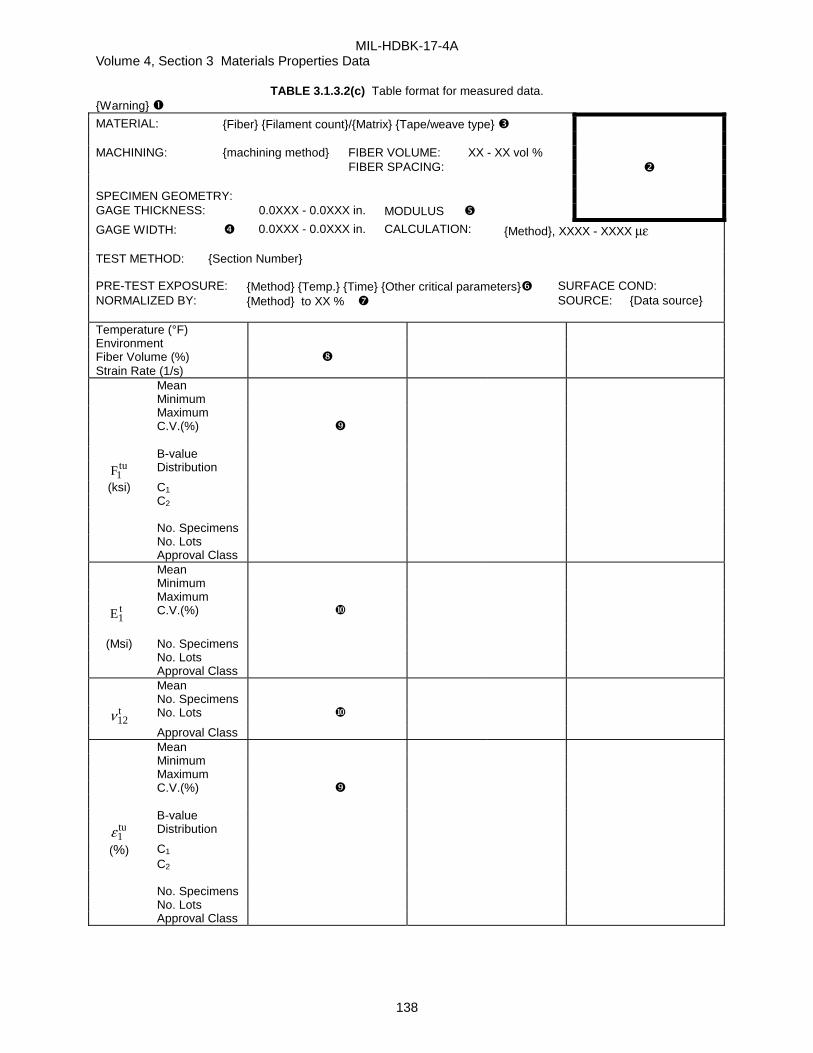
MIL-HDBK-17-4A Volume 4, Section 3 Materials Properties Data
138
TABLE 3.1.3.2(c) Table format for measured data. Warning MATERIAL: Fiber Filament count/Matrix Tape/weave type MACHINING: machining method FIBER VOLUME: XX - XX vol % FIBER SPACING: SPECIMEN GEOMETRY: GAGE THICKNESS: 0.0XXX - 0.0XXX in. MODULUS
GAGE WIDTH: 0.0XXX - 0.0XXX in. CALCULATION: Method, XXXX - XXXX µε TEST METHOD: Section Number PRE-TEST EXPOSURE: Method Temp. Time Other critical parameters SURFACE COND: NORMALIZED BY: Method to XX % SOURCE: Data source Temperature (°F) Environment Fiber Volume (%) Strain Rate (1/s) Mean Minimum Maximum C.V.(%) B-value
Ftu1 Distribution
(ksi) C1 C2 No. Specimens No. Lots Approval Class Mean Minimum Maximum
Et1 C.V.(%)
(Msi) No. Specimens
No. Lots Approval Class Mean No. Specimens
ν12t No. Lots
Approval Class Mean Minimum Maximum C.V.(%) B-value
ε1tu Distribution
(%) C1 C2 No. Specimens No. Lots Approval Class

MIL-HDBK-17-4A Volume 4, Section 3 Materials Properties Data
139
The format for a data Table containing shear material property information is shown in Table 3.1.3.2(d).
Warnings are shown on each page for data sets which do not meet the data documentation re-quirements.
At the top right corner of each page is a box with a heavy border. This box contains information which identifies the data set, the type of test for which results are shown, specimen orientation, test conditions, and the classes of data.
Table Number Fiber Class/Matrix Class Form
Fiber Name/Matrix Name Test Type, Direction
Lay-up Test Temperature, Environment
Classes of Data Approval
Material identification is provided for the composite material as
Fiber Filament-Count/Matrix Process Sequence Description
The range of physical parameters, machining method, fiber volume, fiber spacing, specimen ge-
ometry, gage thickness, gage width, and composite density are presented for the data on this particular page.
The test method is identified with the section number in Volume 4 where that test method is de-scribed.
The method of calculating the modulus is presented for mechanical property data. This includes the calculation method, and the location or range of measurements used for the calculation.
Pre-test exposure is identified here as Method Temperature Time Other critical parameters. Surface condition is also presented here
At the top of each data column are the test conditions. Temperature (°F), environment (air, helium, etc.), fiber volume (%), and strain rate (1/s) are shown for each column.
Strength data and strain-to-failure data are presented in the handbook with a full set of statistical parameters. The class of data approval is indicated for each property/condition combination. B-values are presented only for fully approved data. A-basis values are presented for fully approved data which meet the batch and specimen number requirements for A-basis values. The distribu-tion method of analysis is presented. The constants, C1 and C2, correspond to the distribution. These are as follows:
C1 C2 Weibull scale parameter shape parameter Normal mean standard deviation Lognormal mean of the natural log of the
data standard deviation of the natural log of the data
Nonparametric rank Hanson-Koopmans coefficient ANOVA tolerance limit factor population standard deviation

MIL-HDBK-17-4A Volume 4, Section 3 Materials Properties Data
140
Modulus data are presented with only mean, minimum, maximum, coefficient of variation, lot size, and sample size. Values are presented for both normalized and as-measured data. Where avail-able, Poisson's ratio data are presented with batch size and sample size information.
* Information frequently presented in footnotes include conditioning parameters, reasons for not pre-senting B-values, and deviations from standard test methods.
Symbols for properties are presented with property directions as subscripts and property type, for exam-ple, tension (t), as superscripts. The example Table shows symbols for lamina tension in the fiber direc-tion.

MIL-HDBK-17-4A Volume 4, Section 3 Materials Properties Data
141
TABLE 3.1.3.2(d) Table format for shear data. Warning MATERIAL: Fiber Filament count/Matrix Tape/weave type MACHINING: machining method FIBER VOLUME: XX - XX vol % FIBER SPACING: SPECIMEN GEOMETRY: GAGE THICKNESS: 0.0XXX - 0.0XXX in. MODULUS
GAGE WIDTH: 0.0XXX - 0.0XXX in. CALCULATION: Method, XXXX - XXXX µε TEST METHOD: D 5379M-93 PRE-TEST EXPOSURE: Method Temp. Time Other critical parameters SURFACE COND: NORMALIZED BY: Not normalized SOURCE: Data source Temperature (°F) Environment Fiber Volume (%) Strain Rate (1/s) Mean Minimum Maximum C.V.(%) B-value
su12F Distribution
(ksi) C1 C2 No. Specimens No. Lots Approval Class Mean Minimum
Maximum s12G
C.V.(%)
(Msi) No. Specimens No. Lots Approval Class Mean Minimum Maximum C.V.(%) B-value
su12γ Distribution
( µε ) C1
C2 No. Specimens No. Lots Approval Class *

MIL-HDBK-17-4A Volume 4, Section 3 Materials Properties Data
142
3.1.3.3 Fatigue data MIL-HDBK-17 Volume 4 has adopted the fatigue curve fitting procedures described in MIL-HDBK-5E [Reference 3.1.3.3]. Curves for constant amplitude fatigue are assumed to have the form
1 2log log= + ∆fN A A s
where A1 and A2 are fit to data using a least-squares regression. ∆s is the cycle range for either stress or strain. The MIL-HDBK-17 curves do not incorporate an equivalent stress calculation, or attempt any ad-justment for different R-ratio values. MIL-HDBK-5 includes additional fitting parameters, including an A4 which leads to a nonlinear fit. These parameters have not been incorporated in the MIL-HDBK-17 models. The use of run-out data in the fit also follows the Reference 3.1.3.3 approach. The rules are summa-rized as follows:
• Run-outs at stress levels above the minimum stress at which a failure occurred are included in the curve fitting calculations.
• Run-outs at stress levels below any stress at which a fatigue failure occurred are shown on the plots, but are not included in the curve fitting calculations.
The curve fitting method includes the Reference 3.1.3.3 procedures that account for non-uniform vari-ance. This approach recognizes that the residual errors of the curve fit tend to increase with decreasing stress levels. A statistical test is applied to determine if the variance is uniform. If non-uniform variance is detected, then a linear model is fitted to the variance as a function of stress level. That model is then used to adjust the weighting factors in a revised estimate of the S-N curve. The test for uniform variance leads to two presentation forms in the correlative information Tables pro-vided for each of the fatigue curves. If the variance is uniform, then an example of the strain-life equation information provided would be:
Log Nf = 3.97 – 4.39 Log (∆ε) Std. Dev. of log (Nf) = 0.12 R2 = 97%, No. of Samples = 17
Where the standard deviation of log(Nf) is a constant, and R2 is the root-mean-squared-error for the fit. If the variance is non-uniform, then the standard deviation appears as a function of stress or strain, as in
Log Nf = 4.04 – 4.60 Log (∆ε) Std. Dev. of Log (Nf) = 0.217 (1/∆ε) R2 = 83%, No. of Samples = 12
In this case, R2 is an adjusted error measure that includes the nonconstant weighting factors.
REFERENCES 3.1.3.3 “Metallic Materials and Elements for Aerospace Vehicle Structures”, MIL-HDBK-5G, Change
Notice 1, 1995, pp. 9-98 to 9-107.

MIL-HDBK-17-4A Volume 4, Section 3 Materials Properties Data
143
3.2 REINFORCEMENT PROPERTIES 3.2.1 INTRODUCTION The following information pertains to the mechanical properties of various fiber reinforcements. These properties are based on material of varying maturity and should be considered experimental in nature. “Typical” values are listed for approximate rule-of-mixtures calculations, but should not be used for final design purposes. These “typical” values are based on as-received properties and some change in proper-ties should be anticipated as a result of the composite manufacturing process. 3.2.2 ALUMINA FIBERS 3.2.2.1 Introduction Commercial aluminum oxide (Al2O3) fibers are produced by spinning and heat-treating sol/gel (i.e., chemically-derived) precursors, slurries of Al2O3 particles, or mixtures of both. Al2O3 fibers are polycrystal-line, with a very small grain size (< 0.5 µm), which is optimal for high strength. Al2O3 fibers are spun in the form of tows or rovings, which typically consist of 400 - 1000 filaments each having a diameter of 10 - 15 µm. Fiber rovings can be woven into fabrics and other complex shapes. Al2O3 fibers have high elastic modulus, high tensile and compressive strength, and high electrical resistivity, and are stable in corrosive environments and in molten metals such as aluminum. Al2O3 fibers are very refractory and retain their properties in air at 1000°C and above.

MIL-HDBK-17-4A Volume 4, Section 3 Materials Properties Data
144
3.2.2.2 Virgin Nextel TM 610 fiber Al2O3 MATERIAL: NextelTM 610 Alumina Fibers NextelTM 610 Fiber CHEMICAL COMP.: >99% Al2O3 Summary FIBER: Diameter = 12 µm MANUFACTURER: 3M Co. PROCESSING: 3000 denier, 780 filament roving Date of fiber manufacture 3/99 Date of data submittal 2/01
Date of testing 6/99 Date of analysis 2/01
FIBER PROPERTY SUMMARY
Temperature °C (°F) 22 (72)
Tension S---
Classes of data: F - Fully approved, S - Screening in Strength/Modulus/Poisson’s Ratio/Strain-to-failure order.

MIL-HDBK-17-4A Volume 4, Section 3 Materials Properties Data
145
MATERIAL: Nextel 610 Fiber Table 3.2.2.2(a) Al2O3
Nextel 610 Fiber TEST METHOD: 25.4 mm gauge length 0.02 strain rate rubber-faced clamp grips
MODULUS CALCULATION: Tension, 1-axis
PRE-TEST EXPOSURE: none SOURCE: 3M Co. 72, Air Screening
Temperature °F 72 Environment Air Mean 490 Minimum 207 Maximum 609 C.V.(%) 10.8 B-value (1) Distribution
C1 tuF
(ksi) C2
No. Specimens 369 No. Lots 1 Approval Class Screening Mean Minimum Maximum
tE C.V.(%)
(Msi) No. Specimens
No. Lots Approval Class Mean
tν No. Specimens
No. Lots Approval Class Mean Minimum Maximum
C.V.(%)
B-value Distribution
C1 tuε C2
No. Specimens
No. Lots Approval Class (1) See Figure 3.2.2.1 for individual spool statistics. Spool statistics are given using SI units.

MIL-HDBK-17-4A Volume 4, Section 3 Materials Properties Data
146
Nextel 610 Fiber
-8
-6
-4
-2
0
2
5.2 5.4 5.6 5.8 6 6.2 6.4
ln Tensile Strength, ksi
ln ln
1/1
-P
Mean tensile strength = 490 ksi (3.4 Gpa)Mean diameter = 12 µmStd deviation, diameter = 0.22 µmWeibull modulus = 11.2
FIGURE 3.2.2.1 Weibull probability distribution plot for strength (P is the probability of survival of a specific length of fiber loaded to a given stress).

MIL-HDBK-17-4A Volume 4, Section 3 Materials Properties Data
147
3.2.3 BORON FIBERS This section is reserved for future use. 3.2.4 BORON CARBIDE FIBERS This section is reserved for future use. 3.2.5 CARBON AND GRAPHITE FIBERS This section is reserved for future use. 3.2.6 SILICON CARBIDE FIBERS

MIL-HDBK-17-4A Volume 4, Section 3 Materials Properties Data
148
3.2.6.1 Virgin SCS-6 Fiber* SiC MATERIAL: SCS-6 Fiber SCS-6 Fiber CHEMICAL COMP.: Beta-Silicon Carbide/Carbon Core Summary FIBER: Diameter = 140 µm MANUFACTURER: Textron Systems Inc. PROCESSING: * ALL DOCUMENTATION PRESENTLY REQUIRED WERE NOT SUPPLIED FOR THIS MATERIAL. Date of fiber manufacture Date of data submittal 4/98
Date of testing 94 Date of analysis 10/98
FIBER PROPERTY SUMMARY
Temperature °C (°F) 22 (72)
Tension SS--
Classes of data: F - Fully approved, S - Screening in Strength/Modulus/Poisson’s Ratio/Strain-to-failure order.

MIL-HDBK-17-4A Volume 4, Section 3 Materials Properties Data
149
MATERIAL: SCS-6 Fiber Table 3.2.6.1(a) SiC TEST METHOD: MODULUS CALCULATION: SCS-6 Fiber Tension, 1-axis PRE-TEST EXPOSURE: SOURCE: Air Force 72, Air Screening
Temperature (°F) 72 Environment Air Mean 551 Minimum 220 Maximum 772 C.V.(%) 16.7 B-value (1) Distribution
Ftu C1
(ksi) C2 No. Specimens 203 No. Lots 3 Approval Class Screening Mean 50.3 Minimum 40.5 Maximum 58.2
Et C.V.(%) 6.64
(Msi) No. Specimens 80
No. Lots 2 Approval Class Screening Mean
νt No. Specimens
No. Lots Approval Class Mean Minimum Maximum
C.V.(%)
B-value Distribution
ε tu C1
C2 No. Specimens
No. Lots Approval Class (1) See Table 3.2.6.1(b) for individual spool statistics.

MIL-HDBK-17-4A Volume 4, Section 3 Materials Properties Data
150
SCS-6 Fiber
-14
-12
-10
-8
-6
-4
-2
0
2
4
7 7.5 8 8.5 9
Ln (UTS)
Ln
(Ln
(1/P
s))
Spool 1Spool 2Spool 3
FIGURE 3.2.6.1. Weibull probability distribution plot for strength. (Ps is the probability of survival of a specific length of fiber loaded to a stress.)
TABLE 3.2.6.1(b) Individual spool Weibull statistics (strength).
Spool 1 Spool 2 Spool 3 C.V 10.9 12.4 15.2 B-Value 429 493 463 Scale Parameter (α) 525 684 647 Shape Parameter (β) 13.1 9.69 8.70
3.2.7 STEEL FIBERS This section is reserved for future use.

MIL-HDBK-17-4A Volume 4, Section 3 Materials Properties Data
151
3.2.8 TUNGSTEN FIBERS This section is reserved for future use. 3.2.9 OTHER FIBERS This section is reserved for future use. 3.2.10 OTHER REINFORCEMENTS This section is reserved for future use.

MIL-HDBK-17-4A Volume 4, Section 3 Materials Properties Data
152
3.3 PROPERTIES OF MATRIX MATERIALS 3.3.1 INTRODUCTION Section 3.3 contains data for the properties of the neat matrix materials. These monolithic metals are not manufactured by conventional techniques such as standard forging, rolling, and casting operations (whose properties would be found in Mil-Handbook 5), but rather are uniquely processed to mimic the processing operation which is used when making the composite. Common processing techniques for the neat matrix are hipped foil and hipped sheet. With these types of processing techniques, the properties of the neat matrix should be as close as possible to those of the in-situ matrix in the composite. Note, how-ever, that the reinforcement may affect the in-situ properties of the matrix due to either residual stresses and/or reaction of the reinforcement and matrix and corresponding diffusion/depletion of the elements in either constituent. Property data taken from the neat matrix material (Section 3.3) and reinforcement (Section 3.2) can be used with micromechanical analyses to aid in composite design. This is especially helpful to predict composite properties for cross-ply laminates, for which limited information is currently given in this Hand-book. Additionally, there are many types of composite properties for which limited or no data are available. In such cases, composite properties can be estimated from the constituent properties using analytical relationships. Note that matrix properties taken from conventionally processed alloys will be different from those taken from the neat matrix, and, therefore, any estimation of composite properties based on con-ventionally processed materials rather than those of the neat matrix should be done with caution. 3.3.2 ALUMINUMS This section is reserved for future use. 3.3.3 COPPERS This section is reserved for future use. 3.3.4 MAGNESIUMS This section is reserved for future use. 3.3.5 TITANIUMS 3.3.5.1 Ti-15V-3Cr-3Al-3Sn (NASA-GRC) The material was manufactured by Textron through consolidation of sheets or foils to yield plates ap-proximately 0.4” thick. The plates were cut into specimens and heat treated in vacuum for 24 h at 1292°F (700°C). Tensile tests were conducted according to test methods in Section 1.9.2.1. Direct induction heating was used for testing at elevated temperatures. Test were generally performed in air. Some tests were performed at Marshall Space Flight Center to assess the effects (and very little were observed) of high pressure hydrogen on this material. These tests were either run in 5 ksi helium or 5 ksi hydrogen. The majority of the Ti-15-3 tests were conducted to characterize various viscoplastic models. There-fore, the failure of the specimen was not required and these tests were unloaded after a given amount of strain. Hence, many of the failure strains in the raw data Table in Appendix B have a “>” sign preceding the strain at which unloading occurred. For the same reason, many of the UTS values are missing. For interrupted tests, only those UTS values are given where the specimen had already reached a maximum stress and subsequently softened until the specimen was unloaded. The Table of average tensile properties for room temperature tests is shown in Tables 3.3.5.1(a) and (d). Since strain rate does not play a significant role at room temperature for this material, and neither did

MIL-HDBK-17-4A Volume 4, Section 3 Materials Properties Data
153
testing in high pressure hydrogen or helium, all of these data were combined to give the room temperature information in this Table. The term “lot” in this Table refers to one plate of material. The UTS is given in Figure 3.3.5.1(a) as a function of temperature and strain rate. There is approxi-mately a factor of two decrease in the UTS between 75°F (24°C) and 1000°F (538°C). At 1000°F (538°C) the UTS is very dependent upon the strain rate. The elastic modulus is plotted as a function of temperature and strain rate in Figure 3.3.5.1(b). The data points in this Figure are not means but are values from individual tests. The Figure shows that the modulus generally decreases 13% between room temperature and 1000°F (538°C). Up to 800°F (427°C) there is little effect of strain rate on modulus. Above 800°F (427°C), the modulus rapidly decreases with increasing temperature for specimens tested at the slower strain rate. This is not depicted in this Figure, but can be ascertained by examining the raw data in Appendix B. The proportional limit, 0.02% and 0.2% yield strengths are plotted in Figures 3.3.5.1(c) – (e) as a func-tion of temperature and strain rate. There is approximately a factor of two decrease in the yield strengths between 75°F (24°C) and 1000°F (538°C). At temperatures greater than or equal to 600°F (316°C), the yield strengths become highly strain rate sensitive. The slower the strain rate, the lower is the yield strength and the lower is the temperature at which a rapid drop-off in the yield strength occurs with in-creasing temperature. Tensile curves are plotted as a function of strain rate for three different temperatures: 400°F (204°C) (Figure 3.3.5.1(f)), 800°F (427°C) (Figure 3.3.5.1(g)), and 1000°F (538°C) (Figure 3.3.5.1(h)). At 400°F (204°C) there is minimal strain rate sensitivity. However, at 800°F (427°C), strain rate has a large effect on the tensile behavior. At a temperature of 800°F (427°C), a strain rate of 1x10⁻⁵ s-1 is slow enough to induce softening after the attainment of the UTS. At still slower strain rates, dynamic strain aging is active, which leads to hardening as the tests progress. At 1000°F (538°C) the temperature is high enough to induce softening after attaining the UTS. At a strain rate of 1x10⁻⁶ s-1, the material exhibits dynamic strain aging, but not to the extent of that observed at 800°F (427°C). Dynamic strain aging results in the hardening effect observed in the initial part of the stress-strain curve. Figures 3.3.5.1(i) and (j) show the effect of temperature on the tensile behavior at two different strain rates: 1x10⁻⁴ and 1x10⁻⁶ s-1. The maximum stress in each curve decreases with increasing temperature. Additionally, dynamic strain aging results in some anomalous behavior in some of the curves (see, for ex-ample, the curves at 800°F (427°C) and 1000°F (538°C) at a strain rate of 1x10⁻⁶ s-1). For additional information, please refer to the following References.
• B.A. Lerch, T.P. Gabb and R.A. MacKay: Heat Treatment Study of the SiC/Ti-15-3 Composite Sys-tem. NASA TP 2970, Jan., 1990.
• T.P. Gabb, J. Gayda, B.A. Lerch and G.R. Halford: The Effect of Matrix Mechanical Properties on [0]8 Unidirectional SiC/Ti Composite Fatigue Resistance. Scripta Met., Vol. 25, 1991, pp. 2879-2884.
• M.G. Castelli, B.A. Lerch and D.J. Keller: A Comparison of Deformation Behaviors of HIPed Foil and Sheet Titanium Alloys, HITEMP Review 1999, Advanced High Temperature Engine Materials Technology Project, NASA/CP 1999-208915/VOL2, Paper 27.

MIL-HDBK-17-4A Volume 4, Section 3 Materials Properties Data
154
3.3.5.1 Ti-15V-3Cr-3Al-3Sn HIP sheet/foil* Ti MATERIAL: Ti-15V-3Cr-3Al-3Sn HIP sheet/foil Ti-15-3 Summary MATRIX: Ti-15V-3Cr-3Al-3Sn MANUFACTURER: Textron PROCESS SEQUENCE: Hipped Sheet or Foil PROCESSING: SOURCE: NASA-GRC Date of matrix manufacture Date of data submittal 6/98
Date of testing 5/96-7/97 Date of analysis 8/98
MATRIX PROPERTY SUMMARY Temperature 75°F 400°F 600°F 800°F 900°F 1000°F
Environment Air(1) Air Air Air Air Air
Tension SS-SSSS -S--SSS -S--SSS -S--SSS SS--SSS SS--SSS
(1) Some testing at 5 ksi Helium and 5 ksi Hydrogen, results pooled. Classes of data: F - Fully approved, S - Screening in order: Strength/Modulus/Poisson’s Ratio/Strain-to-failure/Proportional Limit/0.02-offset-strength/0.2-offset-strength. * Raw data tables are presented in Appendix B4.1.

MIL-HDBK-17-4A Volume 4, Section 3 Materials Properties Data
155
MATERIAL: Ti-15V-3Cr-3Al-3Sn HIP sheet/foil Table 3.3.5.1(a) Ti HIP sheet/foil Ti-15-3 TEST METHOD: Sec. 1.9.2.1 MODULUS Least squares analysis up Tension, 1-axis CALCULATION: to proportional limit N/A 75, 400, 600, Air PRE-TEST EXPOSURE: Vacuum 1292°F, 24 hr SOURCE: NASA-GRC Screening NORMALIZED BY: N/A Temperature (°F) 75 400 600 Environment Air (1) Air Air Strain Rate (1/s) (3) (3) 1 10-4 Mean 124 Minimum 120 Maximum 127 C.V.(%) 1.83
B-value (2) tu1F
Distribution ANOVA (ksi) C1 2.89
C2 12.9 No. Specimens 7 No. Lots 2 Approval Class Screening Mean 12.4 12.3 11.4 Minimum 11.9 12.0 Maximum 13.0 12.6
t1E C.V.(%) 3.39
(Msi) No. Specimens 8 3 1
No. Lots 3 2 1 Approval Class Screening Screening Screening Mean
m12ν No. Specimens
No. Lots Approval Class Mean 19.3 Minimum 16.8 Maximum 22.1
C.V.(%) 10.7
B-value (2) tu1ε
Distribution Normal (%) C1 19.3
C2 2.06 No. Specimens 7
No. Lots 2 Approval Class Screening (1) Some testing at 5 ksi Helium and 5 ksi Hydrogen, results pooled. (2) B-basis values appear for fully approved data only. (3) Strain rates pooled (1/s): 1 10-6, 8.3 10-5, 1 10-4, 2 10-3.

MIL-HDBK-17-4A Volume 4, Section 3 Materials Properties Data
156
MATERIAL: Ti-15V-3Cr-3Al-3Sn HIP sheet/foil Table 3.3.5.1(b) Ti HIP sheet/foil Ti-15-3 TEST METHOD: Sec. 1.9.2.1 MODULUS Least squares analysis up Tension, 1-axis CALCULATION: to proportional limit N/A 800, Air PRE-TEST EXPOSURE: Vacuum 1292°F, 24 hr SOURCE: NASA-GRC Screening
NORMALIZED BY: N/A Temperature (°F) 800 800 800 800 Environment Air Air Air Air Strain Rate (1/s) 1 10-8 1 10-6 1 10-5 1 10-4 Mean Minimum Maximum C.V.(%)
B-value tu1F
Distribution (ksi) C1
C2 No. Specimens No. Lots Approval Class Mean 17 10.8 10.8 11.3 Minimum Maximum
t1E C.V.(%)
(Msi) No. Specimens 1 1 1 1
No. Lots 1 1 1 1 Approval Class Screening Screening Screening Screening Mean
m12ν No. Specimens
No. Lots Approval Class Mean Minimum Maximum
C.V.(%)
B-value tu1ε
Distribution (%) C1
C2 No. Specimens
No. Lots Approval Class

MIL-HDBK-17-4A Volume 4, Section 3 Materials Properties Data
157
MATERIAL: Ti-15V-3Cr-3Al-3Sn HIP sheet/foil Table 3.3.5.1(c) Ti HIP sheet/foil Ti-15-3 TEST METHOD: Sec. 1.9.2.1 MODULUS Least squares analysis up Tension, 1-axis CALCULATION: to proportional limit N/A 900, 1000, Air PRE-TEST EXPOSURE: Vacuum 1292°F, 24 hr SOURCE: NASA-GRC Screening
NORMALIZED BY: N/A Temperature (°F) 900 1000 1000 1000 Environment Air Air Air Air Strain Rate (1/s) 1 10-4 1 10-6 1 10-4 1 10-3 Mean 75 24 43 67 Minimum Maximum C.V.(%)
B-value tu1F
Distribution (ksi) C1
C2 No. Specimens 1 1 1 1 No. Lots 1 1 1 1 Approval Class Screening Screening Screening Screening Mean 10.8 5.3 10.5 11 Minimum 10.7 Maximum 10.9
t1E C.V.(%)
(Msi) No. Specimens 2 1 1 1
No. Lots 2 1 1 1 Approval Class Screening Screening Screening Screening Mean
m12ν No. Specimens
No. Lots Approval Class Mean Minimum Maximum
C.V.(%)
B-value tu1ε
Distribution (%) C1
C2 No. Specimens
No. Lots Approval Class

MIL-HDBK-17-4A Volume 4, Section 3 Materials Properties Data
158
MATERIAL: Ti-15V-3Cr-3Al-3Sn HIP sheet/foil Table 3.3.5.1(d) Ti HIP sheet/foil Ti-15-3 TEST METHOD: Sec. 1.9.2.1 MODULUS Least squares analysis up Tension, 1-axis CALCULATION: to proportional limit N/A 75, 400, 600, Air PRE-TEST EXPOSURE: Vacuum 1292°F, 24 hr SOURCE: NASA-GRC Screening
NORMALIZED BY: N/A Temperature (°F) 75 400 600 Environment Air (1) Air Air Strain Rate (1/s) (3) (3) 1 10-4 Mean 103 75.3 69 Minimum 94 65 Maximum 111 81 C.V.(%)
B-value pl1F
Distribution (ksi) C1
C2 No. Specimens 2 3 1 No. Lots 2 2 1 Approval Class Screening Screening Screening Mean 113 85.3 78 Minimum 108 84 Maximum 117 87
C.V.(%)
B-value ty0.021F
Distribution
(ksi) C1 C2
No. Specimens 2 3 1
No. Lots 2 2 1 Approval Class Screening Screening Screening Mean 115 95.7 87 Minimum 110 95 Maximum 124 96
C.V.(%) 3.64
B-value (2) ty0.21F
Distribution ANOVA (ksi) C1 5.74
C2 5.75 No. Specimens 8 3 1
No. Lots 3 2 1 Approval Class Screening Screening Screening (1) Some testing at 5 ksi Helium and 5 ksi Hydrogen, results pooled. (2) B-basis values appear for fully approved data only. (3) Strain rates pooled (1/s): 1 10-6, 8.3 10-5, 1 10-4, 2 10-3.

MIL-HDBK-17-4A Volume 4, Section 3 Materials Properties Data
159
MATERIAL: Ti-15V-3Cr-3Al-3Sn HIP sheet/foil Table 3.3.5.1(e) Ti HIP sheet/foil Ti-15-3 TEST METHOD: Sec. 1.9.2.1 MODULUS Least squares analysis up Tension, 1-axis CALCULATION: to proportional limit N/A 800, Air PRE-TEST EXPOSURE: Vacuum 1292°F, 24 hr SOURCE: NASA-GRC Screening
NORMALIZED BY: N/A Temperature (°F) 800 800 800 800 Environment Air Air Air Air Strain Rate (1/s) 1 10-8 1 10-6 1 10-5 1 10-4 Mean 5.2 20 56 59 Minimum Maximum C.V.(%)
B-value pl1F
Distribution (ksi) C1
C2 No. Specimens 1 1 1 1 No. Lots 1 1 1 1 Approval Class Screening Screening Screening Screening Mean 40 29 69 73 Minimum Maximum
C.V.(%)
B-value ty0.021F
Distribution (ksi) C1
C2 No. Specimens 1 1 1 1
No. Lots 1 1 1 1 Approval Class Screening Screening Screening Screening Mean 43 83 84 Minimum Maximum
C.V.(%)
B-value ty0.21F
Distribution (ksi) C1
C2 No. Specimens 1 1 1
No. Lots 1 1 1 Approval Class Screening Screening Screening

MIL-HDBK-17-4A Volume 4, Section 3 Materials Properties Data
160
MATERIAL: Ti-15V-3Cr-3Al-3Sn HIP sheet/foil Table 3.3.5.1(f) Ti HIP sheet/foil Ti-15-3 TEST METHOD: Sec. 1.9.2.1 MODULUS Least squares analysis up Tension, 1-axis CALCULATION: to proportional limit N/A 900, 1000, Air PRE-TEST EXPOSURE: Vacuum 1292°F, 24 hr SOURCE: NASA-GRC Screening
NORMALIZED BY: N/A Temperature (°F) 900 1000 1000 1000 Environment Air Air Air Air Strain Rate (1/s) 1 10-4 1 10-6 1 10-4 1 10-3 Mean 54 6 23 50 Minimum 50 Maximum 57 C.V.(%)
B-value pl1F
Distribution (ksi) C1
C2 No. Specimens 2 1 1 1 No. Lots 2 1 1 1 Approval Class Screening Screening Screening Screening Mean 65 6 33 60 Minimum Maximum
C.V.(%)
B-value ty0.021F
Distribution
(ksi) C1 C2
No. Specimens 2 1 1 1
No. Lots 2 1 1 1 Approval Class Screening Screening Screening Screening Mean 74.5 8 42 67 Minimum 74 Maximum 75
C.V.(%)
B-value ty0.21F
Distribution (ksi) C1
C2 No. Specimens 2 1 1 1
No. Lots 2 1 1 1 Approval Class Screening Screening Screening Screening

MIL-HDBK-17-4A Volume 4, Section 3 Materials Properties Data
161
Ti-15-3
20
40
60
80
100
120
140
0 200 400 600 800 1000 1200
2x10⁻³
1x10⁻³
1x10⁻⁴
8.3x10 -5
1x10⁻⁶
Ftu (
ksi)
Temperature (°F)
Strain Rates (1/s)
FIGURE 3.3.5.1(a) Ultimate tensile strength as a function of temperature and strain rate.
10.0
10.5
11.0
11.5
12.0
12.5
13.0
13.5
0 200 400 600 800 1000 1200
Et(M
si)
2x10⁻³
1x10⁻³
1x10⁻⁴
1x10⁻⁵
8.3x10⁻⁵
1x10⁻⁶
Temperature (°F)
Strain Rates (1/s)
FIGURE 3.3.5.1(b) Tensile modulus as a function of temperature and strain rate.

MIL-HDBK-17-4A Volume 4, Section 3 Materials Properties Data
162
Ti-15-3
0
20
40
60
80
100
120
0 200 400 600 800 1000 1200
2x10⁻³
1x10⁻³
1x10⁻⁴
1x10⁻⁵
1x10⁻⁶
1x10⁻⁸
Fpl (
ksi)
Temperature (°F)
Strain Rates (1/s)
FIGURE 3.3.5.1(c) Proportional limit as a function of temperature and strain rate.
0
20
40
60
80
100
120
0 200 400 600 800 1000 1200
2x10⁻³
1x10⁻³
1x10⁻⁴
1x10⁻⁵
1x10⁻⁶
1x10⁻⁸
Fty0.
02 (
ksi)
Temperature (°F)
Strain Rates (1/s)
FIGURE 3.3.5.1(d) 0.02-offset-yield-strength as a function of temperature and strain rate

MIL-HDBK-17-4A Volume 4, Section 3 Materials Properties Data
163
Ti-15-3
0
20
40
60
80
100
120
0 200 400 600 800 1000 1200
2x10⁻³
1x10⁻³
1x10⁻⁴
1x10⁻⁵
1x10⁻⁶
1x10⁻⁸
Fpl (
ksi)
Temperature (°F)
Strain Rates (1/s)
FIGURE 3.3.5.1(e) 0.2-offset-yield-strength as a function of temperature and strain rate.
0
20
40
60
80
100
120
0 0.01 0.02 0.03 0.04 0.05 0.06 0.07 0.08
1x10 -4
1x10 -3
1x10 -6
Str
ess
(ksi
)
Strain
Strain Rate (1/s)
FIGURE 3.3.5.1(f) Tensile curves at 400°F (204°C) as a function of strain rate.

MIL-HDBK-17-4A Volume 4, Section 3 Materials Properties Data
164
Ti-15-3
0
20
40
60
80
100
120
0 0.005 0.01 0.015 0.02 0.025 0.03 0.035 0.04
1x10 -4
1x10 -5
1x10 -6
1x10 -8
Str
ess
(ksi
)
Strain
Strain Rate (1/s)
FIGURE 3.3.5.1(g) Tensile curves at 800°F (427°C) as a function of strain rate.
0
10
20
30
40
50
60
70
0 0.01 0.02 0.03 0.04 0.05 0.06 0.07 0.08
1x10 -3
1x10 -4
1x10 -6
Str
ess
(ksi
)
Strain
Strain Rate (1/s)
FIGURE 3.3.5.1(h) Tensile curves at 1000°F (538°C) as a function of strain rate.

MIL-HDBK-17-4A Volume 4, Section 3 Materials Properties Data
165
Ti-15-3
0
20
40
60
80
100
120
140
0 0.01 0.02 0.03 0.04 0.05 0.06 0.07 0.08
Str
ess
(ksi
)
Strain
1000 o F
900 o F
800 o F
600 o F 400 o F
75 o F
FIGURE 3.3.5.1(i) Tensile curves at a strain rate of 10-4s-1 as a function of temperature.
0
20
40
60
80
100
120
0 0.01 0.02 0.03 0.04 0.05 0.06 0.07 0.08
Str
ess
(ksi
)
Strain
400 o F
800 o F
1000 o F
FIGURE 3.3.5.1(j) Tensile curves at a strain rate of 10-6s-1 as a function of temperature. 3.3.6 OTHERS This section is reserved for future use.

MIL-HDBK-17-4A Volume 4, Section 3 Materials Properties Data
166
3.4 FIBER COATING PROPERTIES 3.4.1 INTRODUCTION This section is reserved for future use. 3.4.2 CARBON This section is reserved for future use. 3.4.3 TITANIUM DIBORIDE This section is reserved for future use. 3.4.4 YTTRIA This section is reserved for future use. 3.4.5 OTHERS This section is reserved for future use.

MIL-HDBK-17-4A Volume 4, Section 3 Materials Properties Data
167
3.5 ALUMINUM MATRIX COMPOSITE PROPERTIES 3.5.1 INTRODUCTION This section is reserved for future use. 3.5.2 ALUMINA/ALUMINUM 3.5.2.1 Nextel 610/pure Al panel

MIL-HDBK-17-4A Volume 4, Section 3 Materials Properties Data
168
3.5.2.1 Nextel 610/pure Al panel* Al203/SP Al MATERIAL: Nextel 610/SP Al panel Nextel 610/SP Al Summary FIBER Nextel 610, continuous, 11.5 µm MATRIX: Al MANUFACTURER: 3M. PROCESS SEQUENCE: Pressure infiltration casting PROCESSING: 720°C melt, 680°C premold and
cast @ 1300 psi SOURCE: 3M Corporation
Date of fiber manufacture 3/99 Date of testing 1995-1997
Date of matrix manufacture Date of data submittal 4/99
Date of composite manufacture 1995-1997 Date of analysis 2/01
LAMINA PROPERTY SUMMARY
Temperature 73°F
Environment Air
Fiber v/o 65
[0] Tension, 1-axis
FS-F---
[90] Tension, 2-axis
FS-S---
Classes of data: F - Fully approved, S - Screening in order: Strength/Modulus/Poisson’s Ratio/Strain-to-failure/Proportional Limit/0.02-offset-strength/0.2-offset-strength. * Raw data tables are presented in Appendix C1.1.

MIL-HDBK-17-4A Volume 4, Section 3 Materials Properties Data
169
Nominal As Submitted Test Method
Fiber Density (g/cm3) 3.97
Foil Matrix Density (g/cm3)
Composite Density (g/cm3) 3.40
Ply Thickness (in)
LAMINATE PROPERTY SUMMARY
Temperature
Environment
Fiber v/o
Classes of data: F - Fully approved, S - Screening in order: Strength/Modulus/Poisson’s Ratio/Strain-to-failure/Proportional Limit/0.02-offset-strength/0.2-offset-strength.

MIL-HDBK-17-4A Volume 4, Section 3 Materials Properties Data
170
MATERIAL: Nextel 610/pure Al Table 3.5.2.1(a) MACHINING: Diamond cutting wheel FIBER VOLUME: 65% Al2O3/Al panel FIBER SPACING: N/A Nextel 610/SP Al SPECIMEN GEOMETRY: Straight-sided Tension, 1-axis GAGE THICKNESS: 0.050 in. MODULUS [0]1 GAGE WIDTH: 0.375 in. CALCULATION: 73, Air TEST METHOD: (1)
Least squares fit from .01% to .02% strain
Fully Approved, Screening
PRE-TEST EXPOSURE: None SOURCE: 3M NORMALIZED BY: Not normalized Temperature (°F) 73 Environment Air Fiber Volume Fraction 0.65 Strain Rate (1/s) 1-1.5x10⁻² Mean 266 Minimum 240 Maximum 285 C.V.(%) 4.11 B-value 244
Ftu1 Distribution ANOVA
(ksi) C1 11.1 C2 1.99
No. Specimens 42 No. Lots 8 Approval Class Fully Approved Mean 38 Minimum 34.8 Maximum 39.8
Et1 C.V.(%) 3.16
(Msi) No. Specimens 29
No. Lots 7 Approval Class Screening Mean
ν12t No. Specimens
No. Lots Approval Class Mean 0.729 Minimum 0.630 Maximum 0.790
C.V.(%) 5.72
B-value .638 ε1
tu Distribution ANOVA
(%) C1 0.032 C2 2.39
No. Specimens 36
No. Lots 8 Approval Class Fully Approved (1) MMC TM 401. Contact 3M or the Secretariat for additional information on this 3M test standard.

MIL-HDBK-17-4A Volume 4, Section 3 Materials Properties Data
171
MATERIAL: Nextel 610/pure Al Table 3.5.2.1(b) Al2O3/Al panel MACHINING: Diamond cutting wheel FIBER VOLUME: 65% Nextel 610/SP Al FIBER SPACING: N/A Tension, 2-axis SPECIMEN GEOMETRY: Straight-sided [90]1 GAGE THICKNESS: 0.050 in. MODULUS 73, Air GAGE WIDTH: 0.375 in. CALCULATION: Least squares fit form
.01% to .02% Fully Approved,
Screening
TEST METHOD: (1) PRE-TEST EXPOSURE: None SOURCE: 3M NORMALIZED BY: Not normalized Temperature (°F) 73 Environment Air Fiber Volume Fraction .65 Strain Rate (1/s) 1·10-2 Mean 25.9 Minimum 22.4 Maximum 29.7 C.V.(%) 6.96 B-value 21.8
tu2F Distribution ANOVA
(ksi) C1 1.88 C2 2.23
No. Specimens 39 No. Lots 6 Approval Class Fully Approved Mean 17.8 Minimum 16.7 Maximum 19.4
t2E C.V.(%) 6.44
(Msi) No. Specimens 8
No. Lots 3 Approval Class Screening Mean
t23ν No. Specimens
No. Lots Approval Class Mean 1.16 Minimum 0.720 Maximum 4.16
C.V.(%) 55.4
B-value (2) tu2ε Distribution ANOVA
(%) C1 0.762 C2 3.97
No. Specimens 36
No. Lots 4 Approval Class Screening (1) MMC TM 401. Contact 3M or the Secretariat for additional information on this 3M test standard. (2) B-values are only reported for fully approved data.

MIL-HDBK-17-4A Volume 4, Section 3 Materials Properties Data
172
Nextel 610/SP Al
0
50
100
150
200
250
300
0 0.1 0.2 0.3 0.4 0.5 0.6 0.7
Str
ess
(ksi
)
% Strain
65 Vf
[0]
[90]
FIGURE 3.5.2.1(a) Typical tensile behavior for [0] and [90] specimen at 73°F(22°C) at a strain rate of 1.50x10⁻² s-1. 3.5.3 BORON/ALUMINUM This section is reserved for future use. 3.5.4 BORON CARBIDE/ALUMINUM This section is reserved for future use. 3.5.5 GRAPHITE/ALUMINUM This section is reserved for future use. 3.5.6 SILICON CARBIDE/ALUMINUM This section is reserved for future use. 3.5.7 STEEL/ALUMINUM This section is reserved for future use. 3.5.8 TUNGSTEN/ALUMINUM This section is reserved for future use. 3.5.9 OTHERS/ALUMINUM This section is reserved for future use.

MIL-HDBK-17-4A Volume 4, Section 3 Materials Properties Data
173
3.6 COPPER MATRIX COMPOSITE PROPERTIES 3.6.1 INTRODUCTION This section is reserved for future use. 3.6.2 GRAPHITE/COPPER This section is reserved for future use. 3.6.3 OTHERS/COPPER This section is reserved for future use.

MIL-HDBK-17-4A Volume 4, Section 3 Materials Properties Data
174
3.7 MAGNESIUM MATRIX COMPOSITE PROPERTIES 3.7.1 INTRODUCTION This section is reserved for future use. 3.7.2 GRAPHITE/MAGNESIUM This section is reserved for future use. 3.7.3 ALUMINA/MAGNESIUM This section is reserved for future use. 3.7.4 OTHER/MAGNESIUM This section is reserved for future use.

MIL-HDBK-17-4A Volume 4, Section 3 Materials Properties Data
175
3.8 TITANIUM MATRIX COMPOSITE PROPERTIES 3.8.1 INTRODUCTION At the time of this edition, only data for SiC-reinforced titanium alloys are presented in this section. They have all been produced by foil-fiber-foil compactions (see Section 1.2.6.2.2). The SiC fiber used in all cases is the SCS-6 monofilament. This fiber has a nominal UTS of 500 ksi, with a 50-60 Msi modulus. Due to these high values, the fiber properties dominate in directions parallel to the fiber axis in the compo-sited form. The SCS-6 monofilament is coated with a double-pass, carbon-rich layer. This coating protects the surface of the fiber from handling damage. Additionally, it acts as a diffusion barrier to prevent reaction of the titanium matrices with the SiC fiber during consolidation. The coating forms a weak interface which leads to fiber/matrix debonding and low transverse properties. Thus, the properties of the materials listed in this section are extremely anisotropic. 3.8.2 SILICON CARBIDE/TITANIUM 3.8.2.1 SiC/Ti-15-3 3.8.2.1.1 SiC/Ti-15-3 Tension Composite plates were consolidated by Textron using the foil-fiber-foil method. The matrix foils were of the alloy Ti-15V-3Cr-3Al-3Sn (Ti-15-3) and the reinforcement was the SCS-6 fibers. Plates were either 8 or 32-ply thick and had dimensions of 10” x 14”. All fiber mats used in these plates were woven with metallic ribbons. The type of ribbon used (Ti, Mo, or Ti-Nb) depended upon the manufacturing year. Tensile specimens were cut from the plates and prepared according to Section 1.3.2.4. All specimens were heat treated in vacuum for 24 h at 1292°F (700°C). Tensile tests were conducted in air according to the test methods in Section 1.4.2.1. Direct induction heating was used for testing at elevated tempera-tures. Effects of Fiber Volume Fraction Tables of average tensile properties for the [0] orientation are given in Tables 3.8.2.1(a) through (d) for materials with various fiber volume fractions. In these and all subsequent Tables, the term “lot” refers to one plate of material. Tensile properties and pedigree information for each specimen are presented in the Raw Data Table in Appendix C. Average tensile properties for the [90] orientation are given in Tables 3.8.2.1(e) and (f) for three fiber volume fractions. Average tensile properties for cross-ply laminates with various fiber lay-ups are pre-sented in Table 3.8.2.1(g) through (n). The tensile properties and pedigree information for these tests are given in the Raw Data Table in Appendix C. There are three tests in the Raw Data Tables which have a “>” sign preceding the values for the failure strains. These tests were interrupted and unloaded at the strain value listed and, therefore, the real value for the failure strain is larger that those indicated in the Table. The ultimate tensile strength (UTS) is plotted in Figure 3.8.2.1(a) as a function of fiber volume percent and temperature for [0] and [90] laminates. The UTS increases with increasing fiber volume percent for the [0] laminate. There is little difference in the UTS between 75°F (24°C) and 800°F (427°C) for fiber volume percents greater than 25%. However, at a fiber volume percent of 15 there is a stronger depend-ence of the UTS on temperature, indicating the stronger influence of the matrix properties. In contrast to the [0] laminates, the UTS of the [90] laminates at 75°F (24°C) decreases with increasing fiber volume fraction.
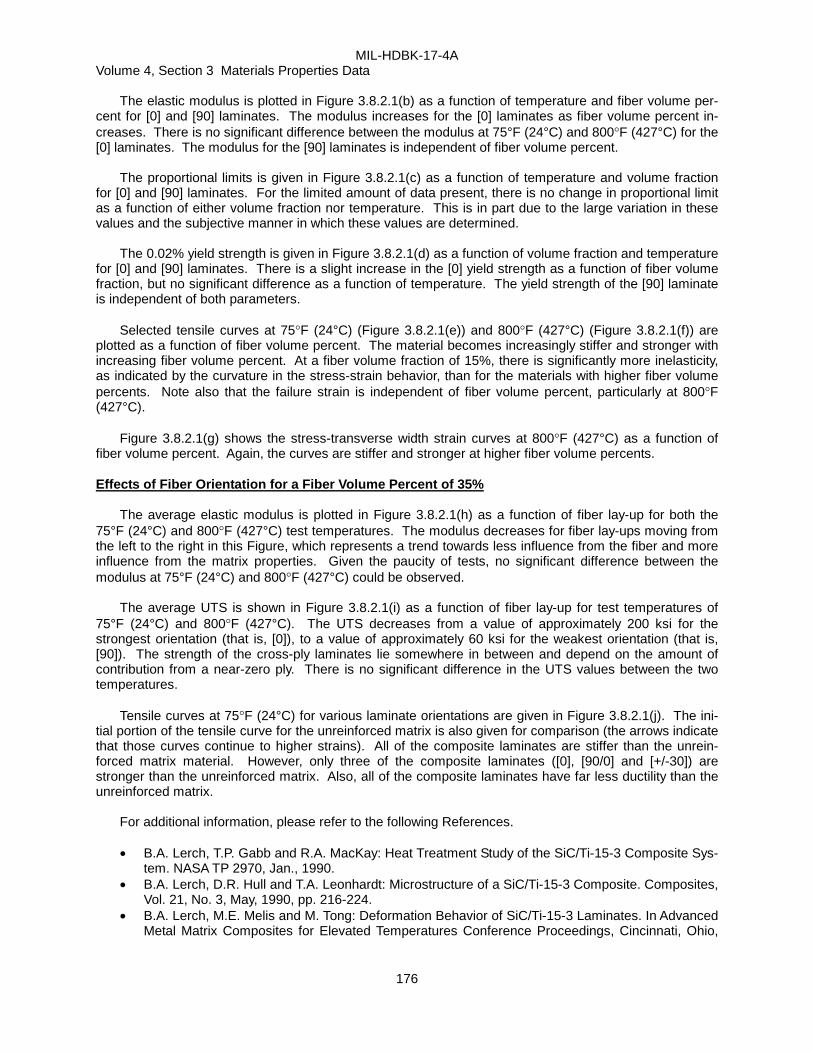
MIL-HDBK-17-4A Volume 4, Section 3 Materials Properties Data
176
The elastic modulus is plotted in Figure 3.8.2.1(b) as a function of temperature and fiber volume per-cent for [0] and [90] laminates. The modulus increases for the [0] laminates as fiber volume percent in-creases. There is no significant difference between the modulus at 75°F (24°C) and 800°F (427°C) for the [0] laminates. The modulus for the [90] laminates is independent of fiber volume percent. The proportional limits is given in Figure 3.8.2.1(c) as a function of temperature and volume fraction for [0] and [90] laminates. For the limited amount of data present, there is no change in proportional limit as a function of either volume fraction nor temperature. This is in part due to the large variation in these values and the subjective manner in which these values are determined. The 0.02% yield strength is given in Figure 3.8.2.1(d) as a function of volume fraction and temperature for [0] and [90] laminates. There is a slight increase in the [0] yield strength as a function of fiber volume fraction, but no significant difference as a function of temperature. The yield strength of the [90] laminate is independent of both parameters. Selected tensile curves at 75°F (24°C) (Figure 3.8.2.1(e)) and 800°F (427°C) (Figure 3.8.2.1(f)) are plotted as a function of fiber volume percent. The material becomes increasingly stiffer and stronger with increasing fiber volume percent. At a fiber volume fraction of 15%, there is significantly more inelasticity, as indicated by the curvature in the stress-strain behavior, than for the materials with higher fiber volume percents. Note also that the failure strain is independent of fiber volume percent, particularly at 800°F (427°C). Figure 3.8.2.1(g) shows the stress-transverse width strain curves at 800°F (427°C) as a function of fiber volume percent. Again, the curves are stiffer and stronger at higher fiber volume percents. Effects of Fiber Orientation for a Fiber Volume Percent of 35% The average elastic modulus is plotted in Figure 3.8.2.1(h) as a function of fiber lay-up for both the 75°F (24°C) and 800°F (427°C) test temperatures. The modulus decreases for fiber lay-ups moving from the left to the right in this Figure, which represents a trend towards less influence from the fiber and more influence from the matrix properties. Given the paucity of tests, no significant difference between the modulus at 75°F (24°C) and 800°F (427°C) could be observed. The average UTS is shown in Figure 3.8.2.1(i) as a function of fiber lay-up for test temperatures of 75°F (24°C) and 800°F (427°C). The UTS decreases from a value of approximately 200 ksi for the strongest orientation (that is, [0]), to a value of approximately 60 ksi for the weakest orientation (that is, [90]). The strength of the cross-ply laminates lie somewhere in between and depend on the amount of contribution from a near-zero ply. There is no significant difference in the UTS values between the two temperatures. Tensile curves at 75°F (24°C) for various laminate orientations are given in Figure 3.8.2.1(j). The ini-tial portion of the tensile curve for the unreinforced matrix is also given for comparison (the arrows indicate that those curves continue to higher strains). All of the composite laminates are stiffer than the unrein-forced matrix material. However, only three of the composite laminates ([0], [90/0] and [+/-30]) are stronger than the unreinforced matrix. Also, all of the composite laminates have far less ductility than the unreinforced matrix. For additional information, please refer to the following References.
• B.A. Lerch, T.P. Gabb and R.A. MacKay: Heat Treatment Study of the SiC/Ti-15-3 Composite Sys-tem. NASA TP 2970, Jan., 1990.
• B.A. Lerch, D.R. Hull and T.A. Leonhardt: Microstructure of a SiC/Ti-15-3 Composite. Composites, Vol. 21, No. 3, May, 1990, pp. 216-224.
• B.A. Lerch, M.E. Melis and M. Tong: Deformation Behavior of SiC/Ti-15-3 Laminates. In Advanced Metal Matrix Composites for Elevated Temperatures Conference Proceedings, Cincinnati, Ohio,

MIL-HDBK-17-4A Volume 4, Section 3 Materials Properties Data
177
October 20-24, 1991, ASM, Materials Park, Ohio, eds. M.N. Gungor, E.J. Lavernia and S.G. Fish-man, pp. 109-114.
• T.P. Gabb, J. Gayda, B.A. Lerch and G.R. Halford: The Effect of Matrix Mechanical Properties on [0]8 Unidirectional SiC/Ti Composite Fatigue Resistance. Scripta Met., Vol. 25, 1991, pp. 2879-2884.
• B.A. Lerch and J.F. Saltsman: Tensile Deformation of SiC/Ti-15-3 Laminates. Composite Materi-als: Fatigue and Fracture, Fourth Volume, ASTM STP 1156, eds. W.W. Stinchcomb and N.E. Ash-baugh, ASTM Philadelphia, 1993, pp. 161-175.
• S. Subramanian, B.A. Lerch, M.G. Castelli and D. Allen: Effect of Fiber Volume Fraction on Fully-Reversed Isothermal Fatigue Behavior of Unidirectional SCS6-Ti-15-3 Composites, Composites and Functionally Graded Materials, MD-Vol. 80, eds. T.S. Srivatsan, A. Zavaliangos, K.I. Jacob, N. Katsube, W. Jones, K. Ramani, S. Sitaraman and S. Yang, ASME, 1997, pp. 131-139.

MIL-HDBK-17-4A Volume 4, Section 3 Materials Properties Data
178
3.8.2.1.1 SCS-6/Ti-15V-3Cr-3Al-3Sn foil/fiber/foil* SiC/Ti MATERIAL: SCS-6/Ti-15V-3Cr-3Al-3Sn foil/fiber/foil SCS-6/Ti-15-3 Summary FIBER SCS-6, continuous, 145 µm MATRIX: Ti-15V-3Cr-3Sn-3Al MANUFACTURER: Textron PROCESS SEQUENCE: Hipped Foil/Fiber/Foil Preforms PROCESSING: SOURCE: NASA-GRC Date of fiber manufacture Date of testing 6/98-10/96
Date of matrix manufacture Date of data submittal 5/98
Date of composite manufacture Date of analysis 9/98
LAMINA PROPERTY SUMMARY
Temperature 75°F 800°F
Environment Air Air
Fiber v/o 15 35 41 15 25 35 41
[0] Tension, 1-axis
SS-SSSS SSSSSS- SS-SSS- SSSS-S- SSSS-S- SS-SSS- SSSS---
[90] Tension, 2-axis
SS-SSSS SSSSSSS SS-S--- SS-SSSS
Classes of data: F - Fully approved, S - Screening in order: Strength/Modulus/Poisson’s Ratio/Strain-to-failure/Proportional Limit/0.02-offset-strength/0.2-offset-strength. * Raw data tables in Appendix C4.1.

MIL-HDBK-17-4A Volume 4, Section 3 Materials Properties Data
179
Nominal As Submitted Test Method
Fiber Density (g/cm3) 3.0 3.0
Foil Matrix Density (g/cm3) 4.8
Composite Density (g/cm3)
Ply Thickness* (in)
* Fiber center to fiber center
LAMINATE PROPERTY SUMMARY
Temperature 75°F 800°F
Environment Air Air
Fiber v/o 35 35
[+/- 30] Tension, x-axis
SS-SSSS SS-SSSS
[+/- 45] Tension, x-axis
SS-SSSS SS-SSSS
[+/-60] Tension, x-axis
SS-SSSS SS-SSSS
[0/90] Tension, x-axis
SSSSSSS
Classes of data: F - Fully approved, S - Screening in order: Strength/Modulus/Poisson’s Ratio/Strain-to-failure/Proportional Limit/0.02-offset-strength/0.2-offset-strength.
MIL-HDBK-17-4A Volume 4, Section 3 Materials Properties Data
180
MATERIAL: SCS-6/Ti-15V-3Cr-3Al-3Sn foil/fiber/foil Table 3.8.2.1.1(a) SiC/Ti Foil/fiber/foil MACHINING: EDM FIBER VOLUME: 15-41 % SCS-6/Ti-15-3 FIBER SPACING: -- Tension, 1-axis [0]8 SPECIMEN THICKNESS: 0.06-0.12 in. MODULUS Least squares analysis 75, Air CALCULATION: up to proportional limit Screening
TEST METHOD: Sec. 1.4.2.1 PRE-TEST EXPOSURE: Vac. 1292°F, 24 hrs. SOURCE: NASA-GRC NORMALIZED BY: Not normalized Temperature (°F) 75 75 75 Environment Air Air Air Fiber Volume (%) 15 35 41 Strain Rate (1/s) 1·10-4 1·10-4 1·10-4 Mean 185 200 227 Minimum 168 201 Maximum 217 252 C.V.(%) 7.16 B-value (2)
Ftu1 Distribution Normal
(ksi) C1 200 C2 14.3
No. Specimens 1 9 2 No. Lots 1 2 1 Approval Class Screening Screening Screening Mean 20 26.6 31 Minimum 25.0 31 Maximum 29.0 31
Et1 C.V.(%) 5.66
(Msi) No. Specimens 1 8 2
No. Lots 1 2 1 Approval Class Screening Screening Screening Mean 0.28
ν12t No. Specimens 1
No. Lots 1 Approval Class Screening Mean 1.21 0.84 0.82 Minimum 0.66 0.73 Maximum 1 0.9
C.V.(%) 14
B-value (1) ε1
tu Distribution Normal
(%) C1 0.84 C2 0.12
No. Specimens 1 9 2
No. Lots 1 2 1 Approval Class Screening Screening Screening (1) B-basis values appear for fully approved data only.

MIL-HDBK-17-4A Volume 4, Section 3 Materials Properties Data
181
MATERIAL: SCS-6/Ti-15V-3Cr-3Al-3Sn foil/fiber/foil Table 3.8.2.1.1(b) SiC/Ti Foil/fiber/foil MACHINING: EDM/water jet/diamond grind FIBER VOLUME: 15-41 % SCS-6/Ti-15-3 FIBER SPACING: -- Tension, 1-axis [0]8
(1) SPECIMEN THICKNESS: 0.06-0.12 in. MODULUS Least squares analysis 800, Air CALCULATION: up to proportional limit Screening
TEST METHOD: Sec. 1.4.2.1 PRE-TEST EXPOSURE: Vac. 1292°F, 24 hrs. SOURCE: NASA-GRC NORMALIZED BY: Not normalized Temperature (°F) 800 800 800 800 800 800 Environment Air Air Air Air Air Air Fiber Volume (%) 15 25 35 35 35 41 Strain Rate (1/s) 1·10-3 1·10-3 1·10-5 1·10-4 1·10-3 1·10-3 Mean 137 195 198 200 226 248 Minimum 136 192 201 245 Maximum 138 197 252 251 C.V.(%) B-value
Ftu1 Distribution
(ksi) C1 C2
No. Specimens 2 2 1 1 4 2 No. Lots 1 1 1 1 1 1 Approval Class Screening Screening Screening Screening Screening Screening Mean 19 24 29 32 27 31 Minimum 19 24 26 30 Maximum 19 24 29 32
Et1 C.V.(%)
(Msi) No. Specimens 2 2 1 1 4 2
No. Lots 1 1 1 1 1 1 Approval Class Screening Screening Screening Screening Screening Screening Mean 0.38 0.32 0.3
ν12t No. Specimens 2 2 2
No. Lots 1 1 1 Approval Class Screening Screening Screening Mean 0.81 0.90 0.82 0.77 0.95 0.84 Minimum 0.75 0.88 0.84 0.83 Maximum 0.86 0.91 1.06 0.84
C.V.(%)
B-value ε1
tu Distribution
(%) C1 C2
No. Specimens 2 2 1 1 4 2
No. Lots 1 1 1 1 1 1 Approval Class Screening Screening Screening Screening Screening Screening (1) Also contains data from 32-ply material. (2) B-basis values appear for fully approved data only.

MIL-HDBK-17-4A Volume 4, Section 3 Materials Properties Data
182
MATERIAL: SCS-6/Ti-15V-3Cr-3Al-3Sn foil/fiber/foil Table 3.8.2.1.1(c) SiC/Ti Foil/fiber/foil MACHINING: EDM FIBER VOLUME: 15-41 % SCS-6/Ti-15-3 FIBER SPACING: -- Tension, 1-axis [0]8 SPECIMEN THICKNESS: 0.06-0.12 in. MODULUS Least squares analysis 75, Air CALCULATION: up to proportional limit Screening
TEST METHOD: Sec. 1.4.2.1 PRE-TEST EXPOSURE: Vac. 1292°F, 24 hrs. SOURCE: NASA-GRC NORMALIZED BY: Not normalized Temperature (°F) 75 75 75 Environment Air Air Air Fiber Volume (%) 15 35 41 Strain Rate (1/s) 1·10-4 1·10-4 1·10-4 Mean 123 116 140 Minimum 33 128 Maximum 150 151 C.V.(%) 31.9 B-value (1)
Fpl1 Distribution ANOVA
(ksi) C1 36.6 C2 2.45
No. Specimens 1 9 2 No. Lots 1 2 1 Approval Class Screening Screening Screening Mean 141 145 176 Minimum 82 160 Maximum 186 192
C.V.(%) 25.8 B-value (1)
Fty1
0 02. Distribution ANOVA
(ksi) C1 40.6 C2 6.35
No. Specimens 1 9 2 No. Lots 1 2 1 Approval Class Screening Screening Screening Mean 172 Minimum Maximum
C.V.(%)
B-value
Fty1
0.2 Distribution
(ksi) C1 C2
No. Specimens 1
No. Lots 1 Approval Class Screening (1) B-basis values appear for fully approved data only.

MIL-HDBK-17-4A Volume 4, Section 3 Materials Properties Data
183
MATERIAL: SCS-6/Ti-15V-3Cr-3Al-3Sn foil/fiber/foil Table 3.8.2.1.1(d) SiC/Ti Foil/fiber/foil MACHINING: EDM/water jet/diamond grind FIBER VOLUME: 15-41 % SCS-6/Ti-15-3 FIBER SPACING: -- Tension, 1-axis [0]8
(1) SPECIMEN THICKNESS: 0.06-0.12 in. MODULUS Least squares analysis 800, Air CALCULATION: up to proportional limit Screening
TEST METHOD: Sec. 1.4.2.1 PRE-TEST EXPOSURE: Vac. 1292°F, 24 hrs. SOURCE: NASA-GRC NORMALIZED BY: Not normalized Temperature (°F) 800 800 800 800 800 800 Environment Air Air Air Air Air Air Fiber Volume (%) 15 25 35 35 35 41 Strain Rate (1/s) 1·10-3 1·10-3 1·10-5 1·10-4 1·10-3 1·10-3 Mean 24 17 91 Minimum 31 Maximum 151 C.V.(%) B-value
Fpl1 Distribution
(ksi) C1 C2
No. Specimens 1 1 2 No. Lots 1 1 1 Approval Class Screening Screening Screening Mean 116 158 90 42 175 200 Minimum 115 151 147 187 Maximum 116 164 187 212
C.V.(%) B-value
Fty1
0 02. Distribution
(ksi) C1 C2
No. Specimens 2 2 1 1 4 2 No. Lots 1 1 1 1 1 1 Approval Class Screening Screening Screening Screening Screening Screening Mean Minimum Maximum
C.V.(%)
B-value
Fty1
0.2 Distribution
(ksi) C1 C2
No. Specimens
No. Lots Approval Class (1) Also contains data from 32-ply material.

MIL-HDBK-17-4A Volume 4, Section 3 Materials Properties Data
184
MATERIAL: SCS-6/Ti-15V-3Cr-3Al-3Sn foil/fiber/foil Table 3.8.2.1.1(e) SiC/Ti Foil/fiber/foil MACHINING: EDM FIBER VOLUME: 15-41 % SCS-6/Ti-15-3 FIBER SPACING: -- Tension, 2-axis [90]8 SPECIMEN THICKNESS: 0.06-0.12 in. MODULUS Least squares analysis 75, 800, Air CALCULATION: up to proportional limit Screening
TEST METHOD: Sec. 1.4.2.1 PRE-TEST EXPOSURE: Vac. 1292°F, 24 hrs. SOURCE: NASA-GRC NORMALIZED BY: Not normalized Temperature (°F) 75 75 75 800 800 Environment Air Air Air Air Air Fiber Volume (%) 15 35 41 35 35 Strain Rate (1/s) 1·10-4 1·10-4 1·10-4 1·10-5 1·10-4 Mean 96 61 28 41 42 Minimum 59 23 Maximum 62 33 C.V.(%) B-value
Ftu2 Distribution
(ksi) C1 C2
No. Specimens 1 2 2 1 1 No. Lots 1 1 1 1 1 Approval Class Screening Screening Screening Screening Screening Mean 18 18 18 17 17 Minimum 17 18 Maximum 19 18
Et2 C.V.(%)
(Msi) No. Specimens 1 2 2 1 1
No. Lots 1 1 1 1 1 Approval Class Screening Screening Screening Screening Screening Mean 0.18
t23ν No. Specimens 2
No. Lots 1 Approval Class Screening Mean 1.91 1.41 0.16 0.99 0.71 Minimum 1.38 0.12 Maximum 1.43 0.19
C.V.(%)
B-value ε 2
tu Distribution
(%) C1 C2
No. Specimens 1 2 2 1 1
No. Lots 1 1 1 1 1 Approval Class Screening Screening Screening Screening Screening

MIL-HDBK-17-4A Volume 4, Section 3 Materials Properties Data
185
MATERIAL: SCS-6/Ti-15V-3Cr-3Al-3Sn foil/fiber/foil Table 3.8.2.1.1(f) SiC/Ti Foil/fiber/foil MACHINING: EDM FIBER VOLUME: 15-41 % SCS-6/Ti-15-3 FIBER SPACING: -- Tension, 2-axis [90]8 SPECIMEN THICKNESS: 0.06-0.12 in. MODULUS Least squares analysis 75, 800, Air CALCULATION: up to proportional limit Screening
TEST METHOD: Sec. 1.4.2.1 PRE-TEST EXPOSURE: Vac. 1292°F, 24 hrs. SOURCE: NASA-GRC NORMALIZED BY: Not normalized Temperature (°F) 75 75 75 800 800 Environment Air Air Air Air Air Fiber Volume (%) 15 35 41 35 35 Strain Rate (1/s) 1·10-4 1·10-4 1·10-4 1·10-5 1·10-4 Mean 42 16 15 16 Minimum 15 Maximum 17 C.V.(%) B-value
pl2F Distribution
(ksi) C1 C2
No. Specimens 2 2 1 1 No. Lots 1 1 1 1 Approval Class Screening Screening Screening Screening Mean 44 39 22 25 Minimum 38 Maximum 40
C.V.(%) B-value
Fty2
0 02. Distribution
(ksi) C1 C2
No. Specimens 1 2 1 1 No. Lots 1 1 1 1 Approval Class Screening Screening Screening Screening Mean 75 49.5 30 34 Minimum 49 Maximum 50
C.V.(%)
B-value
Fty2
0.2 Distribution
(ksi) C1 C2
No. Specimens 1 2 1 1
No. Lots 1 1 1 1 Approval Class Screening Screening Screening Screening

MIL-HDBK-17-4A Volume 4, Section 3 Materials Properties Data
186
MATERIAL: SCS-6/Ti-15V-3Cr-3Al-3Sn foil/fiber/foil Table 3.8.2.1.1(g) SiC/Ti Foil/fiber/foil MACHINING: EDM/diamond grind FIBER VOLUME: 35 % SCS-6/Ti-15-3 FIBER SPACING: -- Tension, x-axis [+/-30]2s
(1) SPECIMEN THICKNESS: 0.08 in. MODULUS Least squares analysis 75, 800, Air CALCULATION: up to proportional limit Screening
TEST METHOD: Sec. 1.4.2.1 PRE-TEST EXPOSURE: Vac. 1292°F, 24 hrs. SOURCE: NASA-GRC NORMALIZED BY: Not normalized Temperature (°F) 75 800 Environment Air Air Fiber Volume (%) 35 35 Strain Rate (1/s) 1·10-4 1·10-3 Mean 148 134 Minimum 133 Maximum 179 C.V.(%) 8.16 B-value (2)
Fxtu Distribution ANOVA
(ksi) C1 24.6 C2 19.8
No. Specimens 10 1 No. Lots 2 1 Approval Class Screening Screening Mean 22.2 20 Minimum 20.0 Maximum 24.0
Ext C.V.(%) 5.64
(Msi) No. Specimens 11 1
No. Lots 2 1 Approval Class Screening Screening Mean
ν xyt No. Specimens
No. Lots Approval Class Mean 1.24 1.52 Minimum 0.99 Maximum 1.66
C.V.(%) 17.0
B-value (2) ε x
tu Distribution ANOVA
(%) C1 0.35 C2 17.6
No. Specimens 9 1
No. Lots 2 1 Approval Class Screening Screening (1) Also contains data from 32-ply material. (2) B-basis values appear for fully approved data only.
MIL-HDBK-17-4A Volume 4, Section 3 Materials Properties Data
187
MATERIAL: SCS-6/Ti-15V-3Cr-3Al-3Sn foil/fiber/foil Table 3.8.2.1.1(h) SiC/Ti Foil/fiber/foil MACHINING: EDM/diamond grind FIBER VOLUME: 35 % SCS-6/Ti-15-3 FIBER SPACING: -- Tension, x-axis [+/-30]2s
(1) SPECIMEN THICKNESS: 0.08 in. MODULUS Least squares analysis 75, 800, Air CALCULATION: up to proportional limit Screening
TEST METHOD: Sec. 1.4.2.1 PRE-TEST EXPOSURE: Vac. 1292°F, 24 hrs. SOURCE: NASA-GRC NORMALIZED BY: Not normalized Temperature (°F) 75 800 Environment Air Air Fiber Volume (%) 35 35 Strain Rate (1/s) 1·10-4 1·10-3 Mean 55.3 40 Minimum 33 Maximum 67 C.V.(%) 19.1 B-value (2)
plxF Distribution Weibull
(ksi) C1 59.3 C2 7.3
No. Specimens 11 1 No. Lots 2 1 Approval Class Screening Screening Mean 69.1 50 Minimum 26 Maximum 97
C.V.(%) 25.7 B-value (2) Fx
ty0 02. Distribution Weibull
(ksi) C1 75.1 C2 5.0
No. Specimens 11 1 No. Lots 2 1 Approval Class Screening Screening Mean 112 86 Minimum 91 Maximum 146
C.V.(%) 12.8
B-value (2) Fx
ty0.2 Distribution Normal
(ksi) C1 112 C2 14.3
No. Specimens 11 1
No. Lots 2 1 Approval Class Screening Screening (1) Also contains data from 32-ply material. (2) B-basis values appear for fully approved data only.

MIL-HDBK-17-4A Volume 4, Section 3 Materials Properties Data
188
MATERIAL: SCS-6/Ti-15V-3Cr-3Al-3Sn foil/fiber/foil Table 3.8.2.1.1(i) SiC/Ti Foil/fiber/foil MACHINING: EDM FIBER VOLUME: 35 % SCS-6/Ti-15-3 FIBER SPACING: -- Tension, x-axis [+/-45]2s SPECIMEN THICKNESS: 0.08 in. MODULUS Least squares analysis 75, 800, Air CALCULATION: up to proportional limit Screening
TEST METHOD: Sec. 1.4.2.1 PRE-TEST EXPOSURE: Vac. 1292°F, 24 hrs. SOURCE: NASA-GRC NORMALIZED BY: Not normalized Temperature (°F) 75 800 800 Environment Air Air Air Fiber Volume (%) 35 35 35 Strain Rate (1/s) 1·10-4 1·10-5 1·10-4 Mean 77 64 68 Minimum Maximum C.V.(%) B-value
Fxtu Distribution
(ksi) C1 C2
No. Specimens 1 1 1 No. Lots 1 1 1 Approval Class Screening Screening Screening Mean 17 17 13 Minimum Maximum
Ext C.V.(%)
(Msi) No. Specimens 1 1 1
No. Lots 1 1 1 Approval Class Screening Screening Screening Mean
ν xyt No. Specimens
No. Lots Approval Class Mean >4 >4.6 7.29 Minimum Maximum
C.V.(%)
B-value ε x
tu Distribution
(%) C1 C2
No. Specimens 1 1 1
No. Lots 1 1 1 Approval Class Screening Screening Screening

MIL-HDBK-17-4A Volume 4, Section 3 Materials Properties Data
189
MATERIAL: SCS-6/Ti-15V-3Cr-3Al-3Sn foil/fiber/foil Table 3.8.2.1.1(j) SiC/Ti Foil/fiber/foil MACHINING: EDM FIBER VOLUME: 35 % SCS-6/Ti-15-3 FIBER SPACING: -- Tension, x-axis [+/-45]2s SPECIMEN THICKNESS: 0.08 in. MODULUS Least squares analysis 75, 800, Air CALCULATION: up to proportional limit Screening
TEST METHOD: Sec. 1.4.2.1 PRE-TEST EXPOSURE: Vac. 1292°F, 24 hrs. SOURCE: NASA-GRC NORMALIZED BY: Not normalized Temperature (°F) 75 800 800 Environment Air Air Air Fiber Volume (%) 35 35 35 Strain Rate (1/s) 1·10-4 1·10-5 1·10-4 Mean 30 28 21 Minimum Maximum C.V.(%) B-value
Fpl1 Distribution
(ksi) C1 C2
No. Specimens 1 1 1 No. Lots 1 1 1 Approval Class Screening Screening Screening Mean 40 30 35 Minimum Maximum
C.V.(%) B-value Fx
ty0 02. Distribution
(ksi) C1 C2
No. Specimens 1 1 1 No. Lots 1 1 1 Approval Class Screening Screening Screening Mean 52 29 47 Minimum Maximum
C.V.(%)
B-value Fx
ty0.2 Distribution
(ksi) C1 C2
No. Specimens 1 1 1
No. Lots 1 1 1 Approval Class Screening Screening Screening

MIL-HDBK-17-4A Volume 4, Section 3 Materials Properties Data
190
MATERIAL: SCS-6/Ti-15V-3Cr-3Al-3Sn foil/fiber/foil Table 3.8.2.1.1(k) SiC/Ti Foil/fiber/foil MACHINING: EDM FIBER VOLUME: 35 % SCS-6/Ti-15-3 FIBER SPACING: -- Tension, x-axis [+/-60]2s SPECIMEN THICKNESS: 0.08 in. MODULUS Least squares analysis 75, 800, Air CALCULATION: up to proportional limit Screening
TEST METHOD: Sec. 1.4.2.1 PRE-TEST EXPOSURE: Vac. 1292°F, 24 hrs. SOURCE: NASA-GRC NORMALIZED BY: Not normalized Temperature (°F) 75 800 Environment Air Air Fiber Volume (%) 35 35 Strain Rate (1/s) 1·10-4 1·10-4 Mean 57 48 Minimum Maximum C.V.(%) B-value
Fxtu Distribution
(ksi) C1 C2
No. Specimens 1 1 No. Lots 1 1 Approval Class Screening Screening Mean 17 14 Minimum Maximum
Ext C.V.(%)
(Msi) No. Specimens 1 1
No. Lots 1 1 Approval Class Screening Screening Mean
ν xyt No. Specimens
No. Lots Approval Class Mean 1.8 2.95 Minimum Maximum
C.V.(%)
B-value ε x
tu Distribution
(%) C1 C2
No. Specimens 1 1
No. Lots 1 1 Approval Class Screening Screening
MIL-HDBK-17-4A Volume 4, Section 3 Materials Properties Data
191
MATERIAL: SCS-6/Ti-15V-3Cr-3Al-3Sn foil/fiber/foil Table 3.8.2.1.1(l) SiC/Ti Foil/fiber/foil MACHINING: EDM FIBER VOLUME: 35 % SCS-6/Ti-15-3 FIBER SPACING: -- Tension, x-axis [+/-60]2s SPECIMEN THICKNESS: 0.08 in. MODULUS Least squares analysis 75, 800, Air CALCULATION: up to proportional limit Screening
TEST METHOD: Sec. 1.4.2.1 PRE-TEST EXPOSURE: Vac. 1292°F, 24 hrs. SOURCE: NASA-GRC NORMALIZED BY: Not normalized Temperature (°F) 75 800 Environment Air Air Fiber Volume (%) 35 35 Strain Rate (1/s) 1·10-4 1·10-4 Mean 36 26 Minimum Maximum C.V.(%) B-value
Fpl1 Distribution
(ksi) C1 C2
No. Specimens 1 1 No. Lots 1 1 Approval Class Screening Screening Mean 41 28 Minimum Maximum
C.V.(%) B-value Fx
ty0 02. Distribution
(ksi) C1 C2
No. Specimens 1 1 No. Lots 1 1 Approval Class Screening Screening Mean 50 35 Minimum Maximum
C.V.(%)
B-value Fx
ty0.2 Distribution
(ksi) C1 C2
No. Specimens 1 1
No. Lots 1 1 Approval Class Screening Screening

MIL-HDBK-17-4A Volume 4, Section 3 Materials Properties Data
192
MATERIAL: SCS-6/Ti-15V-3Cr-3Al-3Sn foil/fiber/foil Table 3.8.2.1.1(m) SiC/Ti Foil/fiber/foil MACHINING: EDM FIBER VOLUME: 35 % SCS-6/Ti-15-3 FIBER SPACING: -- Tension, x-axis [0/90](1) SPECIMEN THICKNESS: 0.08 in. MODULUS Least squares analysis 75, Air CALCULATION: up to proportional limit Screening
TEST METHOD: Sec. 1.4.2.1 PRE-TEST EXPOSURE: Vac. 1292°F, 24 hrs. SOURCE: NASA-GRC NORMALIZED BY: Not normalized Temperature (°F) 75 Environment Air Fiber Volume (%) 35 Strain Rate (1/s) 1·10-4 Mean 148 Minimum 143 Maximum 154 C.V.(%) B-value
Fxtu Distribution
(ksi) C1 C2
No. Specimens 4 No. Lots 1 Approval Class Screening Mean 21 Minimum 15 Maximum 25
Ext C.V.(%)
(Msi) No. Specimens 4
No. Lots 1 Approval Class Screening Mean 0.18
ν xyt No. Specimens 2
No. Lots 1 Approval Class Screening Mean 1.09 Minimum 1 Maximum 1.21
C.V.(%)
B-value ε x
tu Distribution
(%) C1 C2
No. Specimens 4
No. Lots 1 Approval Class Screening (1) Combined data from [0/90]2s and [90/0]2s.

MIL-HDBK-17-4A Volume 4, Section 3 Materials Properties Data
193
MATERIAL: SCS-6/Ti-15V-3Cr-3Al-3Sn foil/fiber/foil Table 3.8.2.1.1(n) SiC/Ti Foil/fiber/foil MACHINING: EDM FIBER VOLUME: 35 % SCS-6/Ti-15-3 FIBER SPACING: -- Tension, x-axis [0/90](1) SPECIMEN THICKNESS: 0.08 in. MODULUS Least squares analysis 75, Air CALCULATION: up to proportional limit Screening
TEST METHOD: Sec. 1.4.2.1 PRE-TEST EXPOSURE: Vac. 1292°F, 24 hrs. SOURCE: NASA-GRC NORMALIZED BY: Not normalized Temperature (°F) 75 Environment Air Fiber Volume (%) 35 Strain Rate (1/s) 1·10-4 Mean 33 Minimum 23 Maximum 47 C.V.(%) B-value
Fpl1 Distribution
(ksi) C1 C2
No. Specimens 4 No. Lots 1 Approval Class Screening Mean 58.8 Minimum 37 Maximum 80
C.V.(%) B-value Fx
ty0 02. Distribution
(ksi) C1 C2
No. Specimens 4 No. Lots 1 Approval Class Screening Mean 126 Minimum 115 Maximum 136
C.V.(%)
B-value Fx
ty0.2 Distribution
(ksi) C1 C2
No. Specimens 4
No. Lots 1 Approval Class Screening (1) Combined data from [0/90]2s and [90/0]2s.

MIL-HDBK-17-4A Volume 4, Section 3 Materials Properties Data
194
SCS-6/Ti-15-3
0
50
100
150
200
250
300
10 15 20 25 30 35 40 45
[0], 75 o F
[0], 800 oF
[90], 75 o F
[90 ], 800 oF
Ftu
(k
si)
Fiber Volume Percent
FIGURE 3.8.2.1.1(a) Ultimate tensile strength as a function of fiber volume and temperature.
15
20
25
30
35
10 15 20 25 30 35 40 45
[0], 75 oF
[0], 800 oF
[90], 75o F
[90], 800 oF
Et (
Ms
i)
Fiber Volume Percent
FIGURE 3.8.2.1.1(b) Tensile modulus as a function of fiber volume and temperature.

MIL-HDBK-17-4A Volume 4, Section 3 Materials Properties Data
195
SCS-6/Ti-15-3
0
20
40
60
80
100
120
140
160
10 15 20 25 30 35 40 45
[0], 75 oF
[0], 800 oF
[90], 75 oF
[90], 800 oF
Fp
l (k
si)
Fiber Volume Percent
FIGURE 3.8.2.1.1(c) Proportional limit as a function of fiber volume and temperature.
0
50
100
150
200
250
10 15 20 25 30 35 40 45
[0], 75 oF
[0], 800 oF
[90], 75 oF
[90], 800 oF
Fty
0.02
(k
si)
Fiber Volum e Percent
FIGURE 3.8.2.1.1(d) 0.02-offset-strength as a function of fiber volume and temperature.

MIL-HDBK-17-4A Volume 4, Section 3 Materials Properties Data
196
SCS-6/Ti-15-3
0
50
1 00
1 50
2 00
2 50
3 00
0 0.0 02 0.004 0.006 0.0 08 0.01 0.012 0.014
Str
es
s (
ks
i)
Strain
4 1 Vf
35 Vf
15 Vf
FIGURE 3.8.2.1.1(e) Typical tensile behavior of [0]8 laminae at 75°F (24°C) as a function of fiber volume percent (Vf) at a strain rate of 1*10-4s-1.
0
50
1 00
1 50
2 00
2 50
0 0.002 0.004 0.006 0.0 08 0.01
Str
es
s (
ks
i)
Strain
41 Vf
35 Vf
25 Vf
15 Vf
FIGURE 3.8.2.1.1(f) Typical tensile behavior of [0]8 laminae at 800°F (427°C) as a function of fiber volume percent (Vf) at a strain rate of 1*10-3s-1.
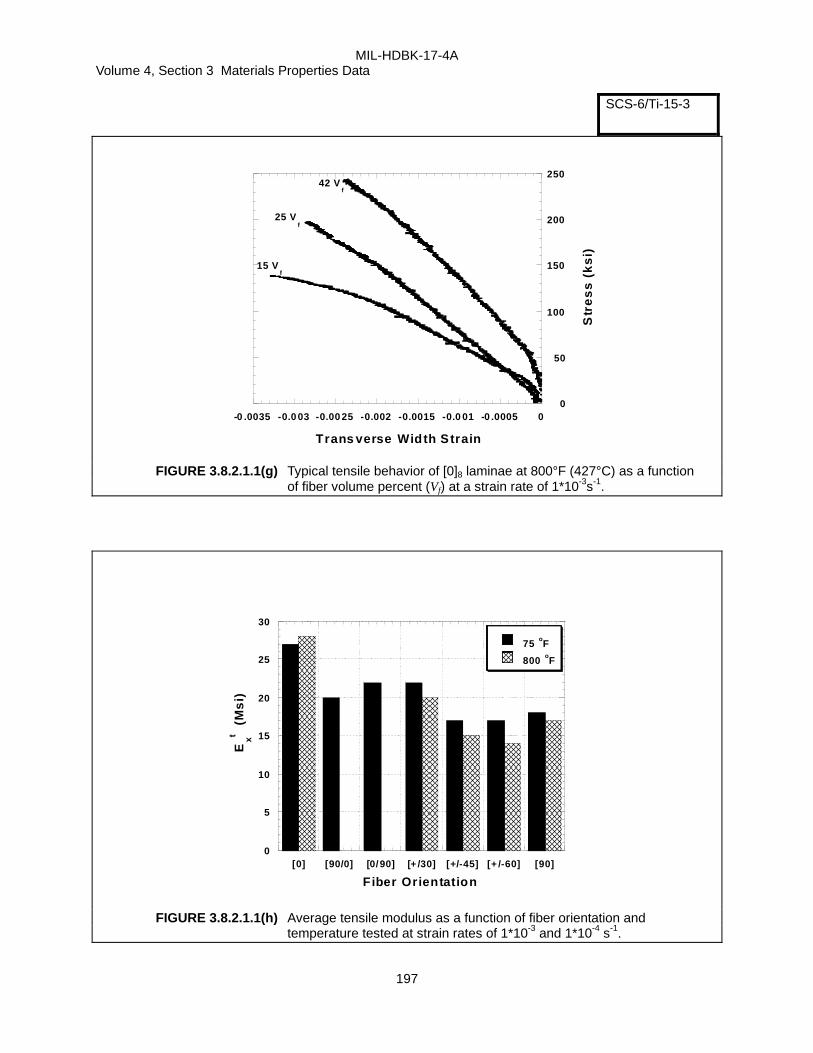
MIL-HDBK-17-4A Volume 4, Section 3 Materials Properties Data
197
SCS-6/Ti-15-3
0
50
100
150
200
250
-0 .0035 -0.0 03 -0.00 25 -0.002 -0.0015 -0.0 01 -0 .0005 0
Str
es
s (
ks
i)
Trans verse Width Strain
42 Vf
25 Vf
15 Vf
FIGURE 3.8.2.1.1(g) Typical tensile behavior of [0]8 laminae at 800°F (427°C) as a function of fiber volume percent (Vf) at a strain rate of 1*10-3s-1.
0
5
10
15
20
25
30
[0] [90/0] [0/90] [+ /30] [+/-45] [+ /-60] [90]
75 oF
800 oF
Ext
(Ms
i)
F iber Orientation
FIGURE 3.8.2.1.1(h) Average tensile modulus as a function of fiber orientation and temperature tested at strain rates of 1*10-3 and 1*10-4 s-1.
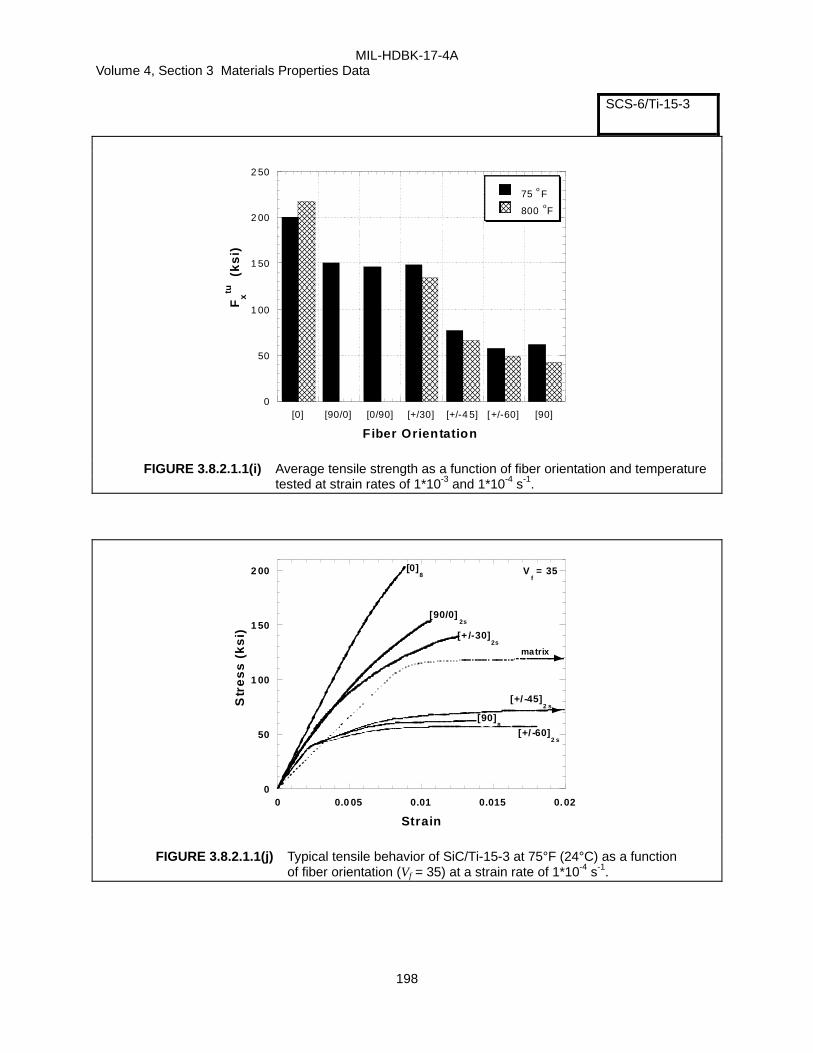
MIL-HDBK-17-4A Volume 4, Section 3 Materials Properties Data
198
SCS-6/Ti-15-3
0
50
1 00
1 50
2 00
2 50
[0] [90/0] [0/90] [+/30] [+/-4 5] [+/-60] [90]
75 oF
800 oF
Fx
tu
(ks
i)
F iber Orientation
FIGURE 3.8.2.1.1(i) Average tensile strength as a function of fiber orientation and temperature tested at strain rates of 1*10-3 and 1*10-4 s-1.
0
50
1 00
1 50
2 00
0 0.0 05 0.01 0.015 0.02
Str
es
s (
ks
i)
Strain
[0]8
[90/0]2s
matrix
[+/ -45]2 s
[90]8
[+/ -60]2 s
[+ /-30]2s
Vf = 35
FIGURE 3.8.2.1.1(j) Typical tensile behavior of SiC/Ti-15-3 at 75°F (24°C) as a function of fiber orientation (Vf = 35) at a strain rate of 1*10-4 s-1.

MIL-HDBK-17-4A Volume 4, Section 3 Materials Properties Data
199
3.8.2.1.2 SiC/Ti-15-3 Fatigue Composite plates were consolidated by Textron using the foil-fiber-foil method. The matrix foils were of the alloy Ti-15V-3Cr-3Al-3Sn (Ti-15-3) and the reinforcement was the SCS-6 fibers. Plates were either 8 or 32-ply thick and had dimensions of either 12” x 12” or 10” x 14”. All fiber mats used in these plates were woven with metallic ribbons. The type of ribbon used (Ti, Mo, or Ti-Nb) depended on the manufacturing year. Low cycle fatigue (LCF) specimens were cut from the plates and prepared according to Section 1.3.2.4. All specimens were heat treated in vacuum for 24 h at 1292°F (700°C). Fatigue testing was per-formed mostly in air according to the test methods in Section 1.4.2.4. A few tests were conducted in vac-uum to examine environmental effects. Direct induction heat was used for the tests at elevated tempera-tures. HIPed foils of the Ti-15-3 were consolidated into thick plates of the neat matrix. Cylindrical dogbone shaped samples were turned out of the plate and given the same heat treatment as the composite. This material was used to compare to the composite data. Effect of Mean Stress Fatigue of unidirectional [0]n composites is shown in Figure 3.8.2.1.2(a) as a function of mean stress. These tests were conducted in load control. A variety of mean stress conditions were used ranging from Rσ = -1 (fully-reversed) to Rσ = 0.7 (a high tensile mean stress). For the tests containing compressive loads, thicker, 32-ply composites were used to prevent buckling of the samples. Figure 3.8.2.1.2(a) shows that when plotted on a stress range basis, the higher the mean stress, the shorter the life. These data, in fact, can be best modeled using the Soderberg Mean Stress approach. It should be noted that under a tensile mean stress, the specimens ratchet to ever increasing tensile strains, similar to the behavior exhibited by monolithic metals. The ratcheting is more severe at higher tensile mean stresses. Fatigue data for strain-controlled tests is shown in Figure 3.8.2.1.2(b). On a strain range basis, the [0]n data for the fully-reversed situations have similar lives to those of the neat matrix. Note that the neat matrix rapidly relaxes to a fully-reversed stress state when cyclic mean strains are applied. Thus for a strain-controlled situation, the neat matrix shows no mean strain effect on life. The composite, however, does show a mean strain effect with lives being reduced at higher tensile mean strains. This Figure, 3.8.2.1.2(b), suggests that on a strain range basis, the composite never has a better LCF life than the neat matrix. That is to say that by adding the reinforcing fibers, the fatigue life of the matrix can only be reduced. This is especially true at low strain ranges where the neat matrix shows a fatigue limit, and the composite, at least down to the values of strain range shown in this Figure, does not exhibit a fatigue limit. However, there are advantages to adding fibers, such as increased strength, reduced den-sity, and toughening of the matrix. Effect of Fiber Architecture The fatigue curves of various laminates are plotted in Figure 3.8.2.1.2(c) for load-controlled tests hav-ing a tensile mean stress (Rσ = 0.05). There are data at both 75 and 800°F (427°C). On a stress range basis, the [0]n laminates are the strongest, i.e., have the longest fatigue life per given stress range. As the component of fiber in the 0-degree direction decreases, the fatigue resistance generally decreases. Therefore, the transverse, [90]n laminate has the poorest fatigue resistance. Temperature has a pronounced effect on fatigue life, particularly for laminates containing no 0-degree fibers, e.g., [±30]n. At higher temperatures these laminates have poorer fatigue resistance. This is proba-bly due to more matrix inelasticity, which leads to more load shedding to the fibers and continued strain ratcheting. Oxidation at elevated temperatures, particularly of the fiber/matrix interface, also reduces the

MIL-HDBK-17-4A Volume 4, Section 3 Materials Properties Data
200
fatigue life in laminates containing any ply orientation other than 0-degree, where cut fiber ends are ex-posed to the environment. One interesting observation from this Figure is that the [0/90]2s laminate has better fatigue resistance than the [90/0]2s laminate in spite of the fact that they were taken from the same plate of material and have identical tensile properties. The reason for this difference is that in both of these laminates, the fi-ber/matrix interface in the 90-degree plies debonds on the first load-up. In the [90/0]2s laminate, this puts additional loads onto the thin, outer matrix sheet, cracking it early in the life. The crack can easily propa-gate a good distance until it is retarded by the first 0-degree ply. For the [0/90]2s laminate, the cracks are nucleated later in life and are retarded at the first, outer row of fibers, which happen to be the 0-degree plies. Figure 3.8.2.1.2(d) shows fatigue curves for strain-controlled tests on both the composite and neat matrix. Similar to Figure 3.8.2.1.2(b), the matrix data represents the upper limit for fatigue life when plot-ted on a strain range basis. The fatigue lives of both the [0]n and the [±30]8s laminates are slightly less than those of the neat matrix. It can also be observed by comparing Figures 3.8.2.1.2(b) and (d) that composite data from all laminates (including those of different volume fractions in Figure 3.8.2.1.2(e)) condense into one fatigue curve if the data are plotted on a strain range basis and have the same strain ratio. Effect of Fiber Volume Fraction Strain-controlled, fully-reversed fatigue tests were conducted on [0]n laminates, but containing different fiber volume fractions. The tensile properties for these samples are given in Table 3.8.2.1.1(b) and (d), and vary greatly as a function of fiber loading. However, when plotted on a strain range basis, there is no difference in fatigue lives amongst the various fiber volume fractions. For additional information, please refer to the following References.
• B.A. Lerch: Fatigue Behavior of SiC/Ti-15-3 Laminates. HiTemp Review 1990, NASA Conference Publication 10051, pp. 35-1 - 35-9.
• T.P. Gabb, J. Gayda, B.A. Lerch and G.R. Halford: The Effect of Matrix Mechanical Properties on [0]8 Unidirectional SiC/Ti Composite Fatigue Resistance. Scripta Met., Vol. 25, 1991, pp. 2879-2884.
• B.A. Lerch and G.R. Halford: Fully-Reversed Fatigue of a Ti-MMC. Proceedings of the 17th Con-ference on Metal Matrix, Carbon, and Ceramic Matrix Composites, Part I; Cocoa Beach, FL, Jan. 1993, NASA CP 3235, May 1994, pp. 177-191.
• B. Lerch and G. Halford: Effects of Control Mode and R-ratio on the Fatigue Behaviour of a Metal Matrix Composite. Materials Science and Engineering, A200, 1995, pp. 47-54.
• B. Lerch and G. Halford: Fatigue Mean Stress Modeling in a [0]32 Titanium Matrix Composite. HiTemp Review 1995 Advanced High Temperature Engine Materials Technology Program, Volume II: Compressor/Turbine Materials - Metals and MMC's, NASA Conf. Proc. 10178, 1995, paper 21.
• B.A. Lerch, M.J. Verrilli and G.R. Halford: Fully-Reversed Fatigue of a Ti-MMC. Proceedings of the American Society for Composites, Eighth Technical Conference, Technomic Publishing Com-pany, Lancaster, Pa., 1993, pp. 388-396.
• S. Subramanian, B.A. Lerch, M.G. Castelli and D. Allen: Effect of Fiber Volume Fraction on Fully-Reversed Isothermal Fatigue Behavior of Unidirectional SCS6-Ti-15-3 Composites, Composites and Functionally Graded Materials, MD-Vol. 80, eds. T.S. Srivatsan, A. Zavaliangos, K.I. Jacob, N. Katsube, W. Jones, K. Ramani, S. Sitaraman and S. Yang, ASME, 1997, pp. 131-139.
• B.S. Majumdar and B.A. Lerch: Fatigue Mechanisms in a Ti-Based Fiber-Reinforced MMC and Approaches to Life Prediction, Proceedings of the Air Force Workshop on Titanium Matrix Com-posites, eds. P.R. Smith and W. Revelos, AF Technical Report No. WL-TR-93-4105, 1993, pp 409-426.

MIL-HDBK-17-4A Volume 4, Section 3 Materials Properties Data
201
SiC/Ti-15-3 Vf = 0.35
20
50
100
200
500
1000R = -1.0R = -0.6R = -0.3R = 0.05R = 0.3R = 0.5R = 0.7Terminated
103 104 105 106102
Cycles to Failure, Nf
R= -1.0
R = 0.05
R = -0.3
R = 0.5
Stre
ss R
ange
, ∆σ,
(ksi
)
[0]n
FIGURE 3.8.2.1.2(a) Load-controlled fatigue data for [0]n at 800°F (427°C).
Correlative Information for Figure 3.8.2.1.2(a) Data Source Fatigue Table C4.1(d) Static Tension Table 3.8.2.1 b and d No. of Lots 3 No. of Plies 8,32 Test Parameters Frequency (Hz) 0.04 - 0.17 Waveform Triangular Temperature (F) 800 Atmosphere Air Load Ratio (Rσ) -1, -0.6, -0.3, 0.05, 0.3, 0.5, 0.7
Rσ = 0.05 (8 and 32-ply) Log Nf = 21.7 – 8.17 log (∆σ) Std. Dev. of Log (Nf) = 0.25 R2 = 88%, Sample Size = 11
Rσ = 0.5 (32-ply) Log Nf = 35.6 – 16.4 Log (∆σ) Std. Dev. of Log (Nf) = 8.46(1/∆σ) R2 = 91%, Sample Size = 4
Stress Life Equations
Rσ = -1 (32-ply) Log Nf = 15.6 – 4.85 Log (∆σ) Std. Dev. of log (Nf) = 0.023 R2 = 100%, Sample Size 3
Rσ= -0.3 (32-ply) Log Nf = 16.8 – 5.63 Log (∆σ) Std. Dev. of log (Nf) = 0.084 R2 = 94%, Sample Size = 3

MIL-HDBK-17-4A Volume 4, Section 3 Materials Properties Data
202
SiC/Ti-15-3 Vf = 0.35
0.2
0.5
1
2
5
10
103 104 105 106102
Cycles to Failure, Nf
Stra
in R
ange
, ∆ε,
(%)
Matrix, R = -1.0Matrix, R = 0.05[0]n, R = -1.0[0]n, R = 0.05Terminated
Matrix
[0]n, R = -1.0[0]n, R = 0.05
FIGURE 3.8.2.1.2(b) Strain-controlled fatigue data for [0]n at 800°F (427°C).
Correlative Information for Figure 3.8.2.1.2(b)
Composite Matrix Data Source Fatigue Table C4.1(d) Table B4.1(b) Static Tension Table 3.8.2.1 b, d Table 3.3.5.1 a,b,d,e No. of Lots 3 1 No. of Plies 8,32 Test Parameters Strain Rate (1/s) 1 x 10⁻³ 1 x 10⁻³ Waveform Triangular Triangular Temperature (F) 800 75, 400, 800 Atmosphere Air Air Strain Ratio (Rε) -1.0, 0.05 -1.0, 0.05
Rε = -1.0 (8 and 32 ply pooled) Log Nf = 3.97 – 4.39 Log (∆ε) Std. Dev. of log (Nf) = 0.12 R2 = 97%, No. of Samples = 17
Rε = -1.0 and 0.05 Pooled(1) Log Nf = 4.04 – 4.60 Log (∆ε) Std. Dev. of Log (Nf) = 0.217 (1/∆ε) R2 = 83%, No. of Samples = 12
Strain-Life Equations
Rε = 0.05, (32 ply) Log Nf = 3.05 – 5.6 Log (∆ε) Std. Dev. of log (Nf) = 0.15 R2 = 87%, No. of Samples = 8
(1) Also pools 75, 400, and 800°F Data

MIL-HDBK-17-4A Volume 4, Section 3 Materials Properties Data
203
SiC/Ti-15-3 Vf = 0.35
20
50
100
200
500
1000[90]8 75 F[90/0]2S 75 F[0/90]2S 75 F[–45]2S 800 F[–30]2S 75 F[–30]8S 800 F[0]n 75 & 800 FTerminated
103 104 105 106102
Cycles to Failure, Nf
Stre
ss R
ange
, ∆σ,
(ksi
)
[90/0]2S
[0/90]2S[–45]2S
[–30]2S 75 F[–30]8S 800 F
[0]n
FIGURE 3.8.2.1.2(c) Load-Controlled fatigue data at R = 0.05 for laminates.
Correlative Information for Figure 3.8.2.1.2(c) Data Source Fatigue Table C4.1(d) Static Tension Table 3.8.2.1 a-j,m,n No. of Lots [0]n - 3
[±30]8s – 1 ; [±30]2s – 2 [0/90]2s and [90/0]2s - 1 [±45]2s - 1
No. of Plies 8,32 Test Parameters Frequency (Hz) 0.07 - 0.19 Waveform Triangular Temperature (F) 75, 800 Atmosphere Air Load Ratio (Rσ) 0.05
[90/0]2S, Temp = 75°F Log Nf = 12.8 – 4.71 log (∆σ) Std. Dev. of Log (Nf) = 0.47(1/∆σ) R2 = 98%, Sample Size = 4
[0/90]2S, Temp = 75°F Log Nf = 13.2 – 4.79 Log (∆σ) Std. Dev. of Log (Nf) = 0.17 R2 = 91%, Sample Size = 4
Stress Life Equations
[±45]2S, Temp = 800°F Log Nf = 15.2 – 7.16 Log (∆σ) Std. Dev. of log (Nf) = 5.5(1/∆σ) R2 = 86%, Sample Size 7
[±30]2S, Temp = 75°F Log Nf = 12.8 – 4.43 Log (∆σ) Std. Dev. of log (Nf) = 0.23 R2 = 81%, Sample Size = 9
[±30]8S, Temp = 800°F Log Nf = 16.6 – 7.29 Log (∆σ) Std. Dev. of log (Nf) = 2.2(1/∆σ) R2 = 97%, Sample Size 5
[0]n, Temp = 800 & 75°F Pooled Log Nf = 21.4 – 8.01 Log (∆σ) Std. Dev. of log (Nf) = 0.25 R2 = 86%, Sample Size = 13
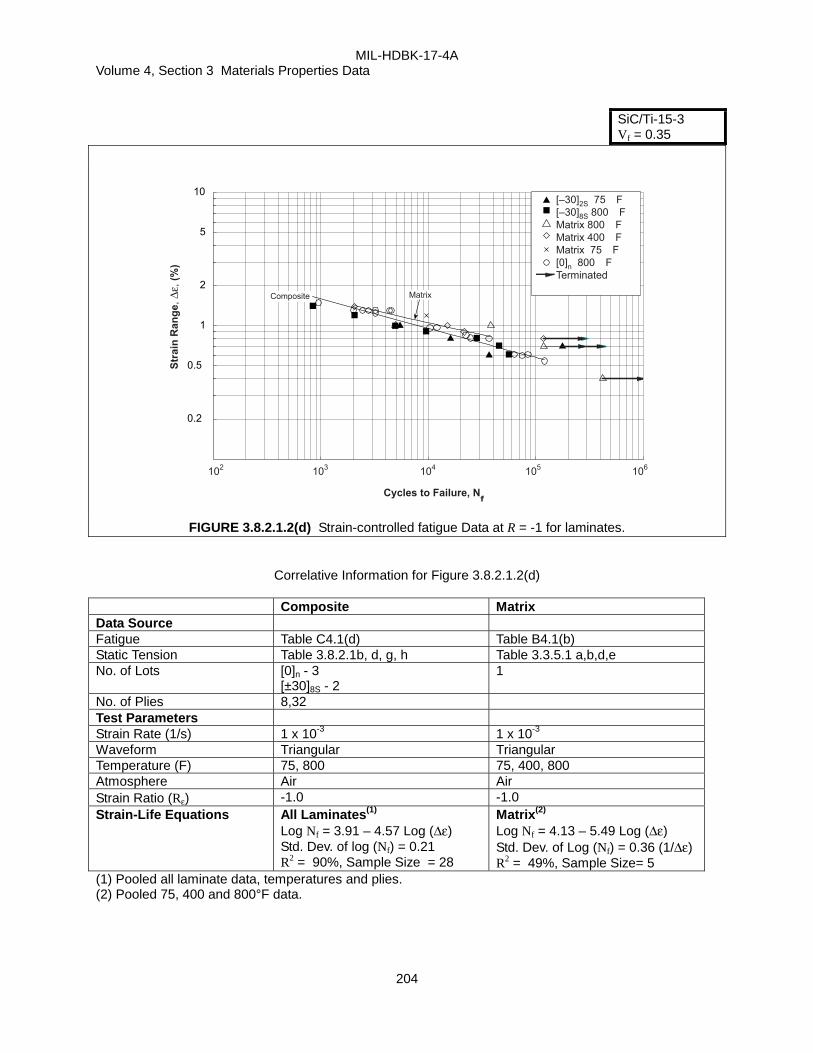
MIL-HDBK-17-4A Volume 4, Section 3 Materials Properties Data
204
SiC/Ti-15-3 Vf = 0.35
0.2
0.5
1
2
5
10
103 104 105 106102
Cycles to Failure, Nf
Stra
in R
ange
, ∆ε,
(%)
[–30]2S 75 F[–30]8S 800 FMatrix 800 FMatrix 400 FMatrix 75 F[0]n 800 FTerminated
MatrixComposite
FIGURE 3.8.2.1.2(d) Strain-controlled fatigue Data at R = -1 for laminates.
Correlative Information for Figure 3.8.2.1.2(d)
Composite Matrix Data Source Fatigue Table C4.1(d) Table B4.1(b) Static Tension Table 3.8.2.1b, d, g, h Table 3.3.5.1 a,b,d,e No. of Lots [0]n - 3
[±30]8S - 2 1
No. of Plies 8,32 Test Parameters Strain Rate (1/s) 1 x 10⁻³ 1 x 10⁻³ Waveform Triangular Triangular Temperature (F) 75, 800 75, 400, 800 Atmosphere Air Air Strain Ratio (Rε) -1.0 -1.0 Strain-Life Equations All Laminates(1)
Log Nf = 3.91 – 4.57 Log (∆ε) Std. Dev. of log (Nf) = 0.21 R2 = 90%, Sample Size = 28
Matrix(2) Log Nf = 4.13 – 5.49 Log (∆ε) Std. Dev. of Log (Nf) = 0.36 (1/∆ε) R2 = 49%, Sample Size= 5
(1) Pooled all laminate data, temperatures and plies. (2) Pooled 75, 400 and 800°F data.

MIL-HDBK-17-4A Volume 4, Section 3 Materials Properties Data
205
SiC/Ti-15-3
0.2
0.5
1
2
5
10
103 104 105 106102
Cycles to Failure, Nf
Stra
in R
ange
, ∆ε,
(%)
0.420.350.250.15
Fiber Volume Fraction
FIGURE 3.8.2.1.2(e) Strain-controlled fatigue [0]n data as a function of volume fraction.
Correlative Information for Figure 3.8.2.1.2(e)
Data Source Fatigue Table C4.1(d) Static Tension Table 3.8.2.1 b, d No. of Lots 6 No. of Plies 8,32 Test Parameters Strain rate (1/s) 1 x 10⁻³ Waveform Triangular Temperature (F) 800 Atmosphere Air Load Ratio (Rσ) -1.0 Stress-Life Equations Vf = 0.15, 0.25, 0.35, 0.42 Pooled
Log Nf = 3.93 – 4.30 log (∆σ) Std. Dev. of Log (Nf) = 0.17 R2 = 92%, Sample Size = 28

MIL-HDBK-17-4A Volume 4, Section 3 Materials Properties Data
206
3.8.2.2 TRIMARC-1/Ti-6Al-2Sn-4Zr-2Mo wire/fiber wound plate* 3.8.2.2.1 TRIMARC-1/Ti-6Al-2Sn-4Zr-2Mo tension SiC/Ti MATERIAL: TRIMARC-1/Ti-6Al-2Sn-4Zr-2Mo panel TRIMARC-1/Ti 6-2-4-2 Summary FIBER Trimarc-1, continuous, 128 µm MATRIX: Ti-6Al-2Sn-4Zr-2Mo MANUFACTURER: Atlantic Research Corp. PROCESS SEQUENCE: Wire/fiber wound process PROCESSING: HIP 1749°F, 103 MPa, 2 hrs. SOURCE: AFRL/MLLM Date of fiber manufacture Date of testing 94-96
Date of matrix manufacture Date of data resubmittal 11/00
Date of composite manufacture 94-96 Date of analysis 1/01
LAMINA PROPERTY SUMMARY
Temperature 73°F 325°F 700°F
Environment Air Air Air
Fiber v/o 27 30 32 27(1) 29(1) 30 27(1) 29(1) 30
[0]10
Tension, 1-axis SS-S -S- SS-S --- -SSS --- SS-S -S- SS-S -S- SS-S -S- SS-S -S-
[0]8
Tension, 1-axis SSSS -S- SS-S -S- SS-S -S-
[90]10
Tension, 2-axis SS-S -S- SSSS -S- SS-S -S- SS-S -SS
[90]8
Tension, 2-axis SSSS -S- SS-S -SS SS-S -SS
Classes of data: F - Fully approved, S - Screening in order: Strength/Modulus/Poisson’s Ratio/Strain-to-failure/Proportional Limit/0.02-offset-strength/0.2-offset-strength. (1) Strain rates of 1*10-5, 1*10-4, 1*10-3 s-1. *Raw data tables in Appendix C4.2.
MIL-HDBK-17-4A Volume 4, Section 3 Materials Properties Data
207
Nominal As Submitted Test Method
Fiber Density (g/cm3) 3.16-3.24
Foil Matrix Density (g/cm3)
Composite Density (g/cm3) 4.15**
Ply Thickness (in)
** Calculated based on Vf
LAMINATE PROPERTY SUMMARY
Temperature
Environment
Fiber v/o
Classes of data: F - Fully approved, S - Screening in order: Strength/Modulus/Poisson’s Ratio/Strain-to-failure/Proportional Limit/0.02-offset-strength/0.2-offset-strength.

MIL-HDBK-17-4A Volume 4, Section 3 Materials Properties Data
208
MATERIAL: Trimarc-1/Ti 6-2-4-2 panel Table 3.8.2.2.1(a) (1) SiC/Ti panel MACHINING: Water Jet/Diamond Grind FIBER VOLUME: 0.273-0.324 Trimarc-1/Ti 6-2-4-2 FIBER SPACING: 130 fibers/inch Tension, 1-axis SPECIMEN GEOMETRY: Straight-sided [0]10 GAGE THICKNESS: 0.0800-0.0951 in. MODULUS Least squares fit 73, Air GAGE WIDTH: 0.3146-0.3890 in. CALCULATION: Screening
TEST METHOD: Sec. 1.4.2.1 PRE-TEST EXPOSURE: None SOURCE: AFRL/MLLM NORMALIZED BY: Not normalized Temperature (°F) 73 2 73 2 73 2 Environment Air Air Air Fiber Volume Fraction 27.3 29.2-30.1 32.4 Strain Rate (1/s) 1·10-4 1·10-4 8·10-4 Mean 233 229 Minimum 217 210 Maximum 251 240 C.V.(%) 5.14
B-value (3) Ftu1
Distribution Normal (ksi) C1 230
C2 11.8 No. Specimens 3 6 No. Lots 1 2 Approval Class Screening Screening Mean 29.2 29.0 30.6 Minimum 28.4 28.3 Maximum 30.2 29.7
Et1 C.V.(%) 2.17
(Msi) No. Specimens 3 6 1
No. Lots 1 2 1 Approval Class Screening Screening Screening Mean 0.276
ν12t No. Specimens 1
No. Lots 1 Approval Class Screening Mean 0.800 0.787 0.550 Minimum 0.690 Maximum 0.850
C.V.(%) 7.57
B-value 0.608 ε1tu
Distribution Normal (%) C1 0.787
C2 0.060 No. Specimens 1 6 1
No. Lots 1 2 1 Approval Class Screening Screening Screening (1) All samples failed outside gage length. (2) Values couldn’t be calculated for those properties that do not appear, because the measured stress-strain curve
was linear to failure. (3) B-Basis values appear for fully approved data only.

MIL-HDBK-17-4A Volume 4, Section 3 Materials Properties Data
209
MATERIAL: Trimarc-1/Ti 6-2-4-2 panel Table 3.8.2.2.1(b) SiC/Ti panel MACHINING: Water Jet/Diamond Grind FIBER VOLUME: 0.273-0.324 Trimarc-1/Ti 6-2-4-2 FIBER SPACING: 130 fibers/inch Tension, 1-axis SPECIMEN GEOMETRY: Straight-sided [0]10 GAGE THICKNESS: 0.0800-0.0951 in. MODULUS Least squares fit 73, Air GAGE WIDTH: 0.3146-0.3890 in. CALCULATION: Screening
TEST METHOD: Sec. 1.4.2.1 PRE-TEST EXPOSURE: None SOURCE: AFRL/MLLM NORMALIZED BY: Not normalized Temperature (°F) 73 1 73 1 73 1 Environment Air Air Air Fiber Volume Fraction 27.3 29.2-30.1 32.4 Strain Rate (1/s) 1·10-4 1·10-4 8·10-4 Mean Minimum Maximum C.V.(%) B-value
pl1F Distribution
(ksi) C1 C2
No. Specimens No. Lots Approval Class Mean 174 Minimum Maximum
C.V.(%) B-value
ty0.021F Distribution
(ksi) C1 C2
No. Specimens 1 No. Lots 1 Approval Class Screening Mean Minimum Maximum
C.V.(%)
B-value ty0.2
1F Distribution
(ksi) C1 C2
No. Specimens
No. Lots Approval Class (1) Values couldn’t be calculated for those properties that do not appear, because the measured stress-strain curve
was linear to failure.

MIL-HDBK-17-4A Volume 4, Section 3 Materials Properties Data
210
MATERIAL: Trimarc-1/Ti 6-2-4-2 panel Table 3.8.2.2.1(c) SiC/Ti panel MACHINING: Water Jet/Diamond Grind FIBER VOLUME: 0.273-0.299 Trimarc-1/Ti 6-2-4-2 FIBER SPACING: 130 fibers/inch Tension, 1-axis SPECIMEN GEOMETRY: Straight-sided [0]10 GAGE THICKNESS: 0.0800-0.0951 in. MODULUS Least squares fit 325, Air GAGE WIDTH: 0.3146-0.3890 in. CALCULATION: Screening
TEST METHOD: Sec. 1.4.2.1 PRE-TEST EXPOSURE: None SOURCE: AFRL/MLLM NORMALIZED BY: Not normalized Temperature (°F) 325 1 325 1 325 1 325 1 325 1 325 1 Environment Air Air Air Air Air Air Fiber Volume Fraction 27.3 29.6-29.7 27.5 29.4 27.2-27.7 29.4-29.9 Strain Rate (1/s) 1·10-5 1·10-5 1·10-4 1·10-4 1·10-3 1·10-3
Mean 198 192 212 197 203 215 Minimum 166 187 187 203 Maximum 218 207 217 227 C.V.(%) 3.58
B-value (2) Ftu1
Distribution Normal (ksi) C1 215
C2 7.68 No. Specimens 1 2 1 2 4 8 No. Lots 1 2 1 2 1 2 Approval Class Screening Screening Screening Screening Screening Screening Mean 27.1 27.7 28.2 28.3 28.3 29.9 Minimum 27.5 27.6 27.3 27.6 Maximum 28.0 28.9 29.9 35.1
Et1 C.V.(%) 8.29
(Msi) No. Specimens 1 2 1 2 4 8
No. Lots 1 2 1 2 1 2 Approval Class Screening Screening Screening Screening Screening Screening Mean
ν12t No. Specimens
No. Lots Approval Class Mean 0.720 0.710 0.740 0.750 0.737 0.740 Minimum 0.570 0.680 0.690 Maximum 0.850 0.800 0.770
C.V.(%) 4.41
B-value (2) ε1tu
Distribution ANOVA (%) C1 0.0383
C2 15.2 No. Specimens 1 2 1 1 3 7
No. Lots 1 2 1 1 1 2 Approval Class Screening Screening Screening Screening Screening Screening (1) Values couldn’t be calculated for those properties that do not appear, because the measured stress-strain curve
was linear to failure. (2) B-Basis values appear for fully approved data only.

MIL-HDBK-17-4A Volume 4, Section 3 Materials Properties Data
211
MATERIAL: Trimarc-1/Ti 6-2-4-2 panel Table 3.8.2.2.1(d) SiC/Ti panel MACHINING: Water Jet/Diamond Grind FIBER VOLUME: 0.273-0.299 Trimarc-1/Ti 6-2-4-2 FIBER SPACING: 130 fibers/inch Tension, 1-axis SPECIMEN GEOMETRY: Straight-sided [0]10 GAGE THICKNESS: 0.0800-0.0951 in. MODULUS Least squares fit 325, Air GAGE WIDTH: 0.3146-0.3890 in. CALCULATION: Screening
TEST METHOD: Sec. 1.4.2.1 PRE-TEST EXPOSURE: None SOURCE: AFRL/MLLM NORMALIZED BY: Not normalized Temperature (°F) 325 1 325 1 325 1 325 1 325 1 325 1 Environment Air Air Air Air Air Air Fiber Volume Fraction 27.3 29.6-29.7 27.5 29.4 27.2-27.7 29.4-29.9 Strain Rate (1/s) 1·10-5 1·10-5 1·10-4 1·10-4 1·10-3 1·10-3
Mean Minimum Maximum C.V.(%)
B-value pl1F
Distribution (ksi) C1
C2 No. Specimens No. Lots Approval Class Mean 183 204 172 193 145 Minimum 174 87.2 Maximum 211 224
C.V.(%)
B-value ty0.021F
Distribution (ksi) C1
C2
No. Specimens 1 1 1 2 3 No. Lots 1 1 1 1 2 Approval Class Screening Screening Screening Screening Screening Mean Minimum Maximum
C.V.(%)
B-value ty0.21F
Distribution (ksi) C1
C2 No. Specimens
No. Lots Approval Class (1) Values couldn’t be calculated for those properties that do not appear, because the measured stress-strain curve
was linear to failure.

MIL-HDBK-17-4A Volume 4, Section 3 Materials Properties Data
212
MATERIAL: Trimarc-1/Ti 6-2-4-2 panel Table 3.8.2.2.1(e) SiC/Ti panel MACHINING: Water Jet/Diamond Grind FIBER VOLUME: 0.274-0.293 Trimarc-1/Ti 6-2-4-2 FIBER SPACING: 130 fibers/inch Tension, 1-axis SPECIMEN GEOMETRY: Straight-sided [0]10 GAGE THICKNESS: 0.0805-0.0905 in. MODULUS Least squares fit 700, Air GAGE WIDTH: 0.3140-0.3870 in. CALCULATION: Screening
TEST METHOD: Sec. 1.4.2.1 PRE-TEST EXPOSURE: None SOURCE: AFRL/MLLM NORMALIZED BY: Not normalized Temperature (°F) 700 1 700 1 700 1 700 1 700 1 700 1 Environment Air Air Air Air Air Air Fiber Volume Fraction 27.4 29.0-29.3 27.4 28.9-29.2 27.4-27.6 29.0-29.3 Strain Rate (1/s) 1·10-5 1·10-5 1·10-4 1·10-4 1·10-3 1·10-3
Mean 186 198 185 168 192 193 Minimum 189 142 179 180 Maximum 207 195 200 203 C.V.(%) 5.27
B-value (2) Ftu1
Distribution Normal (ksi) C1 193
C2 10.2 No. Specimens 1 2 1 2 3 5 No. Lots 1 2 1 2 1 2 Approval Class Screening Screening Screening Screening Screening Screening Mean 25.9 27.8 27.1 27.8 28.3 29.4 Minimum 27.7 27.5 24.9 26.1 Maximum 27.9 28.0 30.7 32.3
Et1 C.V.(%) 8.40
(Msi) No. Specimens 1 2 1 2 3 5
No. Lots 1 2 1 2 1 2 Approval Class Screening Screening Screening Screening Screening Screening Mean
ν12t No. Specimens
No. Lots Approval Class Mean 0.750 0.740 0.710 0.625 0.713 0.706 Minimum 0.720 0.510 0.630 0.620 Maximum 0.760 0.740 0.830 0.820
C.V.(%) 11.7
B-value (2) ε1tu
Distribution Normal (%) C1 0.706
C2 0.0823 No. Specimens 1 2 1 2 3 5
No. Lots 1 2 1 2 1 2 Approval Class Screening Screening Screening Screening Screening Screening (1) Values couldn’t be calculated for those properties that do not appear, because the measured stress-strain curve
was linear to failure. (2) B-Basis values appear for fully approved data only.

MIL-HDBK-17-4A Volume 4, Section 3 Materials Properties Data
213
MATERIAL: Trimarc-1/Ti 6-2-4-2 panel Table 3.8.2.2.1(f) SiC/Ti panel MACHINING: Water Jet/Diamond Grind FIBER VOLUME: 0.274-0.293 Trimarc-1/Ti 6-2-4-2 FIBER SPACING: 130 fibers/inch Tension, 1-axis SPECIMEN GEOMETRY: Straight-sided [0]10 GAGE THICKNESS: 0.0805-0.0905 in. MODULUS Least squares fit 700, Air GAGE WIDTH: 0.3140-0.3870 in. CALCULATION: Screening
TEST METHOD: Sec. 1.4.2.1 PRE-TEST EXPOSURE: None SOURCE: AFRL/MLLM NORMALIZED BY: Not normalized Temperature (°F) 700 1 700 1 700 1 700 1 700 1 700 1 Environment Air Air Air Air Air Air Fiber Volume Fraction 27.4 29.0-29.3 27.4 28.9-29.2 27.4-27.6 29.0-29.3 Strain Rate (1/s) 1·10-5 1·10-5 1·10-4 1·10-4 1·10-3 1·10-3
Mean Minimum Maximum C.V.(%)
B-value pl1F
Distribution (ksi) C1
C2 No. Specimens No. Lots Approval Class Mean 183 175 174 183 166 170 Minimum 160 117 125 Maximum 191 194 186
C.V.(%) 15.1
B-value (2) ty0.021F
Distribution Normal (ksi) C1 170
C2 25.7
No. Specimens 1 2 1 1 3 5 No. Lots 1 2 1 1 1 2 Approval Class Screening Screening Screening Screening Screening Screening Mean Minimum Maximum
C.V.(%)
B-value ty0.21F
Distribution (ksi) C1
C2 No. Specimens
No. Lots Approval Class
(1) Values couldn’t be calculated for those properties that do not appear, because the measured stress-strain curve was linear to failure.
(2) B-Basis values appear for fully approved data only.

MIL-HDBK-17-4A Volume 4, Section 3 Materials Properties Data
214
MATERIAL: Trimarc-1/Ti 6-2-4-2 panel Table 3.8.2.2.1(g) SiC/Ti panel MACHINING: Water Jet/Diamond Grind FIBER VOLUME: 0.305-0.310 Trimarc-1/Ti 6-2-4-2 FIBER SPACING: 130 fibers/inch Tension, 1-axis SPECIMEN GEOMETRY: Straight-sided [0]8 GAGE THICKNESS: 0.0670-0.0680 in. MODULUS Least squares fit 73, 325, 700, Air GAGE WIDTH: 0.3630-0.3640 in. CALCULATION: Screening
TEST METHOD: Sec. 1.4.2.1 PRE-TEST EXPOSURE: None SOURCE: AFRL/MLLM NORMALIZED BY: Not normalized Temperature (°F) 73 1 325 1 700 1 Environment Air Air Air Fiber Volume Fraction 30.5-30.7 30.5-31.0 30.5-30.7 Strain Rate (1/s) 8·10-4 8·10-4 8·10-4 Mean 247 227 196 Minimum 239 220 190 Maximum 255 230 206 C.V.(%)
B-value Ftu1
Distribution (ksi) C1
C2 No. Specimens 2 3 3 No. Lots 1 1 1 Approval Class Screening Screening Screening Mean 29.7 26.1 25.0 Minimum 28.7 25.8 23.3 Maximum 30.8 26.5 26.6
Et1 C.V.(%)
(Msi) No. Specimens 2 2 2
No. Lots 1 1 1 Approval Class Screening Screening Screening Mean 0.295
ν12t No. Specimens 2
No. Lots 1 Approval Class Screening Mean 0.865 0.917 0.810 Minimum 0.810 0.870 0.730 Maximum 0.920 0.960 0.860
C.V.(%)
B-value ε1tu
Distribution (%) C1
C2 No. Specimens 2 3 3
No. Lots 1 1 1 Approval Class Screening Screening Screening (1) Values couldn’t be calculated for those properties that do not appear, because the measured stress-strain curve
was linear to failure.

MIL-HDBK-17-4A Volume 4, Section 3 Materials Properties Data
215
MATERIAL: Trimarc-1/Ti 6-2-4-2 panel Table 3.8.2.2.1(h) SiC/Ti panel MACHINING: Water Jet/Diamond Grind FIBER VOLUME: 0.305-0.310 Trimarc-1/Ti 6-2-4-2 FIBER SPACING: 130 fibers/inch Tension, 1-axis SPECIMEN GEOMETRY: Straight-sided [0]8 GAGE THICKNESS: 0.0670-0.0680 in. MODULUS Least squares fit 73, 325, 700, Air GAGE WIDTH: 0.3630-0.3640 in. CALCULATION: Screening
TEST METHOD: Sec. 1.4.2.1 PRE-TEST EXPOSURE: None SOURCE: AFRL/MLLM NORMALIZED BY: Not normalized Temperature (°F) 73 1 325 1 700 1 Environment Air Air Air Fiber Volume Fraction 30.5-30.7 30.5-31.0 30.5-30.7 Strain Rate (1/s) 8·10-4 8·10-4 8·10-4 Mean Minimum Maximum C.V.(%)
B-value pl1F
Distribution (ksi) C1
C2 No. Specimens No. Lots Approval Class Mean 241 212 168 Minimum 238 208 Maximum 245 215
C.V.(%)
B-value ty0.021F
Distribution (ksi) C1
C2
No. Specimens 2 2 1 No. Lots 1 1 1 Approval Class Screening Screening Screening Mean Minimum Maximum
C.V.(%)
B-value ty0.21F
Distribution (ksi) C1
C2 No. Specimens
No. Lots (1) Values couldn’t be calculated for those properties that do not appear, because the measured stress-strain curve
was linear to failure.

MIL-HDBK-17-4A Volume 4, Section 3 Materials Properties Data
216
MATERIAL: Trimarc-1/Ti 6-2-4-2 panel Table 3.8.2.2.1(i) SiC/Ti panel MACHINING: Water Jet/Diamond Grind FIBER VOLUME: 0.287-0.322 Trimarc-1/Ti 6-2-4-2 FIBER SPACING: 130 fibers/inch Tension, 2-axis SPECIMEN GEOMETRY: Straight-sided [90]10 GAGE THICKNESS: 0.0805-0.0905 in. MODULUS Least squares fit 73, Air GAGE WIDTH: 0.3140-0.3870 in. CALCULATION: Screening
TEST METHOD: Sec. 1.4.2.1 PRE-TEST EXPOSURE: None SOURCE: AFRL/MLLM NORMALIZED BY: Not normalized Temperature (°F) 73 1 73 1 Environment Air Air Fiber Volume Fraction 28.7-29.5 32.2 Strain Rate (1/s) 1·10-4 8·10-4 Mean 51.6 36.4 Minimum 41.6 35.4 Maximum 59.4 37.4 C.V.(%) 12.3
B-value (2) Ftu2
Distribution ANOVA (ksi) C1 7.22
C2 5.84 No. Specimens 9 2 No. Lots 3 2 Approval Class Screening Screening Mean 22.5 23.2 Minimum 19.8 Maximum 24.8
Et2 C.V.(%) 7.19
(Msi) No. Specimens 9 1
No. Lots 3 1 Approval Class Screening Screening Mean 0.216
ν21t No. Specimens 2
No. Lots 2 Approval Class Screening Mean 0.540 0.175 Minimum 0.380 0.150 Maximum 0.680 0.200
C.V.(%) 19.6
B-value (2) ε2tu
Distribution ANOVA (%) C1 0.118
C2 5.57 No. Specimens 9 2
No. Lots 3 2 Approval Class Screening Screening (1) Values couldn’t be calculated for those properties that do not appear, because the measured stress-strain curve
was linear to failure. (2) B-Basis values appear for fully approved data only.

MIL-HDBK-17-4A Volume 4, Section 3 Materials Properties Data
217
MATERIAL: Trimarc-1/Ti 6-2-4-2 panel Table 3.8.2.2.1(j) SiC/Ti panel MACHINING: Water Jet/Diamond Grind FIBER VOLUME: 0.287-0.322 Trimarc-1/Ti 6-2-4-2 FIBER SPACING: 130 fibers/inch Tension, 2-axis SPECIMEN GEOMETRY: Straight-sided [90]10 GAGE THICKNESS: 0.0805-0.0905 in. MODULUS Least squares fit 73, Air GAGE WIDTH: 0.3140-0.3870 in. CALCULATION: Screening
TEST METHOD: Sec. 1.4.2.1 PRE-TEST EXPOSURE: None SOURCE: AFRL/MLLM NORMALIZED BY: Not normalized Temperature (°F) 73 1 73 1 Environment Air Air Fiber Volume Fraction 28.7-29.5 32.2 Strain Rate (1/s) 1·10-4 8·10-4 Mean Minimum Maximum C.V.(%)
B-value pl2F
Distribution (ksi) C1
C2 No. Specimens No. Lots Approval Class Mean 44.7 33.9 Minimum 33.2 Maximum 50.7
C.V.(%) 12.1
B-value (2) ty0.022F
Distribution Normal (ksi) C1 44.74
C2 5.394
No. Specimens 8 1 No. Lots 3 1 Approval Class Screening Screening Mean Minimum Maximum
C.V.(%)
B-value ty0.22F
Distribution (ksi) C1
C2 No. Specimens
No. Lots Approval Class (1) Values couldn’t be calculated for those properties that do not appear, because the measured stress-strain curve
was linear to failure. (2) B-Basis values appear for fully approved data only.
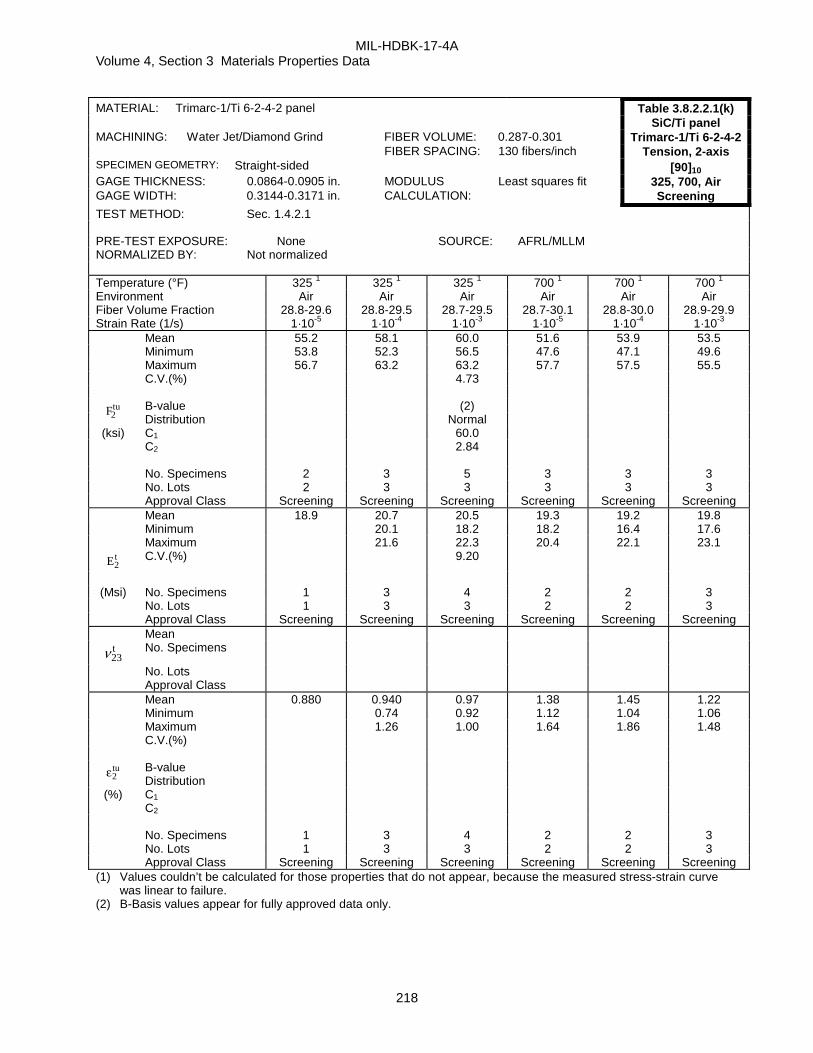
MIL-HDBK-17-4A Volume 4, Section 3 Materials Properties Data
218
MATERIAL: Trimarc-1/Ti 6-2-4-2 panel Table 3.8.2.2.1(k) SiC/Ti panel MACHINING: Water Jet/Diamond Grind FIBER VOLUME: 0.287-0.301 Trimarc-1/Ti 6-2-4-2 FIBER SPACING: 130 fibers/inch Tension, 2-axis SPECIMEN GEOMETRY: Straight-sided [90]10 GAGE THICKNESS: 0.0864-0.0905 in. MODULUS Least squares fit 325, 700, Air GAGE WIDTH: 0.3144-0.3171 in. CALCULATION: Screening
TEST METHOD: Sec. 1.4.2.1 PRE-TEST EXPOSURE: None SOURCE: AFRL/MLLM NORMALIZED BY: Not normalized Temperature (°F) 325 1 325 1 325 1 700 1 700 1 700 1 Environment Air Air Air Air Air Air Fiber Volume Fraction 28.8-29.6 28.8-29.5 28.7-29.5 28.7-30.1 28.8-30.0 28.9-29.9 Strain Rate (1/s) 1·10-5 1·10-4 1·10-3 1·10-5 1·10-4 1·10-3 Mean 55.2 58.1 60.0 51.6 53.9 53.5 Minimum 53.8 52.3 56.5 47.6 47.1 49.6 Maximum 56.7 63.2 63.2 57.7 57.5 55.5 C.V.(%) 4.73
B-value (2) Ftu2
Distribution Normal (ksi) C1 60.0
C2 2.84 No. Specimens 2 3 5 3 3 3 No. Lots 2 3 3 3 3 3 Approval Class Screening Screening Screening Screening Screening Screening Mean 18.9 20.7 20.5 19.3 19.2 19.8 Minimum 20.1 18.2 18.2 16.4 17.6 Maximum 21.6 22.3 20.4 22.1 23.1
Et2 C.V.(%) 9.20
(Msi) No. Specimens 1 3 4 2 2 3
No. Lots 1 3 3 2 2 3 Approval Class Screening Screening Screening Screening Screening Screening Mean
t23ν No. Specimens
No. Lots Approval Class Mean 0.880 0.940 0.97 1.38 1.45 1.22 Minimum 0.74 0.92 1.12 1.04 1.06 Maximum 1.26 1.00 1.64 1.86 1.48
C.V.(%)
B-value ε2tu
Distribution (%) C1
C2 No. Specimens 1 3 4 2 2 3
No. Lots 1 3 3 2 2 3 Approval Class Screening Screening Screening Screening Screening Screening (1) Values couldn’t be calculated for those properties that do not appear, because the measured stress-strain curve
was linear to failure. (2) B-Basis values appear for fully approved data only.

MIL-HDBK-17-4A Volume 4, Section 3 Materials Properties Data
219
MATERIAL: Trimarc-1/Ti 6-2-4-2 panel Table 3.8.2.2.1(l) SiC/Ti panel MACHINING: Water Jet/Diamond Grind FIBER VOLUME: 0.287-0.301 Trimarc-1/Ti 6-2-4-2 FIBER SPACING: 130 fibers/inch Tension, 2-axis SPECIMEN GEOMETRY: Straight-sided [90]10 GAGE THICKNESS: 0.0864-0.0905 in. MODULUS Least squares fit 325, 700, Air GAGE WIDTH: 0.3144-0.3171 in. CALCULATION: Screening
TEST METHOD: Sec. 1.4.2.1 PRE-TEST EXPOSURE: None SOURCE: AFRL/MLLM NORMALIZED BY: Not normalized Temperature (°F) 325 1 325 1 325 1 700 1 700 1 700 1 Environment Air Air Air Air Air Air Fiber Volume Fraction 28.8-29.6 28.8-29.5 28.7-29.5 28.7-30.1 28.8-30.0 28.9-29.9 Strain Rate (1/s) 1·10-5 1·10-4 1·10-3 1·10-5 1·10-4 1·10-3 Mean Minimum Maximum C.V.(%)
B-value pl2F
Distribution (ksi) C1 C2 No. Specimens No. Lots Approval Class Mean 35.4 35.5 37.8 26.6 25.2 26.2 Minimum 34.5 36.7 26.2 25.0 24.6 Maximum 36.5 38.5 27.0 25.3 28.3 C.V.(%) 2.21
B-value (2) Fty2
0 02. Distribution Normal
(ksi) C1 37.8 C2 .837 No. Specimens 1 3 4 2 2 3 No. Lots 1 3 3 2 2 3 Approval Class Screening Screening Screening Screening Screening Screening Mean 59.5 48.0 46.5 49.3 Minimum 57.8 47.3 45.6 45.6 Maximum 61.1 48.8 47.4 52.5 C.V.(%)
B-value Fty2
0 2. Distribution
(ksi) C1 C2 No. Specimens 2 2 2 3 No. Lots 2 2 2 3 Approval Class Screening Screening Screening Screening (1) Values couldn’t be calculated for those properties that do not appear, because the measured stress-strain curve
was linear to failure. (2) B-Basis values appear for fully approved data only.
MIL-HDBK-17-4A Volume 4, Section 3 Materials Properties Data
220
MATERIAL: Trimarc-1/Ti 6-2-4-2 panel Table 3.8.2.2.1(m) SiC/Ti panel MACHINING: Water Jet/Diamond Grind FIBER VOLUME: 0.303-0.305 Trimarc-1/Ti 6-2-4-2 FIBER SPACING: 130 fibers/inch Tension, 2-axis SPECIMEN GEOMETRY: Straight-sided [90]8 GAGE THICKNESS: 0.0680-0.0685 in. MODULUS Least squares fit 73, 325, 700, Air GAGE WIDTH: 0.3700-0.3740 in. CALCULATION: Screening
TEST METHOD: Sec. 1.4.2.1 PRE-TEST EXPOSURE: None SOURCE: AFRL/MLLM NORMALIZED BY: Not normalized Temperature (°F) 73 1 325 1 700 1 Environment Air Air Air Fiber Volume Fraction 30.5 30.3-30.5 30.3-30.5 Strain Rate (1/s) 8·10-4 8·10-4 8·10-4 Mean 45.7 50.5 44.2 Minimum 49.3 41.7 Maximum 52.3 45.6 C.V.(%)
B-value Ftu2
Distribution (ksi) C1
C2 No. Specimens 1 3 3 No. Lots 1 1 1 Approval Class Screening Screening Screening Mean 22.3 17.2 14.1 Minimum 16.5 13.2 Maximum 17.8 15.1
Et2 C.V.(%)
(Msi) No. Specimens 1 2 2
No. Lots 1 1 1 Approval Class Screening Screening Screening Mean 0.223
ν21t No. Specimens 1
No. Lots 1 Approval Class Screening Mean 0.260 0.460 0.547 Minimum 0.430 0.490 Maximum 0.520 0.620
C.V.(%)
B-value ε2tu
Distribution (%) C1
C2 No. Specimens 1 3 3
No. Lots 1 1 1 Approval Class Screening Screening Screening (1) Values couldn’t be calculated for those properties that do not appear, because the measured stress-strain curve
was linear to failure.

MIL-HDBK-17-4A Volume 4, Section 3 Materials Properties Data
221
MATERIAL: Trimarc-1/Ti 6-2-4-2 panel Table 3.8.2.2.1(n) SiC/Ti panel MACHINING: Water Jet/Diamond Grind FIBER VOLUME: 0.303-0.305 Trimarc-1/Ti 6-2-4-2 FIBER SPACING: 130 fibers/inch Tension, 2-axis SPECIMEN GEOMETRY: Straight-sided [90]8 GAGE THICKNESS: 0.0680-0.0685 in. MODULUS Least squares fit 73, 325, 700, Air GAGE WIDTH: 0.3700-0.3740 in. CALCULATION: Screening
TEST METHOD: Sec. 1.4.2.1 PRE-TEST EXPOSURE: None SOURCE: AFRL/MLLM NORMALIZED BY: Not normalized Temperature (°F) 73 1 325 1 700 1 Environment Air Air Air Fiber Volume Fraction 30.5 30.3-30.5 30.3-30.5 Strain Rate (1/s) 8·10-4 8·10-4 8·10-4 Mean Minimum Maximum C.V.(%)
B-value Fpl2
Distribution (ksi) C1
C2 No. Specimens No. Lots Approval Class Mean 38.1 33.2 26.4 Minimum 33.2 25.7 Maximum 33.3 27.0
C.V.(%)
B-value Fty2
0 02. Distribution
(ksi) C1 C2
No. Specimens 1 2 2 No. Lots 1 1 1 Approval Class Screening Screening Screening Mean 51.9 43.5 Minimum 43.4 Maximum 43.6
C.V.(%)
B-value Fty2
0 2. Distribution
(ksi) C1 C2
No. Specimens 1 2
No. Lots 1 1 Approval Class Screening Screening (1) Values couldn’t be calculated for those properties that do not appear, because the measured stress-strain curve
was linear to failure.

MIL-HDBK-17-4A Volume 4, Section 3 Materials Properties Data
222
Trimarc-1/Ti 6-2-4-2
0
50
100
150
200
250
300
0 100 200 300 400 500 600 700 800
0.001 (1/s) Strain Rate0.0001 (1/s) Strain Rate0.00001 (1/s) Strain Rate0.0008 (1/s) Strain Rate
F1tu
(ksi
)
Temperature (oF)
32 Vf
27 - 29 Vf
FIGURE 3.8.2.2.1(a) Ultimate tensile strength of [0]10 laminate as a function of temperature and strain rate.
0.0
50.0
100.0
150.0
200.0
250.0
300.0
0 100 200 300 400 500 600 700 800
0.001 (1/s) Strain Rate for 0.02 YS [0]100.0001 (1/s) Strain Rate for 0.02 YS [0]100.00001 (1/s) Strain Rate for 0.02 YS [0]100.0008 (1/s) Strain Rate for 0.02 YS [0]8
F1ty
0.02
(ks
i)
Temperature (oF)
27 - 32 Vf
FIGURE 3.8.2.2.1(b) Tensile longitudinal 0.02 offset-strength of [0]10 and [0]8 laminate as a function
of temperature and strain rate.

MIL-HDBK-17-4A Volume 4, Section 3 Materials Properties Data
223
Trimarc-1/Ti 6-2-4-2
22.0
24.0
26.0
28.0
30.0
32.0
34.0
36.0
0 100 200 300 400 500 600 700 800
0.001(1/s) Strain Rate for [0]100.0001(1/s) Strain Rate for [0]100.00001(1/s) Strain Rate for [0]100.0008(1/s) Strain Rate for [0]8
E1t (
Msi
)
Temperature (oF)
27 - 32 Vf
FIGURE 3.8.2.2.1(c) Tensile modulus [0]10 and [0]8 laminate as a function of temperature and strain rate.
30
35
40
45
50
55
60
65
0 100 200 300 400 500 600 700 800
0.001 (1/s) Strain Rate0.0001 (1/s) Strain Rate0.00001 (1/s) Strain Rate0.0008 (1/s) Strain Rate
F2tu
(ks
i)
Temperature (oF)
29 Vf
32 Vf
FIGURE 3.8.2.2.1(d) Ultimate transverse tensile strength of [90]10 laminate as a function of
temperature and strain rate.

MIL-HDBK-17-4A Volume 4, Section 3 Materials Properties Data
224
Trimarc-1/Ti 6-2-4-2
20.0
25.0
30.0
35.0
40.0
45.0
50.0
55.0
0 100 200 300 400 500 600 700 800
0.001 (1/s) Strain Rate for 0.02 YS [90]100.0001 (1/s) Strain Rate for 0.02 YS [90]100.00001 (1/s) Strain Rate for 0.02 YS [90]100.0008 (1/s) Strain Rate for 0.02 YS [90]80.0008 (1/s) Strain Rate for 0.02 YS [90]10
F2ty
0.02
(ks
i)
Temperature (oF)
28 - 32 Vf
FIGURE 3.8.2.2.1(e) Ultimate transverse 0.02 offset-strength of [90]10 and [90]8 laminate as a function of temperature and strain rate.
40.0
45.0
50.0
55.0
60.0
65.0
0 100 200 300 400 500 600 700 800
0.001 (1/s) Strain Rate for 0.2 YS [90]100.0001 (1/s) Strain Rate for 0.2 YS [90]100.00001 (1/s) Strain Rate for 0.2 YS [90]100.0008 (1/s) Strain Rate for 0.2 YS [90]8
F2ty
0.2 (
ksi)
Temperature (oF)
28 - 32 Vf
FIGURE 3.8.2.2.1(f) Ultimate transverse 0.2 offset-strength of [90]10 and [90]8 laminate as a function
of temperature and strain rate.

MIL-HDBK-17-4A Volume 4, Section 3 Materials Properties Data
225
Trimarc-1/Ti 6-2-4-2
12.0
14.0
16.0
18.0
20.0
22.0
24.0
26.0
0 100 200 300 400 500 600 700 800
0.001 (1/s) Strain Rate for [90]100.0001 (1/s) Strain Rate for [90]100.00001 (1/s) Strain Rate for [90]100.0008 (1/s) Strain Rate for [90]100.0008 (1/s) Strain Rate for [90]8
E2t
(Msi
)
Temperature (oF)
28 - 32 Vf
FIGURE 3.8.2.2.1(g) Transverse tensile modulus [90]8 as a function of temperature and strain rate.
0
50
100
150
200
250
0 0.002 0.004 0.006 0.008 0.01
Str
ess
(ksi
)
Strain
30 Vf
FIGURE 3.8.2.2.1(h) Typical tensile behavior for [0]10 laminae at 73°F at a strain rate of 1X10⁻⁵ s-1.

MIL-HDBK-17-4A Volume 4, Section 3 Materials Properties Data
226
Trimarc-1/Ti 6-2-4-2
0
50
100
150
200
250
0 0.002 0.004 0.006 0.008 0.01
Str
ess
(ksi
)
Strain
29 Vf
FIGURE 3.8.2.2.1(i) Typical tensile behavior for [0]10 laminae at 700°F at a strain rate of 1X10⁻⁴ s-1.
0
50
100
150
200
250
0 0.002 0.004 0.006 0.008 0.01
Str
ess
(ksi
)
Strain
29 Vf
FIGURE 3.8.2.2.1(j) Typical tensile behavior for [90]10 laminae at 75°F at a strain rate of 1X10⁻⁴ s-1.

MIL-HDBK-17-4A Volume 4, Section 3 Materials Properties Data
227
Trimarc-1/Ti 6-2-4-2
0
50
100
150
200
250
0 0.004 0.008 0.012 0.016
Str
ess
(ksi
)
Strain
30 Vf
FIGURE 3.8.2.2.1(k) Typical tensile behavior for [90]8 laminae at 325oF (163°C) at a strain rate of
8X10⁻⁴ s-1.

MIL-HDBK-17-4A Volume 4, Section 3 Materials Properties Data
228
3.8.2.2.2 TRIMARC-1/Ti-6Al-2Sn-4Zr-2Mo compression SiC/Ti MATERIAL: TRIMARC-1/Ti-6Al-2Sn-4Zr-2Mo wire/fiber wound panel TRIMARC-1/Ti 6-2-4-2 Summary FIBER Trimarc-1, continuous, 128 µm MATRIX: Ti-6Al-2Sn-4Zr-2Mo MANUFACTURER: Atlantic Research Corp. PROCESS SEQUENCE: Wire/fiber wound process PROCESSING: HIP 1749°F, 103 MPa, 2 hrs. SOURCE: AFRL/MLLM Date of fiber manufacture Date of testing 94-96
Date of matrix manufacture Date of data resubmittal 11/99
Date of composite manufacture 94-96 Date of analysis 2/01
PROPERTY SUMMARY
Temperature 73°F 325°F 700°F
Environment Air Air Air
Fiber Vf 0.27 0.30 0.32 0.27(1) 0.29(1) 0.30 (2) 0.27(1) 0.29(1) 0.30(2)
[0]10
Compression, 1-axis
-S---SS -S---SS -S---S- -S---S- -S---SS -S---SS -S---SS
[90]10
Compression, 2-axis
-S---SS -S---SS -S---SS -S---SS -S---SS -S---SS -S---SS
Classes of data: F - Fully approved, S - Screening in order: Strength/Modulus/Poisson’s Ratio/Strain-to-failure/Proportional Limit/0.02-offset-strength/0.2-offset-strength. (1) Strain rates of 1·10-5, 1·10-4, 1·10-3 s-1 for tension. (2) Fiber volumes for compression tests ranged from 0.32-0.33 Vf Raw data tables in Appendix C4.2.

MIL-HDBK-17-4A Volume 4, Section 3 Materials Properties Data
229
Nominal As Submitted Test Method
Fiber Density (g/cm3) 3.16-3.24
Foil Matrix Density (g/cm3)
Composite Density (g/cm3) 4.15**
Ply Thickness (mm)
** Calculated based on Vf
LAMINATE PROPERTY SUMMARY
Classes of data: B – B-Basis robust sampling b – B-Basis reduced sampling, I - Interim, S - Screening in
Strength/Modulus/Poisson’s ratio/Strain-to-failure order.

MIL-HDBK-17-4A Volume 4, Section 3 Materials Properties Data
230
MATERIAL: TRIMARC-1/Ti-6Al-2Sn-4Zr-2Mo wire/fiber wound panel Table 3.8.2.2.2(a) SiC/Ti panel MACHINING: Water Jet/Diamond Grind FIBER VOLUME: 0.273-0.328 Trimarc-1/Ti 6-2-4-2 FIBER SPACING: Compression, 1-axis
130 fibers/inch (0.008 in/fiber) [0]10
SPECIMEN GEOMETRY: Straight-sided 73, 325, Air GAGE THICKNESS: 0.0799-0.0913 in MODULUS Screening GAGE WIDTH: 0.6063-0.6259 in CALCULATION: Least squares fit TEST METHOD: Sec. 1.4.2.2 PRE-TEST EXPOSURE: None SURFACE COND: As received NORMALIZED BY: Not normalized SOURCE: AFRL/MLLM Temperature °F 73 1 73 1 325 1 325 1 Environment Air Air Air Air Fiber Volume Fraction 27.9-29.2 32.4 27.8-29.3 32.8 Strain Rate (1/s) 1·10-4 8·10-4 1·10-4 8·10-4
Mean Minimum Maximum C.V.(%)
B-value Fcu1
Distribution (Msi) C1
C2 No. Specimens No. Lots Approval Class Mean 29.3 29.9 26.6 29.0 Minimum 28.3 28.4 25.5 27.0 Maximum 30.9 31.5 27.9 30.3
Ec1 C.V.(%) 3.57 3.73
(Msi) No. Specimens 5 3 6 3
No. Lots 3 1 3 1 Approval Class Screening Screening Screening Screening Mean
ν12c No. Specimens
No. Lots Approval Class Mean Minimum Maximum
C.V.(%)
B-value ε1cu
Distribution (%) C1
C2 No. Specimens
No. Lots Approval Class (1) Values couldn’t be calculated for those properties that do not appear, because the measured stress-strain curve
was linear to failure.

MIL-HDBK-17-4A Volume 4, Section 3 Materials Properties Data
231
MATERIAL: TRIMARC-1/Ti-6Al-2Sn-4Zr-2Mo wire/fiber wound panel Table 3.8.2.2.2(b) SiC/Ti panel MACHINING: Water Jet/Diamond Grind FIBER VOLUME: 0.273-0.324 Trimarc-1/Ti 6-2-4-2 FIBER SPACING: 130 fibers/inch Compression, 1-axis (0.008 in/fiber) [0]10 SPECIMEN GEOMETRY: Straight-sided 73, 325, Air GAGE THICKNESS: 0.0799-0.0913 in MODULUS Screening GAGE WIDTH: 0.6063-0.6259 in CALCULATION: Least squares fit TEST METHOD: Sec. 1.4.2.2 PRE-TEST EXPOSURE: None SURFACE COND: As received NORMALIZED BY: Not normalized SOURCE: AFRL/MLLM Temperature °F 73 1 73 1 325 1 325 1 Environment Air Air Air Air Fiber Volume Fraction 27.9-29.2 32.4 27.8-29.3 32.8 Strain Rate (1/s) 1·10-4 8·10-4 1·10-4 8·10-4
Mean Minimum Maximum C.V.(%)
B-value Fpl1
Distribution (ksi) C1
C2 No. Specimens No. Lots Approval Class Mean 196 185 335 323 Minimum 155 309 292 Maximum 238 352 355
C.V.(%) 5.73
B-value 255 Fcy1
0 02. Distribution Normal
(ksi) C1 335 C2 19.2
No. Specimens 1 1 4 2 No. Lots 1 1 3 1 Approval Class Screening Screening Screening Screening Mean 262 329 Minimum 251 Maximum 272
C.V.(%)
B-value Fcy1
0 2. Distribution
(ksi) C1 C2
No. Specimens 2 1
No. Lots 2 1 Approval Class Screening Screening (1) Values couldn’t be calculated for those properties that do not appear, because the measured stress-strain curve
was linear to failure.

MIL-HDBK-17-4A Volume 4, Section 3 Materials Properties Data
232
MATERIAL: TRIMARC-1/Ti-6Al-2Sn-4Zr-2Mo wire/fiber wound panel Table 3.8.2.2.2(c) SiC/Ti panel MACHINING: Water Jet/Diamond Grind FIBER VOLUME: 0.273-0.328 Trimarc-1/Ti 6-2-4-2 FIBER SPACING: 130 fibers/inch Compression, 1-axis (0.008 in/fiber) [0]10 SPECIMEN GEOMETRY: Straight-sided 700, Air GAGE THICKNESS: 0.0799-0.0913 in MODULUS Screening GAGE WIDTH: 0.6063-0.6259 in CALCULATION: Least squares fit TEST METHOD: Sec. 1.4.2.2 PRE-TEST EXPOSURE: None SURFACE COND: As received NORMALIZED BY: Not normalized SOURCE: AFRL/MLLM Temperature °F 7001 7001 7001 7001 Environment Air Air Air Air Fiber Volume Fraction 29.5 28.2-29.2 28.0 32.8 Strain Rate (1/s) 1·10-5 1·10-4 1·10-3 8·10-4
Mean Minimum Maximum C.V.(%)
B-value Fcu1
Distribution (ksi) C1
C2 No. Specimens No. Lots Approval Class Mean 28.6 24.9 26.0 26.8 Minimum 20.5 Maximum 27.5
Ec1 C.V.(%) 12.2
(Msi) No. Specimens 1 4 1 1
No. Lots 1 3 1 1 Approval Class Screening Screening Screening Screening Mean
ν12c No. Specimens
No. Lots Approval Class Mean Minimum Maximum
C.V.(%)
B-value ε1cu
Distribution (%) C1
C2 No. Specimens
No. Lots Approval Class (1) Values couldn’t be calculated for those properties that do not appear, because the measured stress-strain curve
was linear to failure.

MIL-HDBK-17-4A Volume 4, Section 3 Materials Properties Data
233
MATERIAL: TRIMARC-1/Ti-6Al-2Sn-4Zr-2Mo wire/fiber wound panel Table 3.8.2.2.2(d) SiC/Ti panel MACHINING: Water Jet/Diamond Grind FIBER VOLUME: 0.273-0.324 Trimarc-1/Ti 6-2-4-2 FIBER SPACING: 130 fibers/inch Compression, 1-axis (0.008 in/fiber) [0]10 SPECIMEN GEOMETRY: Straight-sided 700, Air GAGE THICKNESS: 0.0799-0.0913 in MODULUS Screening GAGE WIDTH: 0.6063-0.6259 in CALCULATION: Least squares fit TEST METHOD: Sec. 1.4.2.2 PRE-TEST EXPOSURE: None SURFACE COND: As received NORMALIZED BY: Not normalized SOURCE: AFRL/MLLM Temperature °F 7001 7001 7001 7001 Environment Air Air Air Air Fiber Volume Fraction 29.5 28.2-29.2 28.0 32.8 Strain Rate (1/s) 1·10-5 1·10-4 1·10-3 8·10-4
Mean Minimum Maximum C.V.(%)
B-value Fpl1
Distribution (ksi) C1
C2 No. Specimens No. Lots Approval Class Mean 247 235 266 152 Minimum 162 Maximum 265
C.V.(%) 20.8
B-value 31.8 Fcy1
0 02. Distribution Normal
(ksi) C1 234.7 C2 48.74
No. Specimens 1 4 1 1 No. Lots 1 3 1 1 Approval Class Screening Screening Screening Screening Mean 351 283 286 Minimum Maximum
C.V.(%)
B-value Fcy1
0 2. Distribution
(ksi) C1 C2
No. Specimens 1 1 1 1
No. Lots 1 1 1 1 Approval Class Screening Screening Screening Screening (1) Values couldn’t be calculated for those properties that do not appear, because the measured stress-strain curve
was linear to failure.

MIL-HDBK-17-4A Volume 4, Section 3 Materials Properties Data
234
MATERIAL: TRIMARC-1/Ti-6Al-2Sn-4Zr-2Mo wire/fiber wound panel Table 3.8.2.2.2(e) SiC/Ti panel MACHINING: Water Jet/Diamond Grind FIBER VOLUME: 0.273-0.328 Trimarc-1/Ti 6-2-4-2 FIBER SPACING: 130 fibers/inch Compression, 2-axis (0.008 in/fiber) [90]10 SPECIMEN GEOMETRY: Straight-sided 73, 325, Air GAGE THICKNESS: 0.0799-0.0913 in MODULUS Screening GAGE WIDTH: 0.6063-0.6259 in CALCULATION: Least squares fit TEST METHOD: Sec. 1.4.2.2 PRE-TEST EXPOSURE: None SURFACE COND: As received NORMALIZED BY: Not normalized SOURCE: AFRL/MLLM Temperature °F 731 731 3251 3251 3251 Environment Air Air Air Air Air Fiber Volume Fraction 28.4-29.8 32.4 27.3 28.9-30.0 32.4 Strain Rate (1/s) 1·10-4 8·10-4 1·10-4 1·10-4 8·10-4
Mean Minimum Maximum C.V.(%)
B-value Fcu2
Distribution (ksi) C1
C2 No. Specimens No. Lots Approval Class Mean 23.3 22.2 19.7 20.5 21.6 Minimum 22.7 21.8 19.5 20.1 21.1 Maximum 24.0 22.4 19.9 20.9 22.4
Ec2 C.V.(%) 2.09 1.56 1.95 3.35
(Msi) No. Specimens 6 3 2 3 3
No. Lots 3 1 1 2 1 Approval Class Screening Screening Screening Screening Screening Mean
c23ν No. Specimens
No. Lots Approval Class Mean Minimum Maximum
C.V.(%)
B-value ε2cu
Distribution (%) C1
C2 No. Specimens
No. Lots Approval Class (1) Values couldn’t be calculated for those properties that do not appear, because the measured stress-strain curve
was linear to failure.

MIL-HDBK-17-4A Volume 4, Section 3 Materials Properties Data
235
MATERIAL: TRIMARC-1/Ti-6Al-2Sn-4Zr-2Mo wire/fiber wound panel Table 3.8.2.2.2(f) SiC/Ti panel MACHINING: Water Jet/Diamond Grind FIBER VOLUME: 0.273-0.324 Trimarc-1/Ti 6-2-4-2 FIBER SPACING: 130 fibers/inch Compression, 2-axis (0.008 in/fiber) [90]10 SPECIMEN GEOMETRY: Straight-sided 73, 325, Air GAGE THICKNESS: 0.0799-0.0913 in MODULUS Screening GAGE WIDTH: 0.6063-0.6259 in CALCULATION: Least squares fit TEST METHOD: Sec. 1.4.2.2 PRE-TEST EXPOSURE: None SURFACE COND: As received NORMALIZED BY: Not normalized SOURCE: AFRL/MLLM Temperature °F 731 731 3251 3251 3251 Environment Air Air Air Air Air Fiber Volume Fraction 28.4-29.8 32.4 27.3 28.9-30.0 32.4 Strain Rate (1/s) 1·10-4 8·10-4 1·10-4 1·10-4 8·10-4
Mean Minimum Maximum C.V.(%)
B-value Fpl2
Distribution (ksi) C1
C2 No. Specimens No. Lots Approval Class Mean 142 313 107 111 107 Minimum 133 120 107 108 106 Maximum 154 137 108 115 108
C.V.(%) 5.31
B-value 119 Fcy2
0 02. Distribution Normal
(ksi) C1 141.8 C2 7.527
No. Specimens 6 3 2 3 3 No. Lots 3 1 1 2 1 Approval Class Screening Screening Screening Screening Screening Mean 196 195 147 152 155 Minimum 194 193 146 151 155 Maximum 198 196 148 153 156
C.V.(%) .835
B-value 191 Fcy2
0 2. Distribution Normal
(ksi) C1 196 C2 1.64
No. Specimens 6 3 2 3 3
No. Lots 3 1 1 2 1 Approval Class Screening Screening Screening Screening Screening (1) Values couldn’t be calculated for those properties that do not appear, because the measured stress-strain curve
was linear to failure.

MIL-HDBK-17-4A Volume 4, Section 3 Materials Properties Data
236
MATERIAL: TRIMARC-1/Ti-6Al-2Sn-4Zr-2Mo wire/fiber wound panel Table 3.8.2.2.2(g) SiC/Ti panel MACHINING: Water Jet/Diamond Grind FIBER VOLUME: 0.273-0.328 Trimarc-1/Ti 6-2-4-2 FIBER SPACING: 130 fibers/inch Compression, 2-axis (0.008 in/fiber) [90]10 SPECIMEN GEOMETRY: Straight-sided 700, Air GAGE THICKNESS: 0.0799-0.0913 in MODULUS Screening GAGE WIDTH: 0.6063-0.6259 in CALCULATION: Least squares fit TEST METHOD: Sec. 1.4.2.2 PRE-TEST EXPOSURE: None SURFACE COND: As received NORMALIZED BY: Not normalized SOURCE: AFRL/MLLM Temperature °F 7001 7001 7001 7001 7001 Environment Air Air Air Air Air Fiber Volume Fraction 28.1 28.1 28.9-30.0 29.8 32.4-32.8 Strain Rate (1/s) 1·10-5 1·10-4 1·10-4 1·10-3 8·10-4
Mean Minimum Maximum C.V.(%)
B-value Fcu2
Distribution (ksi) C1
C2 No. Specimens No. Lots Approval Class Mean 21.5 21.3 20.9 21.3 19.8 Minimum 18.8 19.2 Maximum 22.9 20.4
Ec2 C.V.(%)
(Msi) No. Specimens 1 1 3 1 2
No. Lots 1 1 3 1 1 Approval Class Screening Screening Screening Screening Screening Mean
c23ν
No. Specimens
No. Lots Approval Class Mean Minimum Maximum
C.V.(%)
B-value ε2cu
Distribution (%) C1
C2 No. Specimens
No. Lots Approval Class (1) Values couldn’t be calculated for those properties that do not appear, because the measured stress-
strain curve was linear to failure.

MIL-HDBK-17-4A Volume 4, Section 3 Materials Properties Data
237
MATERIAL: TRIMARC-1/Ti-6Al-2Sn-4Zr-2Mo wire/fiber wound panel Table 3.8.2.2.2(h) SiC/Ti panel MACHINING: Water Jet/Diamond Grind FIBER VOLUME: 0.273-0.324 Trimarc-1/Ti 6-2-4-2 FIBER SPACING: 130 fibers/inch Compression, 2-axis (0.008 in/fiber) [90]10 SPECIMEN GEOMETRY: Straight-sided 700, Air GAGE THICKNESS: 0.0799-0.0913 in MODULUS Screening GAGE WIDTH: 0.6063-0.6259 in CALCULATION: Least squares fit TEST METHOD: Sec. 1.4.2.2 PRE-TEST EXPOSURE: None SURFACE COND: As received NORMALIZED BY: Not normalized SOURCE: AFRL/MLLM Temperature °F 7001 7001 7001 7001 7001 Environment Air Air Air Air Air Fiber Volume Fraction 28.1 28.1 28.9-30.0 29.8 32.4-32.8 Strain Rate (1/s) 1·10-5 1·10-4 1·10-4 1·10-3 8·10-4
Mean Minimum Maximum C.V.(%)
B-value Fpl2
Distribution (ksi) C1
C2 No. Specimens No. Lots Approval Class Mean 87.8 86.7 90.1 92.2 89.6 Minimum 85.7 87.8 Maximum 96.5 91.3
C.V.(%)
B-value Fcy2
0 02. Distribution
(ksi) C1 C2
No. Specimens 1 1 3 1 2 No. Lots 1 1 3 1 1 Approval Class Screening Screening Screening Screening Screening Mean 111 114 116 123 117 Minimum 115 117 Maximum 118 117
C.V.(%)
B-value Fcy2
0 2. Distribution
(ksi) C1 C2
No. Specimens 1 1 3 1 2
No. Lots 1 1 3 1 1 Approval Class Screening Screening Screening Screening Screening (1) Values couldn’t be calculated for those properties that do not appear, because the measured stress-strain curve
was linear to failure.

MIL-HDBK-17-4A Volume 4, Section 3 Materials Properties Data
238
Trimarc-1/Ti 6-2-4-2
-400
-350
-300
-250
-200
-150
-100
0 100 200 300 400 500 600 700 800
0.001 (1/s) Strain Rate 0.02 YS0.0001 (1/s) Strain Rate 0.02 YS0.00001 (1/s) Strain Rate 0.02 YS0.0008 (1/s) Strain Rate 0.02 YS*
F1cy
0.02
(ks
i)
Temperature (oF)
27 - 32 Vf
FIGURE 3.8.2.2.2(a) Compressive longitudinal 0.02 offset-strength of [0]10 laminate as a function of
temperature and strain rate. Vf for strain rate of 0.0008 s-1 was 32-33.
-360
-340
-320
-300
-280
-260
-240
0 100 200 300 400 500 600 700 800
0.0001 (1/s) Strain Rate 0.2 YS0.00001 (1/s) Strain Rate 0.2 YS0.0008 (1/s) Strain Rate 0.2 YS*
F1cy
0.2 (k
si)
Temperature (oF)
27 - 32 Vf
FIGURE 3.8.2.2.2(b) Compressive longitudinal 0.2 offset-strength of [0]10 laminate as a function of
temperature and strain rate. * Vf for strain rate of 0.0008 s-1 was 32-33.

MIL-HDBK-17-4A Volume 4, Section 3 Materials Properties Data
239
Trimarc-1/Ti 6-2-4-2
20
22
24
26
28
30
32
0 100 200 300 400 500 600 700 800
0.001 (1/s) Strain Rate 0.0001 (1/s) Strain Rate 0.00001 (1/s) Strain Rate 0.0008 (1/s) Strain Rate*
E1c (
Msi
)
Temperature (oF)
27 - 32 Vf
FIGURE 3.8.2.2.2(c) Compressive modulus of [0]10 laminate as a function of temperature and
strain rate. *Volume fraction for strain rate of 0.0008 s-1 was 32-33.
-160
-140
-120
-100
-80
-60
-40
-20
0
0 100 200 300 400 500 600 700 800
0.001 (1/s) Strain Rate 0.02 YS0.0001 (1/s) Strain Rate 0.02 YS0.00001 (1/s) Strain Rate 0.02 YS0.0008 (1/s) Strain Rate 0.02 YS*
F2cy
0.02
(ks
i)
Temperature (oF)
27 - 32 Vf
FIGURE 3.8.2.2.2(d) Compressive transverse 0.02 offset-strength of [90]10 laminate as a function of
temperature and strain rate. *Vf for strain rate of 0.0008 s-1 was 32-33.

MIL-HDBK-17-4A Volume 4, Section 3 Materials Properties Data
240
Trimarc-1/Ti 6-2-4-2
-220
-200
-180
-160
-140
-120
-100
-80
0 100 200 300 400 500 600 700 800
0.001 (1/s) Strain Rate 0.2 YS0.0001 (1/s) Strain Rate 0.2 YS0.00001 (1/s) Strain Rate 0.2 YS0.0008 (1/s) Strain Rate 0.2 YS*
F2cy
0.2 (
ksi)
Temperature (oF)
27 - 32 Vf
FIGURE 3.8.2.2.2(e) Compressive transverse 0.2 offset-strength of [90]10 laminate as a function of
temperature and strain rate. *Vf for strain rate of 0.0008 s-1 was 32-33.
18
19
20
21
22
23
24
25
0 100 200 300 400 500 600 700 800
0.001 (1/s) Strain Rate 0.0001 (1/s) Strain Rate 0.00001 (1/s) Strain Rate 0.0008 (1/s) Strain Rate*
E2c (
Msi
)
Temperature (oF)
27 - 32 Vf
FIGURE 3.8.2.2.2(f) Compressive modulus of [90]10 laminate as a function of temperature and strain
rate. *Vf for strain rate of 0.0008 s-1 was 32-33
MIL-HDBK-17-4A Volume 4, Section 3 Materials Properties Data
241
Trimarc-1/Ti 6-2-4-2
-300000
-250000
-200000
-150000
-100000
-50000
0
-0.02 -0.015 -0.01 -0.005 0
Str
ess
(ksi
)
Strain (in/in)
27.9 Vf
FIGURE 3.8.2.2.2(g) Typical compressive behavior for [0]10 laminae at 73°F at a strain rate of 1X10⁻⁴ s-1.
-350000
-300000
-250000
-200000
-150000
-100000
-50000
0
-0.02 -0.015 -0.01 -0.005 0 0.005
Str
ess
(psi
)
Strain (in/in)
32.8 Vf
FIGURE 3.8.2.2.2(h)Typical compressive behavior for [0]10 laminae at 700°F (370°C) at a strain rate
of 8X10⁻⁴ s-1.

MIL-HDBK-17-4A Volume 4, Section 3 Materials Properties Data
242
Trimarc-1/Ti 6-2-4-2
-250000
-200000
-150000
-100000
-50000
0
-0.014 -0.012 -0.01 -0.008 -0.006 -0.004 -0.002 0
Str
ess
(psi
)
Strain (in/in)
28.4 Vf
FIGURE 3.8.2.2.2(i) Typical compressive behavior for [90]10 laminae at 73°F at a strain rate of 1X10⁻⁴ s-1.
-200000
-150000
-100000
-50000
0
-0.016 -0.014 -0.012 -0.01 -0.008 -0.006 -0.004 -0.002 0
Str
ess
(ksi
)
Strain (in/in)
32.4 Vf
FIGURE 3.8.2.2.2(j) Typical compressive behavior for [90]10 laminae at 325°F at a strain rate of 8X10⁻⁴ s-1.

MIL-HDBK-17-4A Volume 4, Section 3 Materials Properties Data
243
3.8.3 ALUMINA/TITANIUM This section is reserved for future use. 3.8.4 OTHER/TITANIUM This section is reserved for future use. 3.9 OTHER MATRIX COMPOSITES This section is reserved for future use.

MIL-HDBK-17-4A Volume 4, Appendix A Typical Pushout Test Data
244
APPENDIX A. TYPICAL PUSHOUT TEST DATA A1. FIBER PUSHOUT
TABLE A1(a) Debond load vs. specimen thickness for SCS-6/Ti-24-11 (Section 1.4.2.13.1).
Specimen thickness (mm)
Debond load (N)
.149 4.56
.211 6.06
.312 15.6
.322 14.3
.343 15.8
.382 19.6
.414 18.8
.452 21.8
.483 26.8
.534 31.8
.569 45.3
TABLE A1(b) Typical failure loads for various diameter WC punches (Section 1.4.2.13.1).
Punch Dia. (mm) Failure Load (N) 25 2 50 5 75 20 100 40 115 50-55 127 60-70
MIL-HDBK-17-4A Volume 4, Appendix A Typical Pushout Test Data
245
FIGURE A1(a) The effect of specimen thickness on the observed debond strength of SCS-6/Ti24-11 composite system (Section 1.4.2.13.11).

MIL-HDBK-17-4A Volume 4, Appendix A Typical Pushout Test Data
246
FIGURE A1(b) Pushout test data sheet (Section 1.4.2.13.14).

MIL-HDBK-17-4A Volume 4, Appendix B Raw Data Tables for Matrix Materials
247
APPENDIX B. RAW DATA TABLES FOR MATRIX MATERIALS HOW TO READ THE RAW DATA TABLES Rows in any raw data table are organized by specimen number. Each column contains experimental data specific to that specimen. Since the number of experimental data categories for each specimen is quite high, 20 or more, all the data for a given set of specimen are shown on two tables. Each table is cross-referenced by specimen number, and appear sequentially. However, if there are relatively few specimens, then the two data tables will be shown on the same page. Otherwise, two pages or more are required to show all the raw data for a given specimen. In the upper right hand corner of each raw data table, a small table appears. This table is depicted, with a brief description for each entry, below.
Table B4.1(a) (1 of 2) Ti-15-3 Tension [0]1 NASA ❻Raw Data
This line contains three entries. First entry is the table number, as given in the Table of Contents. The
second entry is a letter designator, indicating a subsection within the table. Generally, subsections are organized according to test type. The final entry indicates page and total number of pages within a sub-section.
Material name.
Test type, i.e., tension, compression, fatigue.
Specimen orientation and ply count, if applicable.
Data source. ❻ Data type, given as raw or normalized. B1. ALUMINUMS This section is reserved for future use. B2. COPPERS This section is reserved for future use. B3. MAGNESIUMS This section is reserved for future use. B4. TITANIUMS

MIL-HDBK-17-4A Volume 4, Appendix B Raw Data Tables for Matrix Materials
248
B4.1 Ti 15V 3Cr 3Al-3Sn (Section 3.3.5.1) MATERIAL: Ti-15-3 Table B4.1(a) (1 of 2) Ti-15-3 NEAT MATRIX: Ti-15V-3Cr-3Al-3Sn Tension HEAT TREATMENT: 1292°F/24h (vac.) NASA-GRC TEST METHOD: Section 1.9.2.1 Raw Data Specimen
No. Lot I.D. (Plate)
Test Temp
Strain Rate
Et (1)
Fpl Fty0 02. Fty0.2 Ftu ε tu RA Product
Form Test
Environment νm
(°F) (1/s) (Msi) (ksi) (ksi) (ksi) (ksi) (%) (%) T36 B934021 800 1x10⁻⁶ 10.8 20 29 43 - >3 - HIP Sheet air - T42 B934021 800 1x10⁻⁴ 11.3 59 73 84 - >3.8 - HIP Sheet air - T33 B934021 800 1x10⁻⁸ 17 5.2 40 - - >1 - HIP Sheet air - T27 B934021 900 1x10⁻⁴ 10.9 50 65 75 - >8 - HIP Sheet air - T45 B934021 600 1x10⁻⁴ 11.4 69 78 87 - >8 - HIP Sheet air - T40 B934021 400 1x10⁻⁴ 12.6 65 84 96 - >8 - HIP Sheet air - T37 B934021 75 1x10⁻⁴ 13 94 108 117 - >8 - HIP Sheet air - 7_1 B934027 1000 1x10⁻⁴ 10.5 23 33 42 43 >8 - HIP Sheet air - 7_22 B934027 900 1x10⁻⁴ 10.7 57 65 74 75 >8 - HIP Sheet air - 7_15 B934027 1000 1x10⁻⁶ 5.3 6 6 8 24 >8 - HIP Sheet air - 7_ex B934027 400 1x10⁻⁶ 12 80 85 96 - >8 - HIP Sheet air - 7_6 B934027 400 1x10⁻³ 12.3 81 87 95 - >8 - HIP Sheet air - 7_18 B934027 1000 1x10⁻³ 11 50 60 67 67 >8 - HIP Sheet air - B8 B934027 800 1x10⁻⁵ 10.8 56 69 83 - >4 - HIP Sheet air - V700-1 87H? 75 2x10⁻³ 13 111 117 124 127 20.2 - HIP Foil air - 16211_B B934027 75 8.3x10⁻⁵ 12.4 - - 114 124 20.7 37.8 HIP Sheet 5 ksi Helium - 16210_A B934027 75 8.3x10⁻⁵ 11.9 - - 110 120 20.3 40.3 HIP Sheet 5 ksi Helium - 16215_F B934027 75 8.3x10⁻⁵ 12.1 - - 112 122 22.1 39.5 HIP Sheet 5 ksi Helium - 16212_C B934027 75 8.3x10⁻⁵ 12 - - 116 125 16.8 22 HIP Sheet 5 ksi Hydrogen - 16213_D B934027 75 8.3x10⁻⁵ 12.5 - - 114 125 17.2 27.1 HIP Sheet 5 ksi Hydrogen - 16214_E B934027 75 8.3x10⁻⁵ 12.3 - - 114 124 17.5 27.6 HIP Sheet 5 ksi Hydrogen - 1) Modulus was determined by least squares analysis up to the proportional limit

MIL-HDBK-17-4A Volume 4, Appendix B Raw Data Tables for Matrix Materials
249
MATERIAL: Ti-15-3 Table B4.1(a) (2 of 2) Ti-15-3 NEAT MATRIX: Ti-15V-3Cr-3Al-3Sn Tension HEAT TREATMENT: 1292°F/24h (vac.) NASA-GRC TEST METHOD: Section 1.9.2.1 Raw Data Specimen
No. Machining
Method Specimen Geometry
Specimen Dimensions
Surface Condition
Test Date
Failure Location
Failure Mode
T36 turned and ground Dogbone .25" dia. x .5" gage as-ground 5/2/96 interrupted - T42 turned and ground Dogbone .25" dia. x .5" gage as-ground 5/3/96 interrupted - T33 turned and ground Dogbone .25" dia. x .5" gage as-ground 5/6/96 interrupted - T27 turned and ground Dogbone .25" dia. x .5" gage as-ground 11/13/96 interrupted - T45 turned and ground Dogbone .25" dia. x .5" gage as-ground 11/14/96 interrupted - T40 turned and ground Dogbone .25" dia. x .5" gage as-ground 11/14/96 interrupted - T37 turned and ground Dogbone .25" dia. x .5" gage as-ground 11/14/96 interrupted - 7_1 turned and ground Dogbone .25" dia. x .5" gage as-ground 2/6/97 interrupted - 7_22 turned and ground Dogbone .25" dia. x .5" gage as-ground 2/6/97 interrupted - 7_15 turned and ground Dogbone .25" dia. x .5" gage as-ground 3/22/97 interrupted - 7_ex turned and ground Dogbone .25" dia. x .5" gage as-ground 3/23/97 interrupted - 7_6 turned and ground Dogbone .25" dia. x .5" gage as-ground 4/11/97 interrupted - 7_18 turned and ground Dogbone .25" dia. x .5" gage as-ground 4/11/97 interrupted - B8 turned and ground Dogbone .25" dia. x .5" gage as-ground 7/31/97 interrupted - V700-1 turned and ground Dogbone .125" dia. x .815" gage as-ground 3/5/88 gage ductile failure 16211_B turned and ground Dogbone .188" dia. x .75" gage as-ground 7/2/97 gage ductile failure 16210_A turned and ground Dogbone .188" dia. x .75" gage as-ground 7/2/97 gage ductile failure 16215_F turned and ground Dogbone .188" dia. x .75" gage as-ground 7/3/97 gage ductile failure 16212_C turned and ground Dogbone .188" dia. x .75" gage as-ground 7/3/97 gage ductile failure 16213_D turned and ground Dogbone .188" dia. x .75" gage as-ground 7/3/97 gage ductile failure 16214_E turned and ground Dogbone .188" dia. x .75" gage as-ground 7/3/97 gage ductile failure

MIL-HDBK-17-4A Volume 4, Appendix B Raw Data Tables for Matrix Materials
250
MATERIAL: Ti-15-3 Table B4.1(b) (1 of 2) Ti-15-3 TEST METHOD: Sec. 1.9.2.4 Fatigue Fatigue NEAT MATRIX: Ti-15V-3Cr-3Al-3Sn WAVEFORM: Triangular PRODUCT FORM: Hipped foils PRE-TEST EXPOSURE: 1292°F/24 hrs. NASA GRC PRODUCT DIMENSIONS: 10” x 14” x 0.44” TEST ATMOSPHERE: Air Raw Data LAY-UP: SPECIMEN GEOMETRY: Cylindrical dogbone PLY COUNT: SURFACE CONDITION: As-ground MACHINING METHOD: Turned and ground SPECIMEN DIMENSIONS: 5” x 0.406” dia.
at Nf / 2
Specimen No.
Fiber v/o
Lot I.D. (Plate)
Test Temp.
E at N=1 E
Total
Strain rate maxε minε maxσ minσ Freq. Nf
(oF) (Msi) (Msi) (1/s) (%) (%) (psi) (psi) (Hz) T1 B934021 800 11.8 - 0.001 0.500 -0.500 68550 -64264 0.05 4956 T2 B934021 800 11.7 13.6 0.001 0.300 -0.300 43621 -37808 0.08 22237 T3 B934021 800 11.6 - 0.001 0.221 -0.219 37147 -22211 0.11 30191 T4 B934021 800 11.9 - 0.001 0.200 -0.200 - - 0.13 >419714 T5 B934021 800 12.2 14.0 0.001 0.350 -0.350 52235 -45754 0.07 >119325 T7 B934021 800 11.9 13.6 0.001 0.500 -0.500 - - 0.05 38026 T6 B934021 800 11.8 12.5 0.001 1.500 0.075 91351 -86628 0.04 1435 T8 B934021 800 11.5 12.7 0.001 1.200 0.060 71774 -73228 0.04 6260 T10 B934021 400 12.6 12.6 0.001 0.500 -0.500 60967 -65459 0.05 15100 T11 B934021 400 12.1 12.3 0.001 0.450 -0.450 53763 -57064 0.06 21509 T13 B934021 400 12.1 12.1 0.001 0.700 -0.700 81689 -85372 0.04 2050 T16 B934021 400 11.9 12.5 0.001 0.400 -0.400 48483 -50925 0.06 >118058 T14 B934021 400 12.0 12.0 0.001 2.000 0.100 96811 -93243 0.03 668 T15 B934021 400 12.1 12.0 0.001 1.200 0.060 88213 -47048 0.04 4011 T17 B934021 75 13.1 13.1 0.001 0.600 -0.600 76888 -79348 0.04 9643 T18 B934021 75 13.3 13.2 0.001 1.200 0.060 117951 -30213 0.04 4447 T19 B934021 75 13.2 13.2 0.001 1.050 0.053 118764 -10543 0.05 7272
MIL-HDBK-17-4A Volume 4, Appendix B Raw Data Tables for Matrix Materials
251
MATERIAL: Ti-15-3 Table B4.1(b) (2 of 2) Ti-15-3 FIBER: TEST METHOD: Sec. 1.9.2.4 Fatigue Fatigue NEAT MATRIX: Ti-15V-3Cr-3Al-3Sn WAVEFORM: Triangular PRODUCT FORM: Hipped foils PRE-TEST EXPOSURE: 1292°F/24 hrs. NASA GRC PRODUCT DIMENSIONS: 10” x 14” x 0.44” TEST ATMOSPHERE: Air Raw Data LAY-UP: SPECIMEN GEOMETRY: Cylindrical dogbone PLY COUNT: SURFACE CONDITION: As-ground MACHINING METHOD: Turned and ground SPECIMEN DIMENSIONS: 5” x 0.406” dia.
Gage Dimensions
l w t Specimen
No. Control Mode R
(in.) (in.) (in.)
Test Date
Failure Location Comments
Specimen Dimensions
Failure Mode
T1 strain -1 0.5 0.406 - 5/17/94 gage - T2 strain -1 0.5 0.406 - 5/25/94 gage at t/c premature failure - T3 strain -1 0.5 0.406 - 5/31/94 gage at t/c premature failure - T4 strain -1 0.5 0.406 - 6/8/94 run-out - T5 strain -1 0.5 0.406 - 7/1/94 run-out - T7 strain -1 0.5 0.406 - 8/30/94 radius - T6 strain 0.05 0.5 0.406 - 8/16/94 gage - T8 strain 0.05 0.5 0.406 - 9/9/94 radius - T10 strain -1 0.5 0.406 - 5/10/95 gage - T11 strain -1 0.5 0.406 - 5/16/95 gage - T13 strain -1 0.5 0.406 - 5/23/95 gage - T16 strain -1 0.5 0.406 - 6/14/95 run-out - T14 strain 0.05 0.5 0.406 - 5/25/95 gage - T15 strain 0.05 0.5 0.406 - 5/30/95 gage - T17 strain -1 0.5 0.406 - 7/17/95 gage - T18 strain 0.05 0.5 0.406 - 7/20/95 gage - T19 strain 0.05 0.5 0.406 - 7/24/95 gage -
MIL-HDBK-17-4A Volume 4, Appendix C Raw Data Tables for Titanium Matrix Composites
252
APPENDIX C. RAW DATA TABLES FOR METAL MATRIX COMPOSITE MATERIALS
HOW TO READ THE RAW DATA TABLES Rows in any raw data table are organized by specimen number. Each column contains experimental data specific to that specimen. Since the number of experimental data categories for each specimen is quite high, 20 or more, all the data for a given set of specimen are shown on two tables. Each table is cross-referenced by specimen number, and appear sequentially. However, if there are relatively few specimens, then the two data tables will be shown on the same page. Otherwise, two pages or more are required to show all the raw data for a given specimen. In the upper right hand corner of each raw data table, a small table appears. This table is depicted, with a brief description for each entry, below.
Table B4.1(a) (1 of 2) Ti-15-3 Tension [0]1 NASA ❻Raw Data
This line contains three entries. First entry is the table number, as given in the Table of Contents. The
second entry is a letter designator, indicating a subsection within the table. Generally, subsections are organized according to test type. The final entry indicates page and total number of pages within a sub-section.
Material name.
Test type, i.e., tension, compression, fatigue.
Specimen orientation and ply count, if applicable.
Data source. ❻ Data type, given as raw or normalized. C1. ALUMINUMS

MIL-HDBK-17-4A Volume 4, Appendix C Raw Data Tables for Titanium Matrix Composites
253
C1.1 Nextel 610 / SP Al (Section 3.5.2.1)
MATERIAL: Nextel 610 / SP Al Screening Data Table C1.1(a) (1 of 6) Nextel 610 / SP Al
FIBER: Nextel 610 SPECIMEN GEOMETRY: Straight-Sided Tension
MATRIX: 99.99% Al SURFACE CONDITION: As Received 0° PRODUCT FORM: Panel MACHINING METHOD: Diamond Cutting Wheel 3M LAY-UP: 0° PRE-TEST EXPOSURE: None Raw Data TEST METHOD: MMC-TM-401 TEST ENVIRONMENT: Laboratory Air
Specimen No. Fiber v/o
Lot I.D. (Panel)
Test Temp
Strain Rate
Et1 Prop.
Limit Fty
10 02. Fty
10 2.
Ftu1 ε1
tf ν12t Comments
(°F) (1/s) (Msi) (ksi) (ksi) (ksi) (ksi) (%) 551/4-L1 65.0 551 73 0.0100 36.8 266.8 0.790 551/4-L2 65.0 551 73 0.0100 37.9 272.5 0.780 551/4-L3 65.0 551 73 0.0100 38.1 268.7 0.760 551/4-L4 65.0 551 73 0.0100 37.1 272.8 0.790 551/4-L5 65.0 551 73 0.0100 38.1 271.7 0.770 551/4-L6 65.0 551 73 0.0100 37.2 270.9 0.780 551/4-L7 65.0 551 73 0.0100 36.4 260.3 0.760 599/3-L2 65.0 599 73 0.0100 39.8 283.8 599/3-L3 65.0 599 73 0.0100 39.3 267.6 0.740 599/3-L4 65.0 599 73 0.0100 39.2 281.7 0.780 599/3-L5 65.0 599 73 0.0100 38.3 282.3 0.780 599/3-L6 65.0 599 73 0.0100 39.5 277.1 0.720 600/4-L1 65.0 600 73 0.0100 34.8 243.5 0.760 600/4-L3 65.0 600 73 0.0100 39.2 270.8 0.730 600/4-L4 65.0 600 73 0.0100 38.4 271.6 600/4-L5 65.0 600 73 0.0100 37.9 268.1 0.760

MIL-HDBK-17-4A Volume 4, Appendix C Raw Data Tables for Titanium Matrix Composites
254
MATERIAL: Nextel 610 / SP Al Screening Data Table C1.1(a) (2 of 6) Nextel 610 / SP Al
FIBER: Nextel 610 SPECIMEN GEOMETRY: Straight-Sided Tension MATRIX: 99.99% Al SURFACE CONDITION: As Received 0° PRODUCT FORM: Panel MACHINING METHOD: Diamond Cutting Wheel 3M LAY-UP: 0° PRE-TEST EXPOSURE: None Raw Data TEST METHOD: MMC-TM-401 TEST ENVIRONMENT: Laboratory Air
Specimen No.
Test Date
Fail Failure Mode
Reduction of Area
Elongation Area Load @ 0.2% Offset
Ultimate Load
Width Thickness Original Gage
Length
Final Gage
Length
Final Width
Final Thickness
Final Area
551/4-L1 4/13/95 gage 0.0200 5337 1.5000
551/4-L2 4/13/95 tab 0.0201 5458 1.5000 551/4-L3 4/13/95 gage 0.0202 5425 1.5000 551/4-L4 4/13/95 tab 0.0202 5519 1.5000 551/4-L5 4/13/95 tab 0.0203 5501 1.5000 551/4-L6 4/13/95 tab 0.0202 5481 1.5000 551/4-L7 4/13/95 gage 0.0201 5238 1.5000 599/3-L2 6/1/95 tab 0.0191 5431 1.5000 599/3-L3 6/1/95 tab 0.0194 5184 1.5000 599/3-L4 6/1/95 gage 0.0197 5546 1.5000 599/3-L5 6/1/95 gage 0.0196 5546 1.5000 599/3-L6 6/1/95 gage 0.0195 5398 1.5000 600/4-L1 6/1/95 gage 0.0203 4948 1.5000 600/4-L3 6/1/95 gage 0.0203 5321 1.5000 600/4-L4 6/1/95 gage 0.0203 5508 1.5000 600/4-L5 6/1/95 gage 0.0202 5404 1.5000

MIL-HDBK-17-4A Volume 4, Appendix C Raw Data Tables for Titanium Matrix Composites
255
MATERIAL: Nextel 610 / SP Al Screening Data Table C1.1(a) (3 of 6) Nextel 610 / SP Al
FIBER: Nextel 610 SPECIMEN GEOMETRY: Straight-Sided Tension MATRIX: 99.99% Al SURFACE CONDITION: As Received 0° PRODUCT FORM: Panel MACHINING METHOD: Diamond Cutting Wheel 3M LAY-UP: 0° PRE-TEST EXPOSURE: None Raw Data TEST METHOD: MMC-TM-401 TEST ENVIRONMENT: Laboratory Air
Specimen No. Fiber v/o
Lot I.D. (Panel)
Test Temp
Strain Rate
Et1 Prop.
Limit Fty
10 02. Fty
10 2.
Ftu1 ε1
tf ν12t Comments
(°F) (1/s) (Msi) (ksi) (ksi) (ksi) (ksi) (%) 600/4-L6 65.0 600 73 0.0100 39.4 267.7 0.740 600/4-L7 65.0 600 73 0.0100 37.5 252.8 0.730 602/4-L1 65.0 602 73 0.0100 37.2 253.5 0.740 602/4-L2 65.0 602 73 0.0100 38.8 240.2 0.650 602/4-L3 65.0 602 73 0.0100 39.0 269.6 Test Ramped Twice 602/4-L4 65.0 602 73 0.0100 36.9 263.7
602/4-L5 65.0 602 73 0.0100 37.0 267.5 0.770 602/4-L6 65.0 602 73 0.0100 38.2 261.6 0.720 602/4-L7 65.0 602 73 0.0100 36.6 247.5 0.740 883A/3-L1 65.0 883A 73 0.0150 251.8 0.630 883A/3-L2 65.0 883A 73 0.0150 271.7 0.670 883A/3-L3 65.0 883A 73 0.0150 266.2 0.770 883A/3-L4 65.0 883A 73 0.0150 284.8 0.750 883A/3-L5 65.0 883A 73 0.0150 258.3 0.760

MIL-HDBK-17-4A Volume 4, Appendix C Raw Data Tables for Titanium Matrix Composites
256
MATERIAL: Nextel 610 / SP Al Screening Data Table C1.1(a) (4 of 6) Nextel 610 / SP Al
FIBER: Nextel 610 SPECIMEN GEOMETRY: Straight-Sided Tension MATRIX: 99.99% Al SURFACE CONDITION: As Received 0° PRODUCT FORM: Panel MACHINING METHOD: Diamond Cutting Wheel 3M LAY-UP: 0° PRE-TEST EXPOSURE: None Raw Data TEST METHOD: MMC-TM-401 TEST ENVIRONMENT: Laboratory Air
Specimen No.
Test Date
Fail Failure Mode
Reduction of Area
Elongation Area Load @ 0.2% Offset
Ultimate Load
Width Thick-ness
Original Gage
Length
Final Gage
Length
Final Width
Final Thickness
Final Area
600/4-L6 6/1/95 gage 0.0204 5371 1.5000 600/4-L7 6/1/95 gage 0.0204 5454 1.5000 602/4-L1 6/1/95 gage 0.0204 5337 1.5000 602/4-L2 6/1/95 gage 0.0204 5040 1.5000 602/4-L3 6/20/96 gage 5571 0.3753 0.0590 1.5000 602/4-L4 6/20/96 tab 6072 0.3772 0.0593 1.5000 602/4-L5 6/20/96 gage 5872 0.3752 0.0588 1.5000 602/4-L6 6/20/96 gage 6244 0.3758 0.0584 1.5000 602/4-L7 6/20/96 gage 5682 0.3751 0.0587 1.5000 883A/3-L1 6/1/95 tab 0.0198 5310 1.5000 883A/3-L2 6/1/95 gage 0.0198 5002 1.5000 883A/3-L3 6/1/95 tab 0.0203 5146 1.5000 883A/3-L4 6/1/95 tab 0.0203 4865 1.5000 883A/3-L5 6/1/95 gage 0.0204 5501 1.5000

MIL-HDBK-17-4A Volume 4, Appendix C Raw Data Tables for Titanium Matrix Composites
257
MATERIAL: Nextel 610 / SP Al Screening Data Table C1.1(a) (5of 6) Nextel 610 / SP Al
FIBER: Nextel 610 SPECIMEN GEOMETRY: Straight-Sided Tension MATRIX: 99.99% Al SURFACE CONDITION: As Received 0° PRODUCT FORM: Panel MACHINING METHOD: Diamond Cutting Wheel 3M LAY-UP: 0° PRE-TEST EXPOSURE: None Raw Data TEST METHOD: MMC-TM-401 TEST ENVIRONMENT: Laboratory Air
Specimen No. Fi-ber v/o
Lot I.D. (Panel)
Test Temp
Strain Rate
Et1 Prop.
Limit Fty
10 02. Fty
10 2.
Ftu1 ε1
tf ν12t Comments
(°F) (1/s) (Msi) (ksi) (ksi) (ksi) (ksi) (%) 883B/1-L2 65.0 883B 73 0.0150 255.3 0.660 883B/1-L3 65.0 883B 73 0.0150 274.5 0.700 883B/1-L4 65.0 883B 73 0.0150 279.6 0.710 883B/1-L5 65.0 883B 73 0.0150 281.4 0.690 883B/1-L6 65.0 883B 73 0.0150 270.2 0.690 601/1-L3 65.0 601 73 0.0150 39.5 266.1 0.720 0.270 measure Poisson's Ratio 601/2-L3 65.0 601 73 0.0150 38.7 252.5 0.690 0.310 measure Poisson's Ratio 602/1-L3 65.0 602 73 0.0150 39.2 256.3 0.700 0.310 measure Poisson's Ratio
MIL-HDBK-17-4A Volume 4, Appendix C Raw Data Tables for Titanium Matrix Composites
258
MATERIAL: Nextel 610 / SP Al Screening Data Table C1.1(a) (6of 6) Nextel 610 / SP Al
FIBER: Nextel 610 SPECIMEN GEOMETRY: Straight-Sided Tension MATRIX: 99.99% Al SURFACE CONDITION: As Received 0° PRODUCT FORM: Panel MACHINING METHOD: Diamond Cutting Wheel 3M LAY-UP: 0° PRE-TEST EXPOSURE: None Raw Data TEST METHOD: MMC-TM-401 TEST ENVIRONMENT: Laboratory Air
Specimen No.
Test Date
Fail Failure Mode
Reduction of Area
Elongation Area Load @ 0.2% Offset
Ultimate Load
Width Thickness Original Gage
Length
Final Gage
Length
Final Width
Final Thickness
Final Area
883B/1-L2 6/20/96 gage 6021 0.3747 0.0593 1.5000 883B/1-L3 6/20/96 tab 5643 0.3769 0.0596 1.5000 883B/1-L4 6/20/96 gage 5837 0.3762 0.0585 1.5000 883B/1-L5 6/20/96 gage 5637 0.3753 0.0589 1.5000 883B/1-L6 6/20/96 gage 6063 0.3757 0.0588 1.5000 601/1-L3 6/20/96 gage 6218 0.3750 0.0593 1.5000 601/2-L3 6/20/96 gage 6177 0.3752 0.0585 1.5000 602/1-L3 6/20/96 gage 5969 0.3757 0.0588 1.5000

MIL-HDBK-17-4A Volume 4, Appendix C Raw Data Tables for Titanium Matrix Composites
259
MATERIAL: Nextel 610 / SP Al Screening Data Table C1.1(b) (1 of 4) Nextel 610 / SP Al
FIBER: Nextel 610 SPECIMEN GEOMETRY: Straight-Sided Tension MATRIX: 99.99% Al SURFACE CONDITION: As Received 90° PRODUCT FORM: Panel MACHINING METHOD: Diamond Cutting Wheel 3M LAY-UP: 90° PRE-TEST EXPOSURE: None Raw Data TEST METHOD: MMC-TM-401 TEST ENVIRONMENT: Laboratory Air
Specimen No. Fiber v/o
Lot I.D. (Panel)
Test Temp.
Strain Rate
Et1 Prop.
Limit Fty
10 02.
Fty1
0 2. Ftu1 ε1
tf ν12t Comments
(°F) (1/s) (Msi) (ksi) (ksi) (ksi) (ksi) (%) 448/3-T1 65.0 448 73 0.010 25.8 3.01 448/3-T2 448 73 0.010 17.06 27.5 4.16 448/3-T3 448 73 0.010 16.72 28.2 558/3-T4 558 73 0.010 23.7 558/3-T5 558 73 0.010 24.2 601/3-T1 601 73 0.010 17.56 26.3 0.78 601/3-T2 601 73 0.010 19.32 25.1 0.78 601/3-T3 601 73 0.010 19.42 25.2 0.73 601/3-T7 601 73 0.010 16.74 22.6 1.27 601/3-T8 601 73 0.010 16.85 22.8 1.25 601/3-T9 601 73 0.010 18.47 22.4 1.13 883A/2-T1 883A 73 0.010 26.4 1.12 883A/2-T2 883A 73 0.010 27.4 1.08 883A/2-T3 883A 73 0.010 23.6 0.83 883A/2-T4 883A 73 0.010 26.9 0.91

MIL-HDBK-17-4A Volume 4, Appendix C Raw Data Tables for Titanium Matrix Composites
260
MATERIAL: Nextel 610 / SP Al Screening Data Table C1.1(b) (2 of 4) Nextel 610 / SP Al
FIBER: Nextel 610 SPECIMEN GEOMETRY: Straight-Sided Tension MATRIX: 99.99% Al SURFACE CONDITION: As Received 90° PRODUCT FORM: Panel MACHINING METHOD: Diamond Cutting Wheel 3M LAY-UP: 90° PRE-TEST EXPOSURE: None Raw Data TEST METHOD: MMC-TM-401 TEST ENVIRONMENT: Laboratory Air
Specimen No.
Test Date
Fail Failure Mode
Reduction of Area
Elongation Area Load @ 0.2% Offset
Ultimate Load
Width Thickness Original Gage
Length
Final Gage
Length
Final Width
Final Thickness
Final Area
448/3-T1 1/18/95 gage 0.0806 2075 0.0625 448/3-T2 1/18/95 gage 0.0809 2226 0.0625 448/3-T3 1/18/95 gage 0.0797 2248 0.0625 558/3-T4 4/18/95 gage 0.0511 1214 0.3940 558/3-T5 4/18/95 gage 0.0512 1236 0.3940 601/3-T1 6/16/95 gage 0.0203 533 0.5000 601/3-T2 6/16/95 gage 0.0202 506 0.5000 601/3-T3 6/16/95 gage 0.0201 506 0.5000 601/3-T7 6/16/95 gage 0.0206 463 0.5000 601/3-T8 6/16/95 gage 0.0207 472 0.5000 601/3-T9 6/16/95 gage 0.0209 468 0.5000 883A/2-T1 6/20/96 gage 527 0.37415 0.05640 0.5000 883A/2-T2 6/20/96 gage 497 0.37440 0.05695 0.5000 883A/2-T3 6/20/96 gage 532 0.37485 0.05575 0.5000 883A/2-T4 6/20/96 gage 554 0.37550 0.05625 0.5000

MIL-HDBK-17-4A Volume 4, Appendix C Raw Data Tables for Titanium Matrix Composites
261
MATERIAL: Nextel 610 / SP Al Screening Data Table C1.1(b) (3 of 4) Nextel 610 / SP Al
FIBER: Nextel 610 SPECIMEN GEOMETRY: Straight-Sided Tension MATRIX: 99.99% Al SURFACE CONDITION: As Received 90° PRODUCT FORM: Panel MACHINING METHOD: Diamond Cutting Wheel 3M LAY-UP: 90° PRE-TEST EXPOSURE: None Raw Data TEST METHOD: MMC-TM-401 TEST ENVIRONMENT: Laboratory Air
Specimen No. Fiber v/o
Lot I.D. (Panel)
Test Temp.
Strain Rate
Et1 Prop.
Limit Fty
10 02.
Fty1
0 2. Ftu1 ε1
tf ν12t Comments
(°F) (1/s) (Msi) (ksi) (ksi) (ksi) (ksi) (%) 883A/2-T5 65.0 883A 73 0.010 24.7 0.77 883A/2-T6 883A 73 0.010 23.8 0.75 883A/2-T7 883A 73 0.010 25.2 0.80 883A/2-T8 883A 73 0.010 26.4 0.81 883A/2-T9 883A 73 0.010 24.2 0.72 883A/2-T10 883A 73 0.010 24.3 0.75 883A/2-T11 883A 73 0.010 29.7 1.01 883A/2-T12 883A 73 0.010 27.7 0.92 883A/2-T13 883A 73 0.010 29.1 0.96 883A/2-T14 883A 73 0.010 27.9 0.91 883B/2-T1 883B 73 0.010 28.0 1.21 883B/2-T2 883B 73 0.010 27.2 1.18 883B/2-T3 883B 73 0.010 27.1 1.26 883B/2-T4 883B 73 0.010 25.1 1.00 883B/2-T5 883B 73 0.010 24.6 1.02 883A/2-T6 883A 73 0.010 23.8 0.75 883B/2-T7 883B 73 0.010 27.1 1.44 883B/2-T8 883B 73 0.010 26.3 1.13 883B/2-T9 883B 73 0.010 25.6 1.13 883B/2-T10 883B 73 0.010 25.5 1.01 883B/2-T11 883B 73 0.010 26.5 1.18 883B/2-T12 883B 73 0.010 27.3 1.22 883B/2-T13 883B 73 0.010 27.6 1.20 883B/2-T14 883B 73 0.010 27.9 1.33
MIL-HDBK-17-4A Volume 4, Appendix C Raw Data Tables for Titanium Matrix Composites
262
MATERIAL: Nextel 610 / SP Al Screening Data Table C1.1(b) (4 of 4) Nextel 610 / SP Al
FIBER: Nextel 610 SPECIMEN GEOMETRY: Straight-Sided Tension MATRIX: 99.99% Al SURFACE CONDITION: As Received 90° PRODUCT FORM: Panel MACHINING METHOD: Diamond Cutting Wheel 3M LAY-UP: 90° PRE-TEST EXPOSURE: None Raw Data TEST METHOD: MMC-TM-401 TEST ENVIRONMENT: Laboratory Air
Specimen No.
Test Date
Fail Failure Mode
Reduction of Area
Elongation Area Load @ 0.2% Offset
Ultimate Load
Width Thickness Original Gage
Length
Final Gage
Length
Final Width
Final Thickness
Final Area
883A/2-T5 6/21/96 gage 582 0.37570 0.05890 0.5000 883A/2-T6 6/21/96 gage 567 0.5000 883A/2-T7 6/20/96 gage 554 0.37550 0.05625 0.5000 883A/2-T8 6/20/96 gage 514 0.5000 883A/2-T9 6/20/96 gage 508 0.5000 883A/2-T10 6/20/96 gage 615 0.5000 883A/2-T11 6/20/96 gage 575 0.5000 883A/2-T12 6/20/96 gage 603 0.5000 883A/2-T13 6/20/96 gage 579 0.5000 883A/2-T14 6/20/96 gage 514 0.5000 883B/2-T1 6/20/96 gage 508 0.5000 883B/2-T2 6/20/96 gage 615 0.5000 883B/2-T3 6/20/96 gage 575 0.5000 883B/2-T4 6/20/96 gage 603 0.5000 883B/2-T5 6/20/96 gage 579 0.5000 883A/2-T6 6/21/96 gage 599 0.37570 0.05890 0.5000 883B/2-T7 6/21/96 gage 563 0.5000 883B/2-T8 6/21/96 gage 593 0.5000 883B/2-T9 6/21/96 gage 604 0.5000 883B/2-T10 6/21/96 gage 610 0.5000 883B/2-T11 6/21/96 gage 618 0.5000 883B/2-T12 6/20/96 gage 508 0.5000 883B/2-T13 883B/2-T14

MIL-HDBK-17-4A Volume 4, Appendix C Raw Data Tables for Titanium Matrix Composites
263
C2. COPPER This section is reserved for future use. C3. MAGNESIUMS This section is reserved for future use.

MIL-HDBK-17-4A Volume 4, Appendix D Raw Data Tables for Aluminum Matrix Composites
264
C4. Titaniums C4.1 SiC/TI-15-3 (Section 3.8.2.1.1 and 3.8.2.1.2) MATERIAL: SiC/Ti-15-3 Table C4.1(a) (1 of 2) SiC/Ti-15-3 FIBER: SCS-6 TEST METHOD: Sec. 1.4.2.1 Tension Tension MATRIX: Ti-15V-3Cr-3Al-3Sn PRE-TEST EXPOSURE: 1292°F/24 hrs. (vac.) [0]8 PRODUCT FORM: Foil/fiber/foil TEST ATMOSPHERE: Air NASA-GRC PRODUCT DIMENSIONS: 10” x 14” Raw Data LAY-UP: Unidirectional PLY COUNT: 8-ply Specimen
No Fiber v/o
Lot I.D. (Plate)
Test Temp.
Strain Rate
Et1 Fpl
1 Fty1
0 02. Fty1
0.2 Ftu1 ε1
tu ν12
t Comments
(°F) (1/s) (Msi) (ksi) (ksi) (ksi) (ksi) (%) L1_15 15 F914005 75 1x10⁻⁴ 20 123 141 172 185 1.21 - Mo-weave 15_1 15 F914007 800 1x10⁻³ 19 - 116 - 138 0.86 0.39 Mo-weave 15-2 15 F914007 800 1x10⁻³ 19 - 115 - 136 0.75 0.37 Mo-weave 25-1 25 B934026 800 1x10⁻³ 24 - 164 - 197 0.88 0.32 Ti-Nb weave 25-2 25 B934026 800 1x10⁻³ 24 - 151 - 192 0.91 0.31 Ti-Nb weave 29 35 87H153 800 1x10⁻⁴ 32 17 42 - 200 0.77 - Ti-weave 30 35 87H153 800 1x10⁻³ 26 31 147 - 201 0.89 - Ti-weave 4 35 87H153 75 1x10⁻⁴ 25 121 160 - 196 0.84 - Ti-weave (1) 2 35 87H153 75 1x10⁻⁴ 26 133 168 - 168 0.66 - Ti-weave (1) 5 35 87H153 75 1x10⁻⁴ 37 142 140 - 194 0.67 - Ti-weave 6 35 87H153 75 1x10⁻⁴ 28 33 82 - 194 0.85 - Ti-weave 7 35 87H153 75 1x10⁻⁴ 26 83 83 - 206 1 - Ti-weave 8 35 87H153 75 1x10⁻⁴ 26 127 157 - 204 0.89 - Ti-weave 9 35 87H153 75 1x10⁻⁴ 28 112 160 - 217 0.88 - Ti-weave 33 35 87H153 800 1x10⁻⁵ 29 24 90 - 198 0.82 - Ti-weave 27 35 87H153 75 1x10⁻⁴ 25 141 169 - 208 0.96 0.28 Ti-weave 53 35 D890054 75 1x10⁻⁴ 29 150 186 - 211 0.77 - Mo-weave 5_36 35 J890505 800 1x10⁻³ 27 151 185 - 209 0.84 - Mo-weave (2) 35-8 35 B934025 800 1x10⁻³ 29 - 187 - 252 1 - Ti-Nb weave 35-10 35 B934025 800 1x10⁻³ 26 - 182 - 243 1.06 - Ti-Nb weave L1-45 41 D910518 75 1x10⁻⁴ 31 151 160 - 201 0.73 - Mo-weave L4 41 D910518 75 1x10⁻⁴ 31 128 192 - 252 0.9 - Mo-weave 42-1 41 D910519 800 1x10⁻³ 30 - 212 - 245 0.84 0.31 Mo-weave 42-2 41 D910519 800 1x10⁻³ 32 - 187 - 251 0.83 0.28 Mo-weave (1) Straight sided specimen (2) 32 ply material

MIL-HDBK-17-4A Volume 4, Appendix D Raw Data Tables for Aluminum Matrix Composites
265
MATERIAL: SiC/Ti-15-3 Table C4.1(a) (2 of 2) SiC/Ti-15-3 FIBER: SCS-6 TEST METHOD: Sec. 1.4.2.1 Tension Tension MATRIX: Ti-15V-3Cr-3Al-3Sn PRE-TEST EXPOSURE: 1292°F/24 hrs. (vac.) [0]8 PRODUCT FORM: Foil/fiber/foil TEST ATMOSPHERE: Air NASA-GRC PRODUCT DIMENSIONS: 10” x 14” Raw Data LAY-UP: Unidirectional PLY COUNT: 8-ply Specimen
No. Machining
Method Specimen Geometry
Specimen Dimensions
Surface Condition
Test Date
Failure Location
Failure Mode
L1_15 EDM Dogbone 0.5x6.0x0.12" as-machined 9/25/92 Radius - 15_1 Water Jet + Diamond Grind Dogbone 0.5x6.0x0.12" as-machined 10/2/96 Outside gage - 15-2 Water Jet + Diamond Grind Dogbone 0.5x6.0x0.10" as-machined 10/2/96 mid-gage - 25-1 Water Jet + Diamond Grind Dogbone 0.5x6.0x0.10" as-machined 10/2/96 mid-gage - 25-2 Water Jet + Diamond Grind Dogbone 0.5x6.0x0.10" as-machined 8/21/89 gage - 29 EDM Dogbone 0.5x5.5x0.08" as-machined 8/21/89 gage - 30 EDM Dogbone 0.5x5.5x0.08" as-machined 8/9/88 mid-gage - 4 EDM Rectangular 0.5x4.0x0.08" as-machined 6/29/88 mid-gage - 2 EDM Rectangular 0.5x4.0x0.08" as-machined 6/29/88 grips - 5 EDM Dogbone 0.5x4.0x0.08" as-machined 11/16/88 radius - 6 EDM Dogbone 0.5x4.0x0.08" as-machined 7/8/88 radius - 7 EDM Dogbone 0.5x4.0x0.08" as-machined 8/22/88 radius - 8 EDM Dogbone 0.5x4.0x0.08" as-machined 6/30/88 gage - 9 EDM Dogbone 0.5x4.0x0.08" as-machined 7/7/88 mid-gage - 33 EDM Dogbone 0.5x5.5x0.08" as-machined 8/21/89 gage - 27 EDM Dogbone 0.5x5.5x0.08" as-machined 10/17/89 gage - 53 EDM Dogbone 0.5x5.5x0.07" as-machined 9/10/90 radius - 5_36 EDM + Diamond Grind Dogbone 0.5x6.0x0.3" as-machined 5/23/95 radius - 35-8 Water Jet + Diamond Grind Dogbone 0.5x6.0x0.07" as-machined 5/21/96 radius - 35-10 Water Jet + Diamond Grind Dogbone 0.5x6.0x0.07" as-machined 7/2/96 radius - L1-45 EDM Dogbone 0.5x6.0x0.06" as-machined 9/25/92 outside gage - L4 EDM Dogbone 0.5x6.0x0.06" as-machined 10/14/92 mid-gage - 42-1 Water Jet + Diamond Grind Dogbone 0.5x6.0x0.06" as-machined 10/2/96 radius - 42-2 Water Jet + Diamond Grind Dogbone 0.5x6.0x0.06" as-machined 10/2/96 gage -

MIL-HDBK-17-4A Volume 4, Appendix D Raw Data Tables for Aluminum Matrix Composites
266
MATERIAL: SiC/Ti-15-3 Table C4.1(b) (1 of 2) SiC/Ti-15-3 FIBER: SCS-6 TEST METHOD: Sec. 1.4.2.1 Tension Tension MATRIX: Ti-15V-3Cr-3Al-3Sn PRE-TEST EXPOSURE: 1292°F/24 hrs. (vac.) [90]8 PRODUCT FORM: Foil/fiber/foil TEST ATMOSPHERE: Air NASA-GRC PRODUCT DIMENSIONS: 10” x 14” Raw Data LAY-UP: Unidirectional PLY COUNT: 8-ply Specimen
No Fiber v/o
Lot I.D. (Plate)
Test Temp.
Strain Rate
Et2 Fpl
2 Fty2
0 02. Fty2
0.2 Ftu2 ε 2
tu ν 21
t Comments
(°F) (1/s) (Msi) (ksi) (ksi) (ksi) (ksi) (%) T2_15 15 F914005 75 1x10⁻⁴ 17 42 44 75 96 1.91 - Mo-weave 41 35 87H153 75 1x10⁻⁴ 19 17 38 49 59 1.43 0.17 Ti-weave 42 35 87H153 75 1x10⁻⁴ 17 15 40 50 62 1.38 0.18 Ti-weave 43 35 87H153 800 1x10⁻⁴ 17 16 25 34 42 0.71 - Ti-weave 44 35 87H153 800 1x10⁻⁵ 17 15 22 30 41 0.99 - Ti-weave T1_45 41 D910518 75 1x10⁻⁴ 18 - - - 23 0.12 - Mo-weave (1) T2_45 41 D910518 75 1x10⁻⁴ 18 - - - 33 0.19 - Mo-weave (1) Broke in elastic regime

MIL-HDBK-17-4A Volume 4, Appendix D Raw Data Tables for Aluminum Matrix Composites
267
MATERIAL: SiC/Ti-15-3 Table C4.1(b) (2 of 2) SiC/Ti-15-3 FIBER: SCS-6 TEST METHOD: Sec. 1.4.2.1 Tension Tension MATRIX: Ti-15V-3Cr-3Al-3Sn PRE-TEST EXPOSURE: 1292°F/24 hrs. (vac.) [90]8 PRODUCT FORM: Foil/fiber/foil TEST ATMOSPHERE: Air NASA-GRC PRODUCT DIMENSIONS: 10” x 14” Raw Data LAY-UP: Unidirectional PLY COUNT: 8-ply Specimen
No. Machining
Method Specimen Geometry
Specimen Dimensions
Surface Condition
Test Date
Failure Location
Failure Mode
T2_15 EDM Dogbone 0.5x6.0x0.12" as-machined 9/25/92 outside gage - 41 EDM Dogbone 0.5x5.5x0.08" as-machined 10/19/89 gage - 42 EDM Dogbone 0.5x5.5x0.08" as-machined 10/27/89 gage - 43 EDM Dogbone 0.5x5.5x0.08" as-machined 8/22/89 gage - 44 EDM Dogbone 0.5x5.5x0.08" as-machined 8/23/89 gage - T1_45 EDM Dogbone 0.5x5.5x0.06" as-machined 9/25/92 gage - T2_45 EDM Dogbone 0.5x5.5x0.06" as-machined 9/25/92 radius -

MIL-HDBK-17-4A Volume 4, Appendix D Raw Data Tables for Aluminum Matrix Composites
268
MATERIAL: SiC/Ti-15-3 Table C4.1(c) (1 of 2) SiC/Ti-15-3 FIBER: SCS-6 TEST METHOD: Sec. 1.4.2.1 Tension Tension MATRIX: Ti-15V-3Cr-3Al-3Sn PRE-TEST EXPOSURE: 1292°F/24 hrs. (vac.) Laminates PRODUCT FORM: Foil/fiber/foil TEST ATMOSPHERE: Air NASA-GRC PRODUCT DIMENSIONS: 10” x 14” Raw Data LAY-UP: Cross-ply laminates PLY COUNT: 8-ply FIBER VOLUME PERCENT: 35 Specimen
No Lay-up Lot I.D.
(Plate) Test
Temp. Strain Rate
Ext Fx
pl Fx
ty0 02. Fxty0.2 Fx
tu ε x
tu νxy
t Comments
(°F) (1/s) (Msi) (ksi) (ksi) (ksi) (ksi) (%) H3 +/- 30 D890053 75 1x10⁻⁴ 23 44 60 105 - - - Mo-weave (1) H16 +/- 30 D890053 75 1x10⁻⁴ 23 48 60 108 179 1.66 - Mo-weave 26 +/- 30 87H149 75 1x10⁻⁴ 24 58 74 114 148 1.14 - Ti-weave 25 +/- 30 87H149 75 1x10⁻⁴ 21 62 73 114 145 1.11 - Ti-weave 24 +/- 30 87H149 75 1x10⁻⁴ 22 67 75 112 144 >1.5 - Ti-weave (2) 23 +/- 30 87H149 75 1x10⁻⁴ 24 48 71 115 145 0.99 - Ti-weave 22 +/- 30 87H149 75 1x10⁻⁴ 20 65 97 146 147 1.04 - Ti-weave 19 +/- 30 87H149 75 1x10⁻⁴ 22 61 79 121 153 1.2 - Ti-weave 18 +/- 30 87H149 75 1x10⁻⁴ 21 33 26 95 133 1.44 - Ti-weave (3) 12 +/- 30 87H149 75 1x10⁻⁴ 22 59 64 91 146 1.32 - Ti-weave 11 +/- 30 87H149 75 1x10⁻⁴ 22 63 81 113 140 1.26 - Ti-weave 9_23 +/- 30 J890509 800 1x10⁻³ 20 40 50 86 134 1.52 - Mo-weave (4) A11 +/- 45 87H148 75 1x10⁻⁴ 17 30 40 52 77 >4.0 - Ti-weave (2) A6 +/- 45 87H148 800 1x10⁻⁴ 13 21 35 47 68 7.29 - Ti-weave A13 +/- 45 87H148 800 1x10⁻⁵ 17 28 30 29 64 >4.6 - Ti-weave (2) F1 +/- 60 87H149 75 1x10⁻⁴ 17 36 41 50 57 1.8 - Ti-weave F4 +/- 60 87H149 800 1x10⁻⁴ 14 26 28 35 48 2.95 - Ti-weave B2 0/90 87H150 75 1x10⁻⁴ 21 23 37 115 143 1 - Ti-weave B4 0/90 87H150 75 1x10⁻⁴ 23 47 72 136 149 1.08 - Ti-weave C5 90/0 87H150 75 1x10⁻⁴ 15 40 80 135 145 1.21 0.15 Ti-weave C4 90/0 87H150 75 1x10⁻⁴ 25 23 46 118 154 1.07 0.21 Ti-weave (1) Slipped in grips (3) Stress discontinuity at yield point (2) Test interrupted (4) 32 ply material

MIL-HDBK-17-4A Volume 4, Appendix D Raw Data Tables for Aluminum Matrix Composites
269
MATERIAL: SiC/Ti-15-3 Table C4.1(c) (2 of 2) SiC/Ti-15-3 FIBER: SCS-6 TEST METHOD: Sec. 1.4.2.1 Tension Tension MATRIX: Ti-15V-3Cr-3Al-3Sn PRE-TEST EXPOSURE: 1292°F/24 hrs. (vac.) Laminates PRODUCT FORM: Foil/fiber/foil TEST ATMOSPHERE: Air NASA-GRC PRODUCT DIMENSIONS: 10” x 14” Raw Data LAY-UP: Cross-ply laminates PLY COUNT: 8-ply FIBER VOLUME PERCENT: 35 Specimen
No. Machining
Method Specimen Geometry
Specimen Dimensions
Surface Condition
Test Date
Failure Location
Failure Mode
H3 EDM Dogbone 0.5x6.0x0.07" as-machined 9/6/90 - H16 EDM Dogbone 0.5x6.0x0.07" as-machined 9/7/90 gage 26 EDM Rectangular 0.75x6.0x0.08" as-machined 6/13/89 gage 25 EDM Rectangular 0.75x6.0x0.08" as-machined 6/13/89 gage 24 EDM Rectangular 1.0x6.0x0.08" as-machined 6/13/89 mid-gage 23 EDM Rectangular 1.0x6.0x0.08" as-machined 6/13/89 gage 22 EDM Dogbone 0.5x6.0x0.08" as-machined 12/1/88 gage 19 EDM Dogbone 0.5x6.0x0.08" as-machined 12/1/88 radius 18 EDM Dogbone 0.5x4.0x0.08" as-machined 7/13/88 radius 12 EDM Dogbone 0.5x4.0x0.08" as-machined 8/9/88 grips 11 EDM Dogbone 0.5x4.0x0.08" as-machined 11/15/88 gage 9_23 EDM + Diamond Grind Dogbone 0.5x6.0x0.3" as-machined 11/24/92 mid-gage A11 EDM Dogbone 0.5x6.0x0.08" as-machined 1/24/90 - A6 EDM Dogbone 0.5x6.0x0.08" as-machined 3/3/89 radius A13 EDM Dogbone 0.5x6.0x0.08" as-machined 2/1/90 - F1 EDM Dogbone 0.5x6.0x0.08" as-machined 1/24/90 gage F4 EDM Dogbone 0.5x6.0x0.08" as-machined 2/1/90 radius B2 EDM Dogbone 0.5x6.0x0.08" as-machined 6/7/89 gage B4 EDM Dogbone 0.5x6.0x0.08" as-machined 4/4/89 gage C5 EDM Dogbone 0.5x6.0x0.08" as-machined 10/27/89 gage C4 EDM Dogbone 0.5x6.0x0.08" as-machined 10/19/89 gage

MIL-HDBK-17-4A Volume 4, Appendix D Raw Data Tables for Aluminum Matrix Composites
270
MATERIAL: SiC/Ti-15-3 Table C4.1(d) (1 of 8) SiC/Ti-15-3 FIBER: SCS-6 TEST METHOD: Sec. 1.4.2.4 Fatigue Fatigue MATRIX: Ti-15V-3Cr-3Al-3Sn WAVEFORM: Triangular [0]32 PRODUCT FORM: Foil/fiber/foil PRE-TEST EXPOSURE: 1292°F/24 hrs. NASA GRC PRODUCT DIMENSIONS: 10” x 14” x 0.30" TEST ATMOSPHERE: Air Raw Data LAY-UP: Unidirectional SPECIMEN GEOMETRY: Dogbone PLY COUNT: 32-ply SURFACE CONDITION: As-ground MACHINING METHOD: EDM+diamond ground
at Nf / 2
Specimen No.
Fiber v/o
Lot I.D. (Plate)
Test Temp.
E at N=1 E
Total
Strain rate maxε minε maxσ minσ Freq. Nf
(oF) (Msi) (Msi) (1/s) (%) (%) (psi) (psi) (Hz) 4-5 35 J890504 800 26.9 27.3 0.0009 0.640 0.185 130800 5500 0.10 37974 4-12 35 J890504 800 27.5 27.6 0.0012 0.840 0.240 171000 6900 0.10 9132 4-15 35 J890504 800 26.9 26.7 0.0014 0.897 0.213 190960 7890 0.10 2898 4-18 35 J890504 800 25.4 25.3 0.0015 0.883 0.137 197000 8000 0.10 1118 4-19 35 J890504 800 25.4 25.7 0.0010 0.757 0.270 131400 5300 0.10 31811 5-7 35 J890505 800 27.0 26.6 0.0010 0.831 0.134 190600 9700 0.07 922 5-8 35 J890505 800 27.1 27.4 0.0010 0.705 0.202 143500 7200 0.10 20303 4-13 35 J890504 800 26.3 26.6 0.0010 0.654 -0.654 163600 -181900 0.04 4519 4-16 35 J890504 800 27.0 26.8 0.0010 0.744 -0.743 187800 -208100 0.03 948 4-14 35 J890504 800 27.5 - 0.0010 0.654 -0.655 163600 -195700 0.04 3218 4-17 35 J890504 800 27.2 - 0.0010 0.484 -0.484 113900 -151100 0.05 12050 4-2 35 J890504 800 26.2 - 0.0010 0.652 -0.656 167000 -171000 0.04 2433 4-3 35 J890504 800 26.5 26.6 0.0010 0.481 -0.483 119000 -132000 0.05 10347 4-20 35 J890504 800 26.2 28.1 0.0010 0.400 -0.410 93400 -126400 0.06 24592 4-23 35 J890504 800 26.7 27.5 0.0010 0.304 -0.304 70500 -97200 0.08 63392 4-25 35 J890504 800 25.3 24.3 0.0010 0.403 -0.403 96800 -101060 0.06 36775 4-26 35 J890504 800 27.2 28.5 0.0010 0.300 -0.300 74700 -98100 0.08 74754

MIL-HDBK-17-4A Volume 4, Appendix D Raw Data Tables for Aluminum Matrix Composites
271
MATERIAL: SiC/Ti-15-3 Table C4.1(d) (2 of 8) SiC/Ti-15-3 FIBER: SCS-6 TEST METHOD: Sec. 1.4.2.4 Fatigue Fatigue MATRIX: Ti-15V-3Cr-3Al-3Sn WAVEFORM: Triangular [0]32 PRODUCT FORM: Foil/fiber/foil PRE-TEST EXPOSURE: 1292°F/24 hrs. NASA GRC PRODUCT DIMENSIONS: 10” x 14” x 0.30" TEST ATMOSPHERE: Air Raw Data LAY-UP: Unidirectional SPECIMEN GEOMETRY: Dogbone PLY COUNT: 32-ply SURFACE CONDITION: As-ground MACHINING METHOD: EDM+diamond ground
Gage Dimensions
l w t Specimen
No. Control Mode R
(in.) (in.) (in.)
Test Date
Failure Location Comments
Specimen Dimensions
Failure Mode
4-5 load 0.05 0.5 0.401 0.299 1/13/93 gage Mo-weave 0.5x6x0.3" - 4-12 load 0.05 0.5 0.390 0.299 2/1/93 gage Mo-weave 0.5x6x0.3" - 4-15 load 0.05 0.5 0.391 0.300 2/8/93 gage Mo-weave 0.5x6x0.3" - 4-18 load 0.05 0.5 0.390 0.300 7/14/93 gage Mo-weave 0.5x7x0.3" - 4-19 load 0.05 0.5 0.390 0.300 7/19/93 gage Mo-weave 0.5x7x0.3" - 5-7 load 0.05 1.0 0.389 0.299 3/28/94 radius Mo-weave 0.5x6x0.3" - 5-8 load 0.05 1.0 0.389 0.299 3/29/94 gage Mo-weave 0.5x6x0.3" - 4-13 strain -1 0.5 0.391 0.299 2/22/93 radius Mo-weave 0.5x6x0.3" - 4-16 strain -1 0.5 0.391 0.299 2/25/93 radius Mo-weave 0.5x6x0.3" - 4-14 strain -1 0.5 0.390 0.300 2/30/93 gage Mo-weave 0.5x6x0.3" - 4-17 strain -1 0.5 0.390 0.299 3/11/93 gage Mo-weave 0.5x6x0.3" - 4-2 strain -1 0.5 0.294 - 3/24/99 gage Mo-weave (1) 6x0.294" - 4-3 strain -1 0.5 0.294 - 3/25/93 gage Mo-weave (1) 6x0.294" - 4-20 strain -1 0.5 0.388 0.298 7/26/93 gage Mo-weave 0.5x7x0.3" - 4-23 strain -1 0.5 0.389 0.300 9/3/93 radius Mo-weave 0.5x7x0.3" - 4-25 strain -1 0.5 0.298 - 9/29/93 gage Mo-weave (1) 7x0.298" - 4-26 strain -1 0.5 0.298 - 10/6/93 radius Mo-weave (1) 7x0.298" -

MIL-HDBK-17-4A Volume 4, Appendix D Raw Data Tables for Aluminum Matrix Composites
272
MATERIAL: SiC/Ti-15-3 Table C4.1(d) (3 of 8) SiC/Ti-15-3 FIBER: SCS-6 TEST METHOD: Sec. 1.4.2.4 Fatigue Fatigue MATRIX: Ti-15V-3Cr-3Al-3Sn WAVEFORM: Triangular [0]32 PRODUCT FORM: Foil/fiber/foil PRE-TEST EXPOSURE: 1292°F/24 hrs. NASA GRC PRODUCT DIMENSIONS: 10” x 14” x 0.30" TEST ATMOSPHERE: Air Raw Data LAY-UP: Unidirectional SPECIMEN GEOMETRY: Dogbone PLY COUNT: 32-ply SURFACE CONDITION: As-ground MACHINING METHOD: EDM+diamond ground
at Nf / 2
Specimen No.
Fiber v/o
Lot I.D. (Plate)
Test Temp.
E at N=1 E
Total
Strain rate maxε minε maxσ minσ Freq. Nf
(oF) (Msi) (Msi) (1/s) (%) (%) (psi) (psi) (Hz) 4-27 35 J890504 800 26.1 25.4 0.0010 0.652 -0.653 162700 -167700 0.04 4340 4-28 35 J890504 800 27.8 - 0.0010 0.273 -0.273 70600 -87500 0.09 121116 5-1 35 J890505 800 26.0 27.2 0.0010 0.655 -0.656 169700 -188400 0.04 2019 5-2 35 J890505 800 27.3 27.4 0.0010 0.305 -0.305 79200 -89100 0.08 84622 5-3 35 J890505 800 27.2 27.7 0.0010 0.635 0.026 134900 -31700 0.08 11010 5-4 35 J890505 800 27.3 28.2 0.0010 0.486 0.018 104400 -25900 0.10 94738 5-5 35 J890505 800 27.1 27.4 0.0010 0.705 0.029 145000 -36500 0.07 12761 5-6 35 J890505 800 26.9 27.4 0.0010 0.586 0.024 121700 -29500 0.09 26542 5-14 35 J890505 800 27.2 27.5 0.0010 0.725 0.030 149500 -36100 0.07 9904 5-9 35 J890505 800 26.7 27.6 0.0010 0.515 -0.323 116500 -116000 0.06 13015 5-10 35 J890505 800 27.4 28.6 0.0010 0.325 -0.250 82100 -81600 0.09 76127 5-13 35 J890505 800 25.5 25.6 0.0010 0.674 -0.625 167000 -167000 0.04 2401 5-24 35 J890505 800 27.6 - 0.0010 0.710 0.030 163700 0 0.07 6437 5-25 35 J890505 800 27.0 26.7 0.0010 0.595 0.120 127900 -948 0.09 23197 5-26 35 J890505 800 26.8 26.7 0.0010 0.710 0.180 140200 -1100 0.08 14130 5-21 35 J890505 800 26.9 28.3 0.0010 0.586 0.011 123800 -36900 0.09 20879 5-22 35 J890505 800 27.5 28.9 0.0010 0.594 0.033 123700 -36700 0.09 27695 5-28 35 J890505 800 26.8 26.5 0.0010 - - 155900 -46900 0.07 6469
MIL-HDBK-17-4A Volume 4, Appendix D Raw Data Tables for Aluminum Matrix Composites
273
MATERIAL: SiC/Ti-15-3 Table C4.1(d) (4 of 8) SiC/Ti-15-3 FIBER: SCS-6 TEST METHOD: Sec. 1.4.2.4 Fatigue Fatigue MATRIX: Ti-15V-3Cr-3Al-3Sn WAVEFORM: Triangular [0]32 PRODUCT FORM: Foil/fiber/foil PRE-TEST EXPOSURE: 1292°F/24 hrs. NASA GRC PRODUCT DIMENSIONS: 10” x 14” x 0.30" TEST ATMOSPHERE: Air Raw Data LAY-UP: Unidirectional SPECIMEN GEOMETRY: Dogbone PLY COUNT: 32-ply SURFACE CONDITION: As-ground MACHINING METHOD: EDM+diamond ground
Gage Dimensions
l w t Specimen
No. Control Mode R
(in.) (in.) (in.)
Test Date
Failure Location Comments
Specimen Dimensions
Failure Mode
4-27 strain -1 0.5 0.298 - 10/19/93 gage Mo-weave (1) 7x0.298" - 4-28 strain -1 0.5 0.298 - 10/22/93 gage Mo-weave (1) 7x0.298" - 5-1 strain -1 1.0 0.390 0.300 2/14/94 gage Mo-weave 0.5x6x0.3" - 5-2 strain -1 1.0 0.389 0.300 2/15/94 radius Mo-weave 0.5x6x0.3" - 5-3 strain 0.05 1.0 0.389 0.299 3/2/94 radius Mo-weave 0.5x6x0.3" - 5-4 strain 0.05 1.0 0.389 0.299 3/7/94 gage Mo-weave 0.5x6x0.3" - 5-5 strain 0.05 1.0 0.389 0.299 3/21/94 gage Mo-weave 0.5x6x0.3" - 5-6 strain 0.05 1.0 0.389 0.298 3/24/94 gage Mo-weave 0.5x6x0.3" - 5-14 strain 0.05 1.0 0.388 0.301 5/18/94 gage Mo-weave 0.5x6x0.3" - 5-9 load -1 1.0 0.389 0.299 4/4/94 gage Mo-weave 0.5x6x0.3" - 5-10 load -1 1.0 0.388 0.299 4/7/94 radius Mo-weave 0.5x6x0.3" - 5-13 load -1 1.0 0.388 0.300 5/6/94 radius Mo-weave 0.5x6x0.3" - 5-24 hybrid e (2) 0.05 1.0 0.388 0.300 10/4/94 radius Mo-weave 0.5x6x0.3" - 5-25 hybrid e (2) 0.05 1.0 0.388 0.298 10/11/94 radius Mo-weave 0.5x6x0.3" - 5-26 hybrid e (2) 0.05 1.0 0.388 0.299 10/20/94 gage Mo-weave 0.5x6x0.3" - 5-21 load -0.3 1.0 0.387 0.300 8/1/94 gage Mo-weave 0.5x6x0.3" - 5-22 load -0.3 1.0 0.387 0.300 8/4/94 gage Mo-weave 0.5x6x0.3" - 5-28 load -0.3 1.0 0.388 0.300 11/7/94 gage Mo-weave 0.5x6x0.3" - (1) Cylindrical gage sections (2) Strain control tests with minimum load limited to tensile stresses

MIL-HDBK-17-4A Volume 4, Appendix D Raw Data Tables for Aluminum Matrix Composites
274
MATERIAL: SiC/Ti-15-3 Table C4.1(d) (5 of 8) SiC/Ti-15-3 FIBER: SCS-6 TEST METHOD: Sec. 1.4.2.4 Fatigue Fatigue MATRIX: Ti-15V-3Cr-3Al-3Sn WAVEFORM: Triangular [0]32 PRODUCT FORM: Foil/fiber/foil PRE-TEST EXPOSURE: 1292°F/24 hrs. NASA GRC PRODUCT DIMENSIONS: 10” x 14” x 0.30" TEST ATMOSPHERE: Air Raw Data LAY-UP: Unidirectional SPECIMEN GEOMETRY: Dogbone PLY COUNT: 32-ply SURFACE CONDITION: As-ground MACHINING METHOD: EDM+diamond ground
at Nf / 2
Specimen No.
Fiber v/o
Lot I.D. (Plate)
Test Temp.
E at N=1 E
Total
Strain rate maxε minε maxσ minσ Freq. Nf
(oF) (Msi) (Msi) (1/s) (%) (%) (psi) (psi) (Hz) 5-20 35 J890505 800 27.4 28.6 0.0010 0.475 -0.153 111700 -66700 0.08 34829 5-16 35 J890505 800 27.8 - 0.0010 0.593 -0.266 147000 -92000 0.06 6220 5-17 35 J890505 800 27.1 27.4 0.0010 0.789 0.397 148700 43200 0.13 24431 5-18 35 J890505 800 26.7 27.1 0.0010 0.655 0.316 130400 38600 0.15 29669 5-29 35 J890505 800 26.6 26.1 0.0010 0.752 0.571 153600 106000 0.30 5986 5-30 35 J890505 800 27.1 26.9 0.0010 0.855 0.658 177000 123000 0.25 3740 5-31 35 J890505 800 26.9 27.2 0.0010 0.758 0.608 136300 95400 0.30 463000 5-32 35 J890505 800 26.9 26.8 0.0010 0.887 0.564 173500 86400 0.15 6176 5-33 35 J890505 800 26.9 27.4 0.0010 0.726 0.480 133400 66000 0.20 353147 5-34 35 J890505 800 26.7 26.5 0.0010 0.868 0.583 150400 74300 0.18 97761 5-35 35 J890505 800 27.1 26.5 0.0010 0.822 0.477 195600 96500 0.13 681 5-19 35 J890505 800 27.3 27.1 0.0010 0.851 0.551 155200 76700 0.15 14477

MIL-HDBK-17-4A Volume 4, Appendix D Raw Data Tables for Aluminum Matrix Composites
275
MATERIAL: SiC/Ti-15-3 Table C4.1(d) (6 of 8) SiC/Ti-15-3 FIBER: SCS-6 TEST METHOD: Sec. 1.4.2.4 Fatigue Fatigue MATRIX: Ti-15V-3Cr-3Al-3Sn WAVEFORM: Triangular [0]32 PRODUCT FORM: Foil/fiber/foil PRE-TEST EXPOSURE: 1292°F/24 hrs. NASA GRC PRODUCT DIMENSIONS: 10” x 14” x 0.30" TEST ATMOSPHERE: Air Raw Data LAY-UP: Unidirectional SPECIMEN GEOMETRY: Dogbone PLY COUNT: 32-ply SURFACE CONDITION: As-ground MACHINING METHOD: EDM+diamond ground
Gage Dimensions
l w t Specimen
No. Control Mode R
(in.) (in.) (in.)
Test Date
Failure Location Comments
Specimen Dimensions
Failure Mode
5-20 load -0.6 1.0 0.388 0.300 7/22/94 gage Mo-weave 0.5x6x0.3" - 5-16 load -0.6 1.0 0.388 0.301 11/10/94 gage Mo-weave 0.5x6x0.3" - 5-17 load 0.3 1.0 0.387 0.300 11/21/94 gage Mo-weave 0.5x6x0.3" - 5-18 load 0.3 1.0 0.390 0.306 12/6/94 gage Mo-weave 0.5x6x0.3" - 5-29 load 0.7 1.0 0.388 0.302 3/14/95 gage Mo-weave 0.5x6x0.3" - 5-30 load 0.7 1.0 0.388 0.299 3/21/95 gage Mo-weave 0.5x6x0.3" - 5-31 load 0.7 1.0 0.390 0.300 3/24/95 run-out Mo-weave 0.5x6x0.3" - 5-32 load 0.5 1.0 0.389 0.299 4/13/95 gage Mo-weave 0.5x6x0.3" - 5-33 load 0.5 1.0 0.388 0.299 4/18/95 run-out Mo-weave 0.5x6x0.3" - 5-34 load 0.5 1.0 0.388 0.299 5/9/95 radius Mo-weave 0.5x6x0.3" - 5-35 load 0.5 1.0 0.388 0.299 5/17/95 gage Mo-weave 0.5x6x0.3" - 5-19 load 0.5 1.0 0.390 0.308 11/30/94 gage Mo-weave 0.5x6x0.3" -
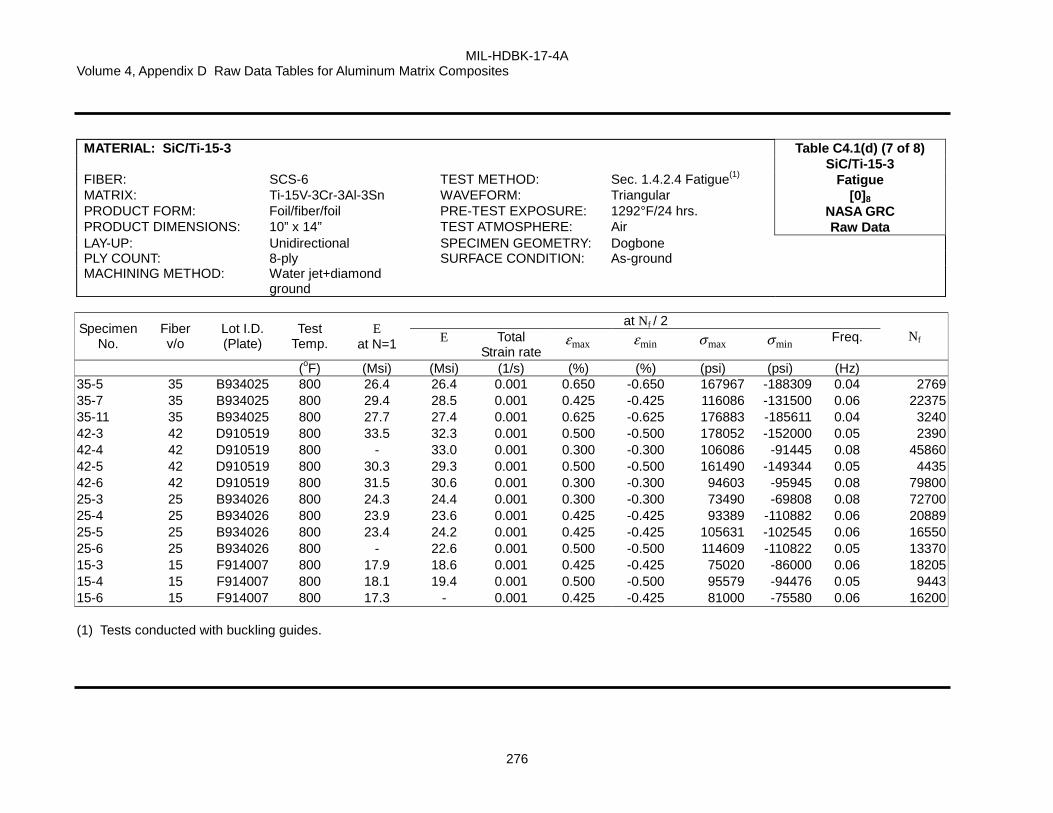
MIL-HDBK-17-4A Volume 4, Appendix D Raw Data Tables for Aluminum Matrix Composites
276
MATERIAL: SiC/Ti-15-3 Table C4.1(d) (7 of 8) SiC/Ti-15-3 FIBER: SCS-6 TEST METHOD: Sec. 1.4.2.4 Fatigue(1) Fatigue MATRIX: Ti-15V-3Cr-3Al-3Sn WAVEFORM: Triangular [0]8 PRODUCT FORM: Foil/fiber/foil PRE-TEST EXPOSURE: 1292°F/24 hrs. NASA GRC PRODUCT DIMENSIONS: 10” x 14” TEST ATMOSPHERE: Air Raw Data LAY-UP: Unidirectional SPECIMEN GEOMETRY: Dogbone PLY COUNT: 8-ply SURFACE CONDITION: As-ground MACHINING METHOD: Water jet+diamond
ground
at Nf / 2
Specimen No.
Fiber v/o
Lot I.D. (Plate)
Test Temp.
E at N=1 E
Total
Strain rate maxε minε maxσ minσ Freq. Nf
(oF) (Msi) (Msi) (1/s) (%) (%) (psi) (psi) (Hz) 35-5 35 B934025 800 26.4 26.4 0.001 0.650 -0.650 167967 -188309 0.04 2769 35-7 35 B934025 800 29.4 28.5 0.001 0.425 -0.425 116086 -131500 0.06 22375 35-11 35 B934025 800 27.7 27.4 0.001 0.625 -0.625 176883 -185611 0.04 3240 42-3 42 D910519 800 33.5 32.3 0.001 0.500 -0.500 178052 -152000 0.05 2390 42-4 42 D910519 800 - 33.0 0.001 0.300 -0.300 106086 -91445 0.08 45860 42-5 42 D910519 800 30.3 29.3 0.001 0.500 -0.500 161490 -149344 0.05 4435 42-6 42 D910519 800 31.5 30.6 0.001 0.300 -0.300 94603 -95945 0.08 79800 25-3 25 B934026 800 24.3 24.4 0.001 0.300 -0.300 73490 -69808 0.08 72700 25-4 25 B934026 800 23.9 23.6 0.001 0.425 -0.425 93389 -110882 0.06 20889 25-5 25 B934026 800 23.4 24.2 0.001 0.425 -0.425 105631 -102545 0.06 16550 25-6 25 B934026 800 - 22.6 0.001 0.500 -0.500 114609 -110822 0.05 13370 15-3 15 F914007 800 17.9 18.6 0.001 0.425 -0.425 75020 -86000 0.06 18205 15-4 15 F914007 800 18.1 19.4 0.001 0.500 -0.500 95579 -94476 0.05 9443 15-6 15 F914007 800 17.3 - 0.001 0.425 -0.425 81000 -75580 0.06 16200 (1) Tests conducted with buckling guides.

MIL-HDBK-17-4A Volume 4, Appendix D Raw Data Tables for Aluminum Matrix Composites
277
MATERIAL: SiC/Ti-15-3 Table C4.1(d) (8 of 8) SiC/Ti-15-3 FIBER: SCS-6 TEST METHOD: Sec. 1.4.2.4 Fatigue(1) Fatigue MATRIX: Ti-15V-3Cr-3Al-3Sn WAVEFORM: Triangular [0]8 PRODUCT FORM: Foil/fiber/foil PRE-TEST EXPOSURE: 1292°F/24 hrs. NASA GRC PRODUCT DIMENSIONS: 10” x 14” TEST ATMOSPHERE: Air Raw Data LAY-UP: Unidirectional SPECIMEN GEOMETRY: Dogbone PLY COUNT: 8-ply SURFACE CONDITION: As-ground MACHINING METHOD: Water jet+diamond
ground
Gage Dimensions
l w t Specimen
No. Control Mode R
(in.) (in.) (in.)
Test Date
Failure Location Comments
Specimen Dimensions
Failure Mode
35-5 strain -1 0.5 0.358 0.071 7/31/96 gage Ti-Nb weave 0.5x6x.07" - 35-7 strain -1 0.5 0.357 0.070 8/6/96 gage Ti-Nb weave 0.5x6x.07" - 35-11 strain -1 0.5 0.357 0.071 8/12/96 radius Ti-Nb weave 0.5x6x.07" - 42-3 strain -1 0.5 0.355 0.062 11/19/96 gage Mo-weave 0.5x6x.06" - 42-4 strain -1 0.5 0.355 0.062 11/20/96 radius Mo-weave 0.5x6x.06" - 42-5 strain -1 0.5 0.353 0.062 11/27/96 radius Mo-weave 0.5x6x.06" - 42-6 strain -1 0.5 0.355 0.062 11/29/96 radius Mo-weave 0.5x6x.06" - 25-3 strain -1 0.5 0.356 0.097 12/12/96 radius Ti-Nb weave 0.5x6x.09" - 25-4 strain -1 0.5 0.355 0.098 12/27/96 gage Ti-Nb weave 0.5x6x.09" - 25-5 strain -1 0.5 0.357 0.098 12/31/96 radius Ti-Nb weave 0.5x6x.09" - 25-6 strain -1 0.5 0.357 0.098 1/6/97 radius Ti-Nb weave 0.5x6x.09" - 15-3 strain -1 0.5 0.349 0.116 1/10/97 radius Mo-weave 0.5x6x.12" - 15-4 strain -1 0.5 0.354 0.116 1/14/97 radius Mo-weave 0.5x6x.12" - 15-6 strain -1 0.5 0.358 0.116 1/28/97 radius Mo-weave 0.5x6x.12" -

MIL-HDBK-17-4A Volume 4, Appendix D Raw Data Tables for Aluminum Matrix Composites
278
MATERIAL: SiC/Ti-15-3 Table C4.1(e) (1 of 8) SiC/Ti-15-3 FIBER: SCS-6 TEST METHOD: Sec. 1.4.2.4 Fatigue Fatigue MATRIX: Ti-15V-3Cr-3Al-3Sn WAVEFORM: Triangular Laminates PRODUCT FORM: Foil/fiber/foil PRE-TEST EXPOSURE: 1292°F/24 hrs. NASA GRC PRODUCT DIMENSIONS: 12” x 12” TEST ATMOSPHERE: Air Raw Data LAY-UP: Laminates SPECIMEN GEOMETRY: Dogbone PLY COUNT: 8-ply SURFACE CONDITION: As-machined MACHINING METHOD: EDM
at Nf / 2
Specimen No.
Lay-up Fiber v/o
Lot I.D. (Plate)
Test Temp.
E at N=1 E
Total
Strain rate maxε minε maxσ minσ Freq. Nf
(oF) (Msi) (Msi) (1/s) (%) (%) (psi) (psi) (Hz) [0] 31 35 87H153 800 23.6 - - - - 121600 4600
0.17 >104000
32 35 87H153 75 25.5 - - - - 142400 4600 0.17 9947 34 35 87H153 800 26.9 - 0.0010 0.633 0.021 121800 4600
0.17 139581
35 35 87H153 75 27.3 - 0.0008 0.498 0.018 132500 4100 0.17 18045 36 35 87H153 800 - - - - - 132700 4300 0.17 17519 37 35 87H153 800 26.5 - 0.0011 0.653 0.022 121500 4500 0.17 32804 [90] 38 35 87H153 75 17.7 - 0.0002 0.154 0.023 25300 2200 0.17 35867 45 35 87H153 75 18.2 - 0.0003 0.186 0.023 30400 2600 0.17 9562 [90/0] C10 35 87H150 75 27.0 - 0.0005 0.397 0.090 53400 2000 0.17 42293 C9 35 87H150 75 34.5 - 0.0008 0.516 0.068 88200 3100 0.17 4480 C8 35 87H150 75 30.5 - - - - 76000 2900 0.17 10157 C6 35 87H150 75 25.0 - 0.0007 0.451 0.061 60700 2200 0.17 31935

MIL-HDBK-17-4A Volume 4, Appendix D Raw Data Tables for Aluminum Matrix Composites
279
MATERIAL: SiC/Ti-15-3 Table C4.1(e) (2 of 8) SiC/Ti-15-3 FIBER: SCS-6 TEST METHOD: Sec. 1.4.2.4 Fatigue Fatigue MATRIX: Ti-15V-3Cr-3Al-3Sn WAVEFORM: Triangular Laminates PRODUCT FORM: Foil/fiber/foil PRE-TEST EXPOSURE: 1292°F/24 hrs. NASA GRC PRODUCT DIMENSIONS: 12” x 12” TEST ATMOSPHERE: Air Raw Data LAY-UP: Laminates SPECIMEN GEOMETRY: Dogbone PLY COUNT: 8-ply SURFACE CONDITION: As-machined MACHINING METHOD: EDM
Gage Dimensions
l w t Specimen
No. Control Mode R
(in.) (in.) (in.)
Test Date
Failure Location Comments
Specimen Dimensions
Failure Mode
31 load 0.05 0.5 0.336 0.085 1/3/90 run-out Ti-weave,
vacuum test 0.5x6x.09" -
32 load 0.05 0.5 0.335 0.082 8/25/89 - Ti-weave 0.5x6x.09" - 34 load 0.05 0.5 0.335 0.083 12/1/89 - Ti-weave,
vacuum test 0.5x6x.09" -
35 load 0.05 0.5 0.309 0.084 8/30/89 - Ti-weave 0.5x6x.09" - 36 load 0.05 0.5 0.310 0.084 9/28/89 - Ti-weave 0.5x6x.09" - 37 load 0.05 0.5 0.309 0.083 10/1/89 - Ti-weave 0.5x6x.09" - 38 load 0.05 0.5 0.328 0.083 9/11/89 - Ti-weave 0.5x6x.09" - 45 load 0.05 0.5 0.312 0.084 9/6/89 - Ti-weave 0.5x6x.09" - C10 load 0.05 0.5 0.329 0.077 3/7/90 - Ti-weave 0.5x6x.09" - C9 load 0.05 0.5 0.329 0.077 3/1/90 - Ti-weave 0.5x6x.09" - C8 load 0.05 0.5 0.329 0.077 10/26/89 - Ti-weave 0.5x6x.09" - C6 load 0.05 0.5 0.329 0.077 10/23/89 - Ti-weave 0.5x6x.09" -

MIL-HDBK-17-4A Volume 4, Appendix D Raw Data Tables for Aluminum Matrix Composites
280
MATERIAL: SiC/Ti-15-3 Table C4.1(e) (3 of 8) SiC/Ti-15-3 FIBER: SCS-6 TEST METHOD: Sec. 1.4.2.4 Fatigue Fatigue MATRIX: Ti-15V-3Cr-3Al-3Sn WAVEFORM: Triangular Laminates PRODUCT FORM: Foil/fiber/foil PRE-TEST EXPOSURE: 1292°F/24 hrs. NASA GRC PRODUCT DIMENSIONS: 12” x 12” TEST ATMOSPHERE: Air Raw Data LAY-UP: Laminates SPECIMEN GEOMETRY: Dogbone PLY COUNT: 8-ply SURFACE CONDITION: As-machined MACHINING METHOD: EDM
at Nf / 2
Specimen No.
Lay-up Fiber v/o
Lot I.D. (Plate)
Test Temp.
E at N=1 E
Total
Strain rate maxε minε maxσ minσ Freq. Nf
(oF) (Msi) (Msi) (1/s) (%) (%) (psi) (psi) (Hz) [0/90] B1 35 87H150 75 26.1 - - - - 71200 2300 0.17 17056 B3 35 87H150 75 27.3 - 0.0010 0.586 0.021 61000 2000 0.17 41914 B5 35 87H150 75 22.2 - 0.0010 0.668 0.104 101900 2900 0.17 5368 B6 35 87H150 75 21.7 - 0.0008 0.694 0.24 50800 2500 0.17 183718 [+/-45] A7 35 87H148 800 11.7 - 0.0008 1.260 0.810 38800 1000 0.17 6276 A8 35 87H148 800 13.4 - 0.0004 1.861 1.636 30600 800 0.17 90709 A9 35 87H148 800 15.5 - 0.0011 1.112 0.488 47700 1000 0.17 1946 A14 35
87H148 800 15.4 - 0.0007 2.120 1.719 33500 1100 0.17 47213
A3 35 87H148 800 19.5 - 0.0006 1.490 1.158 33700 800 0.17 16857 A4 35 87H148 800 16.9 - 0.0008 1.573 1.121 33400 800 0.17 14062 A5 35 87H148 800 12.7 - 0.0005 1.612 1.324 31600 900 0.17 20866

MIL-HDBK-17-4A Volume 4, Appendix D Raw Data Tables for Aluminum Matrix Composites
281
MATERIAL: SiC/Ti-15-3 Table C4.1(e) (4 of 8) SiC/Ti-15-3 FIBER: SCS-6 TEST METHOD: Sec. 1.4.2.4 Fatigue Fatigue MATRIX: Ti-15V-3Cr-3Al-3Sn WAVEFORM: Triangular Laminates PRODUCT FORM: Foil/fiber/foil PRE-TEST EXPOSURE: 1292°F/24 hrs. NASA GRC PRODUCT DIMENSIONS: 12” x 12” TEST ATMOSPHERE: Air Raw Data LAY-UP: Laminates SPECIMEN GEOMETRY: Dogbone PLY COUNT: 8-ply SURFACE CONDITION: As-machined MACHINING METHOD: EDM
Gage Dimensions
l w t Specimen
No. Control Mode R
(in.) (in.) (in.)
Test Date
Failure Location Comments
Specimen Dimensions
Failure Mode
B1 load 0.05 0.5 0.309 0.075 4/21/89 - Ti-weave 0.5x6x.09" - B3 load 0.05 0.5 0.309 0.075 4/30/89 - Ti-weave 0.5x6x.09" - B5 load 0.05 0.5 0.306 0.075 4/17/89 - Ti-weave 0.5x6x.09" - B6 load 0.05 0.5 0.306 0.075 4/4/89 - Ti-weave 0.5x6x.09" - A7 load 0.05 0.5 0.312 0.075 3/8/89 - Ti-weave 0.5x6x0.8" - A8 load 0.05 0.5 0.316 0.076 3/9/89 - Ti-weave 0.5x6x0.8" - A9 load 0.05 0.5 0.317 0.075 3/3/89 - Ti-weave 0.5x6x0.8" - A14 load 0.05 0.5 0.310 0.076 2/21/90 - Ti-weave,
vacuum test 0.5x6x0.8" -
A3 load 0.05 0.5 0.318 0.076 3/18/89 - Ti-weave 0.5x6x0.8" - A4 load 0.05 0.5 0.312 0.076 3/20/89 - Ti-weave 0.5x6x0.8" - A5 load 0.05 0.5 0.316 0.077 3/23/89 - Ti-weave 0.5x6x0.8" -

MIL-HDBK-17-4A Volume 4, Appendix D Raw Data Tables for Aluminum Matrix Composites
282
MATERIAL: SiC/Ti-15-3 Table C4.1(e) (5 of 8) SiC/Ti-15-3 FIBER: SCS-6 TEST METHOD: Sec. 1.4.2.4 Fatigue Fatigue MATRIX: Ti-15V-3Cr-3Al-3Sn WAVEFORM: Triangular Laminates PRODUCT FORM: Foil/fiber/foil PRE-TEST EXPOSURE: 1292°F/24 hrs. NASA GRC PRODUCT DIMENSIONS: 12” x 12” TEST ATMOSPHERE: Air Raw Data LAY-UP: Laminates SPECIMEN GEOMETRY: Dogbone PLY COUNT: 8-ply SURFACE CONDITION: As-machined MACHINING METHOD: EDM
at Nf / 2
Specimen No.
Lay-up Fiber v/o
Lot I.D. (Plate)
Test Temp.
E at N=1 E
Total
Strain rate maxε minε maxσ minσ Freq. Nf
(oF) (Msi) (Msi) (1/s) (%) (%) (psi) (psi) (Hz) [+/-30] H4 35 D890053 75 25.2 - - - - 135300 5400 0.17 4144 H12 35 D890053 75 24.7 21.7 0.0007 0.572 0.133 90900 3600 0.17 13810 H13 35 D890053 75 25.8 - - - - 119100 4800 0.17 6884 H14 35 D890053 75 25.0 12.0 0.0010 1.076 0.471 70700 2800 0.17 105984 H19 35 D890053 75 22.0 14.3 0.0008 0.654 0.168 70500 2800 0.17 109447 H20 35 D890053 75 23.0 19.8 0.0006 0.498 0.117 70500 2700 0.17 54261 D3 35 87H149 75 21.4 - 0.0009 0.690 0.164 100700 4200 0.17 6233 D7 35 87H149 75 22.1 - 0.0006 0.484 0.109 68800 3000 0.17 33288 D11 35 87H149 75 20.6 - - - - 80600 3300 0.17 22477 H2(1) 35 D890053 75 26.2 - 0.0011 0.768 0.139 135300 5300 0.17 6397 H15(1) 35 D890053 75 24.9 20.6 0.0005 0.356 0.039 70700 2900 0.17 55950 H17A(1) 35 D890053 75 24.9 - - - - 70400 2900 0.17 54898 H18A(1) 35 D890053 75 23.9 22.3 0.0007 0.483 0.068 90900 3600 0.17 18133 H5(2) 35 D890053 75 24.9 - 0.0011 0.774 0.109 135200 5600 0.17 544 H17B(2) 35 D890053 75 23.7 - 0.0007 0.508 0.068 90500 3600 0.17 2519 H18B(2) 35 D890053 75 23.3 - 0.0006 0.379 0.031 70700 2800 0.17 18803 (1) Heat treatment: 700 C/ 24h + 427 C/ 24 h in vacuum (2) Heat treatment: 788C/ 15 min + 300 C/ 24 h in vacuum

MIL-HDBK-17-4A Volume 4, Appendix D Raw Data Tables for Aluminum Matrix Composites
283
MATERIAL: SiC/Ti-15-3 Table C4.1(e) (6 of 8) SiC/Ti-15-3 FIBER: SCS-6 TEST METHOD: Sec. 1.4.2.4 Fatigue Fatigue MATRIX: Ti-15V-3Cr-3Al-3Sn WAVEFORM: Triangular Laminates PRODUCT FORM: Foil/fiber/foil PRE-TEST EXPOSURE: 1292°F/24 hrs. NASA GRC PRODUCT DIMENSIONS: 12” x 12” TEST ATMOSPHERE: Air Raw Data LAY-UP: Laminates SPECIMEN GEOMETRY: Dogbone PLY COUNT: 8-ply SURFACE CONDITION: As-machined MACHINING METHOD: EDM
Gage Dimensions
l w t Specimen
No. Control Mode R
(in.) (in.) (in.)
Test Date
Failure Location Comments
Specimen Dimensions
Failure Mode
H4 load 0.05 0.5 0.323 0.068 9/25/90 gauge Mo-weave 0.5X6X.07" - H12 load 0.05 0.5 0.323 0.066 7/10/90 - Mo-weave 0.5X6X.07" - H13 load 0.05 0.5 0.323 0.067 9/20/90 gauge Mo-weave 0.5X6X.07" - H14 load 0.05 0.5 0.322 0.068 9/12/90 gauge Mo-weave 0.5X6X.07" - H19 load 0.05 0.5 0.312 0.067 3/11/91 - Mo-weave 0.5X6X.07" - H20 load 0.05 0.5 0.312 0.068 2/25/91 radius Mo-weave 0.5X6X.07" - D3 load 0.05 0.5 0.292 0.079 10/18/90 gauge Ti-weave 0.5X6X.08" - D7 load 0.05 0.5 0.292 0.077 10/19/90 radius Ti-weave 0.5X6X.08" - D11 load 0.05 0.5 0.292 0.075 10/17/90 radius Ti-weave 0.5X6X.08" - H2 load 0.05 0.5 0.324 0.066 10/1/90 gauge Mo-weave 0.5X6X.07" - H15 load 0.05 0.5 0.324 0.068 3/4/91 - Mo-weave 0.5X6X.07" - H17A load 0.05 0.5 0.313 0.067 11/7/90 gauge Mo-weave 0.5X6X.07" - H18A load 0.05 0.5 0.312 0.068 11/13/90 gauge Mo-weave 0.5X6X.07" - H5 load 0.05 0.5 0.317 0.066 10/23/90 radius Mo-weave 0.5X6X.07" - H17B load 0.05 0.5 0.312 0.068 11/27/90 radius Mo-weave 0.5X6X.07" - H18B load 0.05 0.5 0.314 0.067 11/28/90 radius Mo-weave 0.5X6X.07" -

MIL-HDBK-17-4A Volume 4, Appendix D Raw Data Tables for Aluminum Matrix Composites
284
MATERIAL: SiC/Ti-15-3 Table C4.1(e) (7 of 8) SiC/Ti-15-3 FIBER: SCS-6 TEST METHOD: Sec. 1.4.2.4 Fatigue Fatigue MATRIX: Ti-15V-3Cr-3Al-3Sn WAVEFORM: Triangular Laminates PRODUCT FORM: Foil/fiber/foil PRE-TEST EXPOSURE: 1292°F/24 hrs. NASA GRC PRODUCT DIMENSIONS: 10” x 14” TEST ATMOSPHERE: Air Raw Data LAY-UP: [+/-30]8s SPECIMEN GEOMETRY: Dogbone PLY COUNT: 32-ply SURFACE CONDITION: As-machined MACHINING METHOD: EDM+diamond ground
at Nf / 2
Specimen No.
Lay-up Fiber v/o
Lot I.D. (Plate)
Test Temp.
E at N=1 E
Total
Strain rate maxε minε maxσ minσ Freq. Nf
[+/-30] (oF) (Msi) (Msi) (1/s) (%) (%) (psi) (psi) (Hz) G2 35 J890508 75 21.5 14.6 0.0023 0.350 -0.350 65000 -72000 0.16 >177434 8-15 35 J890508 800 19.7 14.4 0.0010 0.603 -0.599 66700 -69200 0.04 2056 9-1 35 J890509 75 22.8 21.0 0.0010 0.500 -0.500 90000 -100000 0.05 5453 9-2 35 J890509 75 21.3 19.2 0.0010 0.400 -0.400 71000 -73000 0.06 16109 9-3 35 J890509 75 21.6 19.6 0.0010 0.300 -0.300 53000 -59000 0.08 36823 9-6 35 J890509 800 19.5 16.9 0.0010 0.305 -0.305 45000 -45000 0.08 56303 9-10 35 J890509 800 19.7 17.5 0.0010 0.405 -0.405 45000 -58000 0.06 28269 9-11 35 J890509 800 20.2 12.7 0.0010 0.500 -0.500 62000 -65000 0.05 4921 9-12 35 J890509 800 20.0 14.0 0.0010 0.455 -0.455 55000 -61000 0.05 9531 9-13 35 J890509 800 20.2 16.9 0.0010 0.355 -0.355 42000 -47000 0.07 45547 9-14 35 J890509 800 19.5 12.8 0.0011 1.170 0.640 70300 3200 0.10 2003 9-15 35 J890509 800 20.8 13.5 0.0014 1.520 1.150 50300 2200 0.19 39432 9-17 35 J890509 800 20.3 13.8 0.0024 1.400 0.500 62500 3400 0.13 3342 9-18 35 J890509 800 21.2 14.3 0.0013 2.700 2.200 55300 2400 0.13 12412 9-19 35 J890509 800 20.5 14.6 0.0011 1.800 1.100 95500 4300 0.08 244 9-20 35 J890509 800 20.9 13.3 0.0010 0.705 -0.705 71100 -73200 0.04 841

MIL-HDBK-17-4A Volume 4, Appendix D Raw Data Tables for Aluminum Matrix Composites
285
MATERIAL: SiC/Ti-15-3 Table C4.1(e) (8 of 8) SiC/Ti-15-3 FIBER: SCS-6 TEST METHOD: Sec. 1.4.2.4 Fatigue Fatigue MATRIX: Ti-15V-3Cr-3Al-3Sn WAVEFORM: Triangular Laminates PRODUCT FORM: Foil/fiber/foil PRE-TEST EXPOSURE: 1292°F/24 hrs. NASA GRC PRODUCT DIMENSIONS: 10” x 14” TEST ATMOSPHERE: Air Raw Data LAY-UP: [+/-30]8s SPECIMEN GEOMETRY: Dogbone PLY COUNT: 32-ply SURFACE CONDITION: As-machined MACHINING METHOD: EDM+diamond ground
Gage Dimensions
l w t Specimen
No. Control Mode R
(in.) (in.) (in.)
Test Date
Failure Location Comments
Specimen Dimensions
Failure Mode
G2 strain -1 0.5 0.330 0.299 4/9/90 - (1) Mo-weave 0.5x6.0x0.3 - 8-15 strain -1 0.5 0.390 0.299 3/9/93 gauge Mo-weave 0.5x6.0x0.3 - 9-1 strain -1 0.5 0.399 0.299 4/29/91 gauge Mo-weave 0.5x6.0x0.3 - 9-2 strain -1 0.5 0.399 0.299 5/13/91 gauge Mo-weave 0.5x6.0x0.3 - 9-3 strain -1 0.5 0.399 0.300 3/18/92 gauge(1) Mo-weave 0.5x6.0x0.3 - 9-6 strain -1 0.5 0.398 0.300 3/31/92 gauge Mo-weave 0.5x6.0x0.3 - 9-10 strain -1 0.5 0.390 0.301 4/29/92 gauge Mo-weave 0.5x6.0x0.3 - 9-11 strain -1 0.5 0.390 0.301 5/6/92 radius Mo-weave 0.5x6.0x0.3 - 9-12 strain -1 0.5 0.390 0.300 5/11/92 radius Mo-weave 0.5x6.0x0.3 - 9-13 strain -1 0.5 0.390 0.301 5/18/92 gauge(1) Mo-weave 0.5x6.0x0.3 - 9-14 load 0.05 0.5 0.390 0.301 6/11/92 gauge Mo-weave 0.5x6.0x0.3 - 9-15 load 0.05 0.5 0.390 0.301 6/15/92 gauge Mo-weave 0.5x6.0x0.3 - 9-17 load 0.05 0.5 0.390 0.300 6/19/92 radius Mo-weave 0.5x6.0x0.3 - 9-18 load 0.05 0.5 0.389 0.299 6/29/92 gauge Mo-weave 0.5x6.0x0.3 - 9-19 load 0.05 0.5 0.389 0.299 7/6/92 gauge Mo-weave 0.5x6.0x0.3 - 9-20 strain -1 0.5 0.388 0.299 7/8/92 gauge Mo-weave 0.5x6.0x0.3 - (1) Failure at 30% load drop

MIL-HDBK-17-4A Volume 4, Appendix D Raw Data Tables for Aluminum Matrix Composites
286
C4.2. TRIMARC-1/Ti 6-2-4-2 (Section 3.8.2.2.1 and 3.8.2.2.2) MATERIAL: TRIMARC-1/Ti 6-2-4-2 Screening Data Table C4.2(a) (1 of 4) TRIMARC-1/Ti 6-2-4-2 FIBER: TRIMARC-1 SPECIMEN GEOMETRY: Straight-sided Tension MATRIX: Ti-6Al-2Sn-4Zr-2Mo SURFACE CONDITION: As received [0]10 PRODUCT FORM: Plate MACHINING METHOD: Water Jet and Diamond Grind Air Force Research Lab (AFRL/ MLLN) LAY-UP: [0]10 PRE-TEST EXPOSURE: None Calculated Data TEST METHOD: 1.4.2.1 TEST ENVIRONMENT: Laboratory Air Specimen
No. Fiber v/o
Lot I.D. (Plate)
Test Temp.
Strain rate
Et1 Prop.
Limit Fty
10 02. Fty
10 2. Ftu
1 ε1tf ν12
t Comments
(°F) (1/s) (Msi) (ksi) (ksi) (ksi) (ksi) (%) 94-H89 32.4 2-5410418-1 73 0.0008 30.6 169.2 0.550 0.276 Broke outside the gage length; Extensometer
slipped. Max strain obtained. 96-J85 29.2 1-7353451-2 73 0.0001 29.8 225.4 0.760 Broke outside the gage length. 96-J86 29.3 1-7353451-2 73 0.0001 29.2 236.6 0.810 Broke outside the gage length. 96-J87 30.1 1-7353451-2 73 0.0001 29.8 210.3 0.690 Broke outside the gage length. 96-J90 29.9 1-7353451-3 325 0.001 30.3 216.5 0.540 Broke outside the gage length; Extensometer
slipped. Max strain obtained. 96-J91 29.6 1-7353451-3 325 0.001 29.8 214.1 0.760 Broke outside the gage length. 96-J92 29.5 1-7353451-3 325 0.001 30.9 227.4 0.770 Broke outside the gage length. 96-J93 29.4 1-7353451-3 325 0.001 29.2 217.3 0.770 Broke outside the gage length. 96-J94 29.4 1-7353451-3 325 0.0001 29.6 187.1 0.660 Broke outside the gage length; Extensometer
slipped. Max strain obtained. 96-J95 29.6 1-7353451-3 325 0.00001 28.6 165.9 0.570 Broke outside the gage length. 96-J96 29.2 1-7353451-3 700 0.001 26.9 202.7 0.820 Broke outside the gage length. 96-J97 29.3 1-7353451-3 700 0.001 31.1 191.8 0.680 Broke outside the gage length. 96-J98 29.1 1-7353451-3 700 0.001 28.4 186.5 0.620 Broke outside the gage length. 96-J99 29.2 1-7353451-3 700 0.0001 28.4 141.6 0.510 Broke outside the gage length. 96-K00 29.3 1-7353451-3 700 0.00001 28.2 207.1 0.760 Broke outside the gage length. 96-P97 27.5 2-7353451-6 73 0.0001 29.0 251.3 0.720 Broke outside the gage length; Extensometer
slipped. Max strain obtained. 96-P98 27.3 2-7353451-6 73 0.0001 31.0 229.7 0.800 Broke outside the gage length. 96-P99 27.3 2-7353451-6 73 0.0001 29.5 216.7 0.630 Broke outside the gage length; Extensometer
slipped. Max strain obtained.

MIL-HDBK-17-4A Volume 4, Appendix D Raw Data Tables for Aluminum Matrix Composites
287
MATERIAL: TRIMARC-1/Ti 6-2-4-2 Screening Data Table C4.2(a) (2 of 4) TRIMARC-1/Ti 6-2-4-2 FIBER: TRIMARC-1 SPECIMEN GEOMETRY: Straight-sided Tension MATRIX: Ti-6Al-2Sn-4Zr-2Mo SURFACE CONDITION: As received [0]10 PRODUCT FORM: Plate MACHINING METHOD: Water Jet and Diamond Grind Air Force Research Lab (AFRL/ MLLN) LAY-UP: [0]10 PRE-TEST EXPOSURE: None Calculated Data TEST METHOD: 1.4.2.1 TEST ENVIRONMENT: Laboratory Air
Speci-men No.
Test Date
Failure Loca-tion
Failure Mode
Reduction of Area
Elongation Area Load @ 0.2% Offset
Ulti-mate Load
Width Thick-ness
Original Gage
Length
Final Gage
Length
Final Width
Final Thickness
Final Area
(%) (%) (in^2) (lbs) (lbs) (in) (in) (in) (in) (in) (in) (in^2) 94-H89 0.0311 5265 0.3890 0.0800 1.0158 1.0176 0.3880 0.0800 0.0310 96-J85 1.79 0.0280 6310 0.3151 0.0889 96-J86 0.72 0.0279 6600 0.3152 0.0886 96-J87 1.48 0.0271 5700 0.3154 0.0860 96-J90 1.10 0.0273 4900 0.3157 0.0866 96-J91 0.73 0.0276 5910 0.3157 0.0875 96-J92 1.44 0.0277 6300 0.3157 0.0878 96-J93 1.44 0.0278 6040 0.3154 0.0882 96-J94 0.72 0.0278 5200 0.3153 0.0881 96-J95 0.36 0.0276 4580 0.3150 0.0877 96-J96 2.86 0.0280 5675 0.3156 0.0887 96-J97 1.79 0.0279 5350 0.3152 0.0885 96-J98 3.56 0.0281 5240 0.3158 0.0891 96-J99 1.42 0.0281 3980 0.3159 0.0888 96-K00 0.71 0.0280 5800 0.3162 0.0885 96-P97 2.69 0.0298 7490 0.3157 0.0943 96-P98 0.67 0.0300 6890 0.3163 0.0950 96-P99 1.33 0.0300 6500 0.3162 0.0950

MIL-HDBK-17-4A Volume 4, Appendix D Raw Data Tables for Aluminum Matrix Composites
288
MATERIAL: TRIMARC-1/Ti 6-2-4-2 Screening Data Table C4.2(a) (3 of 4) TRIMARC-1/Ti 6-2-4-2 FIBER: TRIMARC-1 SPECIMEN GEOMETRY: Straight-sided Tension MATRIX: Ti-6Al-2Sn-4Zr-2Mo SURFACE CONDITION: As received [0]10 PRODUCT FORM: Plate MACHINING METHOD: Water Jet and Diamond Grind Air Force Research Lab (AFRL/ MLLN) LAY-UP: [0]10 PRE-TEST EXPOSURE: None Calculated Data TEST METHOD: 1.4.2.1 TEST ENVIRONMENT: Laboratory Air
Specimen No.
Fiber v/o
Lot I.D. (Plate)
Test Temp.
Strain rate
Et1 Prop.
Limit Fty
10 02. Fty
10 2. Ftu
1 ε1tf ν12
t Comments
(°F) (1/s) (Msi) (ksi) (ksi) (ksi) (ksi) (%) 96-Q00 27.2 2-7353451-6 325 0.001 27.6 200.7 0.660 Broke outside the gage length; Extensometer
slipped. Max strain obtained. 96-Q01 27.3 2-7353451-6 325 0.001 28.7 216.5 0.800 Broke outside the gage length. 96-Q02 27.7 2-7353451-6 325 0.001 30.2 209.1 0.730 Broke outside the gage length. 96-Q03 27.6 2-7353451-6 325 0.001 27.8 186.9 0.680 Broke outside the gage length. 96-Q04 27.5 2-7353451-6 325 0.0001 27.9 212.4 0.740 Broke outside the gage length. 96-Q05 27.3 2-7353451-6 325 0.00001 27.9 198.3 0.720 Broke outside the gage length. 96-Q06 27.4 2-7353451-6 700 0.001 30.5 178.6 0.630 Broke outside the gage length. 96-Q07 27.5 2-7353451-6 700 0.001 26.1 199.7 0.830 Broke outside the gage length. 96-Q08 27.6 2-7353451-6 700 0.001 29.5 197.6 0.680 Broke outside the gage length. 96-Q09 27.4 2-7353451-6 700 0.0001 27.9 185.3 0.710 Broke outside the gage length. 96-Q10 27.4 2-7353451-6 700 0.00001 26.3 185.6 0.750 Broke outside the gage length. 96-Q73 29.5 3-7353451-10 73 0.0001 29.0 223.4 0.770 Broke outside the gage length. 96-Q74 29.7 3-7353451-10 73 0.0001 31.8 240.1 0.840 Broke outside the gage length. 96-Q75 29.8 3-7353451-10 73 0.0001 28.8 239.9 0.850 Broke outside the gage length. 96-Q76 29.5 3-7353451-10 325 0.001 27.7 205.0 0.740 Broke outside the gage length. 96-Q77 29.4 3-7353451-10 325 0.001 28.1 203.4 0.700 Broke outside the gage length. 96-Q78 29.4 3-7353451-10 325 0.001 31.8 215.1 0.750 Broke outside the gage length. 96-Q79 29.5 3-7353451-10 325 0.001 30.7 219.1 0.690 Broke outside the gage length. 96-Q80 29.4 3-7353451-10 325 0.0001 27.7 206.8 0.750 Broke outside the gage length. 96-Q81 29.7 3-7353451-10 325 0.00001 27.7 217.8 0.850 Broke outside the gage length. 96-Q82 29.2 3-7353451-10 700 0.001 29.8 202.9 0.760 Broke outside the gage length. 96-Q83 29.1 3-7353451-10 700 0.001 28.2 179.7 0.650 Broke outside the gage length. 96-Q84 29.0 3-7353451-10 700 0.001 Damaged during set up. 96-Q85 28.9 3-7353451-10 700 0.0001 27.8 195.1 0.740 Broke outside the gage length. 96-Q86 29.0 3-7353451-10 700 0.00001 28.9 189.0 0.720 Broke outside the gage length.

MIL-HDBK-17-4A Volume 4, Appendix D Raw Data Tables for Aluminum Matrix Composites
289
MATERIAL: TRIMARC-1/Ti 6-2-4-2 Screening Data Table C4.2(a) (4 of 4) TRIMARC-1/Ti 6-2-4-2 FIBER: TRIMARC-1 SPECIMEN GEOMETRY: Straight-sided Tension MATRIX: Ti-6Al-2Sn-4Zr-2Mo SURFACE CONDITION: As received [0]10 PRODUCT FORM: Plate MACHINING METHOD: Water Jet and Diamond Grind Air Force Research Lab (AFRL/ MLLN) LAY-UP: [0]10 PRE-TEST EXPOSURE: None Calculated Data TEST METHOD: 1.4.2.1 TEST ENVIRONMENT: Laboratory Air Specimen
No. Test Date
Failure Loca-tion
Failure Mode
Reduction of Area
Elongation Area Load @ 0.2% Offset
Ultimate Load
Width Thick-ness
Original Gage
Length
Final Gage
Length
Final Width
Final Thickness
Final Area
(%) (%) (in^2) (lbs) (lbs) (in) (in) (in) (in) (in) (in) (in^2) 96-Q00 1.00 0.0301 6040 0.3164 0.0952 96-Q01 1.33 0.0300 6495 0.3163 0.0949 96-Q02 1.35 0.0296 6190 0.3156 0.0937 96-Q03 1.35 0.0297 5550 0.3163 0.0939 96-Q04 1.00 0.0299 6350 0.3163 0.0944 96-Q05 1.00 0.0300 5950 0.3155 0.0951 96-Q06 2.00 0.0300 5350 0.3166 0.0946 96-Q07 1.34 0.0298 5950 0.3158 0.0943 96-Q08 1.01 0.0296 5850 0.3156 0.0938 96-Q09 1.34 0.0299 5540 0.3158 0.0948 96-Q10 2.01 0.0299 5550 0.3158 0.0946 96-Q73 2.52 0.0278 6210 0.3161 0.0879 96-Q74 1.81 0.0277 6650 0.3170 0.0873 96-Q75 1.09 0.0276 6620 0.3171 0.0871 96-Q76 0.72 0.0278 5700 0.3158 0.0880 96-Q77 0.72 0.0279 5675 0.3159 0.0882 96-Q78 0.72 0.0279 6000 0.3160 0.0883 96-Q79 0.72 0.0278 6090 0.3157 0.0880 96-Q80 0.36 0.0278 5750 0.3157 0.0881 96-Q81 0.73 0.0275 5990 0.3151 0.0873 96-Q82 0.72 0.0277 5620 0.3149 0.0888 96-Q83 0.36 0.0281 5050 0.3152 0.0890 96-Q84 0.0282 0.3152 0.0895 96-Q85 1.41 0.0283 5520 0.3150 0.0897 96-Q86 2.13 0.0282 5330 0.3146 0.0895

MIL-HDBK-17-4A Volume 4, Appendix D Raw Data Tables for Aluminum Matrix Composites
290
MATERIAL: TRIMARC-1/Ti 6-2-4-2 Screening Data Table C4.2(b) (1 of 1) TRIMARC-1/Ti 6-2-4-2 FIBER: TRIMARC-1 SPECIMEN GEOMETRY: Straight-sided Tension MATRIX: Ti-6Al-2Sn-4Zr-2Mo SURFACE CONDITION: As received [0]8 PRODUCT FORM: Plate MACHINING METHOD: Water Jet and Diamond Grind Air Force Research Lab (AFRL/ MLLN) LAY-UP: [0]8 PRE-TEST EXPOSURE: None Calculated Data TEST METHOD: 1.4.2.1 TEST ENVIRONMENT: Laboratory Air
Specimen No. Fiber v/o
Lot I.D. (Plate)
Test Temp.
Strain rate
Et1 Prop.
Limit Fty
10 02. Fty
10 2. Ftu
1 ε1tf ν12
t Comments
(°F) (1/s) (Msi) (ksi) (ksi) (ksi) (ksi) (%) 94-H81 30.5 7-5410422-1 700 0.0008 24.0 190.0 0.840 Broke outside the gage length. 94-H82 30.7 7-5410422-1 700 0.0008 25.7 205.5 0.860 Broke outside the gage length. 94-H83 30.5 7-5410422-1 700 0.0008 26.9 191.5 0.730 Broke outside the gage length. 94-H84 31.0 7-5410422-1 325 0.0008 25.9 220.1 0.870 Broke outside the gage length. 94-H85 31.0 7-5410422-1 325 0.0008 26.0 230.1 0.960 Broke outside the gage length. 94-H86 30.5 7-5410422-1 325 0.0008 26.8 230.3 0.920 Broke outside the gage length. 94-H87 30.7 7-5410422-1 73 0.0008 29.5 239.4 0.810 0.292 Broke outside the gage length. 94-H88 30.5 7-5410422-1 73 0.0008 28.2 255.2 0.920 0.298 Broke outside the gage length. Specimen
No. Test Date
Failure Loca-tion
Failure Mode
Reduction of Area
Elongation Area Load @ 0.2% Offset
Ultimate Load
Width Thick-ness
Original Gage
Length
Final Gage
Length
Final Width
Final Thickness
Final Area
(%) (%) (in^2) (lbs) (lbs) (in) (in) (in) (in) (in) (in) (in^2) 94-H81 0.0247 4689 0.3630 0.0680 1.0102 1.0105 0.3630 0.0670 0.0243 94-H82 0.0245 5035 0.3630 0.0675 1.0096 1.0103 0.3630 0.0675 0.0245 94-H83 0.0247 4726 0.3630 0.0680 1.0070 1.0074 0.3630 0.0675 0.0245 94-H84 0.0243 5353 0.3630 0.0670 1.0104 1.0109 0.3630 0.0670 0.0243 94-H85 0.0243 5595 0.3630 0.0670 1.0091 1.0100 0.3630 0.0670 0.0243 94-H86 0.0247 5685 0.3630 0.0680 1.0102 1.0107 0.3630 0.0680 0.0247 94-H87 0.0245 5866 0.3630 0.0675 1.0200 1.0213 0.3630 0.0675 0.0245 94-H88 0.0248 6317 0.3640 0.0680 1.0057 1.0067 0.3640 0.0680 0.0248

MIL-HDBK-17-4A Volume 4, Appendix D Raw Data Tables for Aluminum Matrix Composites
291
MATERIAL: TRIMARC-1/Ti 6-2-4-2 Screening Data Table C4.2(c) (1 of 4) TRIMARC-1/Ti 6-2-4-2 FIBER: TRIMARC-1 SPECIMEN GEOMETRY: Straight-sided Tension MATRIX: Ti-6Al-2Sn-4Zr-2Mo SURFACE CONDITION: As received [90]10 PRODUCT FORM: Plate MACHINING METHOD: Water Jet and Diamond Grind Air Force Research Lab (AFRL/ MLLN) LAY-UP: [90]10 PRE-TEST EXPOSURE: None Calculated Data TEST METHOD: 1.4.2.1 TEST ENVIRONMENT: Laboratory Air Specimen
No. Fiber v/o
Lot I.D. (Plate)
Test Temp.
Strain rate
Et1 Prop.
Limit Fty
10 02. Fty
10 2. Ftu
1 ε1tf ν12
t Comments
(°F) (1/s) (Msi) (ksi) (ksi) (ksi) (ksi) (%) 94-H79 32.2 1-5410417-1 73 0.0008 23.0 37.4 0.200 0.198 Broke outside the gage length. 94-H80 32.2 2-5410418-1 73 0.0008 24.4 35.4 0.150 0.233 Broke outside the gage length. 96-K45 28.7 1-7353452-2 73 0.0001 22.8 59.3 0.660 96-K46 28.7 1-7353452-2 73 0.0001 22.0 59.4 0.680 96-K47 28.7 1-7353452-2 73 0.0001 22.9 56.0 0.620 96-K48 28.8 1-7353452-2 325 0.001 Ult. load from X-Y plot. 96-K49 28.7 1-7353452-2 325 0.001 19.1 63.2 0.960 Broke outside the gage length. 96-K50 28.8 1-7353452-2 325 0.0001 20.1 58.8 0.820 96-K51 28.8 1-7353452-2 325 0.00001 18.7 56.7 0.880 Broke outside the gage length. 96-K52 28.9 1-7353452-2 700 0.001 19.0 55.3 1.120 Broke outside the gage length. 96-K55 28.8 1-7353452-1 700 0.0001 15.8 57.0 0.720 Broke outside the gage length; Extensometer
slipped. Max strain obtained. 96-K56 28.7 1-7353452-1 700 0.00001 12.2 53.9 57.7 1.640 Broke outside the gage length. 96-Q21 29.2 2-7353452-3 73 0.0001 24.4 54.3 0.520 96-Q22 29.2 2-7353452-3 73 0.0001 22.4 49.1 0.480 96-Q23 29.3 2-7353452-3 73 0.0001 23.8 53.5 0.600 96-Q24 29.5 2-7353452-3 325 0.0001 21.4 57.4 63.2 1.260 96-Q25 29.5 2-7353452-3 325 0.001 20.5 58.0 60.2 1.000 96-Q26 29.5 2-7353452-3 325 0.001 21.1 60.7 62.2 1.000 Broke outside the gage length. 96-Q27 29.6 2-7353452-3 325 0.00001 19.3 53.8 0.240 Extensometer slipped. Max strain obtained. 96-Q28 29.9 2-7353452-3 700 0.001 20.0 46.0 49.6 1.060 96-Q29 30.0 2-7353452-3 700 0.0001 18.6 45.6 47.1 1.040 96-Q30 30.1 2-7353452-3 700 0.00001 16.9 46.2 47.6 Damaged during set up. 96-Q89 29.2 3-7353452-6 73 0.0001 23.0 41.6 0.380 Broke outside the gage length. 96-Q90 29.5 3-7353452-6 73 0.0001 22.0 45.5 0.420 96-Q91 29.0 3-7353452-6 73 0.0001 22.9 46.1 0.500

MIL-HDBK-17-4A Volume 4, Appendix D Raw Data Tables for Aluminum Matrix Composites
292
MATERIAL: TRIMARC-1/Ti 6-2-4-2 Screening Data Table C4.2(c) (2 of 4) TRIMARC-1/Ti 6-2-4-2 FIBER: TRIMARC-1 SPECIMEN GEOMETRY: Straight-sided Tension MATRIX: Ti-6Al-2Sn-4Zr-2Mo SURFACE CONDITION: As received [90]10 PRODUCT FORM: Plate MACHINING METHOD: Water Jet and Diamond Grind Air Force Research Lab (AFRL/ MLLN) LAY-UP: [90]10 PRE-TEST EXPOSURE: None Calculated Data TEST METHOD: 1.4.2.1 TEST ENVIRONMENT: Laboratory Air Specimen
No. Test Date
Failure Loca-tion
Failure Mode
Reduction of Area
Elonga-tion
Area Load @ 0.2% Offset
Ultimate Load
Width Thick-ness
Original Gage
Length
Final Gage
Length
Final Width
Final Thickness
Final Area
(%) (%) (in^2) (lbs) (lbs) (in) (in) (in) (in) (in) (in) (in^2) 94-H79 0.0312 1164 0.3870 0.0805 0.9975 0.9966 0.3870 0.0805 0.0312 94-H80 0.0312 1102 0.3870 0.0805 1.0204 1.0188 0.3870 0.0805 0.0312 96-K45 0.35 0.57 0.0284 1683 0.3140 0.0904 96-K46 1.40 0.62 0.0285 1690 0.3144 0.0905 96-K47 0.00 0.59 0.0284 1590 0.3141 0.0905 96-K48 0.0284 0.3153 0.0900 96-K49 1.76 0.0284 1795 0.3152 0.0902 96-K50 1.76 0.74 0.0284 1670 0.3155 0.0899 96-K51 1.06 0.0284 1610 0.3159 0.0899 96-K52 1.41 0.0284 1570 0.3166 0.0898 96-K55 0.70 0.0285 1625 0.3170 0.0900 96-K56 1.40 0.0286 1540 1650 0.3171 0.0902 96-Q21 1.43 0.50 0.0280 1520 0.3155 0.0889 96-Q22 1.08 0.46 0.0279 1370 0.3149 0.0887 96-Q23 1.43 0.57 0.0280 1498 0.3154 0.0886 96-Q24 1.81 0.77 0.0277 1590 1750 0.3149 0.0878 96-Q25 1.09 0.92 0.0276 1600 1660 0.3148 0.0878 96-Q26 0.36 0.0277 1680 1722 0.3149 0.0878 96-Q27 1.45 0.59 0.0276 1485 0.3150 0.0875 96-Q28 1.09 0.95 0.0276 1270 1370 0.3154 0.0868 96-Q29 1.09 0.62 0.0275 1255 1295 0.3146 0.0864 96-Q30 1.46 1.33 0.0275 1270 1310 0.3154 0.0860 96-Q89 0.00 0.0279 1160 0.3146 0.0888 96-Q90 1.40 0.39 0.0277 1260 0.3143 0.0880 96-Q91 2.13 0.49 0.0282 1300 0.3158 0.0894

MIL-HDBK-17-4A Volume 4, Appendix D Raw Data Tables for Aluminum Matrix Composites
293
MATERIAL: TRIMARC-1/Ti 6-2-4-2 Screening Data Table C4.2(c) (3 of 4) TRIMARC-1/Ti 6-2-4-2 FIBER: TRIMARC-1 SPECIMEN GEOMETRY: Straight-sided Tension MATRIX: Ti-6Al-2Sn-4Zr-2Mo SURFACE CONDITION: As received [90]10 PRODUCT FORM: Plate MACHINING METHOD: Water Jet and Diamond Grind Air Force Research Lab (AFRL/ MLLN) LAY-UP: [90]10 PRE-TEST EXPOSURE: None Calculated Data TEST METHOD: 1.4.2.1 TEST ENVIRONMENT: Laboratory Air Specimen No. Fiber
v/o Lot I.D. (Plate)
Test Temp.
Strain rate
Et1 Prop.
Limit Fty
10 02. Fty
10 2. Ftu
1 ε1tf ν12
t Comments
(°F) (1/s) (Msi) (ksi) (ksi) (ksi) (ksi) (%) 96-Q92 29.5 3-7353452-6 325 0.001 19.3 56.5 0.920 Broke outside the gage length. 96-Q93 29.5 3-7353452-6 325 0.001 23.4 57.8 0.260 Broke outside the gage length; Extensometer
slipped. Max strain obtained. 96-Q94 29.2 3-7353452-6 325 0.0001 19.9 52.3 0.740 96-Q95 29.2 3-7353452-6 325 0.00001 Ult. load from X-Y plot. 96-Q96 29.1 3-7353452-6 700 0.001 17.5 49.7 55.5 1.480 96-Q97 29.0 3-7353452-6 700 0.0001 19.4 49.1 57.5 1.860 Broke outside the gage length. 96-Q98 29.1 3-7353452-6 700 0.00001 18.9 47.2 49.5 1.120 Broke outside the gage length.

MIL-HDBK-17-4A Volume 4, Appendix D Raw Data Tables for Aluminum Matrix Composites
294
MATERIAL: TRIMARC-1/Ti 6-2-4-2 Screening Data Table C4.2(c) (4 of 4) TRIMARC-1/Ti 6-2-4-2 FIBER: TRIMARC-1 SPECIMEN GEOMETRY: Straight-sided Tension MATRIX: Ti-6Al-2Sn-4Zr-2Mo SURFACE CONDITION: As received [90]10 PRODUCT FORM: Plate MACHINING METHOD: Water Jet and Diamond Grind Air Force Research Lab (AFRL/ MLLN) LAY-UP: [90]10 PRE-TEST EXPOSURE: None Calculated Data TEST METHOD: 1.4.2.1 TEST ENVIRONMENT: Laboratory Air Specimen
No. Test Date
Failure Loca-tion
Failure Mode
Reduction of Area
Elongation Area Load @ 0.2% Offset
Ultimate Load
Width Thick-ness
Original Gage
Length
Final Gage
Length
Final Width
Final Thickness
Final Area
(%) (%) (in^2) (lbs) (lbs) (in) (in) (in) (in) (in) (in) (in^2) 96-Q92 1.08 0.0278 1570 0.3157 0.0880 96-Q93 1.08 0.0277 1600 0.3151 0.0880 96-Q94 1.43 0.09 0.0279 1460 0.3144 0.0887 96-Q95 0.0280 0.3154 0.0888 96-Q96 2.13 0.63 0.0282 1400 1565 0.3161 0.0891 96-Q97 2.13 0.0282 1385 1620 0.3154 0.0893 96-Q98 1.42 0.0281 1325 1390 0.3154 0.0892

MIL-HDBK-17-4A Volume 4, Appendix D Raw Data Tables for Aluminum Matrix Composites
295
MATERIAL: TRIMARC-1/Ti 6-2-4-2 Screening Data Table C4.2(d) (1 of 1) TRIMARC-1/Ti 6-2-4-2 FIBER: TRIMARC-1 SPECIMEN GEOMETRY: Straight-sided Tension MATRIX: Ti-6Al-2Sn-4Zr-2Mo SURFACE CONDITION: As received [90]8 PRODUCT FORM: Plate MACHINING METHOD: Water Jet and Diamond Grind Air Force Research Lab (AFRL/ MLLN) LAY-UP: [90]8 PRE-TEST EXPOSURE: None Calculated Data TEST METHOD: 1.4.2.1 TEST ENVIRONMENT: Laboratory Air
Specimen No. Fiber v/o
Lot I.D. (Plate)
Test Temp.
Strain rate
Et1 Prop.
Limit Fty
10 02. Fty
10 2. Ftu
1 ε1tf ν12
t Comments
(°F) (1/s) (Msi) (ksi) (ksi) (ksi) (ksi) (%) 94-H72 30.5 7-5410422-1 325 0.0008 18.3 51.5 52.3 0.520 Broke outside the gage length. 94-H73 30.5 7-5410422-1 700 0.0008 13.3 42.9 45.6 0.620 94-H74 30.5 7-5410422-1 700 0.0008 12.1 41.7 0.490 Broke outside the gage length. 94-H75 30.3 7-5410422-1 700 0.0008 15.5 43.3 45.2 0.530 Broke outside the gage length. 94-H76 30.3 7-5410422-1 325 0.0008 18.4 49.3 0.430 Broke outside the gage length. 94-H77 30.3 7-5410422-1 325 0.0008 18.6 50.0 0.430 Broke outside the gage length. 94-H78 30.5 7-5410422-1 73 0.0008 22.5 45.7 0.260 0.223 Broke outside the gage length. Specimen
No. Test Date
Failure Loca-tion
Failure Mode
Reduction of Area
Elongation Area Load @ 0.2% Offset
Ultimate Load
Width Thick-ness
Original Gage
Length
Final Gage
Length
Final Width
Final Thickness
Final Area
(%) (%) (in^2) (lbs) (lbs) (in) (in) (in) (in) (in) (in) (in^2) 94-H72 0.0247 1270 1290 0.3630 0.0680 1.0123 1.0121 0.3630 0.0680 0.0247 94-H73 0.0252 1080 1148 0.3700 0.0680 1.0199 1.0108 0.3700 0.0675 0.0250 94-H74 0.0254 1058 0.3730 0.0680 1.0107 1.0102 0.3730 0.0675 0.0252 94-H75 0.0256 1110 1158 0.3740 0.0685 1.0116 1.0113 0.3740 0.0680 0.0254 94-H76 0.0256 1260 0.3730 0.0685 1.0108 1.0104 0.3730 0.0680 0.0254 94-H77 0.0256 1280 0.3740 0.0685 1.0075 1.0068 0.3740 0.0680 0.0254 94-H78 0.0254 1161 0.3740 0.0680 0.9989 0.9969 0.3740 0.0680 0.0254

MIL-HDBK-17-4A Volume 4, Appendix D Raw Data Tables for Aluminum Matrix Composites
296
MATERIAL: TRIMARC-1/Ti 6-2-4-2 Screening Data Table C4.2(e) (1 of 2) TRIMARC-1/Ti 6-2-4-2 FIBER: TRIMARC-1 SPECIMEN GEOMETRY: Straight-sided Compression MATRIX: Ti-6Al-2Sn-4Zr-2Mo SURFACE CONDITION: As received [0]10 PRODUCT FORM: Plate MACHINING METHOD: Water Jet and Diamond Grind Air Force Research Lab (AFRL/ MLLN) LAY-UP: [0]10 PRE-TEST EXPOSURE: None Calculated Data TEST METHOD: 1.4.2.2 TEST ENVIRONMENT: Laboratory Air Specimen No. Fiber Vol
Fraction Lot I.D. (Plate)
Test Temp.
Strain rate
Ec1 Prop.
Limit Fcy1
0 02. Fcy1
0 2. Fcu1 ε1
cf ν12c Comments
(°C) (1/s) (GPa) (MPa) (MPa) (MPa) (MPa) (%) 94-H54 0.324 1-5410417-1 23 0.0008 23 2219
94-H55 0.318 1-5410417-1 23 0.0008 23 Extensometer slipped.
94-H56 0.32.4 2-5410418-1 23 0.0008 225 Extensometer slipped.
94-H57 0.32.8 2-5410418-1 163 0.0008 225 Extensometer slipped.
94-H58 0.32.8 2-5410418-1 163 0.0008 221 Extensometer slipped.
94-H59 0.32.8 2-5410418-1 163 0.0008 201 Extensometer slipped.
94-H60 0.32.8 2-5410418-1 371 0.0008 181 2043
94-H61 0.32.8 2-5410418-1 163 0.0008 109 2421 Load-displacement data is not available
94-H62 0.32.6 2-5410418-1 23 0.0008 219 3590 Load-displacement data is not available
96-K21 0.28.3 1-7353451-4 23 0.0001 Destroyed during initial set-up.
96-K22 0.27.9 1-7353451-4 23 0.0001 1737
96-K23 0.27.8 1-7353451-4 163 0.0001 196 Digital file does not include the yield point.
96-K24 0.28.4 1-7353451-4 163 0.0001 183 2549 Digital file does not include the yield point.
96-K25 0.28.2 1-7353451-4 371 0.0001 183 Extensometer slipped.
96-K26 0.28.0 1-7353451-4 371 0.001 184 2481
96-Q15 0.29.2 2-7353452-3 23 0.0001 201 1826
96-Q16 0.29.1 2-7353452-3 23 0.0001 200 Extensometer slipped.
96-Q17 0.29.2 2-7353452-3 163 0.0001 188 2585 Digital file does not include the yield point.
96-Q18 0.29.3 2-7353452-3 163 0.0001 197 2614 Digital file does not include the yield point.
96-Q19 0.29.2 2-7353452-3 371 0.0001 189 2490 Digital file does not include the yield point.
96-Q20 0.29.5 2-7353452-3 371 0.00001 193 2477
96-R02 0.29.2 3-7353452-6 23 0.0001 207 2629 Digital file does not include the yield point.
96-R03 0.29.1 3-7353452-6 23 0.0001 201 2605 Digital file does not include the yield point.
96-R04 0.29.0 3-7353452-6 163 0.0001 201 2586 Digital file does not include the yield point.
96-R05 0.29.0 3-7353452-6 163 0.0001 200 2595 Digital file does not include the yield point.
96-R06 0.28.9 3-7353452-6 371 0.0001 178 Extensometer slipped.
96-R07 0.28.9 3-7353452-6 371 0.0001 161 2184

MIL-HDBK-17-4A Volume 4, Appendix D Raw Data Tables for Aluminum Matrix Composites
297
MATERIAL: TRIMARC-1/Ti 6-2-4-2 Screening Data Table C4.2(e) (2 of 2) TRIMARC-1/Ti 6-2-4-2 FIBER: TRIMARC-1 SPECIMEN GEOMETRY: Straight-sided Compression MATRIX: Ti-6Al-2Sn-4Zr-2Mo SURFACE CONDITION: As received [0]10 PRODUCT FORM: Plate MACHINING METHOD: Water Jet and Diamond Grind Air Force Research Lab (AFRL/ MLLN) LAY-UP: [0]10 PRE-TEST EXPOSURE: None Calculated Data TEST METHOD: 1.4.2.2 TEST ENVIRONMENT: Laboratory Air
Specimen No. Test Date
Failure Location
Failure Mode
Reduction of Area
Elongation Area Load @ 0.2% Offset
Ultimate Load
Width Thick-ness
Original Gage
Length
Final Gage
Length
Final Width
Final Thick-ness
Final Area
(%) (%) (mm2) (N) (N) (mm) (mm) (mm) (mm) (mm) (mm) (mm2) 94-H54 31.35 69614.67 15.44 2.03 25.4
94-H55 32.00 15.44 2.07 25.4
94-H56 31.35 15.44 2.03 25.4
94-H57 31.16 15.52 2.01 25.4
94-H58 31.16 15.54 2.01 25.4
94-H59 31.16 15.54 2.01 25.4
94-H60 31.16 63609.57 15.52 2.01 25.4
94-H61 31.16 75397.36 15.52 2.01 25.4
94-H62 31.29 112317.6 15.49 2.02 25.4
96-K21 36.97 15.90 2.32
96-K22 37.29 64766.11 15.79 2.36
96-K23 37.68 93590.58 15.87 2.37
96-K24 36.65 93412.65 15.81 2.32
96-K25 36.90 88070.34 15.81 2.33
96-K26 37.29 92523.01 15.82 2.35
96-Q15 35.81 65388.86 15.89 2.25
96-Q16 36.06 83359.67 15.91 2.27
96-Q17 35.94 92878.87 15.91 2.26
96-Q18 35.74 93412.65 15.91 2.25
96-Q19 35.87 89320.29 15.91 2.26
96-Q20 35.48 87896.86 15.88 2.24
96-R02 35.87 94302.3 15.91 2.25
96-R03 36.06 93946.44 15.91 2.27
96-R04 36.13 93412.65 15.92 2.27
96-R05 36.06 93590.58 15.89 2.27
96-R06 36.19 74352.02 15.92 2.28
96-R07 36.26 79178.34 15.92 2.28

MIL-HDBK-17-4A Volume 4, Appendix D Raw Data Tables for Aluminum Matrix Composites
298
MATERIAL: TRIMARC-1/Ti 6-2-4-2 Screening Data Table C4.2(f) (1 of 2) TRIMARC-1/Ti 6-2-4-2 FIBER: TRIMARC-1 SPECIMEN GEOMETRY: Straight-sided Compression MATRIX: Ti-6Al-2Sn-4Zr-2Mo SURFACE CONDITION: As received [90]10 PRODUCT FORM: Plate MACHINING METHOD: Water Jet and Diamond Grind Air Force Research Lab (AFRL/ MLLN) LAY-UP: [90]10 PRE-TEST EXPOSURE: None Calculated Data TEST METHOD: 1.4.2.2 TEST ENVIRONMENT: Laboratory Air
Specimen No. Fiber Volume Fraction
Lot I.D. (Plate)
Test Temp.
Strain rate
Ec2 Prop.
Limit Fcy
20 02. Fcy
20 2. Fcu
2 ε2cf ν21
c Comments
(°C) (1/s) (GPa) (MPa) (MPa) (MPa) (MPa) (%) 94-H63 0.32.4 1-5410417-1 23 0.0008 151 1271 94-H64 0.32.4 1-5410417-1 23 0.0008 157 1287 94-H65 0.32.4 2-5410418-1 23 0.0008 155 1314 94-H66 0.32.4 2-5410418-1 163 0.0008 147 1030 94-H67 0.32.4 2-5410418-1 163 0.0008 150 1028 94-H68 0.32.4 2-5410418-1 163 0.0008 148 1030 94-H69 0.32.4 2-5410418-1 371 0.0008 140 783 94-H70 0.32.4 2-5410418-1 371 0.0008 149 772 Load-displacement data is not available 94-H71 0.32.8 2-5410418-1 371 0.0008 147 785 96-J65 0.29.0 1-7353451-1 23 0.0001 161 1332 96-J66 0.28.9 1-7353451-1 23 0.0001 158 1349 96-J88 0.29.7 1-7353451-2 163 0.0001 Destroyed during initial set-up. 96-J89 0.30.0 1-7353451-2 163 0.0001 144 1044 96-K11 0.30.0 1-7353451-3 371 0.0001 139 815 96-K12 0.29.8 1-7353451-3 371 0.001 140 851 96-P89 0.28.8 2-7353451-5 23 0.0001 159 1355 96-P90 0.28.4 2-7353451-5 23 0.0001 164 1348 96-Q11 0.27.3 2-7353451-6 163 0.0001 140 1020 96-Q12 0.27.3 2-7353451-6 163 0.0001 136 1011 96-Q31 0.28.1 2-7353452-4 371 0.0001 144 780 96-Q32 0.28.1 2-7353452-4 371 0.00001 154 776 96-Q65 0.29.8 3-7353451-9 23 0.0001 159 1359 96-Q66 0.29.0 3-7353451-9 23 0.0001 161 1347 96-Q87 0.29.5 3-7353451-10 163 0.0001 143 1058 96-Q88 0.28.9 3-7353451-10 163 0.0001 139 1038 96-Q99 0.28.9 3-7353452-6 371 0.0001 133 802 96-RO8 0.29.7 3-7353452-5 371 0.0001 158 789

MIL-HDBK-17-4A Volume 4, Appendix D Raw Data Tables for Aluminum Matrix Composites
299
MATERIAL: TRIMARC-1/Ti 6-2-4-2 Screening Data Table C4.2(f) (2 of 2) TRIMARC-1/Ti 6-2-4-2 FIBER: TRIMARC-1 SPECIMEN GEOMETRY: Straight-sided Compression MATRIX: Ti-6Al-2Sn-4Zr-2Mo SURFACE CONDITION: As received [90]10 PRODUCT FORM: Plate MACHINING METHOD: Water Jet and Diamond Grind Air Force Research Lab (AFRL/ MLLN) LAY-UP: [90]10 PRE-TEST EXPOSURE: None Calculated Data TEST METHOD: 1.4.2.2 TEST ENVIRONMENT: Laboratory Air
Specimen No. Test Date
Failure Location
Failure Mode
Reduction of Area
Elongation Area Load @ 0.2% Offset
Ultimate Load
Width Thick-ness
Original Gage
Length
Final Gage
Length
Final Width
Final Thick-ness
Final Area
(%) (%) (mm2) (N) (N) (mm) (mm) (mm) (mm) (mm) (mm) (mm2) 94-H63 31.35 39812 15.42 2.03 645 94-H64 31.29 40256 15.39 2.03 645 94-H65 31.48 41368 15.49 2.03 645 94-H66 31.55 32472 15.52 2.03 645 94-H67 31.61 32472 15.54 2.03 645 94-H68 31.55 32472 15.52 2.03 645 94-H69 31.55 24688 15.52 2.03 645 94-H70 31.42 24243 15.47 2.03 645 94-H71 30.90 24243 15.39 2.01 645 96-J65 36.19 48219 15.93 2.27 96-J66 36.26 48930 15.94 2.28 96-J88 35.35 15.96 2.22 96-J89 35.03 36564 15.93 2.20 96-K11 35.03 28558 15.95 2.20 96-K12 35.23 29981 15.94 2.21 96-P89 36.45 49375 15.94 2.29 96-P90 36.97 49820 15.95 2.32 96-Q11 38.39 39144 15.92 2.41 96-Q12 38.52 38966 15.96 2.41 96-Q31 37.35 29136 15.91 2.35 96-Q32 37.29 28913 15.93 2.34 96-Q65 35.29 47952 15.94 2.21 96-Q66 36.26 48841 15.94 2.27 96-Q87 35.42 37454 15.85 2.24 96-Q88 36.32 37721 15.95 2.28 96-Q99 36.39 29180 15.95 2.28 96-RO8 35.23 27801 15.91 2.21

MIL-HDBK-17-4A Volume 4, Index
300
Index Abbreviations ................................................................................................................................................ 5 Acceptance Testing
Lamina/laminate (continuous fiber) ........................................................................................................ 64 Acronyms .................................................................................................................................................... 14 Adhesive bonding........................................................................................................................................ 46 Allowables terminology ................................................................................................................................. 4 Aluminum .................................................................................................................................................... 34 Bearing...................................................................................................................................................... 136 Bend stress relaxation test (fiber) ............................................................................................................. 107 Brazing ........................................................................................................................................................ 46 Capacitor discharge welding....................................................................................................................... 46 Cast-insert joining ....................................................................................................................................... 47 Chemical analysis techniques..................................................................................................................... 97
Carbon and sulfur ................................................................................................................................... 97 Oxygen and nitrogen by inert gas fusion ................................................................................................ 98
Chemical vapor deposition (CVD)............................................................................................................... 37 Coating........................................................................................................................................................ 37 Compression............................................................................................................................. 131, 134, 136 Compression tests
Lamina/laminate (continuous fiber) ........................................................................................................ 70 Consolidation diffusion bonding .................................................................................................................. 38 Continuous fiber MMC .............................................................................................................................. 119
Acceptance testing ................................................................................................................................. 64 Chemical analysis techniques ................................................................................................................ 97 Constituent characterization ................................................................................................................... 67 Mechanical property test methods.......................................................................................................... 70 Microstructural analysis techniques........................................................................................................ 95 Non-destructive evaluation ..................................................................................................................... 98 Physical property test methods............................................................................................................... 94
Continuous reinforced MMC ....................................................................................................................... 52 Creep tests
Fiber...................................................................................................................................................... 106 Matrix .................................................................................................................................................... 111
Data......................................................................... 3, 51, 131, 132, 133, 134, 136, 137, 138, 139, 140, 141 Data classes ............................................................................................................................................... 51 Data documentation...................................................................................................... 51, 58, 132, 136, 139 Data presentation.............................................................................................................................. 131, 132 Data utilization............................................................................................................................................... 3 Definitions ........................................................................................................................................... 30, 131 Density
Fiber...................................................................................................................................................... 107 Lamina/laminate (continuous fiber) ........................................................................................................ 94
Diffusion bonding ........................................................................................................................................ 44 Discontinuously reinforced MMC .......................................................................................................... 37, 38 Elastic properties ...................................................................................................................................... 122 Electron beam welding................................................................................................................................ 45 Fatigue crack growth rate (lamina/laminate)............................................................................................... 72 Fatigue tests
Lamina/laminate (continuous fiber) ........................................................................................................ 71 Matrix .................................................................................................................................................... 112
Fiber .......................................................................................... 131, 132, 134, 136, 137, 138, 139, 140, 141 Mechanical property test methods........................................................................................................ 106 Physical property test methods............................................................................................................. 107 Test plans ............................................................................................................................................... 67

MIL-HDBK-17-4A Volume 4, Index
301
Fiber class................................................................................................................................................. 132 Fiber pushout .............................................................................................................................................. 77 Fiber volume fraction .................................................................................................................................. 94 Friction stir welding ..................................................................................................................................... 44 Fully approved data..................................................................................................................................... 51 Gas-metal arc welding ................................................................................................................................ 45 Gas-tungsten arc welding ........................................................................................................................... 45 Health hazards .............................................................................................................................................. 4 Inertia friction welding ................................................................................................................................. 43 Joining......................................................................................................................................................... 40
Potential issues....................................................................................................................................... 41 Qualitative assessment .......................................................................................................................... 40 Types of .................................................................................................................................................. 43
Lamina .............................................................................................................................. 132, 133, 137, 140 Laminate ........................................................................................................................... 131, 133, 135, 136 Laminate orientation code......................................................................................................................... 131 Laser beam welding.................................................................................................................................... 45 Manufacturing processes............................................................................................................................ 38
Assembly and consolidation ................................................................................................................... 38 Material system codes ...................................................................................................................... 131, 132 Material system codes (matrix/fiber) ........................................................................................................... 15 Matrix ........................................................................................................ 131, 132, 134, 136, 138, 139, 141 Matrix class ............................................................................................................................................... 132 Matrix materials........................................................................................................................................... 32
Forms of ................................................................................................................................................. 33 Mechanical property test methods........................................................................................................ 111 Microstructcural analysis ...................................................................................................................... 112 Physical property test methods............................................................................................................. 112 Role of .................................................................................................................................................... 33 Test plans ............................................................................................................................................... 67 Types of .................................................................................................................................................. 34
Mechanical fastening .................................................................................................................................. 47 Microhardness ............................................................................................................................................ 89 Microstructural analysis techniques
Lamina/laminate (continuous fiber) ........................................................................................................ 95 Matrix .................................................................................................................................................... 112
Modulus calculation........................................................................................................................... 136, 139 Non-destructive evaluation (NDE) .............................................................................................................. 98 Normalization ............................................................................................................................................ 136 Ozone depleting chemicals........................................................................................................................... 4 Pedigree...................................................................................................................................................... 63 Physical property test methods
Fiber...................................................................................................................................................... 107 Lamina/laminate (continuous fiber) ........................................................................................................ 94 Matrix .................................................................................................................................................... 112
Power blending and consolidation .............................................................................................................. 38 Processing ........................................................................................................................................ 131, 132 Rapid infrared joining .................................................................................................................................. 47 Reactive processing (in-situ composites) ................................................................................................... 39 References (use of) ...................................................................................................................................... 4 Reinforcement materials............................................................................................................................. 36
Coatings.................................................................................................................................................. 37 Role of .................................................................................................................................................... 37
Residual strength and stiffness................................................................................................................... 93 Resistance spot welding ............................................................................................................................. 45 Safety............................................................................................................................................................ 4

MIL-HDBK-17-4A Volume 4, Index
302
Screening data............................................................................................................................................ 51 Secondary manufacturing processes.......................................................................................................... 40
Joining .................................................................................................................................................... 40 Shear (in-plane)
Lamina/laminate (continuous fiber) ........................................................................................................ 71 Sign convention......................................................................................................................................... 131 Slurry casting (compocasting)..................................................................................................................... 39 Soldering ..................................................................................................................................................... 46 Source of information.................................................................................................................................... 3 Specimen
Number and sampling ............................................................................................................................ 52 Preparation ............................................................................................................................................. 53
Spray deposition ......................................................................................................................................... 39 Squeeze casting/infiltration ......................................................................................................................... 39 Stress relaxation (fiber)............................................................................................................................. 111 Subscripts ................................................................................................................................................... 12 Superscripts ................................................................................................................................................ 13 Symbols ........................................................................................................................................ 5, 137, 140 Tensile tests
Fiber...................................................................................................................................................... 106 Lamina/laminate (continuous fiber) ........................................................................................................ 70 Matrix .................................................................................................................................................... 111
Terminology .......................................................................................................................................... 4, 131 Test conditions selection............................................................................................................................. 52 Test method........................................................................................................ 51, 133, 136, 137, 139, 140 Test method selection................................................................................................................................. 51 TMF (in-phase/out-of-phase) ...................................................................................................................... 77 Toxicity.......................................................................................................................................................... 4 Trade names and product names (use of) ................................................................................................... 4 Transient liquid phase bonding ................................................................................................................... 47 Ultasonic welding ........................................................................................................................................ 44 Units ............................................................................................................................................................ 15
Conversion.............................................................................................................................................. 15 Use of data (guidelines) ............................................................................................................................ 2, 3 Vapor deposition ......................................................................................................................................... 38
MIL-HDBK-17-4A Volume 4, Concluding Material
303
CONCLUDING MATERIAL Custodians: Preparing activity: Army – MR Army - MR Navy – AS Air Force – 11 (Project CMPS-0174) Review activities: Army – AR, AT, AV, MI Navy – SH Air Force – 13 DLA-IS

STANDARDIZATION DOCUMENT IMPROVEMENT PROPOSAL
INSTRUCTIONS1. The preparing activity must complete blocks 1, 2, 3, and 8. In block 1, both the document number and revision letter
must be given.2. The submitter of this form must complete blocks 4, 5, 6, and 7.2. The preparing activity must provide a reply within 30 days from receipt of the form.NOTE: This form may not be used to request copies of documents, nor to request waivers, or clarification of requirementson current contracts. Comments submitted on this form do not constitute or imply authorization to waive any portion of thereferenced document(s) or to amend contractual requirements.
I RECOMMEND A CHANGE: 1. DOCUMENT NUMBERMIL-HDBK-17-4A
2. DOCUMENT DATE (YYYYMMDD)
20020617
3. DOCUMENT TITLE COMPOSITE MATERIALS HANDBOOK - VOLUME 4, Metal Matrix Composites4. NATURE OF CHANGE (Identify paragraph number and include proposed rewrite, if possible. Attach extra sheets as needed)
5. REASON FOR RECOMMENDATION
6. SUBMITTER
a. NAME (Last, First, Middle Initial) b. ORGANIZATION
c. ADDRESS (Include Zip Code) d. TELEPHONE (Include AreaCode)
(1) Commercil(2) DSN (If applicable)
7. DATE SUBMITTED(YYYYMMDD)
8. PREPARING ACTIVITY
a. NAMEUS Army Research LaboratoryWeapons & Materials Research Directorate
b. TELEPHONE (Including Area Code)(1) Commercial (2) DSN
(410) 306-0725 458-0725 C. ADDRESS (Include Zip Code) ARL/WMRD ATTN: AMSRL-WM-MAAberdeen Proving Ground, MD 21005-5069
IF YOU DO NOT RECEIVE A REPLY WITHIN 45 DAYS, CONTACT:Defense Standardization Program Office (DLSC-LM)8725 John J. Kingman Road, Suite 2533, Fort Belvoir, VA 22060-6221Telephone (703) 767-6888 DSN 427-6888
DD Form 1426, FEB 1999 (EG) Previous edition is obsolete WHS/DIOR, Feb 99