composite materials - rhopoint instruments · orange peel and waviness effects are visible in the...
TRANSCRIPT
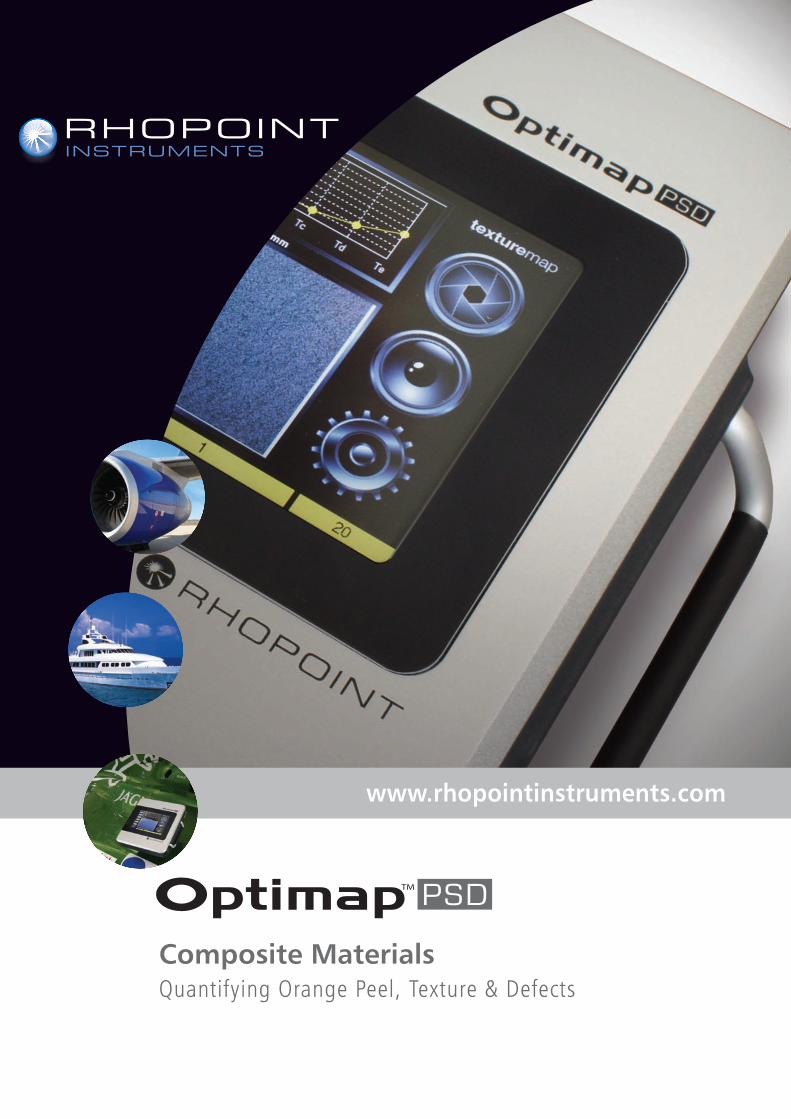
Composite MaterialsQuantifying Orange Peel, Texture & Defects
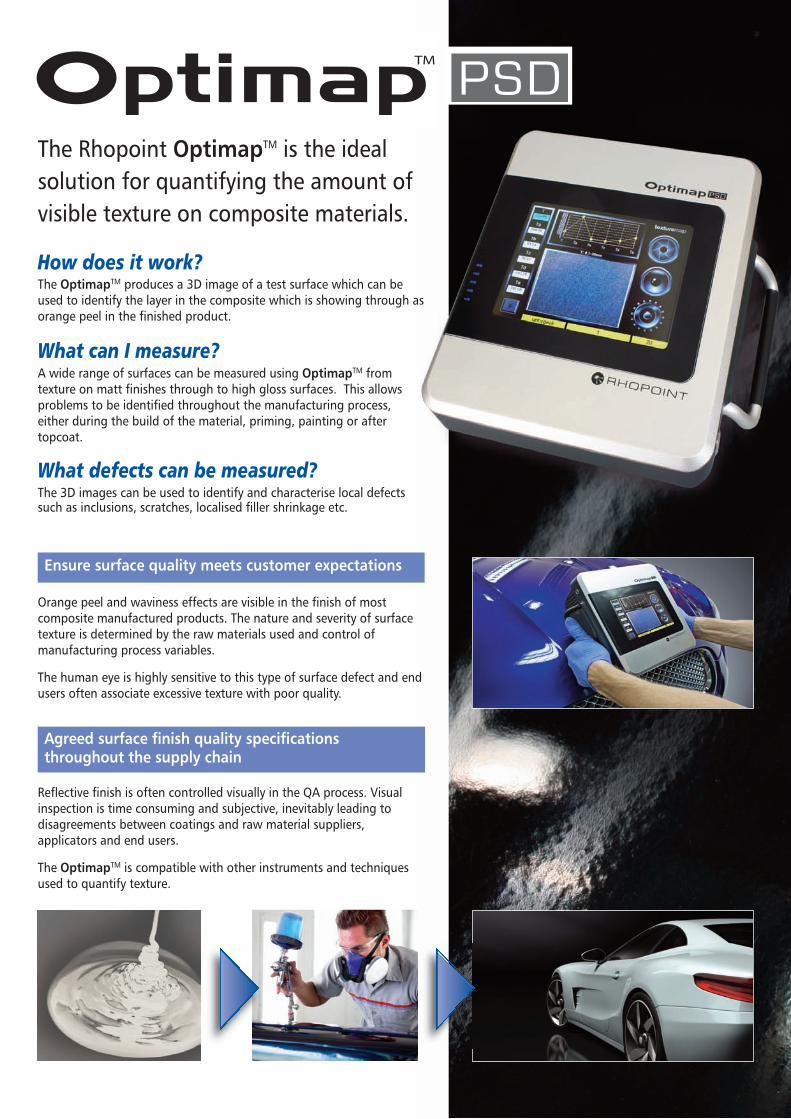
Orange peel and waviness effects are visible in the finish of mostcomposite manufactured products. The nature and severity of surfacetexture is determined by the raw materials used and control ofmanufacturing process variables.
The human eye is highly sensitive to this type of surface defect and endusers often associate excessive texture with poor quality.
Reflective finish is often controlled visually in the QA process. Visualinspection is time consuming and subjective, inevitably leading todisagreements between coatings and raw material suppliers,applicators and end users.
The OptimapTM is compatible with other instruments and techniquesused to quantify texture.
The Rhopoint OptimapTM is the idealsolution for quantifying the amount of visible texture on composite materials.
The OptimapTM produces a 3D image of a test surface which can beused to identify the layer in the composite which is showing through asorange peel in the finished product.
A wide range of surfaces can be measured using OptimapTM fromtexture on matt finishes through to high gloss surfaces. This allowsproblems to be identified throughout the manufacturing process,either during the build of the material, priming, painting or aftertopcoat.
The 3D images can be used to identify and characterise local defectssuch as inclusions, scratches, localised filler shrinkage etc.
Ensure surface quality meets customer expectations
Agreed surface finish quality specificationsthroughout the supply chain
How does it work?
What can I measure?
What defects can be measured?

Due to the reflective properties of a surface it is difficult to identifywhich composite layer is causing show-through orange peel/texture.
Due to their low gloss, underlying texture is not visible in primers andbase substrates, it is only when high gloss top coat is applied thatfaults are apparent. Identifying issues earlier in the manufacturingprocess saves time and money.
Improve processes by understanding where problems arise
Quantifying texture earlier in the manufacturingprocess saves cost
Localised defects such as scratches, inclusions, fish eyes etc. areinevitable during plastic manufacture, coating and painting.
Once identified, operator judgement is required to determine whetherthe defect should be repaired, fully reworked or accepted.
Quantifying defect depth, size and aspect ratioenables objective quality control
• Are you producing high quality components from composites, plastics or fibreglass?
• Do you currently assess the finish quality visually, or instrumentally using gloss meters or waviness measuring instruments?
• Would it improve your process if you could agree measurable pass/fail criteria with your customers?
• Would it reduce reworks and rejection if you could identify and measure orange peel and texture throughout your manufacturing process?
• Would 3-D maps of local defects such as inclusions, porosity, scratches and dents help you to diagnose problems and improve quality?
• Could you improve the quality of your product by objectively benchmarking finish quality against your competitors?
If the asnswer is yes, then you should consider the OptimapTM as partof your quality control process.
Is the Rhopoint OptimapTM right for my application?
Maps of surface topography allow thevisual identification of problem materials
Fast objective measurement saves time and avoids subjectivity during final inspection.
Objective appearance specifications can be agreed with customers reducing costly reworks and rejections.
Process improvements are made possible by having measured data for texture and appearance quality throughout the manufacturing process, leading to potential cost savings and improved quality.
3-D maps of test surfaces can be added to reports and shared, allowing remote diagnosis of defects and informed discussion of surface quality.
OptimapTM texture values are compatible with industry standard waviness/orange peel measurements allowing better communication with OEM customers or coating suppliers.
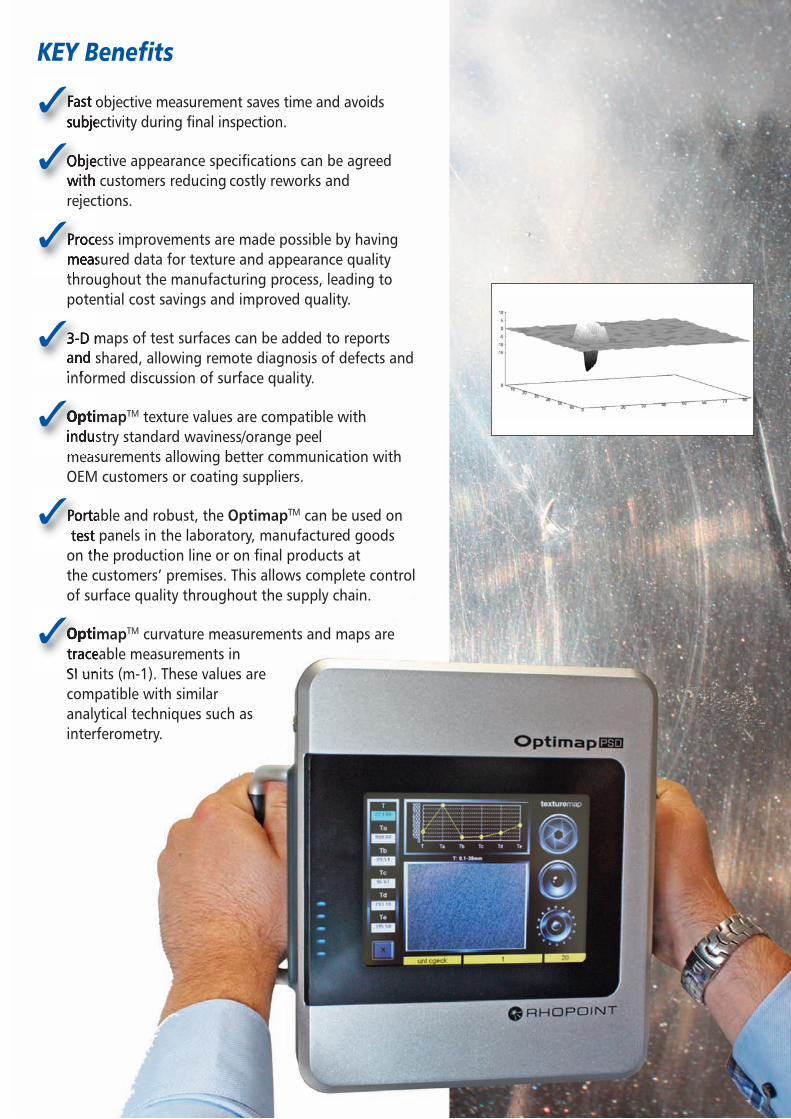
Portable and robust, the OptimapTM can be used on test panels in the laboratory, manufactured goods on the production line or on final products at the customers’ premises. This allows complete controlof surface quality throughout the supply chain.
OptimapTM curvature measurements and maps are traceable measurements in SI units (m-1). These values are compatible with similar analytical techniques such as interferometry.
KEY Benefits
3
3
3
3
3
3
3
Rhopoint Instruments Limited • Rhopoint HouseEnviro 21 Park • Queensway Avenue South • St Leonards-on-SeaEast Sussex • TN38 9AG • UK • Tel: +44 (0) 1424 [email protected] • www.rhopointinstruments.com
The OptimapTM can be battery or mains operated and is suitable foruse in the laboratory or on the factory floor. It is operated by anintuitive touch screen and has a built in file system that allowsmeasurements to be stored in an organized structure.
The OptimapTM can measure most surfaces from ultra matt to mirrorfinish.
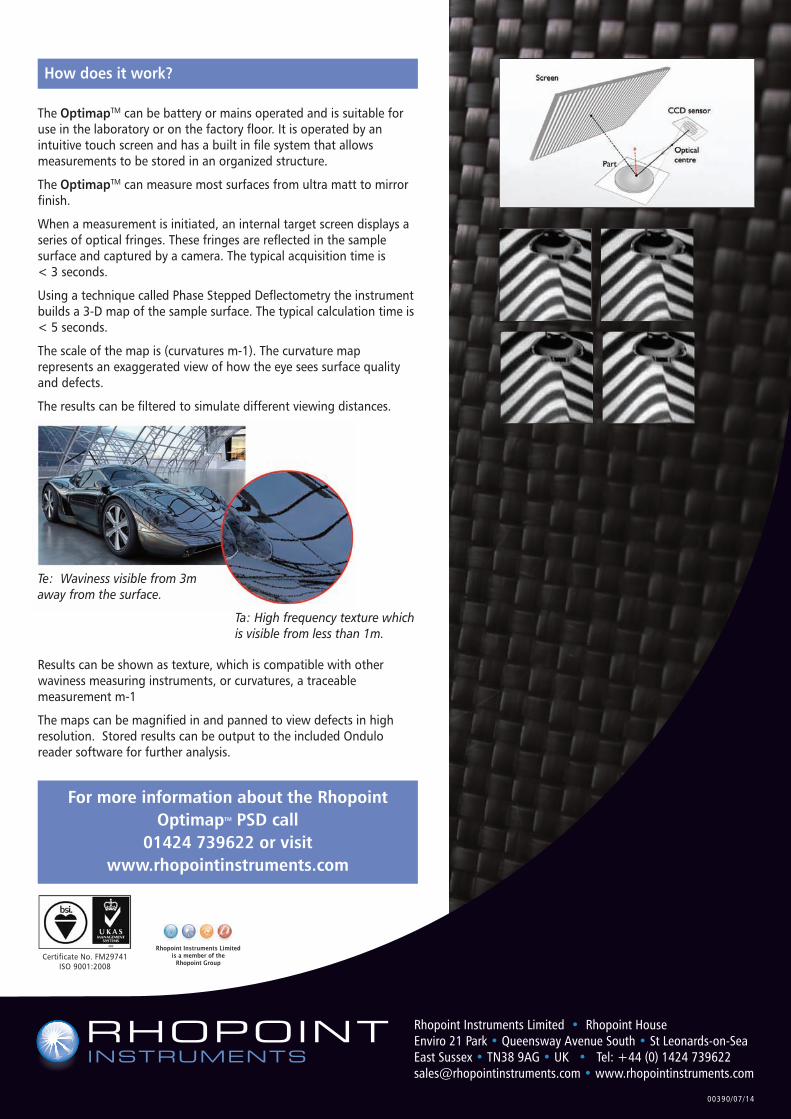
When a measurement is initiated, an internal target screen displays aseries of optical fringes. These fringes are reflected in the samplesurface and captured by a camera. The typical acquisition time is < 3 seconds.
Using a technique called Phase Stepped Deflectometry the instrumentbuilds a 3-D map of the sample surface. The typical calculation time is< 5 seconds.
The scale of the map is (curvatures m-1). The curvature maprepresents an exaggerated view of how the eye sees surface qualityand defects.
The results can be filtered to simulate different viewing distances.
Results can be shown as texture, which is compatible with otherwaviness measuring instruments, or curvatures, a traceablemeasurement m-1
The maps can be magnified in and panned to view defects in highresolution. Stored results can be output to the included Onduloreader software for further analysis.
Certificate No. FM29741ISO 9001:2008
Rhopoint Instruments Limitedis a member of the
Rhopoint Group
How does it work?
For more information about the RhopointOptimapTM PSD call
01424 739622 or visit www.rhopointinstruments.com
Ta: High frequency texture whichis visible from less than 1m.
Te: Waviness visible from 3maway from the surface.
00390/07/14