comprehensiv e an n u al - milwaukee public...
TRANSCRIPT

F
For
CO
THE
OMPFIN
E Yea
157
REHNAN
ar En
7th E
HENNCIA
nded
Edit
NSIVAL R
d Ju
tion
Milw
VE AREP
une 3
n
waukee
ANNPOR
30, 20
e, Wisco
NUART
201
016
onsin
AL
16

157th EDITION
COMPREHENSIVE ANNUAL FINANCIAL REPORT
of the
BOARD OF SCHOOL DIRECTORS
MILWAUKEE PUBLIC SCHOOLS
5225 West Vliet Street
Milwaukee, Wisconsin
FOR THE FISCAL YEAR ENDED JUNE 30, 2016
MARK SAIN, President
DARIENNE B. DRIVER, Ed.D., Superintendent
Prepared by:
The Office of the Chief Financial Officer
Gerald J. Pace, J.D.

This page intentionally left blank.

MILWAUKEE PUBLIC SCHOOLS
Comprehensive Annual Financial Report
Year Ended June 30, 2016
i
Table of Contents
I. Introductory Section (Unaudited)
Letter of Transmittal iii Board of School Directors and Standing Committees xii Milwaukee School Board Districts xiii Administrative Officers xiv Organization Chart xv Certificate of Achievement xvi
II. Financial Section
Independent Auditors’ Report 1 Management’s Discussion and Analysis (Required Supplementary Information) 4 Basic Financial Statements:
Government-wide Financial Statements: Statement of Net Position 16 Statement of Activities 17
Fund Financial Statements: Balance Sheet—Governmental Funds 18 Reconciliation of the Governmental Funds Balance Sheet to the Statement of
Net Position (Deficit) 19 Statement of Revenues, Expenditures, and Changes in Fund Balances—
Governmental Funds 20 Reconciliation of the Governmental Funds Statement of Revenues,
Expenditures, and Changes in Fund Balances to the Statement of Activities 21 Statement of Fiduciary Net Position 22 Statement of Changes in Fiduciary Net Position 23
Notes to Basic Financial Statements 24
Required Supplementary Information: Budgetary Comparison Schedule for the General Fund 89 Budgetary Comparison Schedule for the School Nutrition Services Fund 91 Schedules of Proportionate Share of the Net Pension Asset/Liability and
Schedules of Employer Contributions 92 OPEB Schedule of Funding Progress and Schedule of Employer Contributions 93 Notes to Required Supplementary Information 94
Combining and Individual Fund Statements and Schedules: Combining Balance Sheet—Nonmajor Governmental Funds 97 Combining Statement of Revenues, Expenditures, and Changes in Fund
Balances —Nonmajor Governmental Funds 98

MILWAUKEE PUBLIC SCHOOLS
Comprehensive Annual Financial Report
Year Ended June 30, 2016
ii
Table of Contents, Continued
II. Financial Section, Continued
Combining and Individual Fund Statements and Schedules, Continued: Schedules of Revenues, Expenditures, and Changes in Fund Balance—Budget and
Actual: Categorically Aided Programs Fund 99 Debt Service Fund 100
Combining Statement of Net Position—Pension and Other Post Employment Benefits Trust Funds 102
Combining Statement of Changes in Net Position—Pension and Other Post Employment Benefits Trust Funds 103
Statement of Changes in Assets and Liabilities—Agency Fund 104
III. Statistical Section (Unaudited)
Statement of Net Position 106 Changes in Net Position 107 Fund Balance, Governmental Funds 108 Changes in Fund Balance, Governmental Funds, and Debt Service Ratios 109 Assessed and Equalized Valuation-City of Milwaukee 110 Property Tax Rates-Direct and Overlapping Government 111 Tax Rates for School Purposes 112 Principal Property Taxpayers 113 Property Tax Levies and Collections 114 Assessed Value and Estimated Actual Value of Taxable Property 115 Computation of Direct and Overlapping Debt Governmental Activities 116 Ratios of Outstanding Debt by Type 117 Pledged Revenue Coverage 118 Demographic and Economic Statistics 119 Principal Employers 120 Comparative per Capita Cost Statistics 121 Comparative Statement of Annual School Census 122 Annual Enumeration of Children Residing in the City of Milwaukee 123 Government-wide Expenses by Function 124 Government-wide Revenues 125 Governmental Fund Expenditures by Function 126 General Governmental Revenues by Source 127 School Accommodations 128 Number and Distribution of Instructional Staff 129 Population and Pupils Residing in the City of Milwaukee 130 Operating Statistics 131 School District Employees – Full Time Staff & Part Time 132 Nutrition Services – Facts and Figures 133 Capital Asset Information 134

INTR
OD
UCTO
RY
SECTIO
N STA
TISTICA
L SEC
TION

iii
January 27, 2016
Milwaukee Board of School Directors:
We submit to you the Comprehensive Annual Financial Report of the Milwaukee Public Schools (“MPS”), Milwaukee, Wisconsin, for the fiscal year ended June 30, 2016. The Comprehensive Annual Financial Report is management’s financial report to taxpayers, governing board, oversight bodies, voters, employees, and intergovernmental grantors. Responsibility for both the accuracy of the data and the completeness and fairness of the presentation, including all disclosures, rests with the District (“District”). To the best of our knowledge and belief, the information presented is accurate in all material respects and is reported in a manner designed to present fairly the financial position and results of operations of the various funds of MPS. All disclosures necessary to enable the reader to gain an understanding of the District’s financial activities have been included. Governmental Accounting Standards Board (GASB) Statement No. 34 requires that management provide a narrative introduction, overview, and analysis to accompany the basic financial statements in the form of Management’s Discussion and Analysis (MD&A). This letter of transmittal is designed to complement the MD&A and should be read in conjunction with that document. The MD&A can be found immediately following the report of the independent auditors.
REPORTING ENTITY
MPS operates within the City of Milwaukee, Wisconsin (“City”). The purpose and responsibility of the District is to provide an efficient and effective educational system for the children enrolled in the public schools, whereby each child has access to programs and services that are appropriate to his or her educational needs. In addition to the regular educational programs, the District offers comprehensive programs in the areas of special education, early childhood education, and bilingual education. Through its specialty school programs, the District offers advanced educational programs in such areas as language, fine arts, Montessori, International Baccalaureate, STEAM (science, technology, engineering, arts and math), business, and technical trades. In addition, the District provides community recreation and education services through its parks and centers for the elderly.
The City is located 70 miles north of the city of Chicago on the western shores of Lake Michigan. The City has a population estimate of approximately 600,155 based on 2015 U. S. Census Bureau Data. The District operates 159 schools, has over 75,000 students, and employs over 9,800 educators, administrators, and staff. The Superintendent, appointed by the Board, is the senior official representing MPS.
MPS was established on February 3, 1846, and is operated under Chapter 119 of the Wisconsin Statutes. The District, governed by a nine-member Board, provides education services through grade 12 to residents of the City of Milwaukee and its participating suburban transfer students. The reporting entity for the District is based upon criteria set forth by GASB Statement No. 14, "The Financial Reporting Entity.” Under this pronouncement, the financial reporting entity consists of (a) the primary government, which is controlled by a separately elected governing body that is legally separate and is fiscally independent, and (b)
Office of the Superintendent
Central Services Building
5225 West Vliet Street
P.O. Box 2181
Milwaukee, Wisconsin 53201-2181

iv
organizations for which the primary government is financially accountable. All of the accounts of the District comprise the primary government. The financial statements of the District are excluded from the City financial statements because the District operates with a separate governing board that is not under the control of the City.
LOCAL ECONOMIC ANALYSIS Milwaukee is the state's largest urban and economic center. The City has a diversified economy with strong service and manufacturing sectors. The area is not dominated by large employers. Less than two percent of the manufacturers have employment levels greater than 500. Less than one percent of the employers in finance, insurance, and services have more than 500 employees. Based upon the Metropolitan Milwaukee Association of Commerce’s August 2016 Economic Trends, unemployment indicators improved but at a slower pace. The number of unemployed fell 3.7% from one year ago to 39,100, vs. July’s 8.5% decline (vs. July, 2015). August’s decline led to a 0.2 percentage point decrease in the seasonally unadjusted unemployment rate to August’s 4.7%. Metro Milwaukee’s rate compares to the 4.0% and 5.0% August rates posted for Wisconsin and the U.S. respectively. The City continues to maintain high bond ratings from two of the major agencies. AA from Standard & Poor’s Corporation and Aa3 from Moody’s Investors Service, Inc. were received on recently issued general obligation bonds of the City. MAJOR INITIATIVES During the 2015-16 school year, the Eight Big Ideas Operational Plan continued to provide the overall framework for district efforts to support our students in their academic and personal journeys:
1. Closing the Gap 2. Educating the Whole Child 3. Redefining the MPS Experience 4. Rethinking High Schools 5. Re-envisioning Partnerships 6. Communication & Outreach 7. Workforce Development 8. Organizational Processes
The Eight Big Ideas are aligned to our district goal areas, which form the basis of the MPS Strategic Plan:
Student Achievement Family and Community Engagement Effective and Efficient Operations
An overview of the work associated with these goals and the Eight Big Ideas during the 2015-16 school year follows: District staff continued work on the comprehensive, operational plan to improve student outcomes. The objectives within this plan--the Eight Big Ideas--are reinforced by the district’s budget process and together ensure that key programs and projects are aligned, prioritized, and funded to support positive outcomes for our students. The first goal, Academic Achievement, includes these strategic objectives:
Close the Gap: Milwaukee Public Schools is a national symbol of excellence for educating all students, providing a rigorous academic program that ensures equitable opportunities for all children to reach their full potential.
Educate the Whole Child: Milwaukee Public Schools provides a nurturing, consistent, and validating
experience for every child so that both educational and social-emotional needs are met.

v
Redefine the MPS Experience: Every Milwaukee Public School provides robust co/extracurricular experiences
that engage and inspire every child.
Rethink High Schools: Every Milwaukee Public Schools student graduates on time with a personalized pathway to success in college, career, and life.
The second goal, Student, Family & Community Engagement, includes these strategic objectives:
Re-envision Partnerships: Milwaukee Public Schools cultivates, and maintains mutually beneficial partnerships and collective impact efforts to maximize resources that promote greater student outcomes.
Strengthen Communication Systems & Outreach Strategies: The community is engaged in, understands, and
supports the work of Milwaukee Public Schools, and families choose our district as a trusted and valued education partner.
The third of these goals, Effective and Efficient Operations, includes the following strategic objectives:
Develop Our Workforce: As an organization respected for supporting diverse, healthy, highly-skilled and engaged employees, Milwaukee Public Schools is an employer of choice.
Improve Organizational Processes: Milwaukee Public Schools is a leader in using best practices, systems, and
processes equitably and efficiently to align and maximize resources in support of our strategic objectives. Some of the successes achieved during the 2015-16 school year are detailed below and arranged by goal area: Student Achievement MPS has adopted a collective impact approach to tackle our most entrenched and complex school and community problems. By creating a common agenda with our strategic partners that includes a shared understanding of the problem and a joint approach to solving it, the district believes we will be able to attain measureable results. Through collaboratively developed plans of action, continuous communication and reinforcing activities, our backbone organizations are helping MPS students achieve more accelerated success and support. Milwaukee Public Schools has entered into a partnership with The Panasonic Foundation and has begun the process of deliberate and systemic reform aimed at “breaking the links” between race, poverty and educational outcomes. Two of the components of this work include the District Improvement Plan (DIP) and the development of methods of school walk-throughs and instructional rounds.
MPS continues to expand access to strong programs including:
An addition for Fernwood Montessori School, allowing the high-performing K-8 school to accommodate the large number of early childhood students the school has enrolled in recent years as those students advance by grade level. The school has grown in recent years from about 550 students to more than 700.
A new location for Rufus King International Middle School at 2760 N. 1st Street, providing the grade 6-8 International Baccalaureate Middle Years Programme room to grow and continue to prepare students for the rigorous IB Diploma Programme available at three MPS high schools (King, MacDowell Montessori and Reagan).
Milwaukee Excellence Charter School, a new MPS charter school, will serve students in grade 6 at the former McNair School site, 4950 N. 24th Street.
Board approval for Milwaukee Spanish Immersion School to expand to a second campus for 2016-17 to serve more students. The new campus will serve all of the school’s students in grades K4 and K5 with students in

vi
grades 1-5 attending school at the current MSIS campus, 2765 S. 55th Street. By 2017-18, the 88th Street campus will serve all first-grade students as well with the current campus serving grades 2-5.
Board approval for Morse Middle School for the Gifted and Talented to move to its own location, allowing both it and John Marshall High School for the Gifted and Talented (Morse Marshall School for the Gifted and Talented 9-12), 4141 N. 64th Street, Milwaukee 53216, to grow their programs.
Pulaski High School is adding International Baccalaureate programming and increased bilingual programming as it begins a new partnership with Carmen High School of Science and Technology – South Campus. The partnership provides for the two schools working together to improve student achievement, school climate and teaching and administrative practices as each school brings 200 new freshmen into the Pulaski campus for 2016-17.
Victory School was approved to expand its Italian immersion program for 2016-17 to include full immersion beginning with 4-year-old kindergarten (K4).
The MPS Class of 2016 earned $49+ million in scholarships.
Eight MPS high schools earned a spot on national top school lists from U.S. News and World Report and the Washington Post, up from seven last year. For the second straight year, Milwaukee Public Schools is home to the state’s top two schools on the Washington Post’s list of America’s Most Challenging High Schools. MPS is also home to two of Wisconsin’s 10 best high schools according to U.S. News and World Report.
It was international honors for MPS 2014 Hamilton High School graduate, Marvin Kimble who was named to TEAM USA Men’s Gymnastics and a 2015 Pan Am Games gold medalist. The White House Initiative on Educational Excellence for Hispanics has named ALBA School as one of the nation’s “Bright Spots in Hispanic Education,” an honor given to only three organizations in the state of Wisconsin this year. As the White House noted in touting the recognition, math achievement scores at ALBA, which serves a student population that is 98% Hispanic and 97% economically disadvantaged, have been near or above the state average on the most recent state test results available. In 2013, ALBA’s founding teachers were honored by People magazine as the magazine’s "Teachers of the Year." The Academy of Accelerated Learning is one of just 10 schools statewide recognized by the Wisconsin Department of Public Instruction as a Wisconsin Spotlight School. This distinction is given to schools with a record of increasing academic performance for students from low-income families. The school will receive a $25,000 grant from DPI to showcase successful practices that improve student achievement. The grant funds cover expenses related to sharing those practices with three other schools that will visit the winning school during the 2015-16 school year as well as to support continuous school improvement. Two MPS teachers were named National Board Certified Teachers by the National Board for Professional Teaching Standards. Ronald Wilson Reagan College Preparatory High School teacher Stacy Knetter received National Board Certification in Adolescence and Young Adulthood – Science, and Riverside University High School (RUHS) teacher Matthew Turner received National Board Certification in Adolescence and Young Adulthood–Social Studies/History. The Wisconsin Association of Foreign Language Teachers named Milwaukee German Immersion School (MGIS) fourth grade teacher Sigurd Piwek its Teacher of the Year. As the association’s Wisconsin honoree, Piwek represented the state and was in the running for a regional award at the Central States Conference on the Teaching of Foreign Languages in Columbus, Ohio in March 2016. Family and Community Engagement The district has placed a renewed emphasis on intentional and strategic alumni engagement to help us accomplish our goals. In 2015-16 that process began by inventorying our alumni assets and by reenergizing our alumni base by hosting the first ever MPS All Alumni Reunion. Alumni of Milwaukee Public Schools are uniquely positioned to partner with

vii
the district to affect change in student achievement, in the engagement of students and families, and for the effective and efficient operations of our schools and the district. Mai Xiong, a first-grade teacher at the Academy of Accelerated Learning, was named Wisconsin’s Elementary School Teacher of the Year for the 2015-16 school year. As part of the Teacher of the Year honor, Xiong received $3,000 from the Herb Kohl Educational Foundation. Adam Murphy, a music instructor at Reagan, was chosen for the Teachers are Tops recognition award, presented by Educators Credit Union and CW18/MY24. This award celebrates outstanding teachers who work both in and out of the classroom to enhance student success. Murphy was selected because he “inspires an endless parade of students to meet his very high musicianship standards.” Murphy works with a dynamic team of music instructors who inspire over 600 students annually in composition, performance, recording, and broadcasting music. MPS worked closely with the Bartolotta Restaurants and the Wisconsin Restaurant Association to build and implement ProStart, a national, two-year program that prepares high school students for promising careers in the restaurant and food service industry. The SURG Restaurant Group has also committed its support for the program. Students will receive real-world, hands-on experience to build culinary arts and management skills. Through a unique partnership, the Bartolottas have provided expertise in planning for facility renovations, assisting with fundraising and equipment acquisition, preparing and delivering teacher training, and recruiting chef-mentors to assist teachers in the classroom. Milwaukee Bucks forward Jabari Parker and the Superintendent hosted a summit for students and parents at James Madison Academic Campus focused on improving student attendance. Parker provided 40-60 tickets to every remaining Bucks home game for students with improved attendance. The attendance summit is the latest in a series of Superintendent’s family roundtables. The district’s overall effort to improve attendance include efforts such as the launch of the “Be in School” campaign with Jabari and the Bucks, the creation of attendance liaison positions, and the asking students for their ideas on effective strategies to improve attendance. The Superintendent’s Student Advisory Council was established to support the cultures and climates where the academic needs of students can be met. The advisory council provides the opportunity for student voices to be heard and be included in decision- m a k i n g . The advisory council also provides a space for the development of leadership and communication skills for students who are not considered “traditional leaders.” Effective and Efficient Operations The MPS Department of Communications and Outreach was recognized by the Wisconsin School Public Relations Association with four Awards of Merit, the highest honor WSPRA gives for communications excellence for school public relations efforts. There have been a number of advancements in the area of workforce development including development of a marketing plan to attract staff, including great use of social media. Fifty-seven percent of MPS campuses and departments were enrolled in wellness programs. In order to support the district’s focus on equity, a diversity and inclusion position was added. The Office of Operations supported the building additions, program expansions and program moves included Fernwood Montessori, Rufus King International Middle School, Milwaukee Excellence Charter School, Milwaukee Spanish Immersion School, and Morse Middle School for the Gifted and Talented.
Breakfast in the classroom was expanded to serve even more students. The district received the National Recreation and Park Association’s Kudos Award for the “Now Playing Everywhere” marketing campaign to promote summer playgrounds. The Office of Finance was awarded the Government Finance Officers Association (GFOA) Distinguished Budget Presentation Award and their Certificate of Achievement for Excellence in Financial Reporting for the Comprehensive Annual Financial Report.

viii
Implementation began for the initial phases of the 10-year Outdoor Recreation Facilities Master Plan to address current and future recreational needs. To achieve these outcomes set forth in the district goals and the Eight Big Ideas, the Administration will implement significant programs/projects during the 2016-17 school year, including but not limited to: *a focus on equity, including professional development and implementation of Culturally Responsive Teaching Practices, Restorative Justice, and Project Success, an improved PBIS system for high schools; *alignment of the four Strategic Academic Priorities, including Reading Foundations (grades K-5), Algebra Readiness (grades 4-8), Disciplinary Literacy (grades 6-12), and Climate, Culture, and Equity (grades K-12); *system-wide Learning Walks and Instructional Rounds aligned to educator effectiveness and best teaching practices; *Career Pathways in many of our high schools and academic and career plans for all students in grades 6-12; *implementation of a 1:1 Chromebook-to-student ratio at the high-school level this fall and in all other grades 1:1 within two years; *a Family Empowerment University that will develop institutes for families and staff, engage partners in workshops for families, and focus on specific priority areas such as special education, fatherhood engagement, etc.; *year-round retention strategy and "smart" recruitment efforts that maintain and recruit students through robust outreach strategies; and
*an employee-wellness program that builds off recent success and continues to improve and expand, building participation across the district and especially at school sites.
ACCOUNTING SYSTEM
The diverse nature of governmental operations and the necessity of assuring legal compliance preclude recording and summarizing all governmental financial transactions in a single accounting entity. Therefore, from a financial management viewpoint, a governmental unit is a combination of several distinctly different accounting entities, each having a separate set of accounts and functioning independently of each other. Each accounting entity is accounted for in a separate “fund.” A fund is defined as a fiscal and accounting entity with a self-balancing set of accounts recording cash and other financial resources, together with all related liabilities and residual balances, and changes therein, which are segregated for the purpose of carrying on specific activities or attaining certain objectives in accordance with special regulations, restrictions, or limitations. The District’s financial records are maintained on a modified accrual basis of accounting except for the private purpose trust and pension trust funds. Accordingly, revenues are recognized when measurable and available, expenditures when goods or services are received, liabilities are recognized when incurred, and receivables when a legal right to receive exists. Management of the District is responsible for establishing and maintaining internal controls designed to ensure the assets of the District are protected from loss, theft, or misuse and to ensure that reliable and adequate accounting data are compiled to allow for the preparation of financial statements in conformity with accounting principles generally accepted in the United States of America. Internal accounting controls are designed to provide reasonable, but not absolute, assurance that these objectives are met. The concept of reasonable assurance recognizes that: (1) the cost of a control should not exceed the benefits likely to be derived and (2) the valuation of costs and benefits requires estimates and judgments by management.

ix
BUDGETARY CONTROL Annual appropriated budgets are adopted for the general, special revenue and debt service funds by June 30th each year. Budgets are adopted for the capital projects fund on a project-length basis. Budgets are considered a management control and planning tool and, as such, are incorporated into the accounting system of the District. In accordance with the Wisconsin Department of Public Instruction’s reporting requirements, the Board exercises control over budgeted amounts at the responsibility center level within the general, special revenue, and debt service funds. The capital projects fund is controlled at the project level. Additional budgetary control is maintained through the encumbrance of estimated purchase amounts prior to the release of purchase orders to vendors. Purchase orders that exceed available budgetary balances are not released until additional funds are transferred to cover the purchase orders. Board policy requires that all annual appropriations lapse at year-end except for the following: Excess budgetary authority for capital projects funds lapse into the capital projects fund when a specific project is completed; schools, with Board approval, are allowed to carry over appropriations into the following year up to a maximum of 1% of the total revised school budget; deficits incurred by schools automatically reduce subsequent year’s budget appropriations; and, with Board approval, appropriations for special projects or planned purchases can be carried into the subsequent year. Additionally, at year-end, both encumbrance and budgetary authority necessary to offset the encumbrance may be automatically carried over to the next year. Annual Board approval for carryover of encumbrances is not required.
AUDIT SERVICES To strengthen internal control, and provide for independent and objective reporting, the Board of School Directors maintains the audit function. The Office of Board Governance - Audit Services reports directly to the Board of School Directors. During the course of the year, the Office of Board Governance - Audit Services conducts fiscal and performance audits on individual funds, offices, divisions, programs, functions, and schools throughout the District. Reports are issued on an ongoing basis.
LONG-TERM FINANCIAL PLANNING
As articulated in the Major Initiatives section, the district is focused on improving its core business of educating Milwaukee’s children. The Eight Big Ideas articulate how that requires a multi-dimensional approach. This will impact long-term financial stability insofar as the public will support the district as measured through enrollment and tax revenues. Strong efforts in community engagement and communications are planned to ensure that parents and other stakeholders are fully participating with MPS schools to meet the challenges of guaranteeing access, equity and opportunity for Milwaukee’s children. Lobbying efforts will continue to ensure that legislators and other key decision makers are aware of the challenges in providing K–12 education in a high-poverty district. Private funding is growing through a variety of sources, and efforts will continue to secure such support. The administration will continue to budget conservatively so as to have resources available when unexpected costs are incurred. A proactive and enterprise-wide risk management strategy is in place to limit the district’s exposure to financial burdens. While state budget provisions are difficult to predict, the district will continue to develop forecasts which incorporate factors that are known. Future debt obligations, multi-year phase-out provisions in legislation and capital improvement plans are examples of opportunities and challenges which can be prepared for in advance. The district will continue to use best available tools and obtain external expertise as appropriate to plan for resource needs.

x
Finally, a continuous strategy to develop effective and efficient operations is under way. One result of this effort is cost containment which frees up district resources to address critical needs. With compensation being the majority of MPS’s costs, the administration will continue to bring proposals to the board for sustainable wage and benefit enhancements.
FINANCIAL POLICIES
The Board and administration have adopted policies and procedures that ensure effective and efficient use of the district’s financial resources. In August 2016, financial policy and procedure updates were adopted by the Board to reflect and underscore best current practices. The following are key policies that ensure sound fiscal management: MPS Administrative Policy 3.01 (1) (a) The superintendent of schools shall prepare an annual operating budget for the Milwaukee Public Schools consistent with state statutes, Department of Public Instruction regulations, and district policies and goals. (b) The purpose of the annual operating budget is to identify adequate financial resources for the educational programs and to provide a basis for accountability in fiscal management. MPS Administrative Policy 3.01 (2) (a) The following deadlines have been established by law:
1. Annually before adopting its budget for the next fiscal year and at least five days before transmitting its completed budget, the board shall hold a public hearing on the proposed budget.
2. At least one week before the public hearing, the board will publish a notice of the public hearing. 3. The board shall transmit its completed budget to the Common Council on or before the first Monday in August
of each year on forms furnished by the auditing officer of the City of Milwaukee.
Note: The board also approves adjustments and sets tax levy amounts by fund in October of the fiscal year. This is due to the timing of receiving final state aid amounts and other adjustments related to September enrollment. MPS Administrative Policy 3.03 (2) Use of the unassigned fund balance shall require a two-thirds majority vote of the board and shall not impair interim financing (cash-flow borrowing) arrangements. Fund balance is a critical factor in the district’s financial planning and budget process. The board will strive to maintain a fiscally responsible fund balance. A sufficient fund balance shall be maintained in order to:
avoid excessive borrowing; accumulate sufficient assets to make designated purchases or cover unforeseen expenditure needs; and demonstrate financial stability and therefore preserve or enhance the district’s bond rating, thereby lowering
debt issuance costs.

xi
DEBT ADMINISTRATION
The City school bonds, notes and capital lease obligations outstanding at June 30, 2016 totaled $376,470,900. Of this total, $17,128,786 represents school bonds and notes that will be repaid by the City using the City’s property tax levy. As the District does not have an obligation to repay these bonds and notes from its own property tax levy, the debt is not reflected in the District’s long-term obligations. The remaining balance of $359,342,114 represents capital lease obligations, bonds and promissory notes, the debt service of which is being reimbursed by the District to the City from the District’s property tax levy. Since the District does have an obligation to repay this debt under intergovernmental cooperation agreements with the City, this debt is reflected in the District’s long-term obligations. Additionally, for the year ended June 30, 2016, the District deposited $4,836,538 of principal payments into a Bond Sinking Fund to make Qualified School Construction Bond principal payments at maturity. Sinking fund principal payments on deposit as of June 30, 2016 total $11,561,538.
INDEPENDENT AUDIT
The financial records of the Milwaukee Board of School Directors have been audited by Baker Tilly Virchow Krause, LLP, independent auditors. The auditors’ opinion is unmodified. Such an opinion states the basic financial statements present fairly, in all material respects, the respective financial position of the governmental activities, each major fund, and the aggregate remaining fund information of the District as of June 30, 2016, and the respective changes in financial position for the year then ended, in conformity with accounting principles generally accepted in the United States of America. The auditors’ report on the basic financial statements and schedules is included in the financial section of this report.
In addition to a financial audit, Baker Tilly Virchow Krause, LLP performed an audit designed to meet the requirements of the Uniform Guidance and the state single audit guidelines. Information related to federal and state single audits are disclosed in separate reports.
REPORTING ACHIEVEMENTS
The Government Finance Officers Association of the United States and Canada (GFOA) awarded a Certificate of Achievement for Excellence in Financial Reporting to Milwaukee Public Schools for its Comprehensive Annual Financial Report for the fiscal year ended June 30, 2015. We believe that our current report conforms to the Certificate program requirements. Accordingly, we are submitting it to GFOA to determine its eligibility for certification.
ACKNOWLEDGMENTS
The preparation of this report on a timely basis could not have been accomplished without the efficient and dedicated service of the entire staffs of the Office of the Chief Financial Officer, the Office of Board Governance - Audit Services and the Office of Accountability and Efficiency. We would like to express our appreciation to all members of these offices who assisted and contributed to its preparation.
Respectfully submitted,
DARIENNE B. DRIVER, Ed.D. GERALD J. PACE, J.D. SUPERINTENDENT OF SCHOOLS CHIEF FINANCIAL OFFICER

This page intentionally left blank.

xii
BOARD OF SCHOOL DIRECTORS
TERM DISTRICT NAME EXPIRES 1 Mark Sain April, 2019 2 Wendell J. Harris, Sr. April, 2019 3 Michael Bonds April, 2019 4 Annie Woodward April, 2017 5 Larry Miller April, 2017 6 Tatiana Joseph April, 2017 7 Claire M. Zautke April, 2017 8 Carol Voss April, 2019 At-Large Terrence Falk April, 2019
President – Mark Sain Vice President – Larry Miller
Superintendent of Schools – Darienne B. Driver, Ed.D. Director, Office of Board Governance/Board Clerk – Jacqueline Mann
STANDING COMMITTEES
STUDENT ACHIEVEMENT AND SCHOOL INNOVATION COMMITTEE Directors Joseph (Chair), Bonds (Vice-chair), Falk, Harris, Miller
LEGISLATION, RULES AND POLICIES COMMITTEE
Directors Bonds (Chair), Woodward (Vice-chair), Falk, Miller, Zautke
ACCOUNTABILITY, FINANCE AND PERSONNEL COMMITTEE Directors Miller (Chair), Voss (Vice-chair), Sain, Woodward, Zautke
STRATEGIC PLANNING AND BUDGET COMMITTEE
Directors Falk (Chair), Voss (Vice-chair), Bonds, Harris, Joseph, Miller, Sain, Woodward, Zautke
PARENT AND COMMUNITY ENGAGEMENT COMMITTEE Directors Zautke (Chair), Harris (Vice-chair), Joseph, Voss, Woodward

.
LINCOLN AVE.
.
MILL RD.
CAPITOL DR.
.
.
.
BURLEIGH ST. .
SILVER SPRING DR.
GRANGE AVE.
LAYTON AVE.
.
COLLEGE AVE.
BURNHAM ST.
CONGRESS ST.
EDGERTON AVE.
60 ST
.
.
CALUMET RD.
GREEN TREE RD.
WISCONSIN AVE.
.
.
.
.
.
PIERCE ST.
.
.
.
FAIRVIEW AVE.
.
.
.
NORTH AVE.
JUNEAU AVE.
.WALNUT ST.
CENTER ST.
.
.
..
.
.
KEEFE AVE.
.
BROWN DEER RD.
COUNTY LINE RD.
BRADLEY RD.
GOOD HOPE RD.
HAMPTON AVE.
VILLARD AVE.
FLORIST AVE.
GREENFIELD AVE.
CLEVELAND AVE.
OKLAHOMA AVE.
MORGAN AVE.
HOWARD AVE.
BOLIVAR AVE.
68 ST
.
76 ST
.
84 ST
.
92 ST
.
100 S
T.
RAMSEY AVE.
WOOD AVE.
BRUS
T AVE
. 16
00
PINE A
VE.
800
HOW
ELL A
VE.
100
6 ST.
13 ST
.
20 ST
.
100 CANAL ST.
1070
0
9900
9100
8500
7600 6800
9600
9200
8800
8400
5100
4300
3500
2700
7600
7200
6800
6400
6000 600
100
5600
5200
4800
4400
4000
2600
DOW
NER
AVE.
1800
OAK
LAND
AVE.
1100
HUM
BOLD
T BLV
D.
3500
3100
2700
2300
1700
1200
700
700
1400
1900
2300
2700
3100
3500
.
.
4700
5100
5500
5900
6300
6700
MILWAUKEE SCHOOL BOARD DISTRICTS
1
2 354
67
8

xiv
MILWAUKEE PUBLIC SCHOOLS
ADMINISTRATIVE OFFICERS
SUPERINTENDENT OF SCHOOLS Ms. Darienne B. Driver, Ed.D. Chief of Staff Ms. Gina Spang, P.E. Chief Innovation and Information Officer Ms. Tonya Adair Chief Academic Officer Ms. Ruth Maegli Chief Human Resources Officer Mr. Daniel J Chanen, J.D. Chief Financial Officer Mr. Gerald J. Pace, J.D. Chief Operations Officer Mr. Wendell Willis Chief School Administration Officer Mr. Keith Posley, Ed.D.

xv

xvi
The Government Finance Officers Association of the United States and Canada (GFOA) awarded a Certificate of Achievement for Excellence in Financial Reporting to the Milwaukee Public Schools for the Comprehensive Annual Financial Report for the fiscal year ended June 30, 2015.
In order to be awarded a Certificate of Achievement, a governmental unit must publish an easily readable and efficiently organized comprehensive annual financial report. This report must satisfy both generally accepted accounting principles and applicable legal requirements.
A Certificate of Achievement is valid for a period of one year only. We believe that our current comprehensive annual financial report continues to meet the Certificate of Achievement Program’s requirements and we are submitting it to the GFOA to determine its eligibility for another certificate.

xvii

INTR
OD
UC
TOR
Y SEC
TION
FINA
NCIA
L SECTIO
N


This page intentionally left blank.

MILWAUKEE PUBLIC SCHOOLS
Management’s Discussion and Analysis
June 30, 2016
(Unaudited)
4
INTRODUCTION
This discussion and analysis of the financial performance of Milwaukee Public Schools (MPS or the District) provides an overview of the District’s financial activities for the fiscal year ended June 30, 2016. The intent of the management discussion and analysis is to look at the financial performance of MPS as a whole. It should be read in conjunction with the financial statements.
FINANCIAL HIGHLIGHTS
The District’s government-wide financial statements reflect the following:
Total net position of MPS decreased to ($79.4 million) at June 30, 2016, from ($70.6 million) at June 30, 2015, a decrease of approximately $8.8 million, or 12.5%. This decrease is primarily due to GASB Statement No. 68, Accounting for Pensions which accounted for $25 million of the decrease, an approximately $12 million increase in capital assets, and a $4.5 million decrease in unearned revenues.
Total revenues increased to $1.179 billion in fiscal year 2016 (FY16), up from $1.176 billion in fiscal year 2015, an increase of approximately 0.3% or $3 million. The increase is primarily attributable to $3.9 million in equalization aid.
Total expenses increased to $1.188 billion, up from $1.131 billion for the year ended June 30, 2015, an increase of 5.0% or $57 million. This increase primarily attributable to GASB Statement No. 68, Accounting for Pensions which accounted for $25 million of the increase and $17 million of the Regional Development Plan.
The District’s governmental fund financial statements reflect the following:
Total fund balances of the District’s governmental funds decreased $480,243 in fiscal year 2016. This decrease included a $.7 million increase in the General Fund, a $5.5 million decrease in the Construction Fund, a $4.3 million increase in the School Nutrition Fund, and no change in the Nonmajor Governmental Funds.
The $662,309 increase in the General Fund balance is the result of a prior bond sinking fund expense reclassified as a prepaid asset.
The decrease in the Construction fund balance is the result of project construction costs.
The $4.3 million increase in the School Nutrition fund balance is attributable to increase in federal meal reimbursements due to the District’s participation in the Community Eligibility Program (CEP) which provides a healthy breakfast and lunch at no charge to all students at MPS schools. The CEP program resulted in a reduction in lunch room sales.
Total fund balances for all governmental funds at June 30, 2016 were $129.4 million. Of this amount, $12.0 million was nonspendable, $54.8 million was restricted for self-insurance, debt service, flex spending, school nutrition services, long term capital investment and capital projects, $21.0 million was committed for construction, $1.0 million was assigned, and $40.6 million remains unassigned.

MILWAUKEE PUBLIC SCHOOLS
Management’s Discussion and Analysis
June 30, 2016
(Unaudited)
5
OVERVIEW OF THE FINANCIAL STATEMENTS
Below is an outline of the remaining sections of this annual report in the order in which they are presented. Following the outline is a brief description of each section.
1. Management’s Discussion and Analysis (this section)
2. Basic Financial Statements
Government-wide Financial Statements Statement of Net Position Statement of Activities
Fund Financial Statements Notes to Basic Financial Statements
3. Required Supplementary Information (RSI)
Budget-to-Actual Comparison Employee Pension Plan Liabilities, Current and Past Service OPEB Schedule of Funding Programs and Employer Contributions Schedule of Proportionate Share of Net Pension Asset/Liability
Management’s Discussion and Analysis section discusses the financial performance of MPS during the year ending June 30, 2016. It includes an overview of the financial statements of the District and a report on the budgetary highlights.
The Basic Financial Statements section includes both Government-wide and Fund Financial Statements. Government-wide financial statements report information about MPS as a whole, using accounting methods similar to those used by private sector companies. Two government-wide statements are presented. The statement of net position includes all of the District’s assets and deferred outflows and liabilities and deferred inflows of the governmental funds. The District does not have any proprietary funds and the fiduciary funds are not included in the statement of net position. The statement of activities includes all revenues and expenses of the District, irrespective of when cash is actually received or paid out. The intent of these government-wide statements is to present a snapshot of the District’s net position, and to provide an explanation of material changes that occurred since the prior year. Net position—the difference between assets, deferred outflows, deferred inflows, and liabilities—is one way to measure the District’s financial strength.
The fund financial statements provide detailed information about the District’s significant funds, rather than MPS as a whole. A fund is an accounting entity with a self-balancing set of accounts for recording assets, deferred outflows, deferred inflows, liabilities, revenues, and expenditures. Funds are created to carry on specific activities or attain certain objectives in accordance with special regulations or limitations. There are three types of funds: governmental, proprietary, and fiduciary. MPS does not have any proprietary funds. Table 1 summarizes various features of each of these funds.

MILWAUKEE PUBLIC SCHOOLS
Management’s Discussion and Analysis
June 30, 2016
(Unaudited)
6
Table 1
Major Features of MPS' Government-wide and Fund Financial Statements
Government-Wide Fund Statements
Statements Governmental Funds Fiduciary Funds
Scope Entire MPS entity (not Activities that are not proprietary Activities where MPS acts
including fiduciary funds) or fiduciary; e.g. school operations, as trustee or agent for
capital projects, and debt service another; e.g. employee
retirement plans
Required financial - Statement of net position - Balance sheet - Statement of fiduciary
statements - Statement of activities - Statement of revenues, net position
expenditures, and changes in - Statement of changes in
fund balance fiduciary net position
Accounting basis and Accrual accounting and Modified accrual accounting and Accrual accounting and
measurement focus economic resource focus current financial resource focus economic resource focus
Type of asset/liability All assets and liabilities, Only assets consumed and liabilities All assets and liabilities,
information both financial and capital, due in the current year, or soon both financial and capital,
short-term and long-term after; no capital assets short-term and long-term
Type of inflow/outflow All revenues and expenses Revenues when cash is received All revenues and expenses
information occurring during the year, by year-end, or soon after; occurring during the year,
regardless when cash is expenditures when goods and services regardless of when cash is
received or paid have been received and payment is due received or paid
by year-end, or soon after
Governmental Funds — Most of the District’s basic services are included in governmental funds, which focus on (1) cash and other financial assets that can readily be converted to cash flow and (2) the balances remaining at year-end that are available for spending. Consequently, the governmental funds statements provide a detailed short-term view that helps the reader determine whether there are more or less financial resources to finance MPS programs. Because this information does not encompass the additional long-term focus of the government-wide statements, additional information is provided that explains the relationship between them.
Fiduciary Funds — MPS is the trustee, or fiduciary, for its employees’ pension plans. The District is also responsible for other assets that — because of a trust arrangement — can be used only for the trust beneficiaries. MPS is responsible for ensuring that the assets reported in these funds are used for their intended purposes. All of the District’s fiduciary activities are reported in a separate statement of fiduciary net position and a statement of changes in fiduciary net position.
MILWAUKEE PUBLIC SCHOOLS
Management’s Discussion and Analysis
June 30, 2016
(Unaudited)
7
Required supplementary information (RSI) includes a budget-to-actual comparison that provides readers with information about the accuracy with which management was able to project the District’s revenue and expenditure categories. In addition, RSI includes information concerning MPS’ employee pension plan costs and OPEB. Schedules are included. One schedule shows the District’s progress toward funding its past service liability. The other is a schedule of employer contributions that focuses on payment of current pension fund costs.
GOVERNMENT-WIDE FINANCIAL STATEMENTS
Statement of Net Position
Total net position decreased from the prior year by $8.8 million. This decrease is primarily due to implementation of GASB Statement No. 68, Accounting for Pensions which accounted for $25 million of the decrease, an approximately $11 million increase in capital assets, and a decrease of $4.5 million of unearned revenues.
MPS ended its fiscal year with a net position of ($79.4) million, of which $500.0 million was net investment in capital assets, $14.4 million was restricted for debt service, and ($593.8) million was an unrestricted deficit. The unrestricted deficit is primarily the result of a $516.2 million OPEB liability. In November 2003, the MPS Board of School Directors took action to refinance the pension liability, which at that time was owed to the Wisconsin Retirement System. The District issued pension bonds in the amount of $168.1 million to fully fund future employee pension benefits granted through collective bargaining. At June 30, 2016 the balance of the outstanding pension debt grew to $188.8 million due to the pension financing including capital appreciation securities which accrete over time.

MILWAUKEE PUBLIC SCHOOLS
Management’s Discussion and Analysis
June 30, 2016
(Unaudited)
8
Capital Assets increased by $12.0 million. The increase is the net result of Construction in Progress increasing by $18.9 million, Buildings, and Furniture increasing by $15.6 million, and Accumulated Depreciation increasing by $22.5 million.
Notable changes in Noncapital Assets is the result of GASB Statement No. 68, Accounting for Pensions which accounted for $163.4 million of the increase and Deferred Cash Flow Hedges-Unrealized Loss on Derivatives is reported as the District applies hedge accounting for derivatives that are deemed effective hedges. Under hedge accounting, a decrease in the fair value of a hedge is reported as a deferred cash flow hedge on the statement of net position. For the reporting period, all the District’s derivatives met the effectiveness test. The noncurrent asset component of the increase in fair value is $24.2 million and the noncurrent asset component is $73.9 million.
(in thousands)
Governmental Activities2016 2015 Difference
Capital assets, net $ 632,475 $ 620,524 $ 11,951
Noncapital assets and deferred outflows of resources 636,268 449,476 186,792
Intangible assets 15,812 16,153 (341)
Total assets and deferred outflows of resources 1,284,555 1,086,153 198,402
Current liabilities 125,208 123,946 1,262
Noncurrent liabilities and deferred inflows of resources 1,238,720 1,032,823 205,897
Total liabilities and deferred inflows of resources 1,363,928 1,156,769 207,159
Net position:
Net investment in capital assets 500,042 489,612 10,430
Restricted 14,369 83,694 (69,325)
Unrestricted (deficit) (593,784) (643,922) 50,138
Total net position (deficit) $ (79,373) $ (70,616) $ (8,757)
Condensed Statement of Net Position (Deficit)
Table 2

MILWAUKEE PUBLIC SCHOOLS
Management’s Discussion and Analysis
June 30, 2016
(Unaudited)
9
Current liabilities increased $1.3 million in the current year. This is primarily due to $1.1 million of pension bond payments.
A notable change in Noncurrent liabilities is the result of $24.2 million increase in derivative instruments and GASB Statement No. 68, Accounting for Pensions which accounted for $188.6 million of the increase.
Statement of Activities
Table 3 shows that on a government-wide basis, the District ended fiscal year 2016 with a decrease in net position of $8.8 million, compared to an increase of $45.4 million in fiscal year 2015.

MILWAUKEE PUBLIC SCHOOLS
Management’s Discussion and Analysis
June 30, 2016
(Unaudited)
10
Table 3
Schedule of Revenues and Expenses
(in thousands)
Governmental Activities2016 2015 Difference
Program revenues:Charges for services $ 19,548 $ 17,160 $ 2,388 Operating grants and contributions 265,979 286,680 (20,701) Capital grants and contributions 16,348 849 15,499
Total program revenues 301,875 304,689 (2,814)
General revenues:Property taxes 300,634 302,279 (1,645) Other taxes 810 1,837 (1,027) Federal and state aid 570,219 563,629 6,590 Interest and investment earnings 4,349 2,913 1,436 Gain on sale of capital assets 333 - 333 Miscellaneous 1,020 933 87
Total general revenues 877,365 871,591 5,774
Total revenues 1,179,240 1,176,280 2,960
Expenses:Instruction 681,195 647,365 33,830 Community services 27,789 29,312 (1,523) Pupil and staff services 128,939 131,799 (2,860) General administration 112,899 98,125 14,774 Business services 169,413 160,678 8,735 School nutrition 50,101 47,234 2,867 Interest on long-term debt 17,652 16,332 1,320 Bond issuance cost 9 - 9
Total expenses 1,187,997 1,130,845 57,152
Increase (decrease) in net position (8,757) 45,435 (54,192)
Net Position-Beginning of Year (70,616) (116,051) 45,435 Net Position-End of Year $ (79,373) (70,616) (8,757)
Total revenues increased $3.0 million or 0.3% over the prior year. The greatest changes came in the area of General-Federal and State Aid. Federal and State Aid increased by $3.9 million due to increase in equalization aid.
Total expenses increased by $57 million, or 5.0%. This increase in instruction expense is primarily attributable to GASB Statement No. 68, Accounting for Pensions which accounted for $25 million of the increase and $17 million of the Regional Development Plan.
MILWAUKEE PUBLIC SCHOOLS
Management’s Discussion and Analysis
June 30, 2016
(Unaudited)
11
Capital Assets
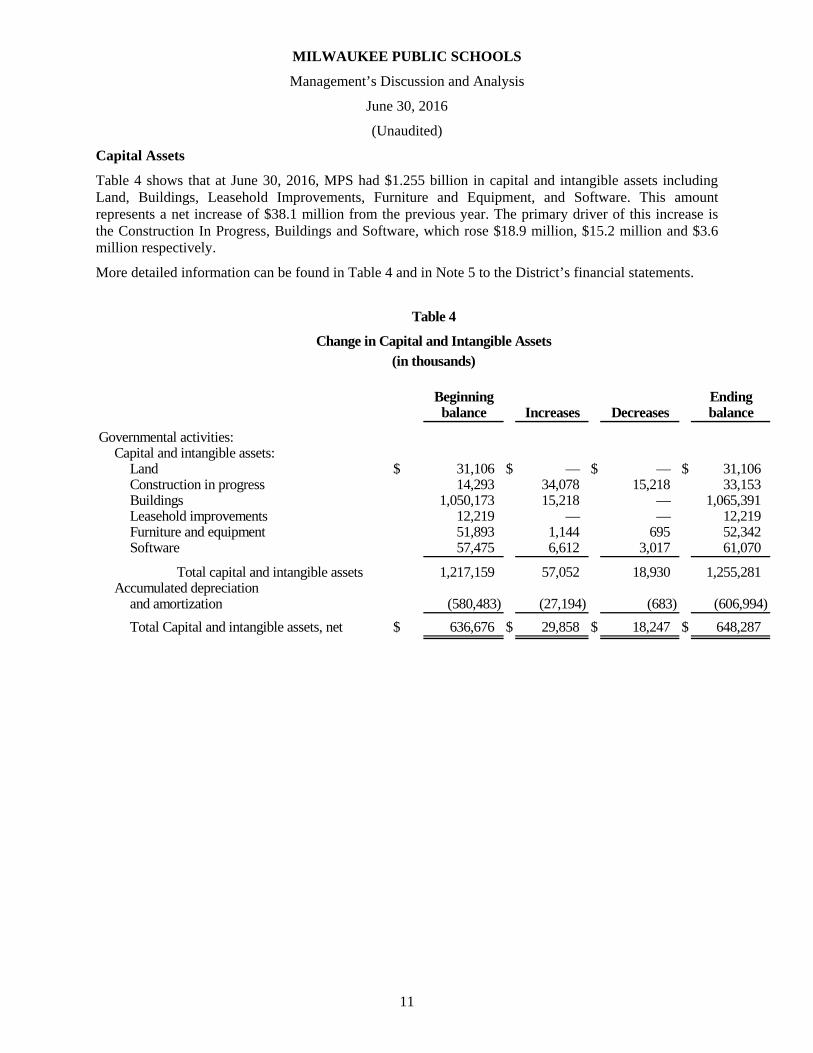
Table 4 shows that at June 30, 2016, MPS had $1.255 billion in capital and intangible assets including Land, Buildings, Leasehold Improvements, Furniture and Equipment, and Software. This amount represents a net increase of $38.1 million from the previous year. The primary driver of this increase is the Construction In Progress, Buildings and Software, which rose $18.9 million, $15.2 million and $3.6 million respectively.
More detailed information can be found in Table 4 and in Note 5 to the District’s financial statements.
Change in Capital and Intangible Assets(in thousands)
Beginning Endingbalance Increases Decreases balance
Governmental activities:Capital and intangible assets:
Land $ 31,106 $ — $ — $ 31,106 Construction in progress 14,293 34,078 15,218 33,153 Buildings 1,050,173 15,218 — 1,065,391 Leasehold improvements 12,219 — — 12,219 Furniture and equipment 51,893 1,144 695 52,342 Software 57,475 6,612 3,017 61,070
Total capital and intangible assets 1,217,159 57,052 18,930 1,255,281 Accumulated depreciation
and amortization (580,483) (27,194) (683) (606,994)
Total Capital and intangible assets, net $ 636,676 $ 29,858 $ 18,247 $ 648,287
Table 4

MILWAUKEE PUBLIC SCHOOLS
Management’s Discussion and Analysis
June 30, 2016
(Unaudited)
12
Long-term Debt
Long-term debt at June 30, 2016 was $359.3 million with debt retirements totaling $7.8 million.
The Neighborhood School Initiative (NSI) debt is part of a state of Wisconsin-sponsored program intended to increase the capacity and improve the quality of Milwaukee’s neighborhood schools. The outstanding debt is in the form of revenue bonds issued by the Redevelopment Authority of the City of Milwaukee on behalf of MPS, and is secured through bond insurance and a moral obligation pledge by the state of Wisconsin. A total of $112,040,000 of NSI debt was issued, with the first tranche issued in February 2002 (Series 2002A) in the amount of $33,300,000, and the second tranche sold on November 5, 2003 (Series 2003A) in the amount of $78,740,000. On February 1, 2007 MPS completed an advance refunding of $29,260,000 of the second tranche (Series 2003A) and also retired $5.1 million of bonds from that same tranche. On May 6, 2013, the District, through RACM, issued $45,570,000 of Refunding Revenue Bonds for a current refunding of Series 2002 and Series 2003 bonds callable on August 1, 2013. This resulted in a $6.4 million gain for the district over the life of the refunded debt. Approximately $6.1 million of NSI debt was retired in fiscal year 2016.
The Qualified Zone Academy Bond (QZAB) debt is in the form of lease-purchase agreements collateralized by the assets purchased with the proceeds. The QZAB program is sponsored by the Internal Revenue Service (IRS) and provides interest-free capital for the purpose of promoting academic programs in partnership with the business community. QZAB debt has been used to support the purchase of furniture and equipment, and to make building improvements at several MPS schools. Interest on the debt is paid by the IRS via tax credits to the lender. QZAB debt decreased by $505,293 in fiscal year 2016.
Table 5
Change in Long-term Debt and Capital Lease Obligations
(in thousands)
July 1, June 30,2015 Issuances Retirements 2016
Governmental activities:Americans with Disabilities
Act loans $ 3,482 $ — $ 870 $ 2,612 Neighborhood School
Initiative bonds 76,172 — 6,113 70,059 Qualified School Construction Bonds 49,018 (28) 49,046 Qualified Zone Academy bonds 1,418 — 505 913 Pension refinancing debt 187,706 — (1,086) 188,792 Capital leases 38,000 — — 38,000 Other intergovernmental debt 11,354 — 1,434 9,920
Total debt $ 367,150 $ — $ 7,808 $ 359,342
MILWAUKEE PUBLIC SCHOOLS
Management’s Discussion and Analysis
June 30, 2016
(Unaudited)
13
In December 2003, the city of Milwaukee, in connection with an intergovernmental cooperation agreement, issued $168,051,136 in bonds on behalf of the District to refund pension-related debt for the Wisconsin Retirement System totaling $165,505,293. In June 2006, MPS spent $5.9 million to retire $8.5 million of face value pension-related capital appreciation notes. The fiscal year 2016 ending balance is greater than the beginning balance given a portion of the District’s pension debt is in the form of capital appreciation securities which appreciate each year.
On June 30, 2015, the District entered into $38,000,000 of new capital lease obligations to fund major modifications/improvements at various school facilities, the complete demolition and construction of a new athletic facility at South Stadium, and the complete modernization of the athletic facility at Custer Stadium. The financing vehicle for the capital lease was lease revenue bonds, designated as Qualified School Construction Bonds (QSCB), issued through the Redevelopment Authority of the City of Milwaukee (RACM). Of note, under current law, the interest on the $38.0 million of capital leases is partially reimbursed to the District by the federal government.
Additional information is provided in Table 5 on the previous page, and in note 7 to the District’s financial statements.
FUND FINANCIAL STATEMENTS
Milwaukee Public Schools has three major funds reported on the governmental fund statements. The major funds are the General Fund, School Nutrition Services Fund, and the Construction Fund.
The year-end General fund balance increased $662,309 over the prior year-end. The increase in the General fund balance is the result of a prior bond sinking fund expense reclassified as a prepaid asset.
The decrease in the Construction fund balance is the result of project construction costs.
The $4,338,214 increase in the School Nutrition fund balance is attributable to increase in federal meal reimbursements due to the District’s participation in the Community Eligibility Program (CEP) which provides a healthy breakfast and lunch at no charge to all students at MPS schools. The CEP program resulted in a reduction in lunch room sales.
NOTES TO BASIC FINANCIAL STATEMENTS
The notes to the basic financial statements supplement the basic financial statements by providing detailed descriptions of the District’s significant accounting policies and presenting data that identifies changes that occurred throughout the year.
BUDGETARY HIGHLIGHTS
Annual budgets are prepared on a basis consistent with accounting principles generally accepted in the United States of America for the general, construction, and other non-major governmental funds. Annual unencumbered appropriations lapse at fiscal year-end.
In May 2015, the MPS Board of School Directors (the Board) adopted the District’s fiscal 2016 budget (July 1, 2015 – June 30, 2016). The adopted budget by necessity used a projection of the fiscal 2016 student enrollment. In October 2015, the Board amended the budget to take into account the actual student enrollment as measured on the third Friday in September 2015, as required by Wisconsin State Statute. The October amendment process is important to MPS in that its two principal revenue sources, state general aids and property taxes, are predicated on actual MPS enrollment.

MILWAUKEE PUBLIC SCHOOLS
Management’s Discussion and Analysis
June 30, 2016
(Unaudited)
14
The October adjustment process also incorporates all other changes in revenue and expenditure projections that result from having current information. The adopted budget, as amended, becomes the District’s final budget.
In October 2015, the Board approved a revised fiscal year 2016 (FY16) General Fund expenditure budget in the amount of $1,121,986,436. This amount included prior year encumbrances and carryover authority.
Actual General Fund expenditures for FY16 were over 95% of the FY16 revised General Fund budget.
Current Economic Facts and Next Year’s Budget
In October 2016, the MPS Board approved a revised FY17 General Fund budget of $1,142,661,444. The FY17 budget includes prior year encumbrances and carryover appropriation authority and is up 0.7% from the FY16 General Fund Budget.
The District’s revenue limit for FY17 is $822,405,065, a $3.3 million or 0.4% decrease below FY16. The FY17 revenue limit is based on prior year revenues, three-year enrollment trends and other factors determined by the biennial state budget process.
State general aids, primarily equalization aid, increased 1.7% to $549,888,607. Equalization aid is based on the following: (1) expenditures and enrollment of the prior year, (2) district property values, which the State considers to be a measure of community wealth. The MPS aid required for Milwaukee Parental Choice Program (MPCP) in FY17 is $48.6 million.
The MPS District-Wide FY17 Amended Adopted Budget totals $1,196,354,446. This is 2.4% more than the FY16 Amended Adopted Budget of $1,168,690,105. The increase is the result of planned borrowing of $27 million in the construction fund.
Approximately 90 cents of every dollar budgeted in the School Operations Fund has been allocated for educating the City of Milwaukee children. Education is provided through MPS traditional and charter schools, open enrollment or with MPS contracted schools. Six cents of every dollar budgeted has been allocated for non-school-based staff and services. The remaining four cents of every dollar are for costs that are necessary to run schools such as utilities, insurance, technology licenses and debt repayment.
District total enrollment, based on Third Friday September 2016 counts, is 83,654. This is up 0.4% from FY16. Enrollment in the District’s Traditional, Charter, and Non-Instrumentality Charter Schools enrollment is up 1.7% from FY16 to FY17.
The 2016-17 Budget reflects the district’s ongoing commitment to fiscal responsibility and an emphasis on student achievement. Resources have been allocated to allow for an increase of support positions in schools, some for the direct support of students and others for the ongoing development of teachers. The district is expanding summer school as well as city-wide programs to serve youth in non-school hours.
MILWAUKEE PUBLIC SCHOOLS
Management’s Discussion and Analysis
June 30, 2016
(Unaudited)
15
REQUESTS FOR INFORMATION
This financial report is designed to provide citizens, taxpayers, parents, students, investors, and creditors with a general overview of MPS’ finances and to demonstrate the District’s accountability for the funds it receives. If you have questions about this report or need additional financial information, you can contact:
Milwaukee Public Schools Office of Finance
5225 West Vliet Street Milwaukee, WI 53208
Or visit our website at: www.milwaukee.k12.wi.us

BASIC FINANCIAL STATEMENTS

MILWAUKEE PUBLIC SCHOOLS
Statement of Net Position (Deficit)
As of June 30, 2016
GovernmentalActivities
Assets and Deferred Outflows of ResourcesCurrents: Assets:
Cash and investments (note 2) $ 86,618,975 Accounts receivable, net (note 3) 9,157,832 Due from other governments (note 3) 78,356,134 Inventory and other assets (note 1(g)) 1,643,145 Prepaid items (note 1(g)) 9,453,791
Total current assets 185,229,877
Noncurrent assets:Restricted cash and investments (note 1(d)) 39,133,052 Deposits for self-insurance (note 1(l)) 8,069,749 Capital assets not being depreciated (note 5) 64,258,068 Capital assets being depreciated, net (note 5) 568,217,332 Intangible assets, net (note 5A) 15,811,812 Restricted Assets (note 10) Bond Sinking Fund (note 7) 11,561,538
Total noncurrent assets 707,051,551
Deferred outflows of resources:Deferred loss on refunding 618,206 Deferred cash flow hedges - unrealized loss on derivatives (note 7) 73,890,990 Related to pension - WRS 232,979,797 Related to pension - ERS 66,693,849 Related to pension - ASC & Teachers Supplementals 18,091,047
Total assets and deferred outflows of resources 1,284,555,317
Liabilities and Deferred Inflows of Resources
Current liabilities:Accounts payable and other current liabilities 92,671,770 Accrued interest payable on long-term liabilities 3,841,646 Current portion of long-term obligations (note 7) 28,694,202
Total current liabilities 125,207,618
Noncurrent liabilities:Noncurrent portion of long-term obligations (note 7) 862,772,539 Net Pension Liability - WRS 43,792,878 Net Pension Liability - ERS 53,735,000 Net Pension Liability - ASC & Teachers Supplementals 98,198,863
Total noncurrent liabilities 1,058,499,280
Deferred inflows of resources:Deferred gain on refunding 88,545 Unearned revenue 7,118,832 Derivative instruments liability (note 7) 73,890,990 Related to pension - WRS 92,161,365 Related to pension - ERS 4,019,000 Related to pension - ASC & Teachers Supplementals 2,942,914
Total liabilities and deferred inflows of resources 1,363,928,544
Net Position
Net investment in capital assets 500,041,665 Restricted for debt service 14,368,921 Unrestricted (Deficit) (593,783,813)
Total net position (deficit) $ (79,373,227)
See accompanying notes to basic financial statements.
16

MILWAUKEE PUBLIC SCHOOLS
Statement of Activities
For the Year Ended June 30, 2016
Net (expenses)Operating Capital revenues and
Charges for grants and grants and changes inFunctions/programs Expenses services contributions contributions net position
Governmental activities:Instruction $ 681,195,330 8,619,364 184,229,896 16,348,227 (471,997,843)
Support services:Community services 27,789,456 4,365,200 5,559,121 — (17,865,135) Pupil and staff services 128,939,561 — 18,367,601 — (110,571,960) General, administration, and
central services 112,898,587 — — — (112,898,587) Business services 169,413,167 5,398,788 5,580,111 — (158,434,268) School nutrition services 50,101,295 1,164,444 52,242,705 — 3,305,854 Interest on long-term debt 17,651,925 — — — (17,651,925) Bond issuance costs 8,762 — — — (8,762)
Total support services 506,802,753 10,928,432 81,749,538 — (414,124,783)
Total school district $ 1,187,998,083 19,547,796 265,979,434 16,348,227 (886,122,626)
General revenues: Taxes: Property taxes levied for general purposes 268,759,174 Property taxes levied for construction 10,600,000 Property taxes levied for debt service 4,209,121 Property taxes levied for community services 17,065,872 Other taxes 810,337 Federal and state aid not restricted to a specific purpose: General (equalization aid) 509,173,092 Other 61,046,450 Miscellaneous 1,019,580 Interest and investment earnings 4,349,251 Gain on sale of capital assets 332,510
Total general revenues 877,365,387
Change in net position (8,757,239)
Net position—Beginning of Year (deficit) (70,615,988)
Net position—Ending of Year (deficit) $ (79,373,227)
See accompanying notes to basic financial statements.
Program revenues
17

MILWAUKEE PUBLIC SCHOOLS
Balance SheetGovernmental FundsAs of June 30, 2016
Special Revenue
Capital School Nonmajor TotalProjects Nutrition governmental governmental
Assets General Construction Services funds funds
Deposits with the City of Milwaukeeand other cash (note 2) $ 62,547,125 24,071,850 — — 86,618,975
Receivables, net:Accounts (note 3) 6,751,905 2,405,927 — — 9,157,832 Due from other governmental units (note 3) 67,438,621 — 7,326,315 3,591,198 78,356,134 Due from other funds (note 4) — 5,111,130 — — 5,111,130
Total receivables 74,190,526 7,517,057 7,326,315 3,591,198 92,625,096
Restricted cash and investments (note 1(d)) 18,438,783 20,694,269 — — 39,133,052 Inventories and other assets (note 1(g)) 1,643,145 — — — 1,643,145 Prepaid items (note 1(g)) 9,453,791 — — — 9,453,791 Deposits for self-insurance (note 1(l)) 8,069,749 — — — 8,069,749
Total assets $ 174,343,119 52,283,176 7,326,315 3,591,198 237,543,808
Liabilities, Deferred Inflows of Resources and Fund Balances
Liabilities:Accounts payable $ 47,224,534 5,308,399 1,961,394 42,494 54,536,821 Accrued salaries and wages 11,083,482 — — — 11,083,482 Accrued claims for self-insurance (note 9) 22,748,521 — — — 22,748,521 Accrued pension payable (note 10) 4,287,016 — — — 4,287,016 Other accrued expenditures 15,930 — — — 15,930 Due to other funds (note 4) 1,076,535 — 485,891 3,548,704 5,111,130
Total liabilities 86,436,018 5,308,399 2,447,285 3,591,198 97,782,900
Deferred inflow of resources (note 1(o))Unearned revenue 7,607,958 2,770,000 1,387 — 10,379,345
Fund balances:
Non-SpendableNoncurrent Receivable 923,445 — — — 923,445 Inventories and other assets 1,643,145 — — — 1,643,145 Prepaid items 9,453,791 — — — 9,453,791 Noncurrent Advances — — — — —
Restricted:Self-insurance deposits 8,069,749 — — — 8,069,749 Debt service 18,438,783 — — — 18,438,783 Restricted for capital projects — 20,444,142 — — 20,444,142 School Nutrition Services — 4,877,643 — 4,877,643 Flex Spending 228,216 — — — 228,216 Long Term Capital Investment Fund — 2,750,127 — — 2,750,127
Committed:Construction — 21,010,508 — — 21,010,508
Assigned for 2017 budget appropriation 975,383 — — — 975,383 Unassigned 40,566,631 — — — 40,566,631
Total fund balances 80,299,143 44,204,777 4,877,643 — 129,381,563
Total liabilities, deferred inflows and fund balances $ 174,343,119 52,283,176 7,326,315 3,591,198 237,543,808
See accompanying notes to basic financial statements
18

MILWAUKEE PUBLIC SCHOOLS
Reconciliation of the Governmental Funds Balance Sheetto the Statement of Net Position (Deficit)
As of June 30, 2016
Total fund balances—governmental funds $ 129,381,563
Amounts reported for governmental activities in the statement of net position are different because:
Refunding of Debt (gains)/loss are capitalized at the government-wide level and amortized 529,661 over the shorter of the remaining life of the old debt or life of the new debt
Bond sinking cost reported as an asset at the government-wide level and reported 11,561,538 as an expenditure for government funds
Capital assets used in the governmental activities are not financialresources and, therefore, are not reported as assets in the governmentalfunds:
Cost of capital assets $ 1,194,211,487 Accumulated depreciation (561,736,087)
Net capital assets 632,475,400 Intangible assets used in the governmental activities are not financial
resources and, therefore, are not reported as assets in the governmentalfunds:
Cost of intangible assets $ 61,069,606 Accumulated depreciation (45,257,794)
Net capital assets 15,811,812
Deferred outflows of resources related to pensions do not relate to currentfinancial resources and, therefore, are not reported in the funds 317,764,693
Net Pension Liabilities used in the governmental activities are not financial uses and, therefore, are not reported as liabilities in the governmentalfunds (195,726,741)
Grant and other receivables that are not collected within 90 days after year-end are notconsidered to be available to pay for the current period’s expenditures and,therefore, are unearned in the funds 3,260,513
Deferred inflows of resources related to pensions do not relate to currentfinancial resources and, therefore, are not reported in the funds (99,123,279)
Long-term liabilities (including bonds payable) are not due and payablein the current period and, therefore, are not reported as liabilities in the funds. Long-term liabilities at year-end consist of:
Bonds and notes payable (399,125,383) Bonds premium and discounts (4,824,714) Discount on capital appreciation bonds 82,607,983 Capital leases payable (38,000,000) Accrued interest payable (3,841,646) Compensated absences payable (vacation and sick leave) (8,709,351) OPEB liability (516,178,187) Workers’ compensation claims payable (4,666,907) Self-insurance claims payable (325,672) Life insurance benefits and other long-term liabilities (2,244,510)
Total long-term debt liabilities (895,308,387) Total net position—government activities (deficit) $ (79,373,227)
See accompanying notes to basic financial statements.
19
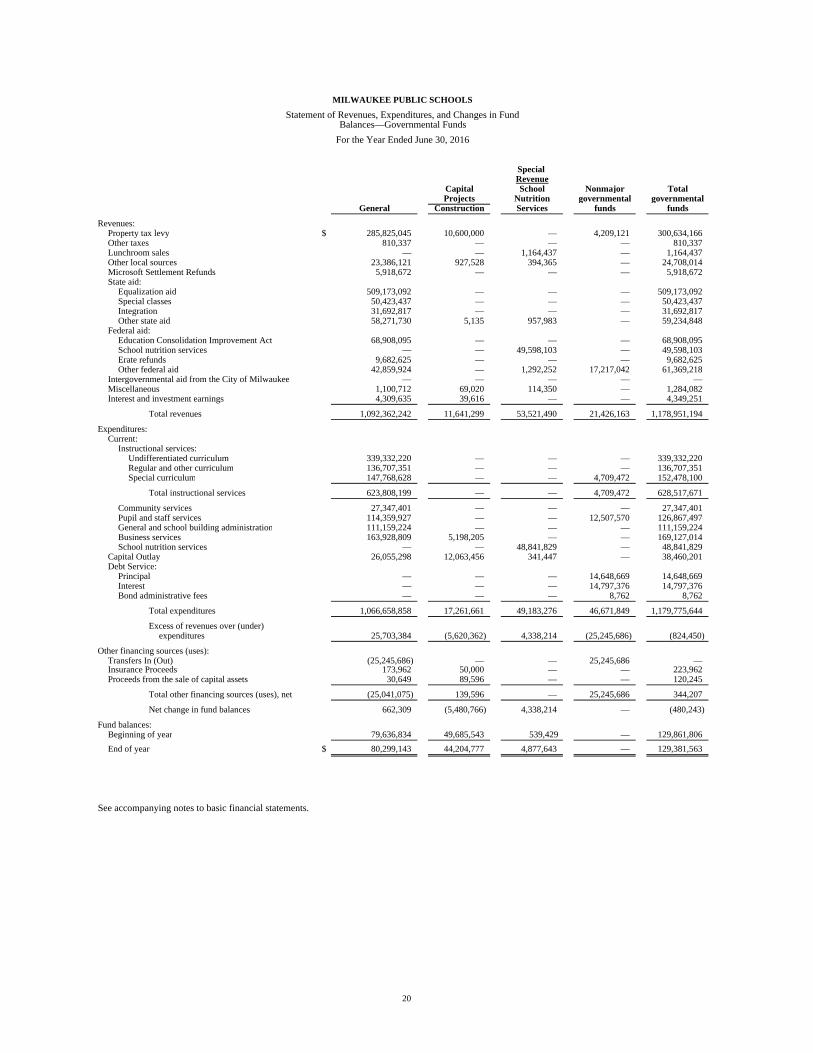
MILWAUKEE PUBLIC SCHOOLS
Statement of Revenues, Expenditures, and Changes in FundBalances—Governmental Funds
For the Year Ended June 30, 2016
Special Revenue
Capital School Nonmajor TotalProjects Nutrition governmental governmental
General Construction Services funds funds
Revenues:Property tax levy $ 285,825,045 10,600,000 — 4,209,121 300,634,166 Other taxes 810,337 — — — 810,337 Lunchroom sales — — 1,164,437 — 1,164,437 Other local sources 23,386,121 927,528 394,365 — 24,708,014 Microsoft Settlement Refunds 5,918,672 — — — 5,918,672 State aid:
Equalization aid 509,173,092 — — — 509,173,092 Special classes 50,423,437 — — — 50,423,437 Integration 31,692,817 — — — 31,692,817 Other state aid 58,271,730 5,135 957,983 — 59,234,848
Federal aid:Education Consolidation Improvement Act 68,908,095 — — — 68,908,095 School nutrition services — — 49,598,103 — 49,598,103 Erate refunds 9,682,625 — — — 9,682,625 Other federal aid 42,859,924 — 1,292,252 17,217,042 61,369,218
Intergovernmental aid from the City of Milwaukee — — — — — Miscellaneous 1,100,712 69,020 114,350 — 1,284,082 Interest and investment earnings 4,309,635 39,616 — — 4,349,251
Total revenues 1,092,362,242 11,641,299 53,521,490 21,426,163 1,178,951,194
Expenditures:Current:
Instructional services:Undifferentiated curriculum 339,332,220 — — — 339,332,220 Regular and other curriculum 136,707,351 — — — 136,707,351 Special curriculum 147,768,628 — — 4,709,472 152,478,100
Total instructional services 623,808,199 — — 4,709,472 628,517,671
Community services 27,347,401 — — — 27,347,401 Pupil and staff services 114,359,927 — — 12,507,570 126,867,497 General and school building administration 111,159,224 — — — 111,159,224 Business services 163,928,809 5,198,205 — — 169,127,014 School nutrition services — — 48,841,829 — 48,841,829
Capital Outlay 26,055,298 12,063,456 341,447 — 38,460,201 Debt Service:
Principal — — — 14,648,669 14,648,669 Interest — — — 14,797,376 14,797,376 Bond administrative fees — — — 8,762 8,762
Total expenditures 1,066,658,858 17,261,661 49,183,276 46,671,849 1,179,775,644
Excess of revenues over (under) expenditures 25,703,384 (5,620,362) 4,338,214 (25,245,686) (824,450)
Other financing sources (uses): Transfers In (Out) (25,245,686) — — 25,245,686 — Insurance Proceeds 173,962 50,000 — — 223,962 Proceeds from the sale of capital assets 30,649 89,596 — — 120,245
Total other financing sources (uses), net (25,041,075) 139,596 — 25,245,686 344,207
Net change in fund balances 662,309 (5,480,766) 4,338,214 — (480,243)
Fund balances:Beginning of year 79,636,834 49,685,543 539,429 — 129,861,806
End of year $ 80,299,143 44,204,777 4,877,643 — 129,381,563
See accompanying notes to basic financial statements.
20

MILWAUKEE PUBLIC SCHOOLS
Reconciliation of the Governmental Funds Statement of Revenues,Expenditures, and Changes in Fund Balances to the Statement of Activities
For the Year Ended June 30, 2016
Net change in fund balances—total governmental funds $ (480,243)
Amounts reported for governmental activities in the statement of activities are different because:
Capital outlays are reported in governmental funds as expenditures.However, in the statement of activities, the cost of those assets is allocated over their estimated useful lives as depreciation expense
Capital outlay reported in governmental fund statements $ 38,460,201 Depreciation and amortization expense reported in the statement of activities (27,194,377)
Amount by which capital outlays are more than depreciation and amortizationin the current period 11,265,824
The net effect of miscellaneous transactions involving capital assetsdonated to the District that increases net position 400,267
The net effect of miscellaneous transactions involving capital assets(i.e., sales, trade-ins, and disposals) is to decrease net position (11,696)
Bond sinking cost reported as asset at the government-wide level and reported 4,836,538 as an expenditure for government funds (925,000) 3,911,538
Some revenues will not be collected for several months after the District’s fiscal year-end, they are not considered “available” revenues and are deferred in the governmental funds (399,061)
Some expenses reported in the statement of activities require the use of currentfinancial uses and, therefore, are reported as expenditures in thegovernment funds.
Net pension assets (67,124,130) Net pension liabilities (89,488,014) Deferred outflows of resources related to pensions 230,547,910 Deferred inflows of resources related to pensions (99,123,279) Gain on refunding (88,545)
Bond, note, and capital lease proceeds are reported as financing sources in governmental funds and thuscontribute to the change in fund balance. In the statement of net position, however,issuing debt increases long-term liabilities and does not affect the statement ofactivities. Similarly, repayment of principal is an expenditure in the governmentalfunds, but reduces the liability in the statement of net position.
Bonds and notes 10,737,131
Under the modified accrual basis of accounting used in the governmental funds,expenditures are not recognized for transactions that are not normally paidwith expendable available financial resources. In the statement of activitieshowever, which is presented on the accrual basis, expenses and liabilitiesare reported regardless of when financial resources are available. In additioninterest on long-term debt is not recognized under the modified accrualbasis of accounting until due, rather than as it accrues.
Net decrease in accrued interest payable 73,975 Accretion of interest on capital appreciation bonds (3,595,895) Amortization of bond premium, discount and refunding deferred 667,371 Net increase in compensated absences payable (vacation and sick pay) 110,059 Net decrease in workers’ compensation claims payable 2,789,018 Net increase in OPEB liability (9,215,201) Net decrease in general insurance claims payable 58,208 Net decrease in life insurance benefits payable 207,524
Net adjustment (8,904,941) Change in net position of governmental activities $ (8,757,239)
See accompanying notes to basic financial statements.
21

MILWAUKEE PUBLIC SCHOOLS
Statement of Fiduciary Net Position
As of June 30, 2016
Pension and Other PrivatePost Employment purpose
Assets Benefits trusts trust Agency
Deposits with City of Milwaukee and other cash (note 2) $ — — 5,477,368
Investments (note 2) — 1,670,873 — Money market accounts 79,849,182 — — Treasury and agency securities 17,300,088 — — Mortgage-backed securities 69 — — Nongovernment obligations 31,902,276 — — Municipal bonds 1,447,259 — — Investment in the State of Wisconsin 175,141,159 — —
Receivables-interest and contributions 11,352,978 — —
Total assets 316,993,011 1,670,873 5,477,368
Liabilities
Accounts payable and accrued expenses 5,245,218 — — Due to student organizations — — 5,477,368
Total liabilities 5,245,218 — 5,477,368
Net Position
Net Position restricted for:Pensions 311,747,793 — — Endowments — 1,670,873 —
Total net position $ 311,747,793 1,670,873 —
See accompanying notes to basic financial statements.
22

MILWAUKEE PUBLIC SCHOOLS
Statement of Changes in Fiduciary Net Position
For the Year Ended June 30, 2016
Pension and Other PrivatePost Employment purpose
Benefits trusts trustAdditions:
Employer contributions $ 56,995,835 — Participants contributions 9,100,339 — Private donations — 211,829 Interest income — 889 Investment income:
Net investment from the State of Wisconsin:Core Retirement Investment Trust Fund 1,415,843 — Variable Retirement Trust Fund (327,851) —
Net investment income from other investments 1,744,808 — Total investment income: 2,832,800 —
Investment expenses (19,565) — Net investment income 2,813,235 —
Total additions 68,909,409 212,718
Deductions:Benefits paid to participant's or beneficiaries $ 79,078,601 — Non-trust expenses — 1,062,403 Distribution of participant contribution accounts 19,399 — Administrative expenses 319,279 — Scholarships and awards — 268,479
Total deductions 79,417,279 1,330,882 Changes in net position (10,507,870) (1,118,164)
Net position—beginning of year 322,255,663 2,789,037 Net position—end of year 311,747,793 1,670,873
See accompanying notes to basic financial statements.
23

MILWAUKEE PUBLIC SCHOOLS
Notes to Basic Financial Statements
For the Year Ended June 30, 2016
24
(1) Summary of Significant Accounting Policies
The financial statements of the Milwaukee Public Schools (the District) have been prepared in conformity with accounting principles generally accepted in the United States of America as applied to government units. The Governmental Accounting Standards Board (GASB) is the accepted standard-setting body for establishing governmental accounting and financial reporting principles. The significant accounting principles and policies used by the District are described below.
(a) Reporting Entity
The District was established on February 3, 1846, and operates under Chapter 119 of the Wisconsin State Statutes. The District is the largest school district in Wisconsin. The District, governed by a nine-member elected school board, provides elementary, secondary, vocational, and special education services through grade 12 to residents of the City of Milwaukee, Wisconsin (the City).
The District receives funding from local, state, and federal government sources and must comply with the concomitant requirements of these funding source entities.
The reporting entity for the District is based upon criteria set forth by GASB Statement No. 14, The Financial Reporting Entity. Under this pronouncement, the financial reporting entity consists of (a) the primary government, which is controlled by a separately elected governing body that is legally separate and is fiscally independent, and (b) organizations for which the primary government is financially accountable. All of the accounts of the District comprise the primary government.
The financial statements of the District are excluded from the City’s financial statements because the District operates with a separate governing board that is not under the control of the City. The City, however, performs the following services for the District, as prescribed under Wisconsin State Statutes:
Administers the property tax levy adopted by the school board and collects and remits the property taxes to the District
Acts as the treasurer for the major portion of the District’s cash
Issues debt for the benefit of the District for the purchase of sites and buildings
This report includes all of the funds of the District. The reporting entity for the District consists of the primary government and its component units. Component units are legally separate organizations for which the primary government is financially accountable or other organizations for which the nature and significance of their relationship with the primary government are such that their exclusion would cause the reporting entity's financial statements to be misleading. The primary government is financially accountable if (1) it appoints a voting majority of the organization's governing body and it is able to impose its will on that organization, (2) it appoints a voting majority of the organization's governing body and there is a potential for the organization to provide specific financial benefits to, or impose specific financial burdens on, the primary government, (3) the organization is fiscally

MILWAUKEE PUBLIC SCHOOLS
Notes to Basic Financial Statements
For the Year Ended June 30, 2016
25
dependent on and there is a potential for the organization to provide specific financial benefits to, or impose specific financial burdens on, the primary government. Certain legally separate, tax exempt organizations should also be reported as a component unit if all of the following criteria are met: (1) the economic resources received or held by the separate organization are entirely or almost entirely for the direct benefit of the primary government, its component units, or its constituents; (2) the primary government or its component units, is entitled to, or has the ability to access, a majority of the economic resources received or held by the separate organization; and (3) the economic resources received or held by an individual organization that the primary government, or its component units, is entitled to, or has the ability to otherwise access, are significant to the primary government.
Component units are reported using one of two methods, discrete presentation or blending. Generally, component units should be discretely presented in a separate column in the financial statements. A component unit should be reported as part of the primary government using the blending method if it meets any one of the following criteria: (1) the primary government and the component unit have substantively the same governing body and a financial benefit or burden relationship exists, (2) the primary government and the component unit have substantively the same governing body and management of the primary government has operational responsibility for the component unit, (3) the component unit serves or benefits, exclusively or almost exclusively, the primary government rather than its citizens, or (4) the total debt of the component unit will be paid entirely or almost entirely from resources of the primary government. This report does not contain any component units.
(b) Basis of Presentation
Government-wide Statements—The statement of net position and the statement of activities present financial information about the District as a whole. They include all funds of the District except for fiduciary funds. As a general rule, the effect of interfund activity has been eliminated from the government-wide financial statements. Governmental activities generally are financed through taxes, intergovernmental revenues, and other non-exchange transactions. Interfund services provided and used are not eliminated.
The statement of activities presents a comparison between direct expenses and program revenues for each function of the District’s governmental activities. Direct expenses are those that are specifically associated with and are clearly identifiable to a particular function. Program revenues include (a) charges paid by the recipients of goods and services offered by the programs and (b) grants and contributions that are restricted to meeting the operational or capital requirements of a particular program. Taxes, equalized aid, and other items not included among program revenues are reported as general revenues. Internally dedicated resources are reported as general revenues rather than program revenues.
Fund Financial Statements—The fund financial statements provide information about the District’s funds, including fiduciary funds. Separate statements for each fund category—governmental and fiduciary—are presented. The emphasis of fund financial statements is on major governmental funds; each is displayed in a separate column. All remaining governmental funds are aggregated and reported as nonmajor governmental funds.

MILWAUKEE PUBLIC SCHOOLS
Notes to Basic Financial Statements
For the Year Ended June 30, 2016
26
The District reports the following major governmental funds:
General Fund: The general fund is the general operating fund of the District. It is comprised of two taxing entities that were established by Wisconsin State Statutes and is used to account for all financial revenues and expenditures of the District except those required to be accounted for in other funds or taxing entities.
Capital Project-Construction Fund: The construction fund is used to account for and report financial resources that are restricted, committed, or assigned to expenditures for the acquisition or construction of capital facilities and the additions to and remodeling of existing buildings. The District has only one activity unit within the construction fund for which property taxes are levied to finance various capital expenditures.
Special Revenue-School Nutrition Services Fund: This fund is used to account for the breakfast and lunch programs operated by the District for students. Revenues are provided through federal and state aids, as well as sales at schools.
The District reports the following nonmajor governmental funds:
Special Revenue Fund: used to account and report the proceeds of specific revenue sources (other than major capital projects) that are restricted or committed to expenditures for specified purposes.
Categorically Aided Programs
Debt Service Fund: used to account and report financial resources that are restricted, committed or assigned to expenditures for the payment of general long-term debt principal, interest and related costs.
Additionally, the District reports the following fund types:
Pension Trust Funds: The pension trust funds account for the accumulation of resources for pension benefit payments under two early retirement plans maintained by the District for qualified teachers and administrators.
Other Postemployment Employee Benefits Funds (OPEB): The OPEB trust fund account may hold or be used to account for assets used to pay post-employment benefits or fund accrued liability associated with such benefits.
Private-Purpose Trust Fund: The private-purpose trust funds are:
1) Donations that are received pursuant to a trust agreement that restricts the use of the donations to the extent of the interest or other earnings of the fund. These trusts are maintained by the District for the purpose of scholarships for students.
2) Donations that are received pursuant to a trust agreement that restricts the use of the donation to a specified purpose but allows for the principal and interest to be expended. These trusts are maintained by the District to include scholarships, donations toward specified activities within schools, and trusts to support extracurricular programs.

MILWAUKEE PUBLIC SCHOOLS
Notes to Basic Financial Statements
For the Year Ended June 30, 2016
27
Agency Fund: The agency fund accounts for the accumulation and expenditure of individual school activity funds. The sources of these funds include sales of supplies to students, residuals from fund-raising activities, and funds raised by the schools to support field trips or school-related activities. The principal at each school is responsible for accounting for all school activity funds and individual schools are required to maintain uniform accounting records.
(c) Measurement Focus and Basis of Accounting
The government-wide and fiduciary fund statements (excluding agency funds) are reported using the economic resources measurement focus and the accrual basis of accounting. Revenues are recorded when earned and expenses are recorded at the time liabilities are incurred, regardless of when the related cash transaction takes place. For the pension trust funds, plan member contributions are recognized in the period in which the contributions are due. Employer contributions to the plans are recognized when due. Benefits and refunds are recognized when due and payable in accordance with the terms of the Plan.
Nonexchange transactions, in which the District gives or receives value without directly receiving or giving equal value in exchange, include property taxes, grants, entitlements, and donations. On an accrual basis, revenue from property taxes is recognized in the fiscal year for which the taxes are levied. Revenue from grants, entitlements, and donations is recognized in the fiscal year in which all eligibility requirements have been satisfied.
The governmental fund statements are reported using the current financial resources measurement focus and the modified accrual basis of accounting. Under this method, revenues are recognized when measurable and available. The District considers all revenues reported in the governmental funds to be available if the revenues are collected within 90 days after the end of the fiscal year except for property taxes, which must be collected within 60 days after year-end. Those revenues susceptible to accrual are property taxes, state aid, interest revenue, grants, and charges for services. Other revenue is recorded when received. Expenditures are recorded when the fund liability is incurred, except for principal and interest on long-term debt, claims and judgments, and compensated absences that are recognized as expenditures to the extent they have matured. General capital asset acquisitions are reported as expenditures in governmental funds. Proceeds of long-term debt and acquisitions under capital leases are reported as other financing sources.
Under the terms of grant agreements, the District may fund certain programs by a combination of specific cost-reimbursement grants, categorical funds, and general revenues. Therefore, when program expenses are incurred, both restricted and unrestricted net position may be available to finance the program. It is the District’s policy to first apply cost-reimbursement grant resources to such programs, followed by general revenues.
Agency funds follow the accrual basis of accounting, and do not have a measurement focus.
(d) Restricted Assets
Mandatory segregations of assets are presented as restricted assets. Such segregations are required by bond agreements and other external parties. The excess of restricted assets over current liabilities payable from restricted assets will be used to finance project costs or the

MILWAUKEE PUBLIC SCHOOLS
Notes to Basic Financial Statements
For the Year Ended June 30, 2016
28
retirement of related long-term debt. The remainder, if generated from earnings, is shown as restricted net position.
(e) Receivables
General accounts receivable have been adjusted for all known uncollectible accounts. An allowance for uncollectible accounts is reported at year-end for $894,150.
During the course of operations, transactions occur between individual funds that may result in amounts owed between funds. Short-term interfund loans are reported as “due to and from other funds.” Long-term interfund loans (noncurrent portion) are reported as “advances from and to other funds.” Interfund receivables and payables between funds within governmental activities are eliminated in the Statement of Net Position.
(f) Investments
The District has adopted an investment policy. Provisions of the policy are discussed in Note (2).
Investments, including investments of the pension trust funds, are reported at fair value based on quoted market prices. Short-term investments are reported at cost, which approximates fair value. Investments principally consist of U.S. Government securities, mortgage-backed securities, corporate bonds obligations, money market mutual funds, and investments in the State of Wisconsin Fixed Retirement Investment Trust Fund (Trust Fund). The fair value of investments in the Trust Fund is the same as the value of the pooled shares. Although not subject to direct regulators’ oversight, the Trust Fund is administered in accordance with the provisions of Section 25.50 of the Wisconsin State Statutes. Purchases and sales of securities are recorded on a trade-date basis. Net investment income in the Trust Fund consists of realized and unrealized gains and losses and investment income.
(g) Inventories, Other Assets and Prepaid Items
Inventories are valued at average cost. Inventories in the governmental fund types are recorded as expenditures when consumed rather than when purchased. Donated United States Department of Agriculture (USDA) commodities are recorded as revenues and expenditures in school nutrition services at the fair value when originally donated by the USDA.
Certain payments to vendors reflect costs applicable to future accounting periods and are recorded as prepaid items in both government-wide and fund financial statements.

MILWAUKEE PUBLIC SCHOOLS
Notes to Basic Financial Statements
For the Year Ended June 30, 2016
29
(h) Capital Assets and Intangible Assets
Capital and intangible assets are reported at actual cost or estimated costs. Donated assets are reported at the estimated fair market value at the time received. Capital and intangible assets are depreciated and amortized using the straight-line method over their estimated lives. Capitalization thresholds (the dollar value above which asset acquisitions are added to the capital asset accounts) and estimated useful lives of capital and intangible assets reported in the government-wide statements are as follows:
Capitalization Estimatedthreshold useful life
Buildings $ 5,000 50 yearsFurniture and equipment 5,000 5 – 20 yearsVehicles 5,000 5 – 15 yearsComputers and related equipment 5,000 5 yearsMajor computer 50,000 7 yearsIntangible assets 50,000 7 years
(i) Property Taxes
The aggregate amount of property taxes to be levied for school purposes is determined according to provisions of Chapter 120 of the Wisconsin State Statutes. Property taxes for the District are adopted by the Board by early November and are certified to the City for levy and collection.
The District’s property taxes are levied annually prior to December 31, are administered by the City for the District based on the assessed (taxable) values as of January 1 of that calendar year, and are recognized as District revenue in the fiscal year they are levied. The levy becomes a lien against property on January 1. The taxes are due January 31, but may be paid in 10 monthly installments to the City from January through October. All unpaid taxes as of June 30 are purchased by the City.
(j) Deferred Outflows of Resources
A deferred outflow of resources represents a consumption of net position that applies to a future period and will not be recognized as an outflow of resources (expense/expenditure) until that future time.
The accumulated decrease in fair value of hedging derivatives represents the change in value of derivative instruments that are deemed to be effective hedge.
Gain/Loss on Refundings of Debt
In the government-wide financial statements, gains and losses from refundings of debt resulting in defeasance are deferred and amortized as a component of interest expense over the shorter of the remaining life of the old debt or the life of the new debt. The unamortized amount is reported as a deferred outflow of resources in the government-wide statements.

MILWAUKEE PUBLIC SCHOOLS
Notes to Basic Financial Statements
For the Year Ended June 30, 2016
30
(k) Compensated Absences
District employees are granted vacation, compensatory time, and sick leave benefits in varying amounts in accordance with the provisions of union contracts and District policies. In the event of retirement, death, or resignation of an employee, the District is obligated to pay for all unused vacation days. All vacation pay is accrued when incurred in the government-wide financial statements. A liability for these amounts is reported in the governmental funds only if they have matured, for example, as a result of employee resignations and retirements.
Sick leave benefits are available for subsequent use and, in certain situations, a portion vests upon retirement. A liability for sick pay has been calculated using the vesting method in which leave amounts for both employees who currently are eligible to receive termination payments upon retirement and other employees who are expected to become eligible in the future to receive such payments are included.
(1) Insurance Deposits
The District has recorded deposits in the general fund for self-funded health insurance and current life insurance obligations and a restriction of fund balance aggregating $8,069,749 at June 30, 2016 to provide for payment of future claims.
(m) Bond Premiums and Discounts
In the government-wide financial statements, bond premiums and discounts are deferred and amortized over the life of the bonds using the effective interest method. Bonds payable are reported net of the applicable bond premium or discount.
In the fund financial statements, governmental fund types recognize bond premiums and discounts during the current period. The face amount of debt issued is reported as other financing sources. Premiums on debt issuances are reported as other financing sources, while discounts on debt issuances are reported as other financing uses. Discounts for capital appreciation bonds and notes (i.e., zero coupon debt) are netted against the face amount of the debt.
(n) Claims and Judgments
Claims and judgments are recorded as liabilities if all the conditions of Governmental Accounting Standards pronouncements are met. The liability and expenditure for claims and judgments is only reported in governmental funds if it has matured. Claims and judgments are recorded in the district-wide statements as expenses when the related liabilities are incurred.
(o) Deferred Inflows of Resources
A deferred inflow of resources represents an acquisition of net position/fund balance that applies to a future period and therefore will not be recognized as an inflow of resources (revenue) until that future time. The deferred balances consist of General Fund –primarily unavailable grant revenues of $2.8 million and available grants of $4.3 million plus long term receivable of $2.8 million in the Construction Fund.

MILWAUKEE PUBLIC SCHOOLS
Notes to Basic Financial Statements
For the Year Ended June 30, 2016
31
(p) Net Position
In the government-wide financial statements, equity is classified as net position and displayed in three components:
Net Investment in capital assets—This consists of capital assets including restricted capital assets, net of accumulated depreciation, less the outstanding balances of any bonds, notes, or other borrowings that are attributable to the acquisition, construction, or improvement of those assets, plus unspent proceeds.
Restricted—This consists of net position with constraints placed on their use by 1) external groups such as creditors, grantors, contributors, or 2) law through constitutional provisions or enabling legislation.
Unrestricted—This consists of net position that do not meet the definition of “restricted” or “net investment in capital assets.”
(q) Fund Balance
Governmental fund balances are displayed as follows:
Nonspendable fund balance—Includes amounts that cannot be spent because they are either not in spendable form or, for legal or contractual reasons, must be kept intact. This classification includes inventories, prepaid amounts, assets held for sale, and long-term receivables.
Restricted fund balance—Constraints placed on the use of these resources are either externally imposed by creditors (such as through debt covenants), grantors, contributors or other governments; or are imposed by law (through constitutional provisions or enabling legislation).
Committed fund balance—Amounts that can only be used for specific purposes because of a formal action (resolution) by the government’s highest level of decision-making authority. Fund balance amounts are committed through a formal action of the District. The formal action must occur prior to the end of the reporting period, but the amount of commitment, which will be subject to the constraints, may be determined in the subsequent period. Any changes to the constraints imposed require the same formal action of the District that originally created the commitment.
Assigned fund balance––Amounts that are constrained by MPS’ intent to be used for specific purposes, but that do not meet the criteria to be classified as restricted or committed. Intent can be stipulated by the governing body, another body, or by an official to whom that authority has been given. The District by resolution has given authority to the District’s Chief Financial Officer. With the exception of the General Fund, this is the residual fund balance classification for all governmental funds with positive balances.
Unassigned fund balance––This is the residual classification of the General Fund. Only the General Fund reports a positive unassigned fund balance. Other governmental funds might report a negative balance in this classification, as the result of overspending for specific purposes for which amounts had been restricted, committed or assigned.

MILWAUKEE PUBLIC SCHOOLS
Notes to Basic Financial Statements
For the Year Ended June 30, 2016
32
The District considers restricted amounts to be spent first when both restricted and unrestricted fund balance is available unless there are legal documents/contracts that prohibit doing this, such as in grant agreements requiring dollar for dollar spending. Additionally, the District would first use committed, then assigned and lastly unassigned amounts of unrestricted fund balance when expenditures are made.
Fiduciary fund equity is classified as held in trust for employee benefits.
(r) Use of Estimates
The preparation of financial statements in conformity with accounting principles generally accepted in the United States of America requires management to make estimates and assumptions that affect the reported amounts of assets, deferred outflows of resources, liabilities and deferred inflows of resources and disclosure of contingent assets and liabilities at the date of the financial statements and revenues and expenses/expenditures for the reporting period. Actual results could differ from those estimates.
(s) Pension
For purposes of measuring the net pension liability (asset), deferred outflows of resources and deferred inflows of resources related to pensions, and pension expense, information about the fiduciary net position of the Wisconsin Retirement System (WRS) & Employee Retirement System (ERS) and additions to/deductions from WRS’ & ERS’ fiduciary net position have been determined on the same basis as they are reported by WRS & ERS. For this purpose, benefit payments (including refunds on employee contributions) are recognized when due and payable in accordance with the benefit terms. Investments are reported at fair value.
(t) New Accounting Pronouncements
In February 2015, The GASB issued Statement No. 72 –Fair Value Measurement and Application. This Standard establishes financial reporting standards for fair value measurement. This District made the decision to implement this standard, effective July 1, 2015.

MILWAUKEE PUBLIC SCHOOLS
Notes to Basic Financial Statements
For the Year Ended June 30, 2016
33
(2) Deposits and Investments
District’s Deposits and Investments, Exclusive of Pension Trusts
Carrying BankValue Balance
Cash at the City 82,060,434$ 85,536,366$
Demand deposits 8,934,998 15,683,220
Repurchase Agreement 3,000,000 -
Money market funds 114,162,303 114,249,396
Non-Government Obligations 22,191,128 22,191,128
U.S. Treasury Notes and Agencies 17,300,088 17,300,088
State and Municipal Notes 1,447,259 1,447,259
Total Cash and Investments 249,096,210$ 256,407,457$
Reconciliation to financial statements Per statement of net position Unrestricted cash and investments 86,618,975$
Restricted cash and investments 39,133,052
Per statement of net position – Fiduciary Funds Private purpose trust 1,670,873
Other post employment benefits trust 116,195,942
Agency 5,477,368
Total Cash and Investments 249,096,210$
Credit risk is defined as the risk that an issuer or other counterparty to an investment will not fulfill its obligations. To limit credit risk, MPS restricts the commitment of funds to only those investments authorized by Wisconsin State Statute 66.0603 and Chapter 881 including the following:
Time deposits with maturities of not more than 3 years.
Bonds or securities issued or guaranteed as to principal and interest by the federal government or by a commission, board or other instrumentality of the federal government.
The state of Wisconsin local government pooled investment fund.
Bonds or securities of any county, city, drainage district, vocational or technical college, village, town or school district in Wisconsin, local exposition district, local professional baseball park district, local professional football stadium district, the University of Wisconsin Hospitals and Clinics Authority, local cultural arts district, or Wisconsin Aerospace Authority.
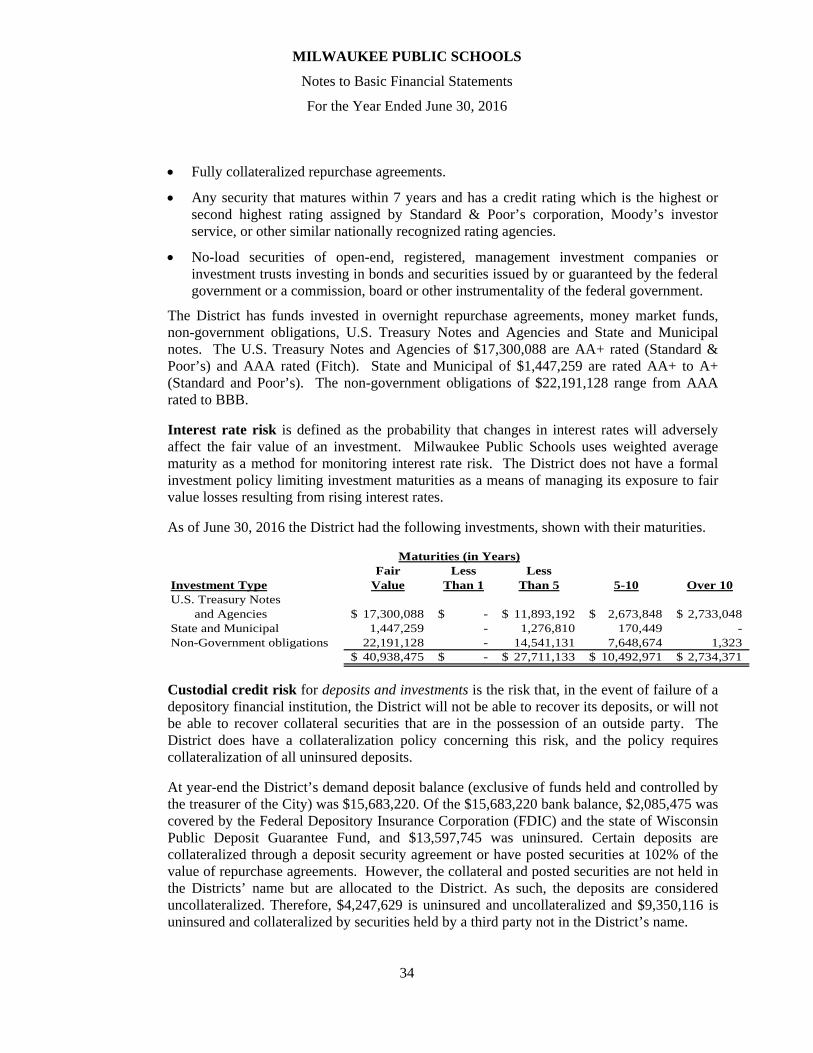
MILWAUKEE PUBLIC SCHOOLS
Notes to Basic Financial Statements
For the Year Ended June 30, 2016
34
Fully collateralized repurchase agreements.
Any security that matures within 7 years and has a credit rating which is the highest or second highest rating assigned by Standard & Poor’s corporation, Moody’s investor service, or other similar nationally recognized rating agencies.
No-load securities of open-end, registered, management investment companies or investment trusts investing in bonds and securities issued by or guaranteed by the federal government or a commission, board or other instrumentality of the federal government.
The District has funds invested in overnight repurchase agreements, money market funds, non-government obligations, U.S. Treasury Notes and Agencies and State and Municipal notes. The U.S. Treasury Notes and Agencies of $17,300,088 are AA+ rated (Standard & Poor’s) and AAA rated (Fitch). State and Municipal of $1,447,259 are rated AA+ to A+ (Standard and Poor’s). The non-government obligations of $22,191,128 range from AAA rated to BBB.
Interest rate risk is defined as the probability that changes in interest rates will adversely affect the fair value of an investment. Milwaukee Public Schools uses weighted average maturity as a method for monitoring interest rate risk. The District does not have a formal investment policy limiting investment maturities as a means of managing its exposure to fair value losses resulting from rising interest rates.
As of June 30, 2016 the District had the following investments, shown with their maturities.
Fair Less LessInvestment Type Value Than 1 Than 5 5-10 Over 10U.S. Treasury Notes and Agencies 17,300,088$ -$ 11,893,192$ 2,673,848$ 2,733,048$ State and Municipal 1,447,259 - 1,276,810 170,449 - Non-Government obligations 22,191,128 - 14,541,131 7,648,674 1,323
40,938,475$ -$ 27,711,133$ 10,492,971$ 2,734,371$
Maturities (in Years)
Custodial credit risk for deposits and investments is the risk that, in the event of failure of a depository financial institution, the District will not be able to recover its deposits, or will not be able to recover collateral securities that are in the possession of an outside party. The District does have a collateralization policy concerning this risk, and the policy requires collateralization of all uninsured deposits.
At year-end the District’s demand deposit balance (exclusive of funds held and controlled by the treasurer of the City) was $15,683,220. Of the $15,683,220 bank balance, $2,085,475 was covered by the Federal Depository Insurance Corporation (FDIC) and the state of Wisconsin Public Deposit Guarantee Fund, and $13,597,745 was uninsured. Certain deposits are collateralized through a deposit security agreement or have posted securities at 102% of the value of repurchase agreements. However, the collateral and posted securities are not held in the Districts’ name but are allocated to the District. As such, the deposits are considered uncollateralized. Therefore, $4,247,629 is uninsured and uncollateralized and $9,350,116 is uninsured and collateralized by securities held by a third party not in the District’s name.

MILWAUKEE PUBLIC SCHOOLS
Notes to Basic Financial Statements
For the Year Ended June 30, 2016
35
The money market funds total $114,249,396 of which $113,999,269 is uninsured and uncollateralized and $250,127 is uninsured and collateralized by securities held by a third party not in the District’s name.
The remaining investments of non-government obligations, U.S. Treasury Notes and Agencies, and State and Municipal notes are also uninsured or uncollateralized.
Funds held and controlled by the treasurer of the City are insured by the FDIC and the Wisconsin Public Deposit Guarantee Fund. Per Common Council the City Treasurer shall require collateralization of certificates of time deposit (excluding interest checking) at financial institutions when the total amount of such certificates of deposit with any institution exceeds the combined insured limit of $650,000. Milwaukee Public Schools’ deposits with the City Treasurer for investments are all insured or collateralized on June 30, 2016.
Fair Value Measurements. The Milwaukee Public School categorizes its fair value measurements within the fair value hierarchy established by generally accepted accounting principles. The hierarchy is based on the valuation inputs used to measure the fair value of the asset. Level 1 inputs are quoted prices in active markets for identical assets; Level 2 inputs are significant other observable inputs; Level 3 inputs are significant unobservable inputs.
The valuation methods for recurring fair value measurements are as follows:
Inputs other than quoted prices that are observable for securities, either directly or indirectly.
Investment Type Level 1 Level 2 Level 3 TotalCorporate Bonds -$ 17,496,870$ -$ 17,496,870$ Foreign Bonds - 4,694,258 4,694,258 Municipal Bonds - 1,447,259 - 1,447,259 Treasury/Federal Agencies - 17,300,088 - 17,300,088
-$ 40,938,475$ -$ 40,938,475$
June 30, 2016
Milwaukee Board of School Directors Early Retirement Supplement and Benefit Improvement Plan
The Trustees of the Plan have adopted a Statement of Investment Policy (the “Policy”). It articulates asset allocation targets; guidelines for interest rate risk, credit risk, and concentration of credit risk for separately managed portfolios; and performance benchmarks. Under Wisconsin statutes, equities, other than investments in the State of Wisconsin Employee Trust Funds (“SWIB funds”), are subject to the statutory limitation that they may not exceed 50% of the market value of the plan assets. The Plan has no equity investments other than those in the SWIB funds. The Policy targets equities in the SWIB Variable Fund to equal 150% of the amount in Fixed Income securities at BMO, with the remainder of the portfolio allocated to the SWIB Core Fund. The Policy target for Fixed Income is the sum of six months benefit payments plus six months administrative expense. The portfolio is rebalanced toward the Policy targets quarterly. On June 30, 2016, the SWIB Core Fund strategic targets were 25% to U.S. Stocks, 39% to Fixed Income, 23% to International Stocks,

MILWAUKEE PUBLIC SCHOOLS
Notes to Basic Financial Statements
For the Year Ended June 30, 2016
36
7% to Real Estate, and 10% to Alternative Investments. On June 15, 2016, the SWIB Variable Fund asset-mix targets were 70% to U.S. Stocks, 30% to International Stocks, and 0% to Alternative Investments.
Under the SWIB Investment Policy, the Core and Variable Fund asset allocations will be reviewed monthly for potential rebalancing. For the SWIB funds, when a major liquid asset class (i.e., Total Public Equities, Total Public Fixed Income) exceeds plus or minus 4% of its target allocation, a rebalancing exercise will be initiated. The Plan’s investment portfolio (the Fund) has two investment managers: the State of Wisconsin Investment Board (SWIB) and BMO. Each investment manager is responsible for managing the portion of the Fund assets under its control in accordance with its policy and guidelines. BMO is also responsible for managing its Plan portfolios in accordance with the guidelines adopted by the Trustees. Milwaukee Public Schools completes a comprehensive review of the Fund relative to the Policy on an annual basis.
A. Interest Rate Risk
Interest rate risk is the risk that changes in interest rates will adversely affect the fair value of an investment. Milwaukee Public Schools uses both duration and weighted average maturity as methods of monitoring interest rate risk. SWIB data is expressed in terms of modified duration and option adjusted duration. Modified duration, which is stated in years, is the measure of price sensitivity of a fixed income security to an interest rate change of 100 basis points. The calculation is based on the weighted average of the present value of all cash flows. Some pooled investments are analyzed using an option adjusted duration calculation which is similar to the modified duration method. Option adjusted duration incorporates the duration shortening effect of any embedded call provisions in securities.
The following schedule summarizes the duration and fair value of the investments at BMO as of June 30, 2016 and the fair value at SWIB as of June 30, 2016.
Investment Duration (Years) Fair Value
SWIB Core and Details on SWIB fixed income investments as 42,606,775$ Variable Funds of 12/31/15 are included below.
Money market accounts (at BMO) 0.1 1,388,538$
Mutual Funds (at BMO) 3.7 2,533,101$
Mortgage Backed Securities N/A 69$
SWIB information provided within the accompanying financial statement is as of December 31, 2015. There has been no significant change in SWIB’s investment strategies, asset allocations and investment pricing methods from December 31, 2015 to June 30, 2016. Based on SWIB information, the District feels the information presented for SWIB Investments as of December 31, 2015 is a fair representation for June 30, 2016.

MILWAUKEE PUBLIC SCHOOLS
Notes to Basic Financial Statements
For the Year Ended June 30, 2016
37
The following schedule displays the duration or weighted average maturity of the investments by type of investment at SWIB as of December 31, 2015. SWIB Investments Duration (Years) Fair Value
Asset Backed Securities 1.8 $ 47 MillionCommercial Paper <1 $ 323 MillionCorporate Bonds and Private Placements 5.7 $ 4,788 MillionForeign Gov't/Agency Bonds 8.1 $ 3,524 MillionMunicipal Bonds 9.7 $ 119 MillionRepurchase Agreements 1 day $ 805 MillionUS Government Agencies 3.8 $ 284 MillionUS TIPS 7.7 $ 6,704 MillionU.S. Treasury Securities 5.0 $ 4,154 MillionCommingled Funds 0.2 to 6.3 $ 8,489 Million
Note: On June 30, 2016, SWIB’s Core Fund and Variable Fund had $87.6 billion and $6.7 billion in assets, respectively. As of June 30, 2016, the Plan’s assets were invested 81% in the SWIB Core Fund, 11% in the SWIB Variable Fund, and 7% in portfolios managed by BMO. For SWIB, the duration of each U.S. Fixed Income portfolio shall remain within 15% of the assigned benchmark’s duration. For the bond portfolio for the payment of benefits and expenses, the duration will be within a range of 50% to 150% of the duration of the benchmark index.

MILWAUKEE PUBLIC SCHOOLS
Notes to Basic Financial Statements
For the Year Ended June 30, 2016
38
B. Credit Risk
Credit risk is the risk that an issuer or other counterparty to an investment will not fulfill its obligations. The following schedule displays the credit quality percentage distributions of the fixed income investments in the SWIB Core and Variable Funds on December 31, 2015 and in the separate accounts managed by BMO on June 30, 2016. For SWIB, the schedule displays the lowest credit rating assigned by several nationally recognized statistical rating organizations.
SWIB’s Core Fund’s Government/Credit Portfolio shall maintain an average quality rating of A or better. Non-Investment Grade securities shall not exceed 15% of the portfolio’s market value. For SWIB’s Global Bond Portfolio, overall portfolio quality must be maintained at an average rating of A or better. Corporate securities may not exceed 20% of the portfolio’s market value. Emerging market sovereign debt is limited to debt of countries in the J.P. Morgan Emerging Market Global Diversified Bond Index and Emerging market corporate debt is limited to issuers in the Barclays US Investment Grade Credit Index. Emerging market debt shall not exceed 10% of the portfolio’s market value. Securities rated “BB+” or lower but no lower than “CCC-/Caa3” may not exceed 5% of the portfolio’s market value.
Ratings* SWIB BMO
12/31/2015 6/30/2016P-1 or A-1 0% N/AP-2 or A-2 1% N/AUST and AGY N/A** N/AAAA/Aaa 2% 35%AA/Aa 41% N/AA 8% N/ABBB/Baa 9% N/ABB/Ba 2% N/AB 2% N/ACCC/Caa 1% N/ACC/Ca 0% N/AC 0% N/AD 0% N/ACommingled Trusts & Mutual Funds*** 29% 65%Not-Rated 5% 0%*As defined by Moody's Bond Ratings or Standard and Poor's**As of December 31, 2013 SWIB's holdings of UST and AGY are included in the "AA" category.***The weighted average quality of the commingled funds in the SWIB portfolio was AA. The weighted average of the mutual funds in BMO portfolio was A (excluding BMO's money market fund which was rated AAA).

MILWAUKEE PUBLIC SCHOOLS
Notes to Basic Financial Statements
For the Year Ended June 30, 2016
39
C. Custodial Credit Risk
The Plan does not have a deposit or investment policy specifically related to custodial credit risk. The Plan’s assets are restricted to investments in the SWIB Core and Variable Funds and in portfolios at BMO.
Deposits - Custodial credit risk for deposits is the risk that, in the event of the failure of a depository financial institution, the fund will not be able to recover deposits that are in the possession of an outside party. SWIB had uninsured and uncollateralized deposits totaling $431.3 million on December 31, 2015. In addition, SWIB held certificate of deposit which were covered by depository insurance with a fair value of $39.2 on December 31, 2015, all of which were uncollateralized and uninsured. In total, these deposits represented 0.50% of the combined assets of the SWIB Core and Variable Funds, on December 31, 2015. Investments - Custodial credit risk for investments is the risk that, in the event of the failure of counterparty to a transaction, the fund will not be able to recover the value of investments that are in the possession of an outside party. The repurchase agreements held by the fund were 9 agreements totaling $804.9 million as of December 31, 2015. All of these repurchase agreements were tri-party agreements held in short–term cash management portfolios managed by SWIB’s custodian. The underlying securities for these repurchase agreements were held by the tri-party’s agent, not in SWIB’s name. These agreements represented 0.9% of the combined assets of the SWIB Core and Variable Funds on December 31, 2015.
D. Concentration of Credit Risk Concentration of credit risk is the risk of loss attributed to the magnitude of a fund’s investment in a single issuer. SWIB limits concentrations of credit risk by establishing investment guidelines for individual portfolios or groups of portfolios (excluding U.S. Government and Agency Securities) that generally restrict issuer concentrations in any one company to less than 5% and under Rule 144A to less than 20% of the portfolio’s market value. For the other separately managed portfolios, the policy guidelines specify that individual securities (excluding U.S. Government and Agency securities) in a separate portfolio should not exceed 7% of the value of that portfolio. None of the securities in these portfolios represented more than 5% of the market value of the Fund. E. Foreign Currency Risk Foreign currency risk is the risk that changes in exchange rates will adversely affect the fair value of an investment or deposit. As of December 31, 2015, $22.6 billion of the SWIB Funds’ $86.8 billion in currency exposure was denominated in foreign currency. For the BMO managed portfolios, there was no foreign currency exposure. The risk definitions noted above are from the Governmental Accounting Standards Board. The data, risk descriptions, and guidelines for the SWIB Funds were provided by SWIB and the data and risk information for the other investment types were provided by BMO.

MILWAUKEE PUBLIC SCHOOLS
Notes to Basic Financial Statements
For the Year Ended June 30, 2016
40
F. Derivative Investments
The Plan holds investments in SWIB Funds, which may enter into a variety of financial contracts, including futures and options, primarily to enhance performance, reduce volatility of the portfolio, and aid in cash flow management. SWIB also enters into foreign exchange positions, such as forward and spot contracts, to obtain or hedge foreign currency exposure. The financial contracts are included in SWIB Variable and Core Investments on the Statement of Net Investment Position. At June 30, 2016, the Plan’s interest in the plan net position of the Core Trust was approximately 0.043% and the Plan’s interest in the plan net position of the Variable Trust was approximately 0.077%. The SWIB Funds are exposed to credit risk in the event of non-performance by counterparties to financial instruments. Exposure to market risk, the risk that future changes in market conditions may make an instrument less valuable, is managed in accordance with risk limits through buying or selling instruments or entering into offsetting positions.
A financial futures contract is an exchange traded agreement to buy or sell a financial instrument at an agreed upon price and time in the future. Futures contracts are marked to market daily, based upon the closing market price of the contract at the board of trade or exchange on which they are traded. The resulting gain or loss is typically received or paid the following day until the contract expires. Futures contracts involve, to varying degrees, risk of loss in excess of the variation margin. Losses may arise from future changes in the value of the underlying instrument. Substantially all future contracts have a maturity date of less than one year. Option contracts give the purchaser of the contract the right to buy (call) or sell (put) the security or index underlying the contract at an agreed upon price on or before the expiration of the option contract. The fair value of option contracts is based upon the closing market price of the contract. The seller of the contract is subject to market risk, while the purchaser is subject to credit risk and market risk to the extent of the premium paid to enter into the contract.
Foreign exchange contracts involve an agreement to exchange the currency of one country for the currency of another country at an agreed-upon price and settlement date. Spot and forward contracts entered into by SWIB are over-the-counter contracts, entered into with various counterparties. These contracts are valued daily, and guidelines have been established which provide minimum credit ratings for counterparties. Losses may arise from future changes in value of the underlying currency, or if the counterparties do not perform under the terms of the contract.

MILWAUKEE PUBLIC SCHOOLS
Notes to Basic Financial Statements
For the Year Ended June 30, 2016
41
The following table summarizes the aggregate notional or contractual amounts for SWIB’s derivative financial instruments at December 31, 2015 (in thousands):
12/31/2015
Future contracts $ 10,893,341
Foreign exchange forward and spot contracts – sold 2,264,028
Foreign exchange forward and spot contracts – purchased (2,260,754)
OTC Derivative Investments subject to
Counterparty Credit Risk-Receivable (Fair Value)
2,773,146
OTC Derivative Investments subject to
Counterparty Credit Risk-Payable (Fair Value)
(2,760,197)
Options – puts (338,835)
Options - calls (42,911)
Fair Value Measurements. The Milwaukee Public School categorizes its fair value measurements within the fair value hierarchy established by generally accepted accounting principles. The hierarchy is based on the valuation inputs used to measure the fair value of the asset. Level 1 inputs are quoted prices in active markets for identical assets; Level 2 inputs are significant other observable inputs; Level 3 inputs are significant unobservable inputs.
The valuation methods for recurring fair value measurements are as follows:
Inputs other than quoted prices that are observable for securities, either directly or indirectly.
The following is a description of the valuation methodologies used for assets measured at fair value. There were no changes to the methodologies during the year ended June 30, 2016.
Money market accounts: Valued at the quoted net asset value (NAV) of shares held by the Plan at year end.
Mutual funds: Mutual funds are valued at the daily closing price as reported by the fund. Mutual funds held the Plan are open-end mutual funds that are registered with the U.S. Securities and Exchange Commission. These funds are required to publish their daily NAV and to transact at that price. The mutual funds held by the Plan are deemed to be actively traded.

MILWAUKEE PUBLIC SCHOOLS
Notes to Basic Financial Statements
For the Year Ended June 30, 2016
42
Investment Type Level 1 Level 2 Level 3 TotalMoney market accounts -$ 1,388,538$ -$ 1,388,538$ Mortgage-back securities - 69 - 69 Mutual Funds: Short-Term Investment Grade Bond Funds 661,236 - - 661,236 Intermediate-Term Investment Grade Bond Fund 1,871,865 - - 1,871,865
2,533,101$ 1,388,607 - 3,921,708$
Short-Term Investment Grade Bond Funds include funds with a duration of less thanthree years and Intermediate-Term Investment Grade Bond Funds include fund with aduration greater than three years.
June 30, 2016
Milwaukee Board of School Directors Supplemental Early Retirement Plan for Teachers
The Trustees of the Plan have adopted a Statement of Investment Policy (the “Policy”). It articulates asset allocation targets; guidelines for interest rate risk, credit risk, and concentration of credit risk for separately managed portfolios; and performance benchmarks. Under Wisconsin statutes, equities, other than investments in the State of Wisconsin Employee Trust Funds (“SWIB funds”), are subject to the statutory limitation that they may not exceed 50% of the market value of the plan assets. The Plan has no equity investments other than those in the SWIB funds. The Policy targets equities in the SWIB Variable Fund to equal 150% of the amount in Fixed Income securities at BMO, with the remainder of the portfolio allocated to the SWIB Core Fund. The Policy target for Fixed Income is the sum of six months benefit payments plus six months administrative expense. The portfolio is rebalanced toward the Policy targets quarterly. On June 30, 2016, the SWIB Core Fund strategic targets were 25% to U.S. Stocks, 39% to Fixed Income, 23% to International Stocks, 7% to Real Estate, and 10% to Alternative Investments. The strategic target allocations total 107%, reflecting the possibility of introducing leverage into the portfolio. On June 30, 2016, the SWIB Variable Fund strategic targets were 70% to U.S. Stocks, 30% to International Stocks, and 0% to Alternative Investments. Under the SWIB Investment Policy, the Core and Variable Fund asset allocations will be reviewed monthly for potential rebalancing. For the SWIB funds, when a major liquid asset class (i.e., Total Public Equities, Total Public Fixed Income) exceeds plus or minus 4% of its target allocation, a rebalancing exercise will be initiated. The Plan’s investment portfolio (the Fund) has two investment managers: the State of Wisconsin Investment Board (SWIB) and BMO. Each investment manager is responsible for managing the portion of the Fund assets under its control in accordance with its policy and guidelines. BMO is also responsible for managing its Plan portfolios in accordance with the guidelines adopted by the Trustees. Milwaukee Public Schools completes a comprehensive review of the Fund relative to the Policy on an annual basis.
A. Interest Rate Risk
Interest rate risk is the risk that changes in interest rates will adversely affect the fair value of an investment. Milwaukee Public Schools uses both duration and weighted average maturity as methods of monitoring interest rate risk. SWIB data is expressed in terms of modified duration and option adjusted duration. Modified duration, which is stated in years, is the

MILWAUKEE PUBLIC SCHOOLS
Notes to Basic Financial Statements
For the Year Ended June 30, 2016
43
measure of price sensitivity of a fixed income security to an interest rate change of 100 basis points. The calculation is based on the weighted average of the present value of all cash flows. Some pooled investments are analyzed using an option adjusted duration calculation which is similar to the modified duration method. Option adjusted duration incorporates the duration shortening effect of any embedded call provisions in securities.
The following schedule summarizes the duration and fair value of the investments at BMO as of June 30, 2016 and at the fair value at SWIB as of June 30, 2016. Investment Duration (Years) Fair Value
SWIB Core and Details on the SWIB fixed income investments 132,534,384$ Variable Funds are as of 12-31-15 are included below.
Money market accounts (at BMO) 0.1 3,203,177$
Mutual Funds (at BMO) 3.7 7,178,047$
SWIB information provided within the accompanying financial statement is as of December 31, 2015. There has been no significant change in SWIB’s Investment strategies, asset allocations and Investment pricing methods from December 31, 2015 to June 30, 2016. Based on the SWIB information, the District feels the information presented for SWIB Investments as of December 31, 2015 is a fair representation for June 30, 2016.
The following schedule displays the duration or weighted average maturity of the investments by type of investment at SWIB as of December 31, 2015.
SWIB Investments Duration (Years) Fair Value
Asset Backed Securities 1.8 $ 47 Million Commercial Paper <1 $ 323 Million Corporate Bonds and Private Placements 5.7 $ 4,788 Million Foreign Gov't/Agency Bonds $ 3,524 Million Municipal Bonds 9.7 $ 119 Million Repurchase Agreements 1 day $ 805 Million US Government Agencies 3.8 $ 284 Million U.S. TIPS 7.7 $ 6,704 Million U.S. Treasury Securities 5.0 $ 4,154 Million Commingled Funds 0.2 to 6.3 $ 8,489 Million
Note: On June 30, 2016, SWIB’s Core Fund and Variable Fund had $87.6 billion and $6.7 billion in assets, respectively. As of June 30, 2016, the Plan’s assets were invested 83% in the SWIB Core Fund, 11% in the SWIB Variable Fund, and 6% in portfolios managed by BMO. For SWIB, the duration of each U.S. Fixed Income portfolio shall remain within 15% of the assigned benchmark’s duration. For the bond portfolio for the payment of benefits and expenses, the duration will be within a range of 50% to 150% of the duration of the benchmark index.

MILWAUKEE PUBLIC SCHOOLS
Notes to Basic Financial Statements
For the Year Ended June 30, 2016
44
B. Credit Risk
Credit risk is the risk that an issuer or other counterparty to an investment will not fulfill its obligations. The following schedule displays the credit quality percentage distributions of the fixed income investments in the SWIB Core and Variable Funds as of December 31, 2015 and in the separate accounts managed by BMO on June 30, 2016. For SWIB, the schedule displays the lowest credit rating assigned by several nationally recognized statistical rating organizations.
SWIB’s Core Fund’s Government/Credit Portfolio shall maintain an average quality rating of A or better. Non-Investment Grade securities shall not exceed 15% of the portfolio’s market value. For SWIB’s Global Bond Portfolio, overall portfolio quality must be maintained at an average rating of A or better. Corporate securities may not exceed 20% of the portfolio’s market value. Emerging market sovereign debt is limited to debt of countries in the J.P. Morgan Emerging Market Global Diversified Bond Index and Emerging market corporate debt is limited to issuers in the Barclays US Investment Grade Credit Index. Emerging market debt shall not exceed 10% of the portfolio’s market value. Securities rated “BB+” or lower but no lower than “CCC-/Caa3” may not exceed 5% of the portfolio’s market value.
Ratings* SWIB BMO
12/31/2015 6/30/2016P-1 or A-1 0% N/AP-2 or A-2 1% N/AUST and AGY N/A** N/AAAA/Aaa 2% 31%AA/Aa 41% N/AA 8% N/ABBB/Baa 9% N/ABB/Ba 2% N/AB 2% N/ACCC/Caa 1% N/ACC/Ca N/A N/AC N/A N/AD N/A N/ACommingled Funds& Mutual Funds*** 29% 69%Not-Rated 5% 0%*As defined by Moody's Bond Ratings or Standard and Poor's**As of December 31, 2013 SWIB's holdings of UST and AGY are included in the "AA" category***The weighted average quality of the commingled funds in the SWIB portfolio was AA. The weighted average quality of the mutual funds in the BMO portfolio was A (excluding BMO's money market fund which was rated AAA).

MILWAUKEE PUBLIC SCHOOLS
Notes to Basic Financial Statements
For the Year Ended June 30, 2016
45
C. Custodial Credit Risk
The Plan does not have a deposit or investment policy specifically related to custodial credit risk. The Plan’s assets are restricted to investments in the SWIB Core and Variable Funds and in portfolios at BMO.
Deposits - Custodial credit risk for deposits is the risk that, in the event of the failure of a depository financial institution, the fund will not be able to recover deposits that are in the possession of an outside party. SWIB had uninsured and uncollateralized deposits totaling $431.3 million on December 31, 2015. In addition, SWIB held certificate of deposit which were covered by depository insurance with a fair value of $39.2 million on December 31, 2015 all of which were uncollateralized and uninsured. In total, these deposits represented 0.50% of the combined assets of the SWIB Core and Variable Funds on December 31, 2015. Investments - Custodial credit risk for investments is the risk that, in the event of the failure of a counter party to a transaction, SWIB will not be able to recover the value of investments that are in the possession of an outside party. The repurchase agreements held by the fund were 9 agreements totaling $804.9 million as of December 31, 2015. All of these repurchase agreements were tri-party agreements held in short-term cash management portfolios managed by SWIB’s custodian. The underlying securities for these repurchase agreements were held by the tri-party’s agent, not in SWIB’s name. These agreements represented 0.9% of the combined assets of the SWIB Core and Variable Funds on December 31, 2015.
D. Concentration of Credit Risk
Concentration of credit risk is the risk of loss attributed to the magnitude of a fund’s investment in a single issuer. SWIB limits concentrations of credit risk by establishing investment guidelines for individual portfolios or groups of portfolios (excluding U.S. Government and Agency Securities) that generally restrict issuer concentrations in any one company to less than 5% and under Rule 144A to less than 20% of the portfolio’s market value. For the other separately managed portfolios, the policy guidelines specify that individual securities (excluding U.S. Government and Agency securities) in a separate portfolio should not exceed 7% of the value of that portfolio. None of the securities in these portfolios represented more than 5% of the market value of the Fund.
E. Foreign Currency Risk
Foreign currency risk is the risk that changes in exchange rates will adversely affect the fair value of an investment or deposit. As of December 31, 2015, $22.6 billion of the SWIB Core and Variable Funds’ $86.8 billion in currency exposure was denominated in foreign currency. For the BMO managed portfolios, there was no foreign currency exposure. The risk definitions noted above are from the Governmental Accounting Standards Board. The data, risk descriptions, and guidelines for the SWIB Funds were provided by SWIB and the data and risk information for the other investment types were provided by BMO.

MILWAUKEE PUBLIC SCHOOLS
Notes to Basic Financial Statements
For the Year Ended June 30, 2016
46
F. Derivative Investments
The Plan holds investments in SWIB Funds, which may enter into a variety of financial contracts, including futures and options, primarily to enhance performance, reduce volatility of the portfolio, and aid in cash flow management. SWIB also enters into foreign exchange positions, such as forward and spot contracts, to obtain or hedge foreign currency exposure. The financial contracts are included in SWIB Variable and Core Investments on the Statement of Net Investment Position. At June 30, 2016, the Plan’s interest in the plan net position of the Core Trust was approximately 0.134% and the Plan’s interest in the plan net position of the Variable Trust was approximately 0.225%. The SWIB Funds are exposed to credit risk in the event of non-performance by counterparties to financial instruments. Exposure to market risk, the risk that future changes in market conditions may make an instrument less valuable, is managed in accordance with risk limits through buying or selling instruments or entering into offsetting positions.
A financial futures contract is an exchange traded agreement to buy or sell a financial instrument at an agreed upon price and time in the future. Futures contracts are marked to market daily, based upon the closing market price of the contract at the board of trade or exchange on which they are traded. The resulting gain or loss is typically received or paid the following day until the contract expires. Futures contracts involve, to varying degrees, risk of loss in excess of the variation margin. Losses may arise from future changes in the value of the underlying instrument. Substantially all future contracts have a maturity date of less than one year.
Option contracts give the purchaser of the contract the right to buy (call) or sell (put) the security or index underlying the contract at an agreed upon price on or before the expiration of the option contract. The fair value of option contracts is based upon the closing market price of the contract. The seller of the contract is subject to market risk, while the purchaser is subject to credit risk and market risk to the extent of the premium paid to enter into the contract.
Foreign exchange contracts involve an agreement to exchange the currency of one country for the currency of another country at an agreed-upon price and settlement date. Spot and forward contracts entered into by SWIB are over-the-counter contracts, entered into with various counterparties. These contracts are valued daily, and guidelines have been established which provide minimum credit ratings for counterparties. Losses may arise from future changes in value of the underlying currency, or if the counterparties do not perform under the terms of the contract.

MILWAUKEE PUBLIC SCHOOLS
Notes to Basic Financial Statements
For the Year Ended June 30, 2016
47
The following table summarizes the aggregate notional or contractual amounts for SWIB’s derivative financial instruments at December 31, 2015 (in thousands):
12/31/2015
Future contracts $ 10,893,341
Foreign exchange forward and spot contracts – sold 2,264,028
Foreign exchange forward and spot contracts – purchased (2,260,754)
OTC Derivative Investment subject to Counterparty Credit Risk-Receivable (Fair Value)
2,773,146
OTC Derivative Investments subject to Counterparty Credit Risk-Payable (Fair Value)
(2,760,197)
Options – puts (338,835)
Options - calls (42,911)
Fair Value Measurements. The Milwaukee Public School categorizes its fair value measurements within the fair value hierarchy established by generally accepted accounting principles. The hierarchy is based on the valuation inputs used to measure the fair value of the asset. Level 1 inputs are quoted prices in active markets for identical assets; Level 2 inputs are significant other observable inputs; Level 3 inputs are significant unobservable inputs.
The valuation methods for recurring fair value measurements are as follows:
Inputs other than quoted prices that are observable for securities, either directly or indirectly.
The following is a description of the valuation methodologies used for assets measured at fair value. There were no changes to the methodologies during the year ended June 30, 2016.
Money market accounts: Valued at the quoted net asset value (NAV) of shares held by the Plan at year end.
Mutual funds: Mutual funds are valued at the daily closing price as reported by the fund. Mutual funds held by the Plan are open-end mutual funds that are registered with the U.S. Securities and Exchange Commission. These funds are required to publish their daily NAV and to transact at that price. The mutual funds held by the Plan are deemed to be actively traded.

MILWAUKEE PUBLIC SCHOOLS
Notes to Basic Financial Statements
For the Year Ended June 30, 2016
48
Investment Type Level 1 Level 2 Level 3 TotalMoney market accounts -$ 3,203,177$ -$ 3,203,177$ Mutual Funds: Short-Term Investment Grade Bond Funds 1,878,718 - - 1,878,718 Intermediate-Term Investment Grade Bond Fund 5,299,329 - - 5,299,329
7,178,047$ 3,203,177 - 10,381,224$
Short-Term Investment Grade Bond Funds include funds with a duration of less thanthree years and Intermediate-Term Investment Grade Bond Funds include fund with aduration greater than three years.
June 30, 2016
(3) Receivables
Receivables as of June 30, 2016 for the District’s individual major funds and nonmajor funds in the aggregate, including applicable allowances for uncollectible accounts, are as follows:
SchoolNutrition
General Construction Services NonmajorFund Fund Fund Fund Total
Receivables:Accounts $ 7,646,055 2,405,927 — — 10,051,982 Intergovernmental-federal 37,701,510 — 7,326,315 3,591,198 48,619,023 Intergovernmental-state 29,737,111 — — — 29,737,111 Intergovernmental-other — — — — —
Gross receivables 75,084,676 2,405,927 7,326,315 3,591,198 88,408,116
Less allowance for uncollectibles (894,150) — — — (894,150)
Total receivables, net $ 74,190,526 2,405,927 7,326,315 3,591,198 87,513,966
The District expects to collect all receivables within one year except for $923,445.
Accounts Receivable includes $2.4 million from a Land Contract property sale. On February 1, 2013, the City of Milwaukee (for the benefit of MPS) entered into a Land Contract to sell the property located at 4601 N. 84th Street to Hmong American Peace Academy, Ltd. (HAPA), an MPS-Non-Instrumentality Charter School.

MILWAUKEE PUBLIC SCHOOLS
Notes to Basic Financial Statements
For the Year Ended June 30, 2016
49
The purchase price of the property is $2,770,000, with $11,000 paid at the execution of the contract. The balance of $2,759,000, with an interest rate of 3% per annum, is being paid in monthly installments of $15,301.35 which began March 1, 2013 and continues until maturity on February 28, 2033. Title to the property is not transferred until the purchase price with interest is fully paid and all conditions fully performed.
Remaining payments due as of June 30, 2016 are as follows:
Principal Interest Total
Fiscal years:
2017 $ 112,983 70,633 183,616
2018 116,420 67,196 183,616
2019 119,961 63,655 183,616
2020 123,610 60,006 183,616
2021 127,369 56,247 183,616
2022 - 2026 697,369 220,712 918,081
2027 - 2031 810,076 108,005 918,081
2032 - 2033 298,139 7,888 306,027
Totals $ 2,405,927 654,342 3,060,269
(4) Interfund Transactions
Interfund borrowings are reflected as “due from/to other funds” on the accompanying financial statements.
The following balances as of June 30, 2016 represent due to/from balances among all funds:
School NutritionGeneral Construction Services
Fund Fund Fund TotalDue to other funds:
General Fund $ — 1,076,535 — 1,076,535 Nutrition fund — 485,891 — 485,891 Nonmajor funds — 3,548,704 — 3,548,704
Total $ — 5,111,130 — 5,111,130
Due from other funds

MILWAUKEE PUBLIC SCHOOLS
Notes to Basic Financial Statements
For the Year Ended June 30, 2016
50
Balances resulted from the timing difference between the dates that interfund goods and services are provided or reimbursable expenditures occur.
The following balances as of June 30, 2016 represent transfer in/out balances among all funds:
Fund Transferred To Fund Transferred From Amount ReasonDebt Service Fund General Fund $25,245,686 To fund current year debt service

MILWAUKEE PUBLIC SCHOOLS
Notes to Basic Financial Statements
For the Year Ended June 30, 2016
51
(5) Capital Assets
Capital assets activity for the year ended June 30, 2016 was as follows:
Balance BalanceJuly 1, 2015 Increases Decreases June 30, 2016
Governmental activities:Capital assets, not being
depreciated:Land $ 31,105,876 — — 31,105,876 Construction in
progress 14,292,671 34,077,589 15,218,068 33,152,192
Total capital assets,not beingdepreciated 45,398,547 34,077,589 15,218,068 64,258,068
Capital assets, beingdepreciated:
Buildings 1,050,173,559 15,218,068 — 1,065,391,627 Leasehold improvements 12,219,204 — — 12,219,204 Furniture and
equipment 51,893,382 1,144,083 694,877 52,342,588
Total capitalassets, beingdepreciated 1,114,286,145 16,362,151 694,877 1,129,953,419
Less accumulated depreciation for:
Buildings (486,579,826) (21,282,240) — (507,862,066) Leasehold improvements (4,816,952) (540,942) — (5,357,894) Furniture and
equipment (47,764,082) (1,435,226) (683,181) (48,516,127)
Total accumulateddepreciation (539,160,860) (23,258,408) (683,181) (561,736,087)
Total capitalassets, beingdepreciated 575,125,285 (6,896,257) 11,696 568,217,332
Capital assets, net $ 620,523,832 27,181,332 15,229,764 632,475,400

MILWAUKEE PUBLIC SCHOOLS
Notes to Basic Financial Statements
For the Year Ended June 30, 2016
52
Depreciation expense for governmental activities for the year ended June 30, 2016 was charged to functions/programs as follows:
Governmental activities:Instruction $ 13,769,847 Community services 539,419 Pupil and staff services 2,504,655 General, administration and central services 2,192,687 Business services 3,281,715 School nutrition 970,085
Total depreciation $ 23,258,408

MILWAUKEE PUBLIC SCHOOLS
Notes to Basic Financial Statements
For the Year Ended June 30, 2016
53
(5A) Intangible Assets
Intangible assets activity for the year ended June 30, 2016 was as follows:
Balance BalanceJuly 1, 2015 Increases Decreases June 30, 2016
Governmental activities:Intangible assets, not being
amortized:Work in
progress $ 1,039,601 3,594,729 3,017,021 1,617,309
Total intangible assets,not beingamortized 1,039,601 3,594,729 3,017,021 1,617,309
Intangible assets, beingamortized:
Software $ 56,435,276 3,017,021 — 59,452,297
Total intangibleassets, beingamortized 56,435,276 3,017,021 — 59,452,297
Less accumulated amortization for:
Software (41,321,825) (3,935,969) — (45,257,794)
Total accumulatedamortized (41,321,825) (3,935,969) — (45,257,794)
Total intangible assets beingamortized 15,113,451 (918,948) — 14,194,503
Intangible assets, net $ 16,153,052 2,675,781 3,017,021 15,811,812
.

MILWAUKEE PUBLIC SCHOOLS
Notes to Basic Financial Statements
For the Year Ended June 30, 2016
54
Amortization expense for governmental activities for the year ended June 30, 2016 was charged to functions/programs as follows:
(6) Short-term Borrowings
To finance on an interim basis MPS’ general operating expenses pending receipt of state school aid payments, the City of Milwaukee issued $45,000,000 of commercial paper on September 24, 2015, $25,000,000 of commercial paper on October 1, 2015, and $180,000,000 of Revenue Anticipation Notes (RANs), Series 2015 M7, was issued on October 22, 2015. The commercial paper matured as follows: $45,000,000 on October 22, 2015 and $25,000,000 on December 3, 2015. The RANs matured as follows: $50,000,000 on December 30, 2015 and $130,000,000 on June 30, 2016. Interest was payable at maturity. The debt was repaid from the District’s equalization aid allocations received from the state government prior to June 30, 2016.
(7) Long-term Obligations
The City school bonds, notes and capital lease obligations outstanding at June 30, 2016 totaled $376,470,900. Of this total, $17,128,786 represents school bonds and notes that will be repaid by the City using the City’s property tax levy. As the District does not have an obligation to repay these bonds and notes from its own property tax levy, the debt is not reflected in the District’s long-term obligations. The remaining balance of $359,342,114 represents bonds and promissory notes, the debt service of which is being reimbursed by the District to the City from the District’s property tax levy. Since the District does have an obligation to repay this debt under intergovernmental cooperation agreements with the City, this debt is reflected in the District’s long-term obligations. Additionally, for the year ended June 30, 2016, the District deposited $4,836,538 of principal payments into a Bond Sinking Fund to make Qualified School Construction Bond principal payments at maturity. Sinking fund principal payments on deposit as of June 30, 2016 total $11,561,538.
Governmental activities:Instruction $ 2,330,241 Community services 91,285 Pupil and staff services 423,857 General, administration and central services 371,064 Business services 555,357 School nutrition 164,165
Total amortization $ 3,935,969

MILWAUKEE PUBLIC SCHOOLS
Notes to Basic Financial Statements
For the Year Ended June 30, 2016
55
Long-term obligations of the District are as follows:
Life to DateOriginal Balance Balance Sinking Fund Amount dueamount July 1, 2015 Additions Reductions June 30, 2016 Contribution in one year
Intergovernmental cooperation agreements withthe City of Milwaukee:
American with Disabilities Act loans:2002A Refund (Trust Loans & C5, O,
R & T) $ 5,395,000 545,804 — 339,550 206,254 — 206,254 4.0 – 5.0%, due in annual installments
to September 2015 4,582,676 149,625 — 149,625 — — — 2.5 – 3.0%, due in annual installments
to February 2019 2,700,000 1,080,000 — 270,000 810,000 — 270,000 5.0%, due in installments
to February 2024 1,350,000 1,350,000 — — 1,350,000 — — 5.25%, due August 15th, 2014
to February 2019 443,810 355,906 — 110,952 244,954 — 110,954 General Obligation Bonds: —
5.0%, due in installments to May 2021 4,095,000 3,580,000 — 535,000 3,045,000 — 555,000 Plus: Premium on issuance 787,801 525,202 — 87,533 437,669 —
4.0%, due in installments to March 2025 3,175,000 3,175,000 — — 3,175,000 — — Plus: Premium on Issuance 387,059 341,734 — 45,325 296,409 —
2.0 -4.0%, due in installments to to March 2020 3,732,791 3,732,791 — 766,711 2,966,080 — 820,648
Qualified School Construction Bonds:1.18%, due in December 2025 12,000,000 12,000,000 — — 12,000,000 2,750,000 925,000
Less: Discount on issuance (450,000) (281,250) — (28,125) (253,125) — 5.25%, due August 15th, 2014
to February 2027 37,300,000 37,300,000 — — 37,300,000 7,350,000 2,450,000 Neighborhood Schools Initiative Bonds
(NSI), 3.5% – 4.875%, due in annualinstallments to August 2023 143,905,000 71,265,000 — 5,550,000 65,715,000 — 6,010,000
Plus: Premium on issuance 1,357,121 80,939 — 31,231 49,708 — — Less: Discount on 2007A issuance (338,503) (146,131) — (21,360) (124,771) — — Plus: Premium on 2013A issuance — 4,971,591 — 552,767 4,418,824 — —
QZAB—Qualified Zone Academy Bonds, 0%, due in annual installments toAugust 2019 19,318,100 1,418,388 — 505,293 913,095 — 310,665
Pension debt refinancing:Capital appreciation note, due in
annual installments beginning April 1, 2005 through April 1, 2023 46,715,000 32,535,000 — 2,510,000 30,025,000 — 3,570,000
Less: Discount (25,232,986) (7,993,788) — (1,510,049) (6,483,739) — — Capital appreciation bonds, due in
annual installments beginning April 1, 2026 through April 1, 2041 110,525,000 110,525,000 — — 110,525,000 — —
Less: Discount (94,805,878) (78,210,090) — (2,085,846) (76,124,244) — — Pension bonds, variable interest rate
“index-linked”, interest due in semi-annual installment, principal dueat maturity on October 1, 2043 130,850,000 130,850,000 — — 130,850,000 — —
Capital lease-RACM QSCB2015 38,000,000 38,000,000 — — 38,000,000 1,461,538 1,461,538
Total intergovernmental cooperationagreement debt $ 367,150,721 — 7,808,607 359,342,114 11,561,538 16,690,059

MILWAUKEE PUBLIC SCHOOLS
Notes to Basic Financial Statements
For the Year Ended June 30, 2016
56
Life to DateBalance at Balance at Sinking Fund Amount due
July 1, 2015 Additions Reductions June 30, 2016 Contribution in one year
Intergovernmental cooperation agreements withthe City of Milwaukee (from previous page) $ 367,150,721 — 7,808,607 359,342,114 11,561,538 16,690,059
Accrued compensated absences 8,819,410 7,034,343 7,144,402 8,709,351 — 7,000,000 Accrued OPEB Obligation 506,962,986 62,287,640 53,072,439 516,178,187 — — Net Pension Liability 106,238,727 156,612,144 67,124,130 195,726,741 — — Workers’ compensation claims 7,455,925 5,065,210 7,854,228 4,666,907 — 4,600,000 General insurance claims 383,880 247,766 305,974 325,672 — 4,500 Life insurance benefits 2,166,983 — 207,524 1,959,459 — 399,643 Liability for other long-term benefits 285,051 — — 285,051 — —
Total long-term obligations $ 999,463,683 231,247,103 143,517,304 1,087,193,482 11,561,538 28,694,202
Estimated payments of compensated absences, other post employment benefits, and insurance claims are not included in the debt service requirement schedules. The compensated absences, OPEB, and insurance claims liabilities attributable to governmental activities will be liquidated primarily by the general fund.
The District has recognized workers’ compensation claims liability in the governmental funds of approximately $3,985,628 as of June 30, 2016. Accordingly, the total liability for workers’ compensation claims was approximately $8.7 million.
Aggregate scheduled debt service requirements for the retirement of the intergovernmental cooperation agreement debt (excluding capital lease obligations) as of June 30, 2016 are as follows:
Principal Interest Total
Fiscal year ended June 30:
2017 $ 15,228,521 12,722,142 27,950,663 2018 14,956,579 12,364,332 27,320,911 2019 16,540,099 11,949,349 28,489,448 2020 17,405,445 11,502,439 28,907,884 2021 16,962,520 11,056,238 28,018,758 2022 – 2026 82,467,222 48,255,089 130,722,311 2027 – 2031 54,230,001 29,582,825 83,812,826 2032 – 2036 71,390,000 18,858,950 90,248,950 2037 – 2041 81,320,001 10,123,713 91,443,714 2042 – 2044 18,525,000 1,729,283 20,254,283
Total $ 389,025,388 168,144,360 557,169,748
Interest on the $130,850,000 variable rate pension debt (index-linked bonds), included in the schedule of future payments above, is based upon the one-month LIBOR rate (the London Interbank Offered Rate) plus 25 basis points (.25%) and is adjusted monthly. The LIBOR interest rate was 0.46505% as of June 30, 2016.

MILWAUKEE PUBLIC SCHOOLS
Notes to Basic Financial Statements
For the Year Ended June 30, 2016
57
The District leases, land and buildings with a historical cost and accumulated depreciation of $4,656,365 and $177,792, respectively. The District is also holding approximately $18 million of restricted cash and investments under capital lease arrangements.
Future maximum lease payments under these capital leases at June 30, 2016 are as follows:
Fiscal year ended June 30:2017 $ 3,423,478 2018 3,423,478 2019 3,423,478 2020 3,423,478 2021 3,423,478 2022 – 2026 17,117,392 2027 – 2031 17,117,393 2032 – 2034 17,117,393 2035 – 2041 17,117,393
Total remaining maximum lease payments 85,586,961
Less amount representing interest 49,048,500
Present value of maximum lease payments $ 36,538,461
The maximum allowable amount of City debt (including school debt) outstanding at any time shall not be greater than 5% of the total equalized taxable property in the City (Wisconsin State Statute Chapter 67.03). Wisconsin State Statute Chapter 119.49 further authorizes referendum-approved bonding in an additional amount equivalent to 2% of the equalized taxable property for school capital purposes. The total equalized taxable property in the City for calendar year 2016 was $25,980,469,600 and the 5% debt limit was $1,299,023,480. No referendum-approved debt is outstanding at June 30, 2016.
The District has pledged future Intradistrict Aid revenues to repay $109,545,000 million in Neighborhood School Initiative Bonds due between the fiscal years ending June 30, 2004 and June 30, 2024. The bonds are payable solely from pledged revenues and are payable through August 1, 2023. Annual principal and interest payments on the bonds are expected to require 33.6% of net revenues at the point of the highest debt service payment, due August 1, 2023. The total principal and interest remaining to be paid on the bonds as of June 30, 2016 is $78,190,953. Principal and interest paid for the year ended June 30, 2016 was $8,554,385 while the Intradistrict Aid revenues were $29,913,303.

MILWAUKEE PUBLIC SCHOOLS
Notes to Basic Financial Statements
For the Year Ended June 30, 2016
58
Revenue debt payable at June 30, 2016 consists of the following:
Neighborhood Schools Initiative Bonds
Amounts Outstanding
Principal Interest Total
Fiscal year ended:
2017 $ 6,010,000 2,773,185 8,783,185
2018 6,530,000 2,489,735 9,019,735
2019 7,120,000 2,148,485 9,268,485
2020 7,740,000 1,776,985 9,516,985
2021 8,390,000 1,404,153 9,794,153
2022 9,030,000 1,030,310 10,060,310
2023 10,015,000 635,500 10,650,500
2024 10,880,000 217,600 11,097,600
$ 65,715,000 12,475,953 78,190,953

MILWAUKEE PUBLIC SCHOOLS
Notes to Basic Financial Statements
For the Year Ended June 30, 2016
59
Derivative Instruments - Interest Rate Swap Agreements
In December 2003, the District entered into contracts to hedge its exposure to fluctuating interest rates associated with the variable rate bonds that it issued to fund an unfunded actuarial accrued liability for pensions. These contracts are evaluated pursuant to GASB Statement No. 53, Accounting and Financial reporting for Derivative Instruments, to determine whether they effectively hedge the expected cash flows associated with interest rate exposures.
The District applies hedge accounting for derivatives that are deemed effective hedges. Under hedge accounting, the increase (decrease) in the fair value of a hedge is reported as a deferred cash flow hedge on the statement of net position. For the reporting period, all of the District’s derivatives meet the effectiveness test.
The following is a summary of the fair values and notional amounts of derivative instruments outstanding as of June 30, 2016 and the changes in fair value of such derivative instruments for the year then ended as reported in the 2016 financial statements are as follows (amounts in thousands; gains shown as positive amounts, losses as negative):
2016 Change in Fair Value Fair Value, End of 2016
Classification Amount Classification Amount Notional
Amount
Governmental activities
Interest Rate Derivatives:
Pay-fixed interest rate swaps
Deferred outflow ($24,153) Derivative ($73,891) $130,850

MILWAUKEE PUBLIC SCHOOLS
Notes to Basic Financial Statements
For the Year Ended June 30, 2016
60
Objective and Terms of Hedging Derivative Instruments
The following table displays the objective and terms of the District’s hedging derivative instruments outstanding at June 30, 2016, along with the credit rating of the associated counterparty (amounts in thousands).
Objective. As a means to lower its borrowing costs when compared against fixed-rate bonds at the time of issuance in December 2003, the District entered into three interest rate swap agreements in connection with the $130,850,000 Taxable Pension Funding Bonds, 2003 Series D (originally variable auction rate securities, converted to index-linked bonds on July 7, 2005). The intention of the swap was to effectively change the variable interest rate on the bonds to a synthetic fixed rate of 5.56%. The conversion to index-linked bonds eliminated liquidity and basis risk, and maintained the swap agreements, but with a fixed rate cost to MPS of 5.61%.
Terms. The bonds and the related swap agreements mature on October 1, 2043 and the swaps’ aggregate notional amount of $130,850,000 matches the $130,850,000 par amount of the variable-rate bonds. The swaps were entered into at the same time the bonds were issued in December 2003, and continue to remain in effect after the conversion to index-linked bonds on July 7, 2005. Starting in fiscal year 2024, the notional value of the swap and the principal amount of the bonds decline until the debt is completely retired. Under the swap agreements, the District pays the counterparty a fixed payment of 5.56% and receives a variable payment computed as the 1-month London
Counterparty
Notional Effective Maturity Fair Credit
Item Type Objective Amount Date Date Terms Value Rating
A Pay fixed, Hedge of $21,255 09/23/2011 10/1/2043 Receive LIBOR + ($11,995) A/A2/A+
receive variable changes in 20 basis points,
interest rate swap cashflow on pay LIBOR +
the Series 25 basis points.
2003 D bonds
B Pay fixed, Hedge of $49,595 09/23/2011 10/1/2043 Receive LIBOR + ($27,988) AA-
/Aa2/AA
receive variable changes in 20 basis points,
interest rate swap cashflow on pay LIBOR +
the Series 25 basis points.
2003 D bonds
C Pay fixed, Hedge of $60,000 12/23/2003 10/1/2043 Receive LIBOR + ($33,908) BBB+/A3/A
receive variable changes in 20 basis points,
interest rate swap cashflow on pay LIBOR +
the Series 25 basis points.
2003 D bonds
Total Fair Value ($73,891)
MILWAUKEE PUBLIC SCHOOLS
Notes to Basic Financial Statements
For the Year Ended June 30, 2016
61
Interbank Offered rate (LIBOR) plus 20 basis points (.20%). Conversely, the District pays the bond’s index linked coupon rate of LIBOR plus 25 basis points (0.25%).
Fair Value. The fair values of the interest rate swaps were estimated using the zero-coupon method. This method calculates the future net settlement payments required by the swap, assuming that the current forward rates implied by the yield curve correctly anticipate future spot interest rates. These payments are then discounted using the spot rates implied by the current yield curve for hypothetical zero-coupon bonds due on the date of each future net settlement on the swaps.
Risks of Derivative Instruments
Credit risk – Credit risk is the risk of loss due to a counterparty defaulting on its obligations. The District seeks to minimize credit risk by requiring counterparty collateral posting provisions in its hedging derivative instruments. These terms require full collateralization should the counterparties credit ratings fall below certain levels.
As of June 30, 2016 the District was not exposed to credit risk because the swaps had negative fair value. There are three swap counterparties with whom the District has a total of three swap agreements. The credit ratings of the counterparties are provided in the prior table. To mitigate the potential for credit risk, if the credit quality is below Aa3 by Moody’s Investor’s Service, AA- by Standard & Poor’s, and AA- by Fitch Ratings, the fair value of the swap will be fully collateralized by the counterparty. Collateral is posted with the trustee of the bonds.
Interest rate risk – The District is exposed to interest rate risk on its interest rate swap. On its pay-variable, received-fixed interest rate swap, as LIBOR increases, the District’s net payment on the swap increases. Alternatively, on its pay-fixed, receive-variable interest rate swap, as LIBOR or the SIFMA swap index decreases, the District’s net payment on the swap increases.
Basis risk – Basis risk is the risk that arises when a hedged item and a derivative that is attempting to hedge that item are based on different indices. As a result of the District’s conversion to index-linked bonds from auction rate securities, the basis risk exposure to the District from its swap agreements was eliminated.
Termination risk – Termination risk is the risk that a derivative will terminate prior to its scheduled maturity due to a contractual event. Contractual events include bankruptcy, illegality, default and mergers in which the successor entity does not meet credit criteria. The District or the counterparty may terminate a swap if the other party fails to perform under the terms of the contract. The swaps may be terminated by the District at any time. A swap may be terminated by a counterparty if the District’s credit quality rating falls below “BBB-” as issued by Standard & Poor’s or “Baa3” by Moody’s Investors Service. If a swap is terminated, the variable-rate bonds will no longer carry a synthetic interest rate and the District would be subject to interest costs reflective of the variable interest rates. Also, if at the time of termination the swap has a negative fair value, the District would be liable to the counterparty for a payment equal to the swap’s fair value. At June 30, 2016 the swap’s currently have a cumulative negative fair value of $73.89 million.

MILWAUKEE PUBLIC SCHOOLS
Notes to Basic Financial Statements
For the Year Ended June 30, 2016
62
Rollover risk – Rollover risk occurs when the hedging derivative instrument does not extend to the maturity of the hedgeable item. When the hedging derivative instrument terminates, the hedgeable item will no longer have the benefit of the hedging derivative instrument. Because the District’s swap agreements extend to the maturity of the hedged debt, the District is not exposed to rollover risk.
Swap payments and associated debt – Using rates as June 30, 2016, debt service requirements of the variable-rate index-linked bonds and net swap payments, assuming current interest rates remain the same for their term, were as follows (as rates vary, variable rate interest payments and net swap payments will vary):
InterestVariable-rate bonds rate
Principal Interest swaps, net TotalFiscal year ended June 30:
2017 — 608,518 6,732,167 7,340,685 2018 — 608,518 6,732,167 7,340,685 2019 — 608,518 6,732,167 7,340,685 2020 — 608,518 6,732,167 7,340,685 2021 — 608,518 6,732,167 7,340,685 2022 – 2026 18,825,000 2,940,453 32,530,876 54,296,329 2027 – 2031 31,250,000 2,289,984 25,334,591 58,874,575 2032 – 2036 31,250,000 1,563,343 17,295,607 50,108,950 2037 – 2041 31,000,000 839,221 9,284,491 41,123,712 2042 – 2044 18,525,000 143,352 1,585,931 20,254,283
Totals $ 130,850,000 10,818,943 119,692,331 261,361,274
(8) Fund Balance
The Board has established a formula to identify the amount of unassigned fund balance required to fund the six months of the subsequent year’s school operations property tax levy. The purpose of this portion of fund balance is to provide working capital until state aids and other payments from federal agencies are received.
The formula established by this action, and the application thereof as of June 30, 2016, is as follows:
General fund unassigned fund balance $ 40,566,631 Amount required to fund six months of the
school operation's property tax levy:Subsequent year’s school operations school levy ($260,069,165)
multiplied by a ratio of subsequent year’s tax days fromJuly 1 to December 31 (76) to total calendar school year days (180) 109,806,981
General fund unassigned fund balance deficiency $ (69,240,350)

MILWAUKEE PUBLIC SCHOOLS
Notes to Basic Financial Statements
For the Year Ended June 30, 2016
63
(9) Risk Management
The District is exposed to various types of risk of loss including torts; theft of, damage to, or destruction of assets; errors or omissions; job-related illnesses or injuries to employees; natural disasters; and environmental occurrences. Also included are risks of loss associated with providing health, dental, and life insurance benefits to employees and retirees.
The District purchases commercial property insurance, auto liability insurance, errors and omissions insurance, fiduciary liability and excess liability insurance. The District assumes a $250,000 self-insured retention for any one loss or occurrence under its self-insured general liability program. The District purchases excess liability insurance for its general liability that provides per-occurrence and general aggregate protection. The District is fully self-insured for environmental-related liabilities and purchases no excess environmental liability insurance.
The reduction in abuse and molestation liability limits effective July 1, 2013 remain in place. The District’s limits remain $1 million primary coverage and no excess coverage due to insurance market conditions.
The District provides health insurance benefits to employees and retirees through a self-insured PPO/Indemnity plan, self-insured exclusive provider organization (“EPO”) plan, and a self-insured high deductible health plan (HDHP) with a health savings account (HSA) option. The District purchases stop-loss insurance for all three of the above medical and corresponding prescription drug (Rx) plans. The Rx benefits are self-funded and offered in a concert with the medical plan. Should an employee elect to forego health insurance, there is a $500 annual opt-out program.
Effective January1, 2015 The District approved providing post-Medicare benefits to eligible retirees through a fully-insured Medicare Advantage plan. This fully-insured Medicare Advantage plan provides comparable benefits to the current self-insured PPO and EPO plans, however 2016 premium rates are 67% lower than the monthly premium for the EPO and 65% less expensive than the monthly premium for the PPO.
Life insurance benefits are provided for active and retired employees through a variable funding life insurance program. Life insurance costs that exceed certain rates are funded by MPS. Effective January 1, 2017, all benefits eligible employees will receive life insurance valued at one time annual base salary and long term disability paid by the District. Also, as of January 1, 2017, the District will provide voluntary (employee paid) supplemental life and short term disability insurance programs.
The District provides dental insurance benefits through a fully insured dental maintenance organization (DMO) and through a self-insured indemnity plan. The District does not purchase stop-loss insurance for its self-insured dental indemnity plan.
Additionally, the District provides a fully insured vision plan and medical and dependent care flexible spending programs.
The District is fully self-insured for worker’s compensation benefits and does not purchase stop-loss insurance.

MILWAUKEE PUBLIC SCHOOLS
Notes to Basic Financial Statements
For the Year Ended June 30, 2016
64
A liability for claims is reported when it is probable that a loss has occurred and the amount of the loss can be reasonably estimated. Liabilities include an amount for claims that have been incurred but not reported. Claim liabilities are calculated considering the effects of recent claim settlement trends including frequency and amount of payouts and other economic and social factors. The claim liabilities also include estimated costs for claim administration fees and outside legal and medical assistance costs. The liability for claims and judgments is reported in the general fund.
Changes in the balance of claim liabilities during the past two years are as follows:
Year ended June 302016 2015
Beginning of year liability $ 27,421,514 34,035,943 Current year claims and changes in estimate 149,298,712 159,439,692 Claim payments (146,751,145) (166,054,121)
End of year liability $ 29,969,081 27,421,514
The District has recognized the liability for health and dental benefits, which totaled $18,746,365 and $15,948,420 as of June 30, 2016 and 2015, respectively, in the general fund. The District has also recognized a liability of $3,985,628 and $1,181,255 as of June 30, 2016 and 2015, respectively, in the general fund for workers’ compensation claims that were due as of the respective year-end. Accrued claims also include $16,528 of other insurance related liabilities. All other claims liabilities are considered to be long-term liabilities and are recognized in the government-wide financial statements.
(10) Retirement Plans
Wisconsin Retirement System
Plan description. The WRS is a cost-sharing multiple-employer defined benefit pension plan. WRS benefits and other plan provisions are established by Chapter 40 of the Wisconsin Statutes. Benefit terms may only be modified by the legislature. The retirement system is administered by the Wisconsin Department of Employee Trust Funds (ETF). The system provides coverage to all eligible State of Wisconsin, local government and other public employees. All employees, initially employed by a participating WRS employer on or after July 1, 2011, and expected to work at least 1200 hours a year (880 hours for teachers and school district educational support employees) and expected to be employed for at least one year from employee’s date of hire are eligible to participate in the WRS. ETF issues a standalone Comprehensive Annual Financial Report (CAFR), which can be found at http://etf.wi.gov/publications/cafr.htm. Vesting. For employees beginning participation on or after January 1, 1990, and no longer actively employed on or after April 24, 1998, creditable service in each of five years is required for eligibility for a retirement annuity. Participants employed prior to 1990 and on or after April 24, 1998, and prior to July 1, 2011, are immediately vested. Participants who initially became WRS eligible on or after July 1, 2011, must have five years of creditable service to be vested.

MILWAUKEE PUBLIC SCHOOLS
Notes to Basic Financial Statements
For the Year Ended June 30, 2016
65
Benefits provided. Employees who retire at or after age 65 (54 for protective occupation employees, 62 for elected officials and State executive participants) are entitled to receive an unreduced retirement benefit. The factors influencing the benefit are: (1) final average earnings, (2) years of creditable service, and (3) a formula factor. Final average earnings is the average of the participant's three highest years' earnings. Creditable service is the creditable current and prior service expressed in years or decimal equivalents of partial years for which a participant receives earnings and makes contributions as required. The formula factor is a standard percentage based on employment category. Employees may retire at age 55 (50 for protective occupation employees) and receive reduced benefits. Employees terminating covered employment before becoming eligible for a retirement benefit may withdraw their contributions and forfeit all rights to any subsequent benefits. The WRS also provides death and disability benefits for employees.
Post-retirement adjustments. The Employee Trust Funds Board may periodically adjust annuity payments from the retirement system based on annual investment performance in accordance with s. 40.27, Wis. Stat. An increase (or decrease) in annuity payments may result when investment gains (losses), together with other actuarial experience factors, create a surplus (shortfall) in the reserves, as determined by the system’s consulting actuary. Annuity increases are not based on cost of living or other similar factors. For Core annuities, decreases may be applied only to previously granted increases. By law, Core annuities cannot be reduced to an amount below the original, guaranteed amount (the “floor”) set at retirement. The Core and Variable annuity adjustments granted during recent years are as follows:
Year
Core Fund Adjustment
Variable Fund
2006 0.8% 3%
2007 3.0 10
2008 6.6 0
2009 (2.1) (42)
2010 (1.3) 22
2011 (1.2) 11
2012 (7.0) (7)
2013 (9.6) 9
2014 4.7 25
2015 2.9 2

MILWAUKEE PUBLIC SCHOOLS
Notes to Basic Financial Statements
For the Year Ended June 30, 2016
66
Contributions. Required contributions are determined by an annual actuarial valuation in accordance with Chapter 40 of the Wisconsin Statutes. The employee required contribution is one-half of the actuarially determined contribution rate for general category employees, including teachers, and Executives and Elected Officials. Required contributions for protective employees are the same rate as general employees. Employers are required to contribute the remainder of the actuarially determined contribution rate. The employer may not pay the employee required contribution unless provided for by an existing collective bargaining agreement.
During the reporting period, the WRS recognized $26,030,474 in contributions from the district.
Contribution rates as of June 30, 2016 are:
Employee Category Employee Employer General (including teachers) 6.6% 6.6% Executives & Elected Officials 6.6% 6.6% Protective with Social Security 6.6% 9.4% Protective without Social Security 6.6% 13.2%
At June 30, 2016, the district reported a liability of $43,792,878 for its proportionate share of the net pension liability. The net pension liability was measured as of December 31, 2015, and the total pension liability used to calculate the net pension asset was determined by an actual valuation as of December 31, 2014 rolled forward to December 31, 2015. No material changes in assumptions of benefit terms occurred between the actuarial valuation date and the measurement date. The district’s proportion of the net pension asset was based on the district’s share of contributions to the pension plan relative to the contributions of all participating employers. At December 31, 2015, the district’s proportion was 2.69497853% which was a decrease of .03779237% from its proportion measured as of December 31, 2014. For the year ended June 30, 2016, the district recognized pension expense of $53,745,612. At June 30, 2016, the district reported deferred outflows of resources and deferred inflows of resources related to pensions from the following sources:
Differences between expected and actual experience 7,512,404$ 92,161,365$ Changes in assumptions 30,639,404 - Net differences between projected and actual earnings on
pension plan investments 179,637,871 - Changes in proportion and differences between employer
contributions and proportionate share of contributions 1,813,128 - Employer contributions subsequent to the measurement date 13,376,990 -
Total 232,979,797$ 92,161,365$
ResourcesDeferred Outflows of Deferred Inflows of
Resources

MILWAUKEE PUBLIC SCHOOLS
Notes to Basic Financial Statements
For the Year Ended June 30, 2016
67
$13,376,990 reported as deferred outflows related to pension resulting from the WRS Employer’s contributions subsequent to the measurement date will be recognized as a reduction of the net pension liability (asset) in the year ended June 30, 2017. Other amounts reported as deferred outflows of resources and deferred inflows of resources related to pension will be recognized in pension expense as follows:
22,303,220 2,948,485
-
Deferred Inflows of Resources
22,303,220$ 22,303,220 22,303,220
Deferred Outflows of
20172018201920202021
Thereafter
Year ended June 30:57,098,097$ 57,098,097 57,098,097 47,320,708
987,808 -
Resources
Actuarial assumptions. The total pension liability in the December 31, 2015, actuarial valuation was determined using the following actuarial assumptions, applied to all periods included in the measurement.
Actuarial Valuation Date December 31, 2014Measurement Date of Net Pension Liability(Asset) December 31, 2015Actuarial Cost Method: Entry AgeAsset Valuation Method: Fair Market ValueLong-Term Expected Rate of Return: 7.2%Discount Rate: 7.2%Salary Increases:Inflation 3.2%Seniority/Merit 0.2%-5.6%Mortality: Wisconsin 2012 Mortality TablePost-retirement Adjustments* 2.1%
*No post-retirement adjustment is guaranteed. Actual adjustments are based on recognized investment return, actuarial experience and other factors. 2.1% is the assumed annual adjustment based on the investment return assumption and the post-retirement discount rate.
Actuarial assumptions are based upon an experience study conducted in 2012 using experience from 2009-2011. The total pension liability for December 31, 2015 is based upon a roll-forward of the liability calculated from the December 31, 2014 actuarial valuation. Long-term expected return on plan assets. The long-term expected rate of return on pension plan investments was determined using a building-block method in which best-estimate ranges of expected future real rates of return (expected returns, net of pension plan investment expense and inflation) are developed for each major asset class. These ranges are combined to produce the long-term expected rate of return by weighting the

MILWAUKEE PUBLIC SCHOOLS
Notes to Basic Financial Statements
For the Year Ended June 30, 2016
68
expected future real rates of return by the target asset allocation percentage and by adding expected inflation. The target allocation and best estimates of arithmetic real rates of return for each major asset class are summarized in the following table:
Current Long-Term Long-Term
Asset Expected Nominal Expected Real
Core Fund Asset Class Allocation % Rate of Return % Rate of Return %
US Equities 27 % 23 % 7.6 % 4.7 %International Equities 24.5 22 8.5 5.6
Fixed Income 27.5 37 4.4 1.6
Inflation Sensitive Assets 10 20 4.2 1.4
Real Estate 7 7 6.5 3.6
Private Equity/Debt 7 7 9.4 6.5
Multi-Asset 4 4 6.7 3.8
Total Core Fund 107 120 7.4 4.5
Variable Fund Asset Class
US Equities 70 70 7.6 4.7
International Equities 30 30 8.5 5.6
Total Variable Fund 100 100 7.9 5
New England Pension Consultants Long Term US CPI (Inflation) Forecast 2.75%
Asset Allocations are managed within established ranges, target percentages may differ from actual monthly allocations
DestinationTarget Asset
Allocation %
Single discount rate. A single discount rate of 7.20% was used to measure the total pension liability. This single discount rate was based on the expected rate of return on pension plan investments of 7.20% and a long term bond rate of 3.56%. Because of the unique structure of WRS, the 7.20% expected rate of return implies that a dividend of approximately 2.1% will always be paid. For purposes of the single discount rate, it was assumed that the dividend would always be paid. The projection of cash flows used to determine this single discount rate assumed that plan member contributions will be made at the current contribution rate and that employer contributions will be made at rates equal to the difference between actuarially determined contribution rates and the member rate. Based on these assumptions, the pension plan’s fiduciary net position was projected to be available to make all projected future benefit payments (including expected dividends) of current plan members. Therefore, the long-term expected rate of return on pension plan investments was applied to all periods of projected benefit payments to determine the total pension liability. Sensitivity of the district’s proportionate share of the net pension (asset) to changes in the discount rate. The following presents the district’s proportionate share of the net pension asset calculated using the discount rate of 7.20 percent, as well as what the district’s proportionate share of the net pension liability (asset) would be if it were calculated using a discount rate that is 1-percentage-point lower (6.20 percent) or 1-percentage-point higher (8.20 percent) than the current rate:

MILWAUKEE PUBLIC SCHOOLS
Notes to Basic Financial Statements
For the Year Ended June 30, 2016
69
1% Increase to
Discount Rate
(8.20%)
District's proportionate share of the net pension liability (asset) 43,792,878$ (161,904,729)$ 307,164,084$
1% Decrease to
Discount Rate
(6.20%)
Current Discount
Rate (7.20%)
Pension plan fiduciary net position. Detailed information about the pension plan’s fiduciary net position is available in separately issued financial statements available at http://legis.wisconsin.gov/lab/ and reference report number 15-11.
Employes’ Retirement System of the City of Milwaukee
Plan Description – The District makes contributions to the Employes’ Retirement System of the City of Milwaukee (the “System”), a cost-sharing multiple-employer defined pension plan, on behalf of all eligible City employees. The System provides retirement, disability, and death benefits to plan members and beneficiaries. The City Charter assigns the authority to establish and amend benefit provisions. The System issues a publicly available financial report that includes financial statements and required supplementary information for the System. That report may be obtained by writing to the Employees’ Retirement System of the City of Milwaukee, 789 North Water Street, Suite 300, Milwaukee, WI 53202.
Funding Policy – For general employees participating prior to January 1, 2014, they are required to contribute, or have contributed on their behalf, a percentage of their annual earnable compensation equal to 5.5% of their annual pensionable income, and for general employee, participating on or after January 1, 2014, they are required to contribute 4% of their annual pensionable income. The City Charter assigns the authority to establish and amend contribution requirements. The City Charter was amended so that various groups of represented and non-represented City employees hired on or after January 1, 2010 contribute 5.5% of their earnable compensation for pension benefits. The District’s contributions to the System for the years ended December 31, 2015, 2014, and 2013, were $7,645,538, $5,676,000, and $5,716,000, respectively, equal to the required contributions on behalf of the plan members for each year.
At June 30, 2016, the district reported a liability of $53,735,000 for its proportionate share of the net pension liability. The net pension liability was measured as of December 31, 2015, and the total pension liability used to calculate the net pension liability was determined by an actual valuation as of December 31, 2014 rolled forward to December 31, 2015. No material changes in assumptions of benefit terms occurred between the actuarial valuation date and the measurement date. The district’s proportion of the net pension liability was based on the district’s share of contributions to the pension plan relative to the contributions of all participating employers. At December 31, 2015 the district’s proportion was 12.7772411% which was an increase of 0.420653% from its proportion measured as of December 31, 2014. For the year ended June 30, 2016, the district recognized pension expense of $7,098,984.

MILWAUKEE PUBLIC SCHOOLS
Notes to Basic Financial Statements
For the Year Ended June 30, 2016
70
At June 30, 2016, the district reported deferred outflows of resources and deferred inflows of resources related to pensions from the following sources:
Differences between expected and actual experience -$ 2,924,000$ Changes in assumptions - 507,000 Net differences between projected and actual earnings on
pension plan investments 61,283,250 - Changes in proportion and differences between employer
contributions and proportionate share of contributions 534,000 588,000 Employer contributions subsequent to the measurement date 4,876,599 -
Total 66,693,849$ 4,019,000$
ResourcesDeferred Outflows of Deferred Inflows of
Resources
$4,876,599 reported as deferred outflows related to pension resulting from the System employer’s contributions subsequent to the measurement date will be recognized as a reduction of the net pension liability (asset) in the year ended June 30, 2017. Other amounts reported as deferred outflows of resources and deferred inflows of resources related to pension will be recognized in pension expense as follows:
2021Thereafter
Year ended June 30:16,474,375$ 16,474,375 16,474,375 12,394,125
- -
ResourcesDeferred Outflows of
2017201820192020 251,186
- -
Deferred Inflows of Resources
1,255,938$ 1,255,938 1,255,938

MILWAUKEE PUBLIC SCHOOLS
Notes to Basic Financial Statements
For the Year Ended June 30, 2016
71
Actuarial assumptions. The last actuarial valuation was performed as of January 1, 2015, and the amounts were used to roll-forward the total pension liability to the plan’s year-end December 31, 2015, and was determined using the following actuarial assumptions, applied to all prior periods included in the measurement:
Actuarial valuation date
December 31, 2014
Measurement Date of Net Pension Liability
December 31, 2015
Actuarial cost method Entry age normal-Level Percentage of Pay
Amortization method For pension expense; the difference between expected and actual liability experience and changes of assumptions are amortized over the average of the expected remaining service lives of all members. The differences between projected and actual earnings are amortized over a closed period of five years.
Asset Valuation Method
Actuarial Assumptions:
Fair Market value
Investment rate of return and discount rate
8.25% for calendar years through 2017, and 8.50% beginning with calendar year 2018
Projected Salary increases General City 3.0%-7.5%
Police & Fire 3.0% - 14.4%
Inflation Assumption 3.00%
Cost of living Adjustments Vary by Employee Group as explained in summary of plan provisions
Mortality Table For regular retirees and for survivors, the RP-2000 Combined Mortality Table projected nine years using Scale AA. Future generational rates are projected from 2009 based on Scale AA. For duty and ordinary disability retirees, use the RP-2000 Disability Mortality Table. For death in active service, the rates are similar to those used for regular retirees and survivors with a 6-year setback.
Experience Study The actuarial assumptions used in December 31, 2015 valuation were based on the results of an actuarial experience study for the period January 1, 2007-December 31, 2011.

MILWAUKEE PUBLIC SCHOOLS
Notes to Basic Financial Statements
For the Year Ended June 30, 2016
72
Long-term expected rate of return-the long-term expected rate of return on pension plan investments was determined using Callan Associates’ 10 year geometric capital market projections. Projected long term rates of return for each major asset class in the Retirement System’s target asset allocation as of December 31, 2015, are summarized in the following table:
Policy ActualDomestic Equity 25.00% 28.70%International Equity 20.00% 21.40%Global Equity 10.00% 7.03%Fixed Income 24.00% 24.14%Cash 1.00% 0.84%Real Estate 7.00% 8.38%Real Assets 3.00% 0.00%Private Equity 5.00% 3.84%Absolute Return 5.00% 5.67%
100.00% 100.00%
Asset Class
0.87%
5.45%12.40%4.68%
1.41%
6.91%
Long-term ExpectedRate of Return
9.22%7.14%8.00%
Discount Rate - The discount rate used to measure the total pension liability was 8.50 percent. The projection of cash flows used to determine the discount rate assumed that contributions from plan members will be made at the current contribution rate and that contributions from ERS agencies will be made at contractually required rates, actuarially determined. Based on those assumptions, the ERS fiduciary net position was projected to be available to make all projected future benefit payments of current plan members. The cross over analysis produces a single rate of 8.50 percent, which reflects the long-term expected rate of return on ERS investments. Therefore, the discount rate was applied to all periods of projected benefit payments to determine the total pension liability.
Sensitivity of the district’s proportionate share of the net pension liability/(asset) to changes in the discount rate - The following presents the district’s proportionate share of the net pension liability/(asset) calculated using the discount rate of 8.50 percent, as well as what the district’s proportionate share of the net pension liability would be if it were calculated using a discount rate that is 1-percentage point lower (7.50 percent) or 1 - percentage-point higher (9.50 percent) than the current rate (in thousands):
1% Decrease 1% Increase(7.50%) (9.50%)
District proportionate share ofthe net pension liability (asset) $126,306,000 (7,454,000)
Current Discount(8.50%)
53,735,000
Additional Financial Information for the ERS- For additional information regarding ERS’s financial statements and audit report, please visit the ERS web site at http:/www.cmers.com/About-Us/Reports.htm
MILWAUKEE PUBLIC SCHOOLS
Notes to Basic Financial Statements
For the Year Ended June 30, 2016
73
Supplemental Retirement Plans
(a) Plan Descriptions and Funding Policies
Milwaukee Board of School Directors Early Retirement Supplement and Benefit Improvement Plan
The plan is a single-employer defined benefit pension plan established to provide benefits after early retirement which will supplement the pension benefits provided by the WRS and the System.
A participant must be an administrative, supervisory, or professional staff employee of the District who is in the collective bargaining unit represented by the Administrators and Supervisors Council, Inc (the “ASC”), an exempt employee excluded by the ASC bargaining contract, or any other employee who is identified as a covered employee by the Milwaukee Board of School Directors (MBSD) through an employment contract between such employee and the MBSD. Such employees shall become participants in the plan on the later of the effective date of the plan or the date they become a participant in the WRS. Certain classified participants represented by the ASC or any exempt employee excluded by the ASC bargaining contract and covered by the System, and certain psychologists who elected to remain in the plan after June 30, 1980 are also eligible for participation.
The Plan is classified as a “governmental plan” and is, therefore, exempt from provisions of the Employee Retirement Security Act of 1974 (ERISA).
Participants are eligible for retirement benefits provided they have made three years of participant contributions and have eight or more years of vesting service. For Plan years, effective July 1, 2003, vesting under the Plan is modified to be three years of service as a covered employee and eight or more years of vesting service. The plan provides for unreduced benefits on or after age 60 and for reduced benefits between ages 55 and 60. For participants who retire between ages 60 and 65 under the System or under the WRS, a special supplemental benefit, as defined, shall be paid until the retiree attains age 65. Benefits are paid in the form of monthly payments based on years of service and average monthly compensation for the three highest fiscal years of earnings preceding the date of retirement to a maximum benefit, for this plan and either the System or WRS, of 70% of average monthly compensation. The benefit paid under this plan for a participant whose benefit is related to the WRS shall be reduced by the amount of the WRS benefit paid. Wisconsin Act 11 directly affects the plan by decreasing the benefits paid and increasing the funded status of the plan.
In consideration of the reduced benefits to be paid by the plan as a result of Wisconsin Act 11, the District signed an agreement with the ASC to amend the plan effective July 1, 2003 as follows:
Transfer the benefit formula under the teachers plan to the plan for those individuals who have prior MPS teaching service after July 1, 1982 and are eligible to receive a benefit from the teachers plan. Such individuals will have the option of electing either the teacher or ASC benefit formula.
Eliminate employee contributions to the plan.

MILWAUKEE PUBLIC SCHOOLS
Notes to Basic Financial Statements
For the Year Ended June 30, 2016
74
Close the plan to anyone who is not a covered employee as of June 30, 2003 and previous employees that are rehired after June 30, 2003.
Eliminate the suspension of benefits provision in the plan and replace it with a new provision that suspends benefits paid from the plan if the retired annuitant is rehired as a covered employee and elects to participate as an active employee under the WRS.
In fiscal year 2004, the District received more than the required 95% of signed waivers and consents from covered employee to implement the negotiated change to the Plan. Subsequently the MBSD adopted the restated Plan at its June 2004 regular meeting.
The amendments to the plan were included in the July 1, 2003 actuarial valuation. These amendments resulted in an increase to the actuarial accrued liability of $4,973,000 as of July 1, 2003.
In fiscal year 2005, the definition of “Year of Benefit Service” of the Plan was amended to provide for the addition of the following at the end of such definition:
For a covered employee who was an active participant in the Plan on or after July 1, 2004 and who:
Became a covered employee on or after July 1, 1982; and
Was covered under the MTEA-teacher collective bargaining unit and under the WRS on or after July 1, 1982; and
Is vested under the Teachers Plan; and
Has consented in writing to the amendment of the Plan as provided in a Negotiating Note between the Board and the ASC dated June 24, 2003.
A covered employee shall continue to be credited with the Years of Benefit Service without giving effect to Years of Benefit Service provisions of the Teachers Plan, for the periods beginning on and after July 1, 2004, except for the purpose of computing the Alternate Benefit for certain Teachers Plan participants as a result of Wisconsin Act 11 discussed above.
The plan also provides for disability benefits to vested participants if employment is terminated between ages 55 and 65 by reason of total and permanent disability as approved by the WRS. Upon the death of an active participant who is not eligible for any other form of benefit under the plan, a lump-sum death benefit of the value of the participant’s employee contribution account is provided to the participant’s beneficiary.
The Plan does not provide for any post-retirement increases.
The District maintains a separate “member contribution account” for each participant. Annually, as of June 30, the portion of investment income of the fund attributable to the participants’ contribution is credited to the respective member contribution accounts. If a participant leaves covered employment or dies, accumulated employee contributions, plus related investment earnings, are refunded to the employee or designated beneficiary based on

MILWAUKEE PUBLIC SCHOOLS
Notes to Basic Financial Statements
For the Year Ended June 30, 2016
75
their election. Classified employees are not required to make member contributions under the plan.
Effective July 1, 2003, participants are no longer required to make contributions to the Plan and the employer shall pay 100% of required plan contributions.
Accrued plan liabilities are reduced by the amount attributed to employer contributions for employees who are not vested for benefits and who terminate participation in the Plan for reasons that include termination of employment. These employer contributions are applied to reduce the cost of the Plan and not to increase benefits otherwise payable to eligible participants.
Milwaukee Board of School Directors Supplemental Early Retirement Plan for Teachers
The plan is a single-employer defined benefit pension plan established to provide benefits after early retirement which will supplement the pension benefits provided by the WRS and the System.
To be eligible for participation, an employee must be a teacher of the District who is in the collective bargaining unit represented by the Milwaukee Teachers’ Education Association (“MTEA”) and who is participating as an active employee in the WRS. Such employees shall become participants in the plan on the later of the effective date of the Plan or the date they become a participant in the WRS. Employees who first became participants before July 1, 1998, are vested upon participation. Employees who first became participants on or after July 1, 1998, are vested after being employed by the District for at least 15 years after July 1, 1998, in a position that is covered under the MBSD/MTEA teacher contract and that counts as creditable service under the WRS (but excluding periods of military service) and terminates employment with the District on or after the employee’s 55th birthday.
Effective July 1, 2013, the District made following changes to the Plan provisions:
Enrollment in the Plan was closed to any employees hired or rehired or transferred or demoted to the teacher unit; and
Average monthly compensation was frozen as of July 1, 2013: and
Creditable service was frozen for all Plan participants as of July 1, 2013; and
Vesting service was frozen for employees hired and rehired or transferred or demoted to the teacher unit on or after July 1, 2013; and
Participants in the Plan as of July 1, 2013 and who do not subsequently separate from service prior to eligibility for retirement shall continue to accrue vesting services under the Plan.
The plan is classified as a “governmental plan” and is, therefore, exempt from the provisions of the Employee Retirement Income Security Act of 1974 (ERISA).
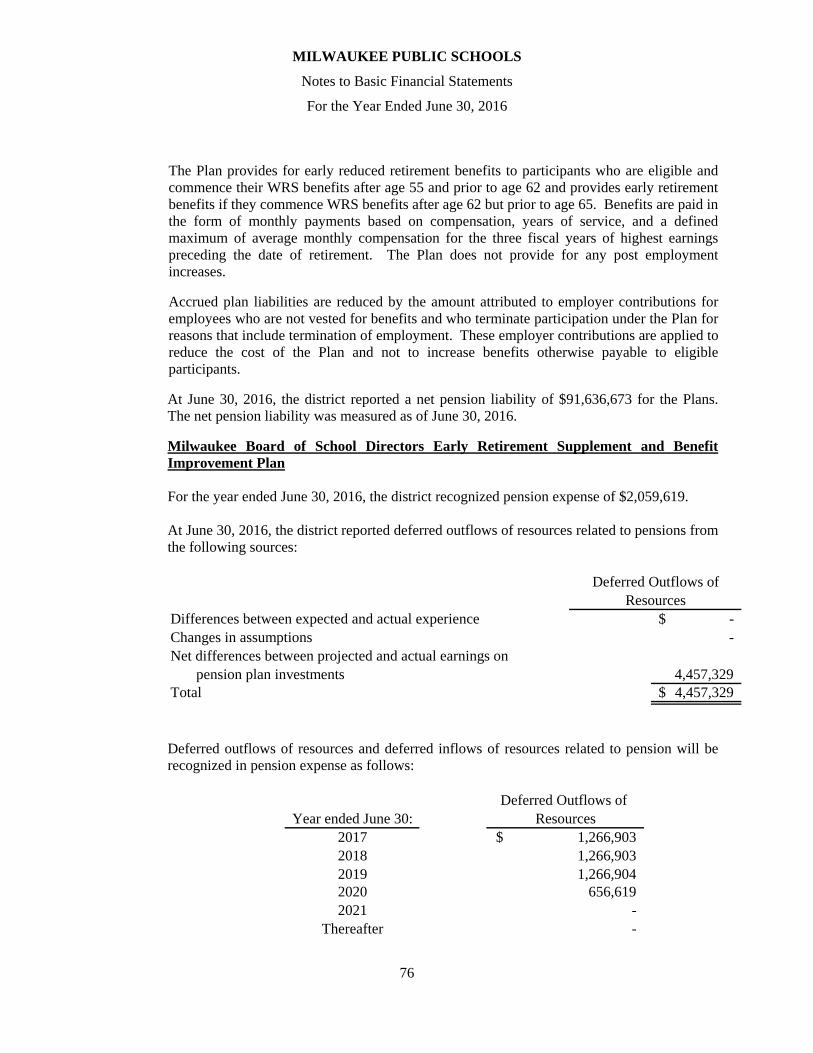
MILWAUKEE PUBLIC SCHOOLS
Notes to Basic Financial Statements
For the Year Ended June 30, 2016
76
The Plan provides for early reduced retirement benefits to participants who are eligible and commence their WRS benefits after age 55 and prior to age 62 and provides early retirement benefits if they commence WRS benefits after age 62 but prior to age 65. Benefits are paid in the form of monthly payments based on compensation, years of service, and a defined maximum of average monthly compensation for the three fiscal years of highest earnings preceding the date of retirement. The Plan does not provide for any post employment increases.
Accrued plan liabilities are reduced by the amount attributed to employer contributions for employees who are not vested for benefits and who terminate participation under the Plan for reasons that include termination of employment. These employer contributions are applied to reduce the cost of the Plan and not to increase benefits otherwise payable to eligible participants.
At June 30, 2016, the district reported a net pension liability of $91,636,673 for the Plans. The net pension liability was measured as of June 30, 2016.
Milwaukee Board of School Directors Early Retirement Supplement and Benefit Improvement Plan
For the year ended June 30, 2016, the district recognized pension expense of $2,059,619.
At June 30, 2016, the district reported deferred outflows of resources related to pensions from the following sources:
Differences between expected and actual experience -$ Changes in assumptions - Net differences between projected and actual earnings on pension plan investments 4,457,329 Total 4,457,329$
ResourcesDeferred Outflows of
Deferred outflows of resources and deferred inflows of resources related to pension will be recognized in pension expense as follows:
2021Thereafter
Year ended June 30:1,266,903$ 1,266,903 1,266,904
656,619 - -
ResourcesDeferred Outflows of
2017201820192020
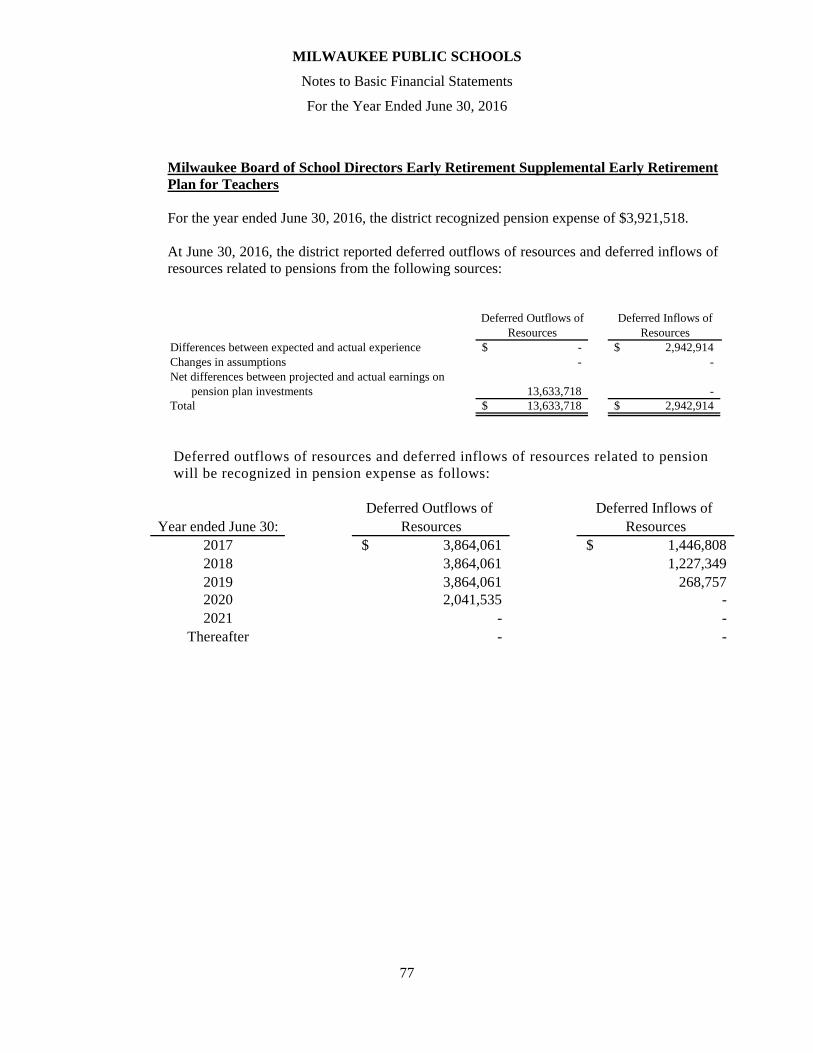
MILWAUKEE PUBLIC SCHOOLS
Notes to Basic Financial Statements
For the Year Ended June 30, 2016
77
Milwaukee Board of School Directors Early Retirement Supplemental Early Retirement Plan for Teachers
For the year ended June 30, 2016, the district recognized pension expense of $3,921,518.
At June 30, 2016, the district reported deferred outflows of resources and deferred inflows of resources related to pensions from the following sources:
Differences between expected and actual experience -$ 2,942,914$ Changes in assumptions - - Net differences between projected and actual earnings on pension plan investments 13,633,718 - Total 13,633,718$ 2,942,914$
ResourcesDeferred Outflows of Deferred Inflows of
Resources
Deferred outflows of resources and deferred inflows of resources related to pension will be recognized in pension expense as follows:
2021Thereafter
Year ended June 30:3,864,061$ 3,864,061 3,864,061 2,041,535
- -
ResourcesDeferred Outflows of
2017201820192020 -
- -
Deferred Inflows of Resources
1,446,808$ 1,227,349
268,757

MILWAUKEE PUBLIC SCHOOLS
Notes to Basic Financial Statements
For the Year Ended June 30, 2016
78
Actuarial Assumptions
In February 2012, the Plan actuary performed an experience study based on actuarial valuations for the period July 1, 2006 to July 1, 2011. Based on this study the following assumptions were implemented effective for the July 1, 2012 actuarial valuation. The total pension liability was determined by an actuarial valuation as of July 1, 2015 and data rolled forward to June 30, 2016, above using the following actuarial methods and assumptions:
Milwaukee Board of School Directors Early Retirement
Supplement and Benefit Improvement Plan
Milwaukee Board of School Directors Supplemental Early Retirement Plan for Teachers
Actuarial valuation date July 1, 2015 July 1, 2015
Measurement date of Net Pension Liability
June 30, 2016
June 30, 2016
Actuarial cost method Entry Age Normal Entry age normal
Asset Valuation method 5-year smoothed market 5-year smoothed market
Investment rate of return and discount rate
7.5%
7.5%
Inflation 2.8% 0.0%
Salary increases Certificated participants: In addition to price inflation, service based increases of up to 3.7% per year. Classified Participants :4.0% to 5.0% per year.
No longer needed as Plan was frozen effective July 1, 2013. Therefore salary increases after this date will not be considered pensionable under the Plan.
Morality rate Wisconsin Projected Experience Table-2005 for women and 90% of Wisconsin Projected Experience Table-2005 for men.
Wisconsin Projected Experience Table-2005 for women and 90% of Wisconsin Projected Experience Table-2005 for men.

MILWAUKEE PUBLIC SCHOOLS
Notes to Basic Financial Statements
For the Year Ended June 30, 2016
79
Long-Term Expected Rate of Return
On pension plan investments was determined using a building-block method in which best-estimate ranges of expected future real rates of return are developed for each major asset class. These ranges are combined to produce the long-term expected rate of return by weighing the expected future real rates of return by the target asset allocation percentage and by adding expected inflation. Best estimates of geometric real rates of return for each major asset class as of December 31, 2015 are as follows: Milwaukee Board of School Directors Early Retirement Supplement and Benefit Improvement Plan Asset Class
SWIB Core FundDomestic Equity 4.70%International Equity 5.60%Fixed Income 1.60%Inflation Sensitive Assets 1.40%Real Estate 3.60%Private Equity/Debt 6.50%Multi-Asset 3.80%Cash 0.90%
Portfolio Target Allocation 79.00%
Actual AllocationLong-Term ExpectedReal Rate of Return
23.00%22.00%37.00%20.00%7.00%7.00%4.00%
(20.00)%
Asset Class
SWIB Variable FundDomestic Equity 4.70%International Equity 5.60%
Portfolio Target Allocation
BMO Fund Intermediate Fixed Income 1.00%
Portfolio Target Allocation
Long-Term Inflation Assumption 2.75%
Actual AllocationLong-Term ExpectedReal Rate of Return
70.00%30.00%
14.00%
7.00%

MILWAUKEE PUBLIC SCHOOLS
Notes to Basic Financial Statements
For the Year Ended June 30, 2016
80
Milwaukee Board of School Directors Supplemental Early Retirement Plan for Teachers
Asset Class
SWIB Core FundDomestic Equity 4.70%International Equity 5.60%Fixed Income 1.60%Inflation Sensitive Assets 1.40%Real Estate 3.60%Private Equity/Debt 6.50%Multi-Asset 3.80%Cash 0.90%
Portfolio Target Allocation 85.00%
Actual AllocationLong-Term ExpectedReal Rate of Return
23.00%22.00%37.00%20.00%7.00%7.00%4.00%
(20.00)%
SWIB Variable FundDomestic Equity 4.70%International Equity 5.60%
Portfolio Target Allocation
BMO Fund Intermediate Fixed Income 1.00%
Portfolio Target Allocation
Long-Term Inflation Assumption 2.75%
Actual AllocationLong-Term ExpectedReal Rate of Return
70.00%30.00%
10.00%
5.00%
Single Discount Rate
The Plan is closed to future members, and the funding policy is projected to fully finance plan liabilities in the future. Actuarially determined contributions will be adjusted in the future, as experience emerges, to ensure that retiree benefits are paid. A single discount rate of 7.5% was used to measure the total pension liability. This single discount rate was based on the expected rate of return on pension plan investments of 7.5%. The projection of cash flows used to determine this single discount rate assumed that the plan sponsor would make the actuarially determined contribution as defined by the funding policy. Based on these assumptions, the pension plan’s fiduciary net position was projected to be available to make all projected future benefit payments of current plan members. Therefore, the long-term expected rate of return on pension plan investments was applied to all periods of projected benefit payments to determine the total pension liability.

MILWAUKEE PUBLIC SCHOOLS
Notes to Basic Financial Statements
For the Year Ended June 30, 2016
81
Sensitivity of Net Pension Liability to the Single Discount Rate Assumption
Regarding the sensitivity of the net pension liability to changes in the single discount rate, the following presents the plan's net pension liability, calculated using a single discount rate of 7.5%, as well as what the Plan's net pension liability would be if it were calculated using a single discount rate that is 1-percentage-point lower (6.5%) or 1-percentage- point higher (8.5%): Milwaukee Board of School Directors Early Retirement Supplement and Benefit Improvement Plan
1% Decrease 1% Increase6.5% 8.5%
Net Pension Liability $11,014,676 $2,698,254
Current Discount7.5%
$6,562,190
Milwaukee Board of School Directors Supplemental Early Retirement Plan for Teachers
1% Decrease 1% Increase6.5% 8.5%
Net Pension Liability $114,508,963 $72,187,664
Current Discount7.5%
$91,636,673
(11) Post-Employment Life and Healthcare Insurance Benefits
The District administers a single-employer defined benefit healthcare plan and life insurance plan (“the Retiree Plan”). The plan provides health insurance contributions for eligible retirees and their eligible dependents through the District’s group health insurance plan, which covers both active and retired members. The plan also provides for life insurance contributions for eligible retirees through the District’s group life insurance plan, which covers both active and retired members. Benefit provisions are established through collective bargaining agreements and Board policy and plan provisions which state that eligible retirees and their spouses receive lifetime healthcare benefits and eligible retirees receive lifetime life insurance benefits either on a self-paid basis or a District-paid basis at established contribution rates. The Retiree Plan was closed to employees hired or rehired on or after July 1, 2013. The Retiree Plan does not issue a publicly available financial report.
Employee and retiree contribution requirements are established through collective bargaining agreements and Board policy and plan provisions. Contributions may be amended only through negotiations between the District and the union in the case of represented employees and by Board policy, as may be amended by action of the governing body, in the case of non-represented employees. 2011 Wisconsin Acts 10 and 32 stipulate that once existing collective bargaining agreements expire, or are terminated, extended, modified or renewed, such benefit provisions are a prohibited subject of bargaining and therefore such benefits including contributions are established through Board policy and plan provisions as may be amended by action of the governing body. As of June 30, 2013 all collective bargaining agreements expired.

MILWAUKEE PUBLIC SCHOOLS
Notes to Basic Financial Statements
For the Year Ended June 30, 2016
82
An employee who is age 55 or older with 15 or more years of eligible service and 70 percent or more of the maximum accumulated sick leave at the time of retirement, in accordance with collective bargaining agreements and Board policy, will receive a monthly Board subsidy at the Board’s share of the PPO/Indemnity active single plan or family plan premium rate in effect as of the employee’s date of retirement. (Certain bargaining units and certain non-represented employees who submit a retirement notice by either March 1 or April 1 will receive the greater of the June 30th or July 1st premium rate as their monthly Board subsidy in accordance with their collective bargaining agreement and Board policy.) A special one-time provision providing the higher PPO/Indemnity active single plan or family plan premium rate of March 31, 2011 or July 1, 2011 was extended to certain bargaining units and non-represented employees who gave their retirement notice by April 1, 2011 and retired by the end of their regular work year in June, 2011. Generally, the Board subsidy for health insurance remains fixed for the lifetime of the retiree while the retiree continues enrollment in an MPS health plan. MPS will reimburse the retiree for the retiree’s Medicare Part B premium in an amount not to exceed the Board subsidy. Employees who meet all other eligibility retirements, but do not meet the 70 percent maximum accumulated eligibility requirement for the Board subsidy, may continue coverage in an MPS health plan as a retiree on a self-paid basis at the group premium rate. There are also disability retirement provisions that provide for lifetime health coverage for the disabled retiree and eligible dependents. The surviving spouse coverage provisions for death of an employee in active service or after retirement for certain collective bargaining units and non-represented employees provide lifetime health coverage for the surviving spouse and limited coverage for eligible dependents at the established Board subsidy rate.
Effective with dates of retirement on or after July 1, 2013, eligibility provisions for retiree health insurance were changed to whichever of the following occurs earlier: (a) age 60 or older and 20 years of eligible service; OR (b) age 55 or older with 30 or more years of eligible service until sunset on July 1, 2015. Eligibility for the Board subsidy was also changed to 90 percent or more of the maximum accumulated sick leave at time of retirement for employees who meet the age and service requirements for dates of retirement on or after July 1, 2013.
The District provides an explicit subsidy for healthcare benefits that is not indexed for healthcare inflation once the member retires. However, because premiums for pre-Medicare retiree and active coverage are rated in one pool, the District is also providing an implicit subsidy after retirement that is indexed for inflation. Consequently, healthcare inflation impacts the implicit subsidy and the explicit subsidy of retirees. However, effective with dates of retirement on or after July 1, 2013, the methodology to determine premium rates was changed to establish pre-Medicare premium rates.
Effective with dates of retirement on or after July 1, 2013, the Board subsidy was changed to the Board’s share of the average of the active PPO/Indemnity Health Plan and the EPO Health Plan. Upon reaching Medicare eligibility, the Board subsidy will be adjusted (reduced) to reflect coordination with Medicare. As of January 1, 2015, all Medicare eligible retirees and their Medicare eligible spouses have been enrolled in the MPS Group Medicare Advantage Plan that includes a group Medicare Part D pharmacy benefit.
Effective August 1, 2011, all active employees pay premium contributions for health insurance based on either a percentage of the active premium rate or a percentage of salary in accordance with their collective bargaining agreement and Board Policy. This is as a result of settlement of all union contracts in late 2010 and early 2011. Prior to this, there was no employee premium contribution for most active employees. Certain non-represented employees paid 5 percent of their

MILWAUKEE PUBLIC SCHOOLS
Notes to Basic Financial Statements
For the Year Ended June 30, 2016
83
health plan premium. Board members pay any premium difference between the health plan they selected and the lowest cost health plan. Effective July 1, 2012 or July 1, 2013 upon expiration of labor contracts all employees will pay a percentage of premium for health insurance ranging from 5% to 14 percent based on their annual salary. Effective January 1, 2015, a High Deductible Health Plan (HDHP) with a Health Savings Account (HSA) was offered to all active employees with a lower employee premium share ranging from 2% to 9% based on their annual salary.
In general and in accordance with collective bargaining agreements, Board policy and plan provisions, retirees who meet the age and service requirements for retiree life insurance pay the premium contribution at the group rate until age 65 after which the District pays the premium. Certain collective bargaining units and non-represented employees who meet the age requirement and have 30 or more years of service receive life insurance benefits fully paid by the District. Certain other bargaining units have retiree life insurance benefits that are fully paid by the retiree at the group premium rate. Once retirees attain age 65, the life insurance coverage is reduced by 25 percent of the original coverage for each year following their 65th birthday. Coverage is not reduced below 25 percent of the original coverage in effect at time of retirement.
Effective with dates of retirement on or after July 1, 2013, eligibility provisions for retiree life insurance were changed to whichever of the following occurs earlier: (a) age 60 or older and 20 years of eligible service; OR (b) age 55 or older with 30 or more years of eligible service until sunset on July 1, 2015. The maximum benefit payable at the 25 percent reduction at age 67 was changed to $25,000.
Effective July 1, 2010 the District established an IRC Section 115 trust for the purpose of holding assets and funding for the District’s postemployment health and life insurance benefits. The trust is reported as a fiduciary fund in the District’s financial statement. For fiscal year ending June 30, 2016, the District contributed $53,072,438 (including pre-funding contributions) to the Retiree Plan. For fiscal year ending June 30, 2016, total member contributions to the Retiree Plan were $2,654,446.
The District’s annual other postemployment benefit (OPEB) cost (expense) is calculated based on the annual required contribution of the employer (ARC), an amount actuarially determined in accordance with parameters of GASB Statement No. 45. The ARC represents a level of funding that, if paid on an ongoing basis, is projected to cover normal cost each year and amortize any unfunded actuarial liabilities (or funding excess) over a period not to exceed thirty years. The following table shows the components of the District’s annual OPEB cost for the year ending June 30, 2016, the amount actually contributed to plan, and changes in the District’s net OPEB obligation to the Retiree Health Plan:

MILWAUKEE PUBLIC SCHOOLS
Notes to Basic Financial Statements
For the Year Ended June 30, 2016
84
Annual required contribution $ 87,848,228
Interest on Net OPEB Obligation 23,066,818
Adjustment to annual required contribution (48,627,406)
Annual OPEB cost 62,287,640
MPS Contributions made (53,072,439)
Decrease in Net OPEB Liability 9,215,201
Net OPEB obligation, beginning of year 506,962,986
Net OPEB obligation, end of year $516,178,187
The District’s annual OPEB cost, the percentage of annual OPEB cost contributed to the plan, and the net OPEB obligation for fiscal year ending June 30, 2016 and the two preceding years was as follows:
Percentage
Annual of Annual
OPEB OPEB Cost Net OPEB
Fiscal Year Ended Cost Contributed Obligation
6/30/16 $ 62,287,640 85.2% $516,178,187 6/30/15 75,250,634 131.5% 506,962,986 6/30/14 93,541,008 109.1% 530,646,634
The funded status of the plan is based on the most recent actuarial valuation date of July 1, 2015 was as follows:
Actuarial accrued liability (AAL) $ 997,489,628 Actuarial value of plan assets 128,837,270
Unfunded Actuarial Accrued Liability (UAAL) $ 868,652,358
Funded ratio (actuarial value of plan assets/AAL) 12.9% Covered payroll (active plan members) $ 376,737,589 UAAL as a percentage of covered payroll 230.6 %
Actuarial valuations of an ongoing plan involve estimates for the value of reported amounts and assumptions about the probability of occurrence of events far into the future. Examples include assumptions about future employment, mortality, and the healthcare cost trend. Amounts determined regarding the funded status of the plan and annual required contributions of the

MILWAUKEE PUBLIC SCHOOLS
Notes to Basic Financial Statements
For the Year Ended June 30, 2016
85
employer are subject to continual revision as actual results are compared with past expectations and new estimates are made about the future. The schedule of funding progress, presented as required supplementary information following the notes to the financial statements, presents multiyear trend information that shows whether the actuarial value of plan assets is increasing or decreasing over time relative to the actuarial accrued liabilities for benefits.
Projections of benefits for financial reporting purposes are based on the substantive plan (defined as the benefits covered by the plan as understood by the employer and plan members at the time of each actuarial valuation) and include the types of benefits provided at the time of each valuation and the historical pattern of sharing benefit costs between the employer and plan members to that point. The actuarial methods and assumptions used include techniques that are designed to reduce short-term volatility in actuarial accrued liabilities and the actuarial value of assets, consistent with the long-term perspective of the calculations.
The District’s OPEB financial disclosure information for fiscal year ending, June 30, 2016 was based on the assumptions and methods in the October 21, 2016 actuarial valuation. The District made significant changes to the retiree healthcare plan provisions and eligibility conditions effective during 2012 and 2013 which reduced both the annual OPEB cost and growth of actuarial liabilities. The impact of these changes and the anticipated accelerated retirements during fiscal years 2012 and 2013 due to these changes were measured in the valuation as of July 1, 2011. The entry age normal actuarial cost method was used. The District established an IRC Section 115 trust to contribute 105 percent of actual retiree healthcare claims to the trust beginning July 1, 2010. The actuarial assumptions include a 4.55 percent investment rate of return that reflects the District’s prefunding policy and an annual healthcare cost trend rate of 8.0 percent initially, reduced by decrements to an ultimate rate of 4.5 percent after 7 years. Both rates include a 3 percent inflation assumption. The Retiree Plan’s unfunded actuarial accrued liability is being amortized as a level percentage of projected payroll. In accordance with the GASB No. 45 standard, the unfunded actuarial liability is amortized over a 25 year period with an open amortization method. Financial statements of the Other Post Employment Benefits Trust are included on pages 102 and 103.
(12) Limitation on District Revenues
Wisconsin State Statutes limit the amount of revenues that school districts may derive from general school aids and property taxes unless a higher amount is approved by referendum. This limitation does not apply to revenues needed for the payment of any general obligation debt service (including refinanced debt) authorized by either of the following:
A resolution of the school board or by a referendum prior to August 12, 1993.
A referendum on or after August 12, 1993.
For the fiscal year ended June 30, 2016, the District was under its revenue limitation by $6,219.
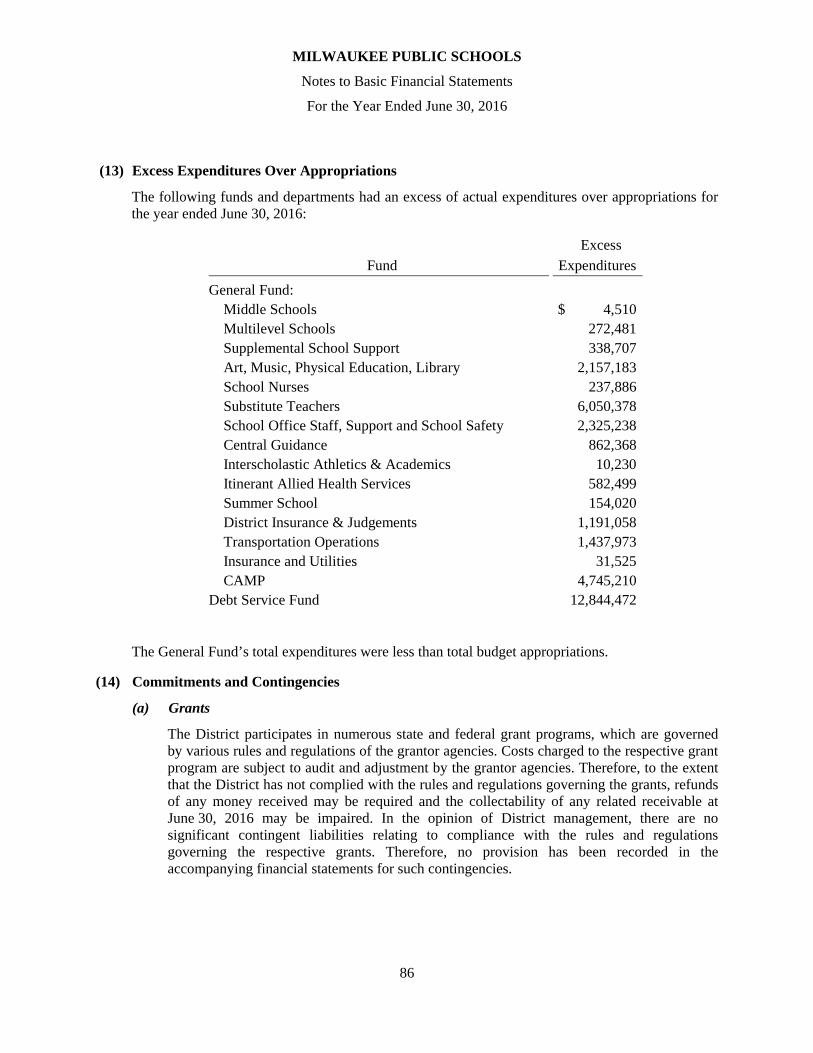
MILWAUKEE PUBLIC SCHOOLS
Notes to Basic Financial Statements
For the Year Ended June 30, 2016
86
(13) Excess Expenditures Over Appropriations
The following funds and departments had an excess of actual expenditures over appropriations for the year ended June 30, 2016:
Fund
Excess
Expenditures
General Fund: Middle Schools 4,510$ Multilevel Schools 272,481 Supplemental School Support 338,707 Art, Music, Physical Education, Library 2,157,183 School Nurses 237,886 Substitute Teachers 6,050,378 School Office Staff, Support and School Safety 2,325,238 Central Guidance 862,368 Interscholastic Athletics & Academics 10,230 Itinerant Allied Health Services 582,499 Summer School 154,020 District Insurance & Judgements 1,191,058 Transportation Operations 1,437,973 Insurance and Utilities 31,525 CAMP 4,745,210 Debt Service Fund 12,844,472
The General Fund’s total expenditures were less than total budget appropriations.
(14) Commitments and Contingencies
(a) Grants
The District participates in numerous state and federal grant programs, which are governed by various rules and regulations of the grantor agencies. Costs charged to the respective grant program are subject to audit and adjustment by the grantor agencies. Therefore, to the extent that the District has not complied with the rules and regulations governing the grants, refunds of any money received may be required and the collectability of any related receivable at June 30, 2016 may be impaired. In the opinion of District management, there are no significant contingent liabilities relating to compliance with the rules and regulations governing the respective grants. Therefore, no provision has been recorded in the accompanying financial statements for such contingencies.

MILWAUKEE PUBLIC SCHOOLS
Notes to Basic Financial Statements
For the Year Ended June 30, 2016
87
(b) Contractual Commitments
The District has $47.7 million of encumbrances outstanding as of June 30, 2016 of which $38.2 million are contractual commitments. The encumbrances and contract commitments by major and non-major funds are as follows:
(c) Litigation
The board is the defendant in litigation involving discrimination, personal injury, employee grievances, and a variety of other matters, each of which are being contested by the board. The board and management of the District believe that resolution of these contingencies will not have a material effect on the District’s financial position.
(d) FCC Channels
The District has for a number of years held a license issued by the Federal Communications Commission (FCC) for Educational Broadband Service (ESB) station KHF80 on 4 channels in the Milwaukee area. The District must renew the FCC license every 10 years, with the next renewal scheduled to take place in 2018. The FCC permits excess capacity of these stations to be leased, and MPS entered into a long-term lease of the station in 2008. MPS received $4,200,000 upfront in March 2008, and $55,000 per month initially, with monthly payment increases 3% each March during the contract period.
(15) Subsequent Events
To finance on an interim basis MPS’ general operating expenses pending receipt of state school aid payments, the City of Milwaukee issued $45,000,000 of commercial paper on September 29, 2016, maturing October 25, 2016. $180,000,000 of Revenue Anticipation Notes (RANs), Series 2016 M8, was issued on October 20, 2016. The RANs mature on October 1, 2017. Interest is payable on April 1, 2017 and at maturity.
ContractEncumbrance Commitments
totals of 6/30/16 at 6/30/16Major Funds General Fund 36,452,326$ 27,439,360$ Construction Fund 10,694,061 10,573,887 Nutrition Fund 474,115 189,733 Total Major Funds 47,620,502$ 38,202,980$ Non-Major Funds 69,473 35,352 Total Encumbrances and Contract Commitments 47,689,975$ 38,238,332$
MILWAUKEE PUBLIC SCHOOLS
Notes to Basic Financial Statements
For the Year Ended June 30, 2016
88
On December 1, 2016, $26,455,000 in Redevelopment Authority of the City of Milwaukee (RACM) Lease Revenue Bond proceeds with a premium of $2,292,963 was received. $27,277,963 will be used in fund Energy-Efficiency projects at three District schools and $1,470,000 in Qualified Zone Academy Bonds (QZAB) will be used to fund Culinary Academies at four District schools and Art Academies at four District schools.
(16) Effect of New Accounting Standards on Current Period Financial Statements
The Governmental Accounting Standards Board (GASB) has approved the following:
Statement No. 73, Accounting and Financial Reporting for Pensions and Related Assets That Are Not Within the Scope of GASB Statement 68, and Amendments to Certain Provisions of GASB Statements 67 and 68
Statement No. 74, Financial Reporting for Postemployment Benefit Plans Other Than Pension Plans
Statement No. 75, Accounting and Financial Reporting for Postemployment Benefits Other Than Pensions
Statement No. 77, Tax Abatement Disclosures
Statement No. 78, Pensions Provided Through Certain Multiple-Employer Defined Benefit Pension Plans
Statement No. 80, Certain External Investment Pools and Pool Participants
Statement No. 81, Irrevocable Split-Interest Agreements
Statement No. 82, Pension Issues - an amendment of GASB Statements 67, 68, 73
Statement No. 83, Certain Asset Retirement Obligations
When they become effective, application of these standards may restate portions of these financial statements.

REQUIRED SUPPLEMENTARY INFORMATION

VarianceActual with
Adopted Revised (GAAP basis) Revised Budget
REVENUES:Property Tax Levy $ 288,037,815 $ 285,825,045 $ 285,825,045 $ - Equalization & Integration Aids 550,329,868 552,750,297 552,785,243 34,946 Other State Aids 62,334,835 72,005,730 71,956,333 (49,397)Federal Aids 14,371,039 12,554,768 16,196,591 3,641,823Other Local Revenues 12,126,545 22,804,205 26,352,965 3,548,760Applied Surplus 2,732,369 2,732,369 - (2,732,369)
SCHOOL OPERATIONS & EXTENSION 929,932,471 948,672,414 953,116,177 4,443,763
CAMP - - 5,135,422 5,135,422
GRANTS 132,238,679 144,535,497 134,110,643 (10,424,854)
Total Revenues 1,062,171,150 1,093,207,911 1,092,362,242 (845,669)
EXPENDITURES:PROGRAM ACCOUNTSHigh Schools 60,176,595 59,993,519 58,989,431 1,004,088Middle Schools 12,209,378 11,501,430 11,505,940 (4,510)K-8 Schools 105,212,392 100,141,441 100,015,364 126,077Multilevel Schools 20,162,236 19,180,974 19,453,455 (272,481)Elementary Schools 61,166,606 57,272,177 56,673,102 599,075Charter Schools 63,652,679 64,803,137 64,470,804 332,333Supplemental School Support 2,151,152 4,867,339 5,206,046 (338,707)Art, Music, Physical Education, Library 19,615,694 18,480,456 20,637,639 (2,157,183)Grant Transitional 3,162,784 3,304,409 3,290,217 14,192School Nurses 2,045,013 1,927,498 2,165,384 (237,886)Substitute Teachers 6,473,373 6,083,344 12,133,722 (6,050,378)School Office Staff, Support and School Safety 61,919,590 56,678,899 59,004,137 (2,325,238)Central Guidance 7,802,737 7,313,877 8,176,245 (862,368)Education Maintenance 2,309,718 4,210,290 4,114,410 95,880Career and Technical Education - 191,479 172,538 18,941Credit Recovery 2,628,914 2,746,175 2,566,829 179,346 Advanced Studies 622,539 989,200 618,826 370,374 Interscholastic Athletics & Academics 4,456,208 4,624,123 4,634,353 (10,230) Milwaukee County Collaborative 1,074,339 1,053,587 393,562 660,025 MPS Alternative Schools/Programs 9,184,048 8,914,010 8,314,041 599,969Itinerant Allied Health Services 5,400,003 5,247,990 5,830,489 (582,499)Special Education Services 171,758,354 161,608,751 159,870,580 1,738,171Summer School 2,809,160 3,020,422 3,174,442 (154,020)Partnership/Contracted Programs 12,296,194 13,747,113 9,474,687 4,272,426School Special and Unallotted 70,963,305 73,319,476 50,770,896 22,548,580TOTAL - PROGRAM ACCOUNTS $ 709,253,011 $ 691,221,116 $ 671,657,139 $ 19,563,977
See Independent Auditors' Report and accompanying Notes to Required Supplementary Information.
Budgeted amounts
MILWAUKEE PUBLIC SCHOOLS
Required Supplementary Information
Budgetary Comparison Schedule for the General Fund
For the Year Ended June 30, 2016
89

Variancewith
Actual Revised Adopted Revised (GAAP basis) Budget
INDIRECT & SUPPORT SERVICESBoard/Office of Board Governance $ 2,957,532 3,739,700 2,502,170 1,237,530Office of Accountability and Efficiency 1,246,768 1,412,334 901,640 510,694Office of Superintendent 809,983 878,270 823,435 54,835Office of School Administration 9,199,743 9,895,049 7,695,982 2,199,067Office of Academic 12,591,770 12,386,508 10,872,906 1,513,602Office of Finance 5,691,951 5,656,333 4,991,630 664,703Office of Operations 26,743,052 34,237,166 31,360,402 2,876,764Office of the Chief of Staff 2,968,306 3,135,297 2,510,904 624,393Office of Human Capital Services 5,355,537 6,529,108 4,985,299 1,543,809Office of Innovation 15,632,337 16,560,018 13,722,670 2,837,348TOTAL - INDIRECT & SUPPORT 83,196,979 94,429,783 80,367,038 14,062,745
OTHER ACCOUNTSBuilding Operations Sites, Tenant Costs, Utilities 54,711,662 53,775,157 51,175,309 2,599,848Debt Service 197,162 - - - District Insurance & Judgements 9,154,555 9,783,303 10,974,361 (1,191,058)Management Intern Program 492,301 459,566 236,138 223,428Safe Schools Supplement - 1,500 - 1,500Special & Contingent Funds 1,835,000 4,024,380 2,520,015 1,504,365Transportation Operations 61,715,490 61,715,691 63,153,664 (1,437,973)Regional Development - 27,591,024 17,307,852 10,283,172Technology Licenses & Equipment 10,298,582 17,999,113 17,304,294 694,819TOTAL - OTHER ACCOUNTS 138,404,752 175,349,734 162,671,633 12,678,101
DIVISION OF RECREATION AND COMMUNITY SERVICESPlaygrounds & Recreation Centers 10,630,576 11,871,911 9,728,112 2,143,799Summer School Wrap-around 5,430,818 6,498,223 5,209,241 1,288,982Educational Programs 945,536 1,323,433 735,187 588,246Partnership for the Arts/Humanities 1,751,386 2,639,227 1,807,744 831,483Facilities 2,491,435 2,519,899 1,229,350 1,290,549Insurance and Utilities 542,073 542,073 573,598 (31,525)Benefits Clearing Account 6,416 116,416 (507,131) 623,547TOTAL DIVISION OF RECREATION AND COMMUNITY SERVICES 21,798,240 25,511,182 18,776,101 6,735,081
OFFSET FOR CHARGES TO SCHOOLS AND OTHER ADJUSTMENTS TOTAL - CHARGES (39,765,243) (9,060,876) (7,835,803) (1,225,073)
SCHOOL OPERATIONS & EXT. FUND 912,887,739 977,450,939 925,636,108 51,814,831
CAMP - - 4,745,210 (4,745,210)
GRANTS 132,238,679 144,535,497 136,277,540 8,257,957
Total Expenditures 1,045,126,418 1,121,986,436 1,066,658,858 55,327,578
Excess of revenues over (under) expenditures 17,044,732 (28,778,525) 25,703,384 (54,481,909)
Transfer In (Out) (17,044,732) (12,401,214) (25,245,686) 12,844,472
Insurance Proceeds - - 173,962 (173,962)Proceeds from sale of capital assets - - 30,649 (30,649)
Change in Fund Balance $ - $ (41,179,739) 662,309 $ 41,842,048
Fund balance-beginning of year 79,636,834Fund balance-end of year $ 80,299,143
See Independent Auditors' Report and accompanying Notes to Required Supplementary Information.
Budgeted amounts
MILWAUKEE PUBLIC SCHOOLS
Required Supplementary Information
Budgetary Comparison Schedule for the General Fund
For the Year Ended June 30, 2016
90

MILWAUKEE PUBLIC SCHOOLS
Required Supplementary Information
Budgetary Comparison Schedule for the School Nutrition Services Fund
For the Year Ended June 30, 2016
Budgeted amounts Actual Variance withAdopted Revised (GAAP basis) Revised Budget
Revenues:Lunchroom sales $ 1,002,986 $ 1,002,986 $ 1,164,437 $ 161,451 Other local sources — — 394,365 394,365 State aid:
School nutrition aid 1,051,827 950,000 957,983 7,983 Federal aid:
School nutrition aid 46,657,432 46,657,432 49,598,103 2,940,671 Other federal aid 1,521,306 1,345,932 1,292,252 (53,680) Miscellaneous — — 114,350 114,350
Total revenues 50,233,551 49,956,350 53,521,490 3,565,140
Expenditures:Current operating:
School Nutrition Services 49,333,551 50,002,420 48,841,829 1,160,591 Capital Outlay 900,000 1,002,912 341,447 661,465
Total expenditures 50,233,551 51,005,332 49,183,276 1,822,056
Excess of revenues over(under)
expenditures — (1,048,982) 4,338,214 5,387,196
Net change in fund balances $ — (1,048,982) 4,338,214 5,387,196
Fund balance—beginning of year 539,429
Fund balance—end of year $ 4,877,643
See Independent Auditors' Report and accompanying Notes to Required Supplementary Information.
91
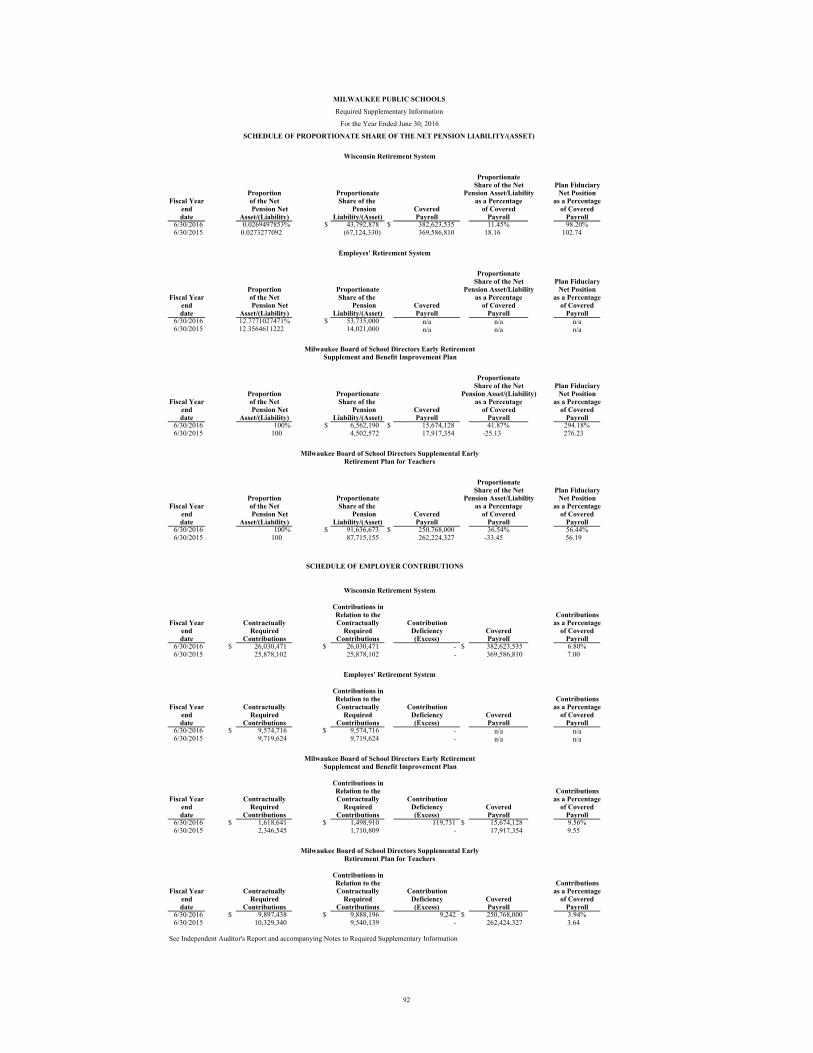
MILWAUKEE PUBLIC SCHOOLS
Required Supplementary Information
For the Year Ended June 30, 2016
SCHEDULE OF PROPORTIONATE SHARE OF THE NET PENSION LIABILITY/(ASSET)
Wisconsin Retirement System
ProportionateShare of the Net Plan Fiduciary
Proportion Proportionate Pension Asset/Liability Net PositionFiscal Year of the Net Share of the as a Percentage as a Percentage
end Pension Net Pension Covered of Covered of Covereddate Asset/(Liability) Liability/(Asset) Payroll Payroll Payroll
6/30/2016 0.0269497853% $ 43,792,878 $ 382,623,535 11.45% 98.20%6/30/2015 0.0273277092 (67,124,330) 369,586,810 18.16 102.74
ProportionateShare of the Net Plan Fiduciary
Proportion Proportionate Pension Asset/Liability Net PositionFiscal Year of the Net Share of the as a Percentage as a Percentage
end Pension Net Pension Covered of Covered of Covereddate Asset/(Liability) Liability/(Asset) Payroll Payroll Payroll
6/30/2016 12.7771027471% $ 53,735,000 n/a n/a n/a6/30/2015 12.3564611222 14,021,000 n/a n/a n/a
Milwaukee Board of School Directors Early RetirementSupplement and Benefit Improvement Plan
ProportionateShare of the Net Plan Fiduciary
Proportion Proportionate Pension Asset/(Liability) Net PositionFiscal Year of the Net Share of the as a Percentage as a Percentage
end Pension Net Pension Covered of Covered of Covereddate Asset/(Liability) Liability/(Asset) Payroll Payroll Payroll
6/30/2016 100% $ 6,562,190 $ 15,674,128 41.87% 294.18%6/30/2015 100 4,502,572 17,917,354 -25.13 276.23
Milwaukee Board of School Directors Supplemental EarlyRetirement Plan for Teachers
ProportionateShare of the Net Plan Fiduciary
Proportion Proportionate Pension Asset/Liability Net PositionFiscal Year of the Net Share of the as a Percentage as a Percentage
end Pension Net Pension Covered of Covered of Covereddate Asset/(Liability) Liability/(Asset) Payroll Payroll Payroll
6/30/2016 100% $ 91,636,673 $ 250,768,000 36.54% 56.44%6/30/2015 100 87,715,155 262,224,327 -33.45 56.19
Wisconsin Retirement System
Contributions inRelation to the Contributions
Fiscal Year Contractually Contractually Contribution as a Percentageend Required Required Deficiency Covered of Covereddate Contributions Contributions (Excess) Payroll Payroll
6/30/2016 $ 26,030,471 $ 26,030,471 - $ 382,623,535 6.80%6/30/2015 25,878,102 25,878,102 - 369,586,810 7.00
Employes' Retirement System
Contributions inRelation to the Contributions
Fiscal Year Contractually Contractually Contribution as a Percentageend Required Required Deficiency Covered of Covereddate Contributions Contributions (Excess) Payroll Payroll
6/30/2016 $ 9,574,716 $ 9,574,716 - n/a n/a6/30/2015 9,719,624 9,719,624 - n/a n/a
Milwaukee Board of School Directors Early RetirementSupplement and Benefit Improvement Plan
Contributions inRelation to the Contributions
Fiscal Year Contractually Contractually Contribution as a Percentageend Required Required Deficiency Covered of Covereddate Contributions Contributions (Excess) Payroll Payroll
6/30/2016 $ 1,618,641 $ 1,498,910 119,731 $ 15,674,128 9.56%6/30/2015 2,346,545 1,710,809 - 17,917,354 9.55
Milwaukee Board of School Directors Supplemental EarlyRetirement Plan for Teachers
Contributions inRelation to the Contributions
Fiscal Year Contractually Contractually Contribution as a Percentageend Required Required Deficiency Covered of Covereddate Contributions Contributions (Excess) Payroll Payroll
6/30/2016 $ 9,897,438 $ 9,888,196 9,242 $ 250,768,000 3.94%6/30/2015 10,329,340 9,540,139 - 262,424,327 3.64
See Independent Auditor's Report and accompanying Notes to Required Supplementary Information
SCHEDULE OF EMPLOYER CONTRIBUTIONS
Employes' Retirement System
92

Post-Employment Life and Healthcare Insurance BenefitsSchedule of Funding Progress
ActuarialAccruedLiability UAAL as a
Actuarial Actuarial (AAL) - PercentageValuation Value of Entry Age Unfunded Funded Covered of Covered
Date Assets Normal AAL (UAAL) Ratio Payroll Payroll
7/1/2015 128,837,270$ 997,489,628$ 868,652,358$ 12.9 % 376,737,589$ 230.6 %
7/1/2013 60,528,101 1,403,017,033 1,342,488,932 4.3 431,242,385 311.3 7/1/2011 9,368,067 1,393,486,064 1,384,117,997 0.7 488,996,859 283.1
Note: The District is required to present the above information for the three most recent actuarial studies.
Postemployment Health Care Plan
FiscalYear Annual Required Percentage Net OPEB
Beginning Contribution Contributed Obligation7/1/2015 87,848,228$ 60.4 % 516,178,187$ 7/1/2014 96,317,356 102.7 506,962,986 7/1/2013 109,858,625 92.9 530,646,534 7/1/2012 110,503,788 72.3 523,394,993 7/1/2011 109,216,666 84.7 520,600,193 7/1/2010 194,969,742 33.5 389,150,650 7/1/2009 186,702,017 32.7 261,946,200
For the plan year beginning July 1, 2009, there were several changes made to the assumptions from the prior valuation done. The changesinclude a change in the discount rate from 4.5% to 4.55%, less increase in healthcare costs then the trend previously used, and a change indemographic assumptions, including less retirements and less new actives than expected.
See Independent Auditors' Report and accompanying Notes to Required Supplementary Information.
Schedule of Employer Contributions
For the Year Ended June 30, 2016
MILWAUKEE PUBLIC SCHOOLSRequired Supplementary Information
93

MILWAUKEE PUBLIC SCHOOLS
Required Supplementary Information
Year ended June 30, 2016
94
(1) Budgeting
Annual appropriated budgets are adopted for the general, special revenue and debt service funds by June 30th each year. Budgets are adopted for the construction fund on a project-length basis. Budgets are adopted on a modified accrual basis of accounting consistent with accounting principles generally accepted in the United States of America, except for the treatment of encumbrances (see below) and property tax revenues. Property tax revenues are budgeted based on the amount levied.
In accordance with the Wisconsin Department of Public Instruction’s reporting requirements, the Board exercises control over budgeted amounts at the responsibility center level within the general, special revenue, and debt service funds. The capital projects fund is controlled at the project level. During the year, budgets can be amended by approval of a majority of the members of the board.
As a management practice, the superintendent, or his or her designee, may transfer funds between functions at the department, school, or program level subject to the following criteria:
The transaction does not exceed $100,000
Is not initiated by a Board member
Will not effectuate a change in policy
Will not create a new area of activity for the District
Does not increase authorized staffing levels
Does not move monies between statutory funds
Board policy requires that all annual appropriations lapse at fiscal year-end except for the following: excess budgetary authority for capital project funds lapse when a specific project is completed; deficits incurred automatically reduce the subsequent year’s budget appropriations; and, with school board approval, schools are allowed to carry over appropriations into the following year up to a maximum of 1.0% of the total revised school budget each year and appropriations for special projects or planned purchases may be carried into the subsequent year.
(2) Wisconsin Retirement System (WRS) Pension
The amounts presented in relation to the schedule of employer’s proportionate share of the net pension asset and the schedule of employer contributions represents the specific data of the District. The information was derived using a combination of the employer’s contribution data along with data provided by the Wisconsin Retirement System in relation to the District as a whole.
Changes of benefit terms. There were no changes of benefit terms for any participating employer in WRS.
Changes of assumptions. There were no changes in the assumptions.
The District is required to present the last ten fiscal years data; however, the standards allow the District to present as many years as are available until ten fiscal years are presented.

MILWAUKEE PUBLIC SCHOOLS
Required Supplementary Information
Year ended June 30, 2016
95
(3) Employes’ Retirement System (ERS)
The amounts presented in relation to the schedule of employer’s proportionate share of the net pension asset/liability and the schedule of employer contributions represents the specific data of the District. The information was derived using a combination of the employer’s contribution data along with data provided by the ERS in relation to the District as a whole.
Changes of benefit terms. There were no changes of benefit terms for any participating employer in WRS.
Changes of assumptions. There were no changes in the assumptions
The District is required to present the last ten fiscal years data; however, the standards allow the District to present as many years as are available until ten fiscal years are presented.
(4) Supplemental Retirement Plans
The amounts presented in relation to the schedule of employer’s proportionate share of the net pension asset/liability and the schedule of employer contributions represents the specific data of the District. The information was derived using the employer’s contribution data.
Changes of benefit terms. There were no changes of benefit terms.
Changes of assumptions. There were no changes in the assumptions
The District is required to present the last ten fiscal years data; however, the standards allow the District to present as many years as are available until ten fiscal years are presented.

COMBINING AND INDIVIDUAL FUND STATEMENTS
AND SCHEDULES

This page intentionally left blank

MILWAUKEE PUBLIC SCHOOLS
Nonmajor Governmental Funds
96
Special Revenue Funds
Special revenue funds are used and report the proceeds of specific revenue sources other than debt service or capital projects that are restricted or committed to expenditure for particular purposes. These funds include the following:
Categorically Aided Programs Fund—This fund is used to account for proceeds from federal grants that provide emphasis on social and curriculum needs of special populations within the District.
Debt Service Fund
Debt Service Fund—This fund is used to account and report financial resources that are restricted, committed or assigned to expenditures for the payment of general long-term debt principal, interest and related costs.

MILWAUKEE PUBLIC SCHOOLS
Combining Balance Sheet—Nonmajor Governmental Funds
As of June 30, 2016
CategoricallyAided Debt
Assets Programs Service Total
Receivables due fromother governmental units $ 3,591,198 — 3,591,198
Total assets $ 3,591,198 — 3,591,198
Liabilities and Fund Balances
Liabilities:Accounts Payable $ 42,494 — 42,494 Due to other funds 3,548,704 — 3,548,704
Total liabilities 3,591,198 — 3,591,198
Fund balances:Restricted — — —
Total fund balances — — —
Total liabilities and fund balances $ 3,591,198 — 3,591,198
Special Revenue
97

MILWAUKEE PUBLIC SCHOOLS
Combining Statement of Revenues, Expenditures, and Changes in FundBalances—Nonmajor Governmental Funds
For the Year Ended June 30, 2016
CategoricallyAided Debt
Programs Service Total
Revenues:Property taxes $ — 4,209,121 4,209,121 Federal aid:
Other federal aid 17,217,042 — 17,217,042
Total revenues 17,217,042 4,209,121 21,426,163
Expenditures:Instructional services—
special curriculum 4,709,472 — 4,709,472 Pupil and staff services 12,507,570 — 12,507,570 Debt service:
Principal — 14,648,669 14,648,669 Interest — 14,797,376 14,797,376 Bond administrative fees — 8,762 8,762
Total expenditures 17,217,042 29,454,807 46,671,849
Excess of revenues over(under) expenditures — (25,245,686) (25,245,686)
Other financing sources:Transfers In — 25,245,686 25,245,686
Total other financingsources, net — 25,245,686 25,245,686
Net changes in fundbalances — — —
Fund balances:Beginning of year — — —
End of year $ — — —
Special Revenue
98

MILWAUKEE PUBLIC SCHOOLS
Categorically Aided Programs Fund
Schedule of Revenues, Expenditures, and Changes in Fund Balance—Budget and Actual
For the Year Ended June 30, 2016
Budgeted amounts ActualAdopted Revised (GAAP basis)
Revenues:Federal aid:
Other federal aid $ 21,426,978 21,426,978 17,217,042
Total revenues 21,426,978 21,426,978 17,217,042
Expenditures:Current operating:
Special curriculum 5,861,039 5,861,039 4,709,472 Pupil and staff services 15,565,939 15,565,939 12,507,570
Total expenditures 21,426,978 21,426,978 17,217,042
Net change in fund balance $ — — —
Fund balance—beginning of year —
Fund balance—end of year $ —
99
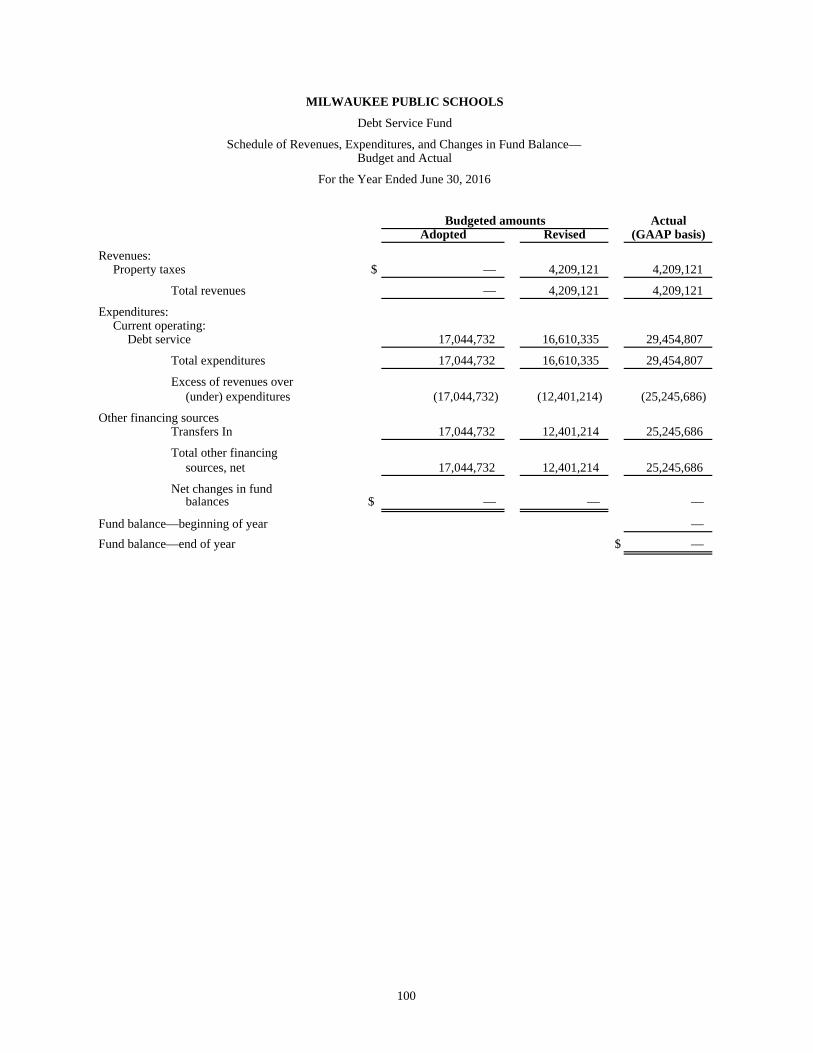
MILWAUKEE PUBLIC SCHOOLS
Debt Service Fund
Schedule of Revenues, Expenditures, and Changes in Fund Balance—Budget and Actual
For the Year Ended June 30, 2016
Budgeted amounts ActualAdopted Revised (GAAP basis)
Revenues:Property taxes $ — 4,209,121 4,209,121
Total revenues — 4,209,121 4,209,121
Expenditures:Current operating:
Debt service 17,044,732 16,610,335 29,454,807
Total expenditures 17,044,732 16,610,335 29,454,807
Excess of revenues over(under) expenditures (17,044,732) (12,401,214) (25,245,686)
Other financing sourcesTransfers In 17,044,732 12,401,214 25,245,686
Total other financingsources, net 17,044,732 12,401,214 25,245,686
Net changes in fundbalances $ — — —
Fund balance—beginning of year —
Fund balance—end of year $ —
100

This page intentionally left blank.

MILWAUKEE PUBLIC SCHOOLS
Fiduciary Funds
101
Pension Trust Funds
The pension trust funds are used to account for resources that are required to be held in trust for the members and beneficiaries of defined benefit pension plans. These funds include the following:
Milwaukee Board of School Directors Early Retirement Supplemental and Benefit Improvement Plan—This fund is used to account for the accumulation of resources for pension benefit payments for early retirement plans maintained by the District for qualified administrators.
Milwaukee Board of School Directors Supplemental Early Retirement Plan for Teachers—This fund is used to account for the accumulation of resources for pension benefit payments for early retirement plans maintained by the District for qualified teachers.
Other Post Employment Benefits Trust—This fund is used to account for assets used to pay post employment benefits or fund accrued liability associated with such benefits.
Agency Fund
The agency fund collects and disburses cash and investments for student organizations and activities through district schools that act in the capacity of an agent of such funds.

MILWAUKEE PUBLIC SCHOOLS
Combining Statement of Net Position—Pension and Other Post Employment Benefits Trust Funds
As of June 30, 2016
MilwaukeeBoard ofSchool Milwaukee
Directors Board ofEarly School
Retirement DirectorsSupplement Supplementaland Benefit Early Other Post
Improvement Retirement Plan EmploymentPlan for Teachers Benefits trust Total
Assets
InvestmentsMoney market accounts $ 1,388,538 3,203,177 75,257,467 79,849,182 U.S. treasury and agency securities — — 17,300,088 17,300,088 Mortgage-backed securities 69 — — 69 Nongovernmental obligations 2,533,101 7,178,047 22,191,128 31,902,276 Municipal Bonds — — 1,447,259 1,447,259 Investment in the State of Wisconsin 42,606,775 132,534,384 — 175,141,159
Receivables-interest and contributions 4,079 10,297 11,338,602 11,352,978
Total assets 46,532,562 142,925,905 127,534,544 316,993,011
LiabilitiesAccounts payable and accrued expenses 421,796 1,397,096 3,426,326 5,245,218
Total liabilities 421,796 1,397,096 3,426,326 5,245,218
Net PositionNet position restricted for pensions $ 46,110,766 141,528,809 124,108,218 311,747,793
102

MILWAUKEE PUBLIC SCHOOLS
Combining Statement of Changes in Net Position—Pension and Other Post Employment Benefits Trust Funds
For the Year Ended June 30, 2016
MilwaukeeBoard of MilwaukeeSchool Board of
Directors SchoolEarly Directors
Retirement SupplementalSupplement Earlyand Benefit Retirement Other Post
Improvement Plan EmploymentPlan for Teachers Benefits trust Total
Additions:Employer contributions $ 1,498,910 9,888,196 45,608,729 56,995,835 Participants contributions — — 9,100,339 9,100,339 Investment income:
Net investment from the State of Wisconsin:Core Retirement Investment Trust Fund 365,044 1,050,799 — 1,415,843 Variable Retirement Trust Fund (91,466) (236,385) — (327,851)
Net investment income from other investments 77,507 163,404 1,503,897 1,744,808 Total investment income: 351,085 977,818 1,503,897 2,832,800
Investment expenses (5,759) (13,806) — (19,565) Net investment income 345,326 964,012 1,503,897 2,813,235
Total additions 1,844,236 10,852,208 56,212,965 68,909,409
Deductions:Benefits paid to participant's or beneficiaries 5,145,099 16,607,340 57,326,162 79,078,601 Distribution of participant contribution accounts 19,399 — — 19,399 Administrative expenses 62,511 174,658 82,110 319,279
Total deductions 5,227,009 16,781,998 57,408,272 79,417,279
Changes in net position (3,382,773) (5,929,790) (1,195,307) (10,507,870)
Net Position—Beginning of Year 49,493,539 147,458,599 125,303,525 322,255,663
Net Position—Ending of Year $ 46,110,766 141,528,809 124,108,218 311,747,793
103
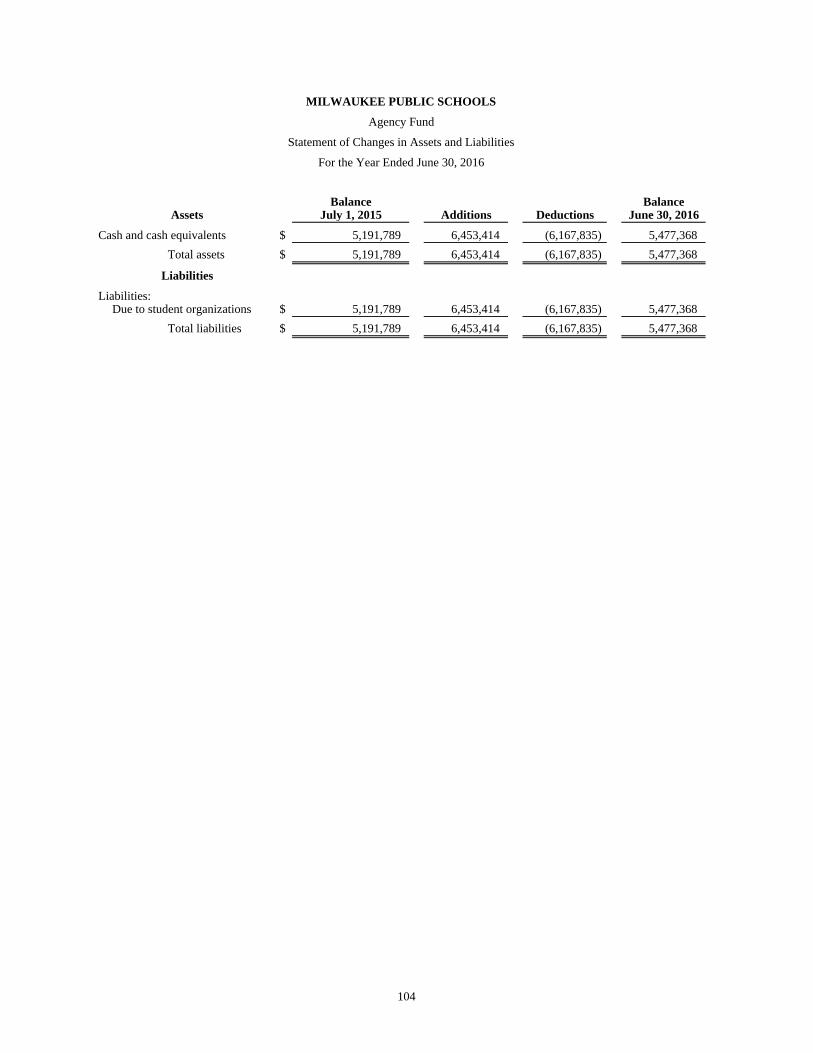
MILWAUKEE PUBLIC SCHOOLS
Agency Fund
Statement of Changes in Assets and Liabilities
For the Year Ended June 30, 2016
Balance BalanceAssets July 1, 2015 Additions Deductions June 30, 2016
Cash and cash equivalents $ 5,191,789 6,453,414 (6,167,835) 5,477,368
Total assets $ 5,191,789 6,453,414 (6,167,835) 5,477,368
Liabilities
Liabilities:Due to student organizations $ 5,191,789 6,453,414 (6,167,835) 5,477,368
Total liabilities $ 5,191,789 6,453,414 (6,167,835) 5,477,368
104

INTR
OD
UC
TOR
Y SEC
TION
FINA
NC
IAL SE
CTIO
N STA
TISTICA
L SECTIO
N

105
STATISTICAL SECTION
This part of the Milwaukee Public Schools’ comprehensive annual financial report presents detailed information as a context for understanding what the information in the financial statements, note disclosures, and required supplementary information says about the government’s overall financial health.
Contents Page Financial Trends
These schedules contain trend information to help the reader understand 106-109 how the government’s financial performance and well-being have changed over time. Revenue Capacity
These schedules contain information to help the reader assess the govern- 110-115 ment’s most significant local revenue source, the property tax.
Debt Capacity These schedules present information to help the reader assess the affordability 116-118 of the government’s current levels of outstanding debt and the government’s
ability to issue additional debt in the future. Demographic and Economic Information These schedules offer demographic and economic indicators to help the reader 119-123
understand the environment within which the government’s financial activities take place.
Operating Information These schedules contain service and infrastructure data to help the reader 124-134
understand how the information in the government’s financial report relates to the services the government provides and the activities it performs.
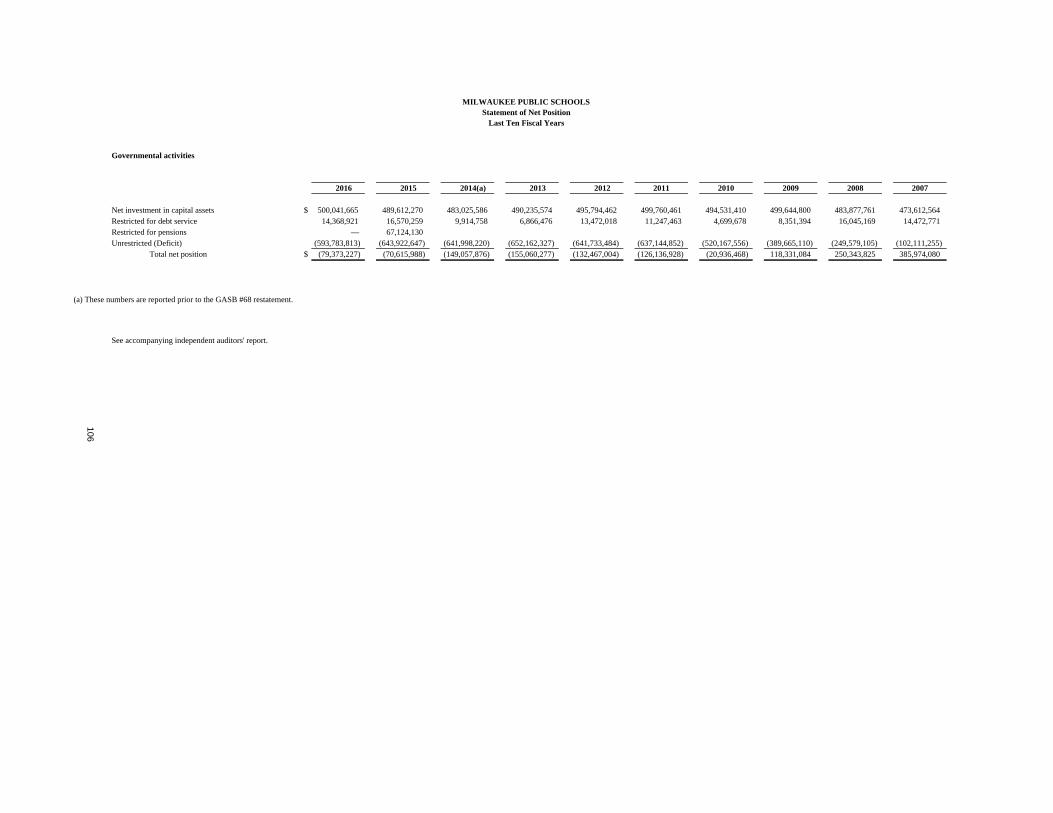
2016 2015 2014(a) 2013 2012 2011 2010 2009 2008 2007
$ 500,041,665 489,612,270 483,025,586 490,235,574 495,794,462 499,760,461 494,531,410 499,644,800 483,877,761 473,612,564 Restricted for debt service 14,368,921 16,570,259 9,914,758 6,866,476 13,472,018 11,247,463 4,699,678 8,351,394 16,045,169 14,472,771 Restricted for pensions — 67,124,130 Unrestricted (Deficit) (593,783,813) (643,922,647) (641,998,220) (652,162,327) (641,733,484) (637,144,852) (520,167,556) (389,665,110) (249,579,105) (102,111,255)
Total net position $ (79,373,227) (70,615,988) (149,057,876) (155,060,277) (132,467,004) (126,136,928) (20,936,468) 118,331,084 250,343,825 385,974,080
(a) These numbers are reported prior to the GASB #68 restatement.
See accompanying independent auditors' report.
106
MILWAUKEE PUBLIC SCHOOLS
Last Ten Fiscal Years
Governmental activities
Net investment in capital assets
Statement of Net Position

2016 2015 2014 2013 2012 2011 2010 2009 2008 2007
Expenses: Instruction $ 681,195,330 647,364,824 666,593,314 714,036,147 685,589,990 863,184,570 887,815,447 864,409,791 826,151,034 676,103,840 Support services: Community services 27,789,456 29,311,872 27,612,053 30,536,990 26,041,483 27,499,000 25,538,287 25,574,386 19,658,453 20,110,243 Pupil and staff services 128,939,561 131,798,496 127,673,917 130,189,957 135,648,452 160,715,900 143,517,392 138,220,288 132,463,255 122,202,632 General, administration, and central services 112,898,587 98,125,128 101,276,207 103,502,882 113,952,373 117,817,193 132,145,392 118,454,437 117,404,599 111,430,021 Business services 169,413,167 160,678,353 167,752,510 149,452,181 154,701,665 169,960,141 159,725,009 161,738,970 176,006,641 162,219,265 School nutrition services 50,101,295 47,234,192 43,656,550 44,945,680 44,527,282 44,205,351 40,555,069 40,891,942 40,654,079 36,515,840 Interest on long-term debt 17,660,687 16,331,690 20,088,560 16,147,608 17,790,345 17,926,945 17,166,361 16,181,174 16,771,008 18,130,489 Loss on sale/disposal of assets - - - 260,129 4,028,012 - - - - -
Total support services $ 506,802,753 483,479,731 488,059,797 475,035,427 496,689,612 538,124,530 518,647,510 501,061,197 502,958,035 470,608,490
Total expenses $ 1,187,998,083 1,130,844,555 1,154,653,111 1,189,071,574 1,182,279,602 1,401,309,100 1,406,462,957 1,365,470,988 1,329,109,069 1,146,712,330
Program revenues: Charges for services: Instruction $ 8,619,364 7,144,293 7,347,485 6,135,034 4,897,115 5,270,970 4,668,475 5,508,572 9,168,741 8,224,655 Community services 4,365,200 4,144,116 1,904,323 1,789,570 1,844,915 1,981,562 2,022,823 1,994,701 2,333,636 2,934,878 Business services 5,398,788 5,068,641 4,899,266 3,230,905 2,613,852 1,962,560 1,755,862 2,000,182 1,571,882 296,678 Nutrition services 1,164,444 802,764 3,127,925 2,933,140 3,027,221 3,233,097 3,900,398 4,186,989 3,915,031 3,991,342 Operating grants and contributions: Instruction 184,229,896 201,995,731 202,656,277 218,784,528 218,860,380 284,307,386 288,369,454 314,249,488 211,544,865 187,252,284 Community services 5,559,121 6,141,526 5,865,138 6,689,857 6,286,075 6,693,672 7,218,268 8,472,311 6,389,186 6,031,898 Pupil and staff services 18,367,601 22,295,180 20,743,806 17,344,944 27,257,411 16,187,840 15,608,318 15,106,248 10,811,749 3,679,418 Business services 5,580,111 7,056,988 6,747,421 6,045,771 6,758,686 7,058,695 6,631,649 7,140,808 6,867,633 2,779,926 Nutrition services 52,242,705 49,190,624 41,820,458 39,875,043 39,259,843 39,640,325 37,770,914 34,803,122 32,462,000 30,879,192 Capital grants and contributions: Instruction 16,348,227 849,132 3,546,175 6,491,624 3,244,501 11,532,654 11,118,264 1,698,541 10,906,976 5,371,128
Total program revenues $ 301,875,457 304,688,995 298,658,274 309,320,416 314,049,999 377,868,761 379,064,425 395,160,962 295,971,699 251,441,399
Net (expense)/revenue $ (886,122,626) (826,155,560) (855,994,837) (879,751,158) (868,229,603) (1,023,440,339) (1,027,398,532) (970,310,026) (1,033,137,370) (895,270,931) 107
General revenues and other changes in net position: Taxes: Property taxes levied for general purposes $ 268,759,174 271,012,144 270,306,782 269,493,379 270,368,281 259,744,794 274,190,085 257,763,742 223,761,147 192,891,583 Property taxes levied for construction 10,600,000 9,600,000 9,600,000 8,619,687 5,127,012 14,729,342 9,074,793 17,001,718 16,975,373 14,580,539 Property taxes levied for debt service 4,209,121 4,600,529 2,477,582 5,426,145 5,475,630 5,698,454 2,342,002 1,870,414 - 13,546,414 Property taxes levied for community services 17,065,872 17,065,872 17,065,871 17,065,871 16,815,871 13,334,418 10,226,234 11,142,826 10,340,610 9,327,455 Other taxes 810,337 1,837,208 53,662 32,559 533,466 1,729,836 59,021 49,468 133,509 2,369,741 Federal and state aid not restricted to a specific purpose: General (equalization aid) 509,173,092 505,323,745 500,659,964 494,557,826 496,690,640 544,914,729 514,990,790 469,912,641 570,812,646 586,583,661 Other 61,046,450 58,305,357 58,682,525 58,969,122 63,378,858 73,161,388 75,412,753 78,351,979 70,601,690 71,253,170 Interest and investment earnings 4,349,251 2,913,071 2,541,815 254,662 224,216 289,979 759,476 1,159,402 2,496,060 3,535,723 Gain on sales of fixed assets 332,510 - 111,363 113,881 - - - 817,921 - Other 1,019,580 932,736 497,674 2,624,753 3,285,553 4,636,939 1,075,826 1,045,095 - 916,544
Total general revenues $ 877,365,387 871,590,662 861,997,238 857,157,885 861,899,527 918,239,879 888,130,980 838,297,285 895,938,956 895,004,830
Change in net position $ (8,757,239) 45,435,102 6,002,401 (22,593,273) (6,330,076) (105,200,460) (139,267,552) (132,012,741) (137,198,414) (266,101)
See accompanying independent auditors' report.
MILWAUKEE PUBLIC SCHOOLSChanges in Net PositionLast Ten Fiscal Years
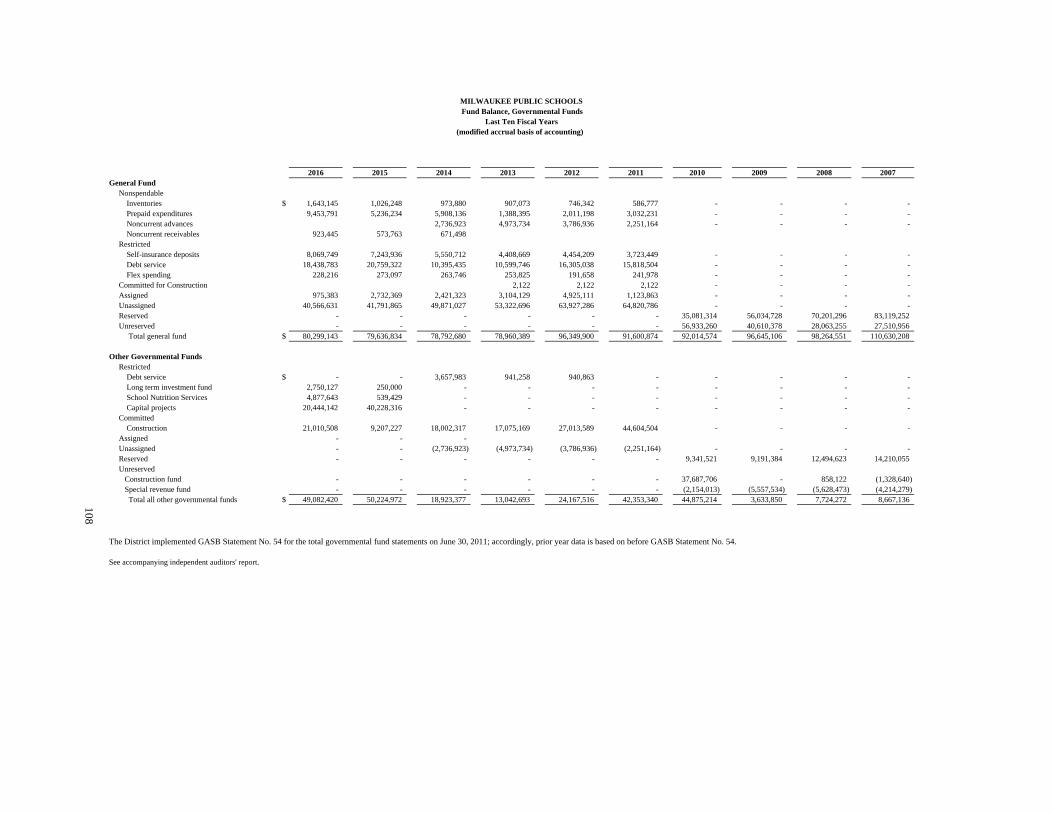
2016 2015 2014 2013 2012 2011 2010 2009 2008 2007General Fund Nonspendable Inventories $ 1,643,145 1,026,248 973,880 907,073 746,342 586,777 - - - - Prepaid expenditures 9,453,791 5,236,234 5,908,136 1,388,395 2,011,198 3,032,231 - - - - Noncurrent advances 2,736,923 4,973,734 3,786,936 2,251,164 - - - - Noncurrent receivables 923,445 573,763 671,498 Restricted Self-insurance deposits 8,069,749 7,243,936 5,550,712 4,408,669 4,454,209 3,723,449 - - - - Debt service 18,438,783 20,759,322 10,395,435 10,599,746 16,305,038 15,818,504 - - - - Flex spending 228,216 273,097 263,746 253,825 191,658 241,978 - - - - Committed for Construction 2,122 2,122 2,122 - - - - Assigned 975,383 2,732,369 2,421,323 3,104,129 4,925,111 1,123,863 - - - - Unassigned 40,566,631 41,791,865 49,871,027 53,322,696 63,927,286 64,820,786 - - - - Reserved - - - - - - 35,081,314 56,034,728 70,201,296 83,119,252 Unreserved - - - - - - 56,933,260 40,610,378 28,063,255 27,510,956 Total general fund $ 80,299,143 79,636,834 78,792,680 78,960,389 96,349,900 91,600,874 92,014,574 96,645,106 98,264,551 110,630,208
Other Governmental Funds Restricted Debt service $ - - 3,657,983 941,258 940,863 - - - - - Long term investment fund 2,750,127 250,000 - - - - - - - - School Nutrition Services 4,877,643 539,429 - - - - - - - - Capital projects 20,444,142 40,228,316 - - - - - - - - Committed Construction 21,010,508 9,207,227 18,002,317 17,075,169 27,013,589 44,604,504 - - - - Assigned - - - Unassigned - - (2,736,923) (4,973,734) (3,786,936) (2,251,164) - - - - Reserved - - - - - - 9,341,521 9,191,384 12,494,623 14,210,055 Unreserved Construction fund - - - - - - 37,687,706 - 858,122 (1,328,640) Special revenue fund - - - - - - (2,154,013) (5,557,534) (5,628,473) (4,214,279) Total all other governmental funds $ 49,082,420 50,224,972 18,923,377 13,042,693 24,167,516 42,353,340 44,875,214 3,633,850 7,724,272 8,667,136 108
The District implemented GASB Statement No. 54 for the total governmental fund statements on June 30, 2011; accordingly, prior year data is based on before GASB Statement No. 54.
See accompanying independent auditors' report.
MILWAUKEE PUBLIC SCHOOLSFund Balance, Governmental Funds
Last Ten Fiscal Years (modified accrual basis of accounting)

2016 2015 2014 2013 2012 2011 2010 2009 2008 2007
Revenues:
Property tax levy $ 300,634,166 302,278,545 299,450,235 300,605,082 297,786,794 293,507,008 295,833,114 287,778,700 251,077,130 230,345,991
Other taxes 810,337 72,837 79,171 75,084 104,824 108,820 97,291 92,608 88,839 291,341
Lunchroom sales 1,164,437 802,753 3,112,692 2,924,898 2,943,482 3,226,519 3,853,462 4,180,102 3,774,957 3,875,772
Other local sources 24,708,014 20,881,176 17,998,591 15,033,619 11,680,793 11,836,869 10,288,493 12,686,419 16,967,736 11,729,344
Microsoft Settlement Refunds 5,918,672 — 1,557,605 4,492,796 278,642 6,706,515 6,796,310 — — —
State aid:
Equalization aid 509,173,092 505,323,745 500,659,964 494,557,826 496,690,640 544,914,729 514,990,790 469,912,641 570,812,646 586,583,661
Special classes 50,423,437 53,338,018 53,565,720 51,792,301 54,013,275 49,429,225 46,323,816 47,564,912 42,288,233 39,265,952
Integration 31,692,817 32,247,348 33,522,834 34,178,357 35,235,721 39,158,028 40,804,682 41,276,129 41,864,808 45,208,452
Other state aid 59,234,848 60,425,803 52,813,148 51,039,137 48,365,268 72,947,102 73,460,777 76,658,767 55,720,015 51,424,988
Federal aid:
Education Consolidation Improvement Act 68,908,095 77,649,649 89,387,237 96,038,429 106,765,706 121,910,586 121,231,450 102,207,198 81,727,901 70,566,992
School nutrition services 49,598,103 46,739,199 40,115,810 38,289,523 37,629,945 38,163,553 36,525,598 33,501,200 31,387,925 30,114,964
Erate refunds 9,682,625 — — 52,666 2,753,269 3,346,923 1,920,868 1,751,957 3,638,805 1,661,683
Other federal aid 61,369,218 69,073,018 69,125,693 70,965,810 82,063,530 102,780,085 111,175,815 157,572,767 79,462,513 69,013,674
Intergovernmental aid from the City of Milwaukee — — — — — — 191,000 — 6,000,000 —
Miscellaneous 1,284,082 1,231,850 567,085 3,190,257 3,346,721 4,533,161 1,222,859 932,475 816,009 916,544
Interest and investment earnings 4,349,251 2,913,071 2,541,815 218,550 224,215 289,981 759,476 1,159,402 2,496,060 3,535,721
Total revenues $ 1,178,951,194 1,172,977,012 1,164,497,600 1,163,454,335 1,179,882,825 1,292,859,104 1,265,475,801 1,237,275,277 1,188,123,577 1,144,535,079
Expenditures:
Instructional services:
Undifferentiated curriculum $ 339,332,220 346,521,378 350,611,296 364,488,175 379,231,430 408,281,267 419,013,141 426,468,415 420,350,045 420,196,158
Regular and other curriculum 136,707,351 137,364,946 140,829,291 147,099,479 129,989,610 153,723,073 162,055,281 152,019,378 139,085,524 113,231,381
Special curriculum 152,478,100 162,957,532 167,157,217 170,451,744 158,713,453 169,704,527 158,358,450 141,682,491 128,758,524 126,898,396
Total instructional services 628,517,671 646,843,856 658,597,804 682,039,398 667,934,493 731,708,867 739,426,872 720,170,284 688,194,093 660,325,935
Community services 27,347,401 29,162,858 26,962,332 29,146,352 24,841,805 23,467,701 23,184,162 23,482,483 19,337,638 20,022,461
Pupil and staff services 126,867,497 132,154,096 126,212,196 127,419,348 132,786,434 158,034,350 141,633,899 136,274,148 130,014,574 120,056,089
General and school building administration 111,159,224 99,027,539 99,204,832 101,012,616 111,351,669 118,430,195 128,618,542 118,520,404 112,066,634 109,867,741
Business services 169,127,014 160,159,754 163,583,290 161,469,675 155,497,490 170,709,794 160,335,051 161,983,843 154,214,637 160,817,367
School nutrition services 48,841,829 46,653,985 42,699,913 43,938,860 43,525,912 43,247,754 39,803,908 39,547,617 38,476,566 35,782,244
Capital Outlay 38,460,201 39,116,285 14,690,949 21,948,535 34,504,618 21,847,799 19,371,066 21,845,269 38,476,566 27,701,230
Debt service:
Principal 14,648,669 21,671,993 12,955,845 67,860,692 11,374,372 14,099,135 18,929,274 11,849,070 11,037,918 14,931,291
Interest 14,797,376 13,523,580 13,963,568 14,312,624 14,528,046 14,176,335 13,261,491 13,407,173 13,698,240 14,426,612
Bond issuance cost 8,762 61,999 36,434 528,668 34,769 111,525 2,113,376 33,858 480,561 625,649
Other — — — — — — — — — —
Total expenditures $ 1,179,775,644 1,188,375,945 1,158,907,163 1,249,676,768 1,196,379,608 1,295,833,455 1,286,677,641 1,247,114,149 1,205,997,427 1,164,556,619
Excess of revenues over (under)
expenditures $ (824,450) (15,398,933) 5,590,437 (86,222,433) (16,496,783) (2,974,351) (21,201,840) (9,838,872) (17,873,850) (20,021,540)
Other financing sources (uses) (note 7):
Long-Term Debt Issued $ — — 49,300,000 4,050,000 — —
Proceeds from qualified zone academy bonds — — — — — — — — — 1,078,100
Proceeds from Sale of Assets 120,245 1,406,273 122,538 183,585 3,059,985 38,777 287,395 — — —
Premium on debt issued — 387,058 — 7,415,704 — — — — — —
Proceeds from capital leases — 38,000,000 — — — — 11,504,297 — — —
Insurance proceeds 223,962 843,560 — — — — 60,980 79,005 2,997,170 1,000,000
Refunding bond debt issued — 6,907,791 — 50,108,810 — — 11,020,000 — — 31,865,000
Payment for refunded bond debt — — — — — — (14,360,000) — — (30,982,607)
Discount on debt issued — — — — — — — — — (338,503)
Total other financing sources (uses), net $ 344,207 47,544,682 122,538 57,708,099 3,059,985 38,777 57,812,672 4,129,005 2,997,170 2,621,990
Net change in fund balance $ (480,243) 32,145,749 5,712,975 (28,514,334) (13,436,798) (2,935,574) 36,610,832 (5,709,867) (14,876,680) (17,399,550)
Debt service as a percentage of noncapital expenditures 2.6% 3.2% 2.4% 7.2% 2.3% 2.3% 2.8% 2.1% 2.2% 2.7%
See accompanying independent auditors' report.
Source of information Statement of Revenues, Expenditures, and Changes in Fund Balance statement.
MILWAUKEE PUBLIC SCHOOLSChanges in Fund Balance, Governmental Funds, and Debt Service Ratios
Last Ten Fiscal Years
(modified accrual basis of accounting)
109

MILWAUKEE PUBLIC SCHOOLS
Assessed and Equalized Valuation—City of Milwaukee
(in thousands)
The assessed and equalized valuations for the past 30 years are shown below.
Assessedvaluationincrease
(decrease)Assessed Assessed over prior Equalized
Year valuation years valuation
1986 ...................………………………. $ 11,140,003 $ 63,029 $ 11,181,029
1987 ...................………………………. 11,303,217 163,214 11,709,716
1988 ...................………………………. 11,865,999 562,782 12,002,681
1989 ...................………………………. 12,017,462 151,463 12,648,530
1990 ...................………………………. 12,614,531 597,069 12,808,708
1991 ...................………………………. 12,701,237 86,706 13,189,084
1992 ...................………………………. 13,336,770 635,533 13,279,156
1993 ...................………………………. 13,345,968 9,198 14,047,985
1994 ...................………………………. 14,029,734 683,766 14,363,706
1995 ...................………………………. 13,976,649 (53,085) 14,821,109
1996 ...................………………………. 14,850,607 873,958 15,041,199
1997 ...................………………………. 14,914,137 63,530 15,511,857
1998 ...................………………………. 16,072,114 1,157,977 16,228,218
1999 ...................………………………. 15,773,850 (298,264) 16,701,225
2000 ...................………………………. 17,582,995 1,809,145 17,344,251
2001 ...................………………………. 17,699,784 116,789 19,453,830
2002 ...................………………………. 19,866,255 2,166,471 20,298,387
2003 ...................………………………. 21,009,517 1,143,262 21,730,754
2004 ...................………………………. 22,772,419 1,762,902 23,491,773
2005 ...................………………………. 25,222,149 2,449,730 26,256,714
2006 ...................………………………. 28,354,952 3,132,803 30,226,984
2007 ...................………………………. 29,374,373 1,019,421 31,887,192
2008 ...................………………………. 30,431,675 1,057,302 32,257,525
2009 ...................………………………. 28,944,573 (1,487,102) 31,266,329
2010 ...................………………………. 28,048,464 (896,109) 29,520,783
2011 ...................………………………. 27,917,642 (130,822) 27,954,670
2012 ...................………………………. 25,322,101 (2,595,541) 26,421,932
2013 ...................………………………. 25,034,158 (287,943) 26,089,611
2014 ...................………………………. 25,024,542 (9,616) 26,138,108
2015 ...................………………………. 25,262,963 238,421 25,980,470
Source: Assessed valuation is determined by the City of Milwaukee, Assessor’s Office.Equalized valuation is determined by the State of Wisconsin Department of Revenue. Both theassessed valuation and the equalized valuation include Tax Incremental Financing Districts.
110

MILWAUKEE PUBLIC SCHOOLS
Property Tax Rates—Direct and Overlapping Government
Last Ten Years
Milwaukee Area MilwaukeeDistrict Board of Metropolitan
Budget Milwaukee City of Vocational, Technical, County of State of Sewerageyear School Board (B) Milwaukee (A) and Adult Education Milwaukee Wisconsin District Total (C)
TAX RATES PER $1,000 OF ASSESSED VALUE AND PERCENT OF TOTAL
2006 8.35$ 34.1 % 8.08$ 33.0 % 1.96$ 8.0 % 4.43$ 18.1 % 0.20$ 0.8 % 1.48$ 6.0 % 24.50$ 100.0 %2007 7.48 33.4 7.28 32.5 1.89 8.4 4.18 18.7 0.19 0.8 1.39 6.2 22.41 100.02008 7.96 34.4 7.46 32.2 1.92 8.3 4.22 18.3 0.19 0.8 1.39 6.0 23.14 100.02009 8.75 36.3 7.59 31.6 1.94 8.1 4.20 17.5 0.18 0.8 1.37 5.7 24.03 100.02010 9.41 36.2 8.42 32.4 2.06 8.0 4.48 17.2 0.18 0.7 1.43 5.5 25.98 100.02011 9.49 35.7 8.67 32.6 2.02 7.6 4.69 17.7 0.18 0.7 1.52 5.7 26.57 100.02012 9.69 36.0 8.86 32.9 1.95 7.3 4.72 17.6 0.17 0.6 1.51 5.6 26.90 100.02013 10.73 35.8 9.87 33.0 2.21 7.4 5.26 17.5 0.18 0.6 1.70 5.7 29.95 100.02014 10.86 35.5 10.23 33.4 2.22 7.2 5.35 17.5 0.18 0.6 1.78 5.8 30.62 100.02015 10.93 36.5 10.42 34.7 1.33 4.4 5.33 17.8 0.17 0.6 1.79 6.0 29.97 100.0(A) State law prohibits the City from raising property taxes more than 2% plus 60% growth of new development.(B) Overlapping rates are those of local and county governments that apply to property owners within the City of Milwaukee.(C) Tax rates were constructed considering the provision of the tax incremental district law. The application of these rates to the applicable assessed values will provide a tax yield higher
than the levy.111
Source: City of Milwaukee CAFR

MILWAUKEE PUBLIC SCHOOLS
Tax Rates for School Purposes
Last Ten Years(per $1,000 of Assessed Value )
Budget School Year (a) Operations Construction Extension Total(b)
$ 6.07 $ 0.43 $ 0.27 $ 6.776.60 0.50 0.31 7.417.44 0.49 0.32 8.258.36 0.53 0.35 8.948.18 0.28 0.31 9.058.61 0.47 0.42 9.309.47 0.30 0.59 10.359.61 0.30 0.60 10.519.71 0.34 0.61 10.669.29 0.33 0.58 10.20
112
Budget School Year (a) Operations Construction Extension Total
$ 206,437,997 $ 14,580,539 $ 9,327,455 $ 230,345,991 223,761,147 16,975,373 10,340,610 251,077,130 259,634,156 17,001,718 11,142,826 287,778,700 276,532,087 9,074,793 10,226,234 295,833,114 265,443,248 14,729,342 13,334,418 293,507,008 275,843,911 5,127,012 16,815,871 297,786,794 274,919,524 8,619,687 17,065,871 300,605,082 272,784,364 9,600,000 17,065,871 299,450,235 275,612,673 9,600,000 17,065,871 302,278,544 272,968,295 10,600,000 17,065,871 300,634,166
(a) Corresponds to MPS fiscal year dates.
(b) Source: City Assessor's Office Tax Rates 1984 to Present Table.
2014
2015
20122013
20072008
20072008
2009
2016
Tax Levies for School Purposes
Last Ten Years
20102011
2015
2016
20132014
2009201020112012

Fiscal Year 2015 Fiscal Year 2006
Percentage PercentageAssessed of Total Assessed of Total
Employer Value Assessed Value Assessed
U.S. Bank $ 233,436 0.88 % $ 231,041 0.81 %
Northwestern Mutual Life Insurance
Company 140,428 0.56 172,345 0.61
Mandel Group 138,190 0.55 — —
Forest County Potawatomi Community 124,506 0.49 — —
Marcus Corp./Mil. City Center/Pfister 95,989 0.38 97,492 0.34
Metropolitan Associates 94,943 0.38 107,792 0.38
Brewery Works/Riverbend Place 87,949 0.35 — —
100 E. Wisconsin Ave. Joint Venture 77,205 0.31 59,036 0.21
Gorman & Co. 76,856 0.30 — —
Jackson Street Holdings 74,642 0.30 — —
NNN 411 E. Wisconsin LLC — — 97,877 0.35
Towne Realty — — 94,774 0.33
M&I Marshall & Ilsley
Bank/Metavente Corp — — 80,462 0.28
Crichton-Hauk/Shoreline/Juneau Village — — 73,276 0.26
Miller-Coors Brewing — — 68,405 0.24
$ 1,144,144 4.50 % $ 1,082,500 3.81 %
Source: City CAFR
Milwaukee Public SchoolsPrincipal Property Taxpayers
(Thousands of Dollars)
City's City's
113

Taxes Purchased TotalLevied Purchased Percent Delinquents Adjustedfor the and Total Current Original Original Levy in Percentage
Budget Fiscal Year Adjustments Adjusted Tax Levy Levy Year Subsequent of AdjustedYear* (Original Levy) (D) (A) Levy Collections Collected (C) Years Amount Levy
2006 261,685$ 25,413$ 287,098$ 255,823$ 97.76 % 15,664$ 15,496$ 286,983$ 99.96 %2007 265,319 29,176 294,495 257,347 97.00 18,577 18,376 294,300 99.93 2008 286,180 36,016 322,196 277,115 96.83 23,945 20,860 321,920 99.91 2009 276,186 32,300 308,486 265,691 96.20 18,017 24,252 307,960 99.83 2010 291,943 28,908 320,851 281,196 96.32 16,482 21,557 319,235 99.50 2011 295,967 28,619 324,586 284,691 96.19 16,049 22,199 322,939 99.49 2012 301,051 25,364 326,415 288,749 95.91 13,596 20,858 323,203 99.02 2013 304,700 25,426 330,126 293,489 96.32 16,237 14,555 324,281 98.23 2014 307,246 24,552 331,798 295,624 96.21 13,875 11,108 320,607 96.63 2015 312,216 22,650 334,866 299,650 95.98 9,161 - 308,811 92.22
Budget Total Percentage
11
4 Year* Tax Levy of Levy
2006 $ 230,346 100.00 %2007 251,077 100.00 2008 287,779 100.00 2009 295,833 100.00 2010 293,507 100.00 2011 297,787 100.00 2012 300,605 100.00 2013 299,450 100.00 2014 302,279 100.00 2015 300,634 100.00
(A) This column includes adjustments. The City purchases delinquent taxes from the other units (Milwaukee County, Metropolitan Sewage District, State, Milwaukee Area Technical College and Milwaukee Public Schools). Prior years' amounts in this column have been revised to reflect activity in CAFR 2015.
(B) Tax collections begin in December for the succeeding Budget Year. Prior years' amounts in this column have been revised to reflect activity in CAFR 2015.
(C) Collections of (A) in the year purchased. Prior years' amounts in this column have been revised to reflect activity in CAFR 2015.
(D) State law limits levy increases to 2% of economic development for general city purposes.
* Budget Year corresponds to the City of Milwaukee's budget year.
Source: City of Milwaukee CAFR and MPS
MILWAUKEE PUBLIC SCHOOLSProperty Tax Levies and Collections
Last Ten Years(Amounts expressed in thousands)
Total Collections to Date
Milwaukee Public Schools
Collected for the LevyLevy Year (B)
Collections

Total Estimated TotalTaxable Actual Direct
Fiscal Real Personal Assessed Taxable TaxYear(1) Estate Property Value Value Rate
2006 27,450,051$ 904,900$ 28,354,952$ 30,226,986$ 8.75$ 93.8 %2007 28,430,813 943,560 29,374,373 31,887,192 7.99 92.12008 29,429,740 1,001,935 30,431,675 32,257,525 8.00 94.42009 27,961,413 983,160 28,944,573 31,266,329 8.09 92.62010 27,091,120 957,344 28,048,464 29,520,783 8.89 95.02011 27,007,839 909,804 27,917,643 27,954,670 9.12 99.92012 24,450,181 871,920 25,322,101 26,421,932 9.25 95.82013 24,169,993 864,165 25,034,158 26,089,611 10.25 96.02014 24,084,276 940,266 25,024,542 26,138,108 10.58 95.72015 24,412,068 850,895 25,262,963 25,980,470 10.71 97.2
(1) Corresponds to City of Milwaukee's Budget Year.
Source: City CAFR & 2015 City Assessor's Office
AssessedValue as a
Percentage ofActual Value
Milwaukee Public SchoolsAssessed Value and Estimated Actual Value of Taxable Property
Last Ten Years(Thousand of Dollars)
115

EstimatedEstimated Share of
Net debt Percentage OverlappingName of governmental unit outstanding Applicable Debt
Debt Repaid with property taxes
Direct debt:Milwaukee Public Schools $ 358,724 100.00 % $ 359,342
Overlapping debt:City of Milwaukee 622,044 100.00 622,044 Milwaukee Area Technical College District Board 108,825 36.00 39,177 County of Milwaukee 662,419 44.35 293,783 Milwaukee Metropolitan Sewerage Area 960,000 45.23 434,208
Total overlapping debt 1,389,212
Total district and overlapping debt $ 1,748,554
Sources: City of Milwaukee CAFR 2015 except Milwaukee Public Schools based on 6-30-16.
MILWAUKEE PUBLIC SCHOOLS
Computation of Direct and Overlapping Governmental Activities
December 31, 2015
(in thousands)
116

Bonded Debt as Total DebtGeneral a Percentage as a
General Capital Variable Wisconsin Bonded of Equalized Less: Percentage Total DebtFiscal Obligation QZAB Appreciation Rate Retirement Debt Property Revenue Capital TEACH Debt Total of Personal Per
Year Bonds Bonds Debt System (UAAL) Subtotal Value1Bonds Lease Loans Service Debt Income2
Capita
2007 11,996,044$ 9,897,583$ 37,852,753$ 130,850,000$ - 190,596,380$ 0.60 % 108,180,831$ 36,759,825$ 6,511,465$ 14,472,771$ 327,575,730$ 1.55 % 555 2008 9,804,615 8,369,589 40,250,009 130,850,000 - 189,274,213 0.59 106,447,870 33,222,400 4,520,395 16,045,169 317,419,709 1.46 537 2009 12,165,969 7,042,189 42,799,284 130,850,000 - 192,857,442 0.62 103,527,948 29,460,000 2,429,771 8,351,394 319,923,767 1.48 548 2010 71,415,847 5,668,324 45,510,230 130,850,000 - 253,444,401 0.86 99,607,279 14,625,679 1,659,026 4,699,678 364,636,707 1.61 628 2011 67,042,677 4,560,243 48,393,112 130,850,000 - 250,846,032 0.90 95,480,699 10,929,713 849,744 11,247,463 346,858,725 1.48 582 2012 62,607,058 3,681,039 51,458,848 130,850,000 - 248,596,945 0.94 90,994,121 10,245,000 - 13,472,018 336,364,048 1.39 565 2013 63,000,610 2,769,721 54,719,050 130,850,000 - 251,339,380 1.00 85,933,361 4,950,000 - 6,866,476 335,356,265 1.37 562 2014 61,880,101 2,054,976 56,259,857 130,850,000 - 251,044,934 N/A 81,869,778 4,375,000 - 9,914,758 327,374,954 N/A 549 2015 63,854,812 1,418,388 56,856,122 130,850,000 - 252,979,322 N/A 76,171,399 38,000,000 - 16,570,259 350,580,462 N/A N/A2016 61,578,241 913,095 57,942,017 130,850,000 - 251,283,353 N/A 70,058,760 38,000,000 - 14,368,921 344,973,192 N/A N/A
(1) Equalized Value per the City of Milwaukee.(2) The data measure for Personal Income changed for FY07 and is from the Regional Economic Information System, Bureau of Economic Analysis, U.S. Dept. of Commerce.It reports the income for Milwaukee County versus the City of Milwaukee because the City makes up a substantial portion of Milwaukee County.
117
Milwaukee Public SchoolsRatios of Outstanding Debt by Type
Last Ten Fiscal Years
Pension Debt
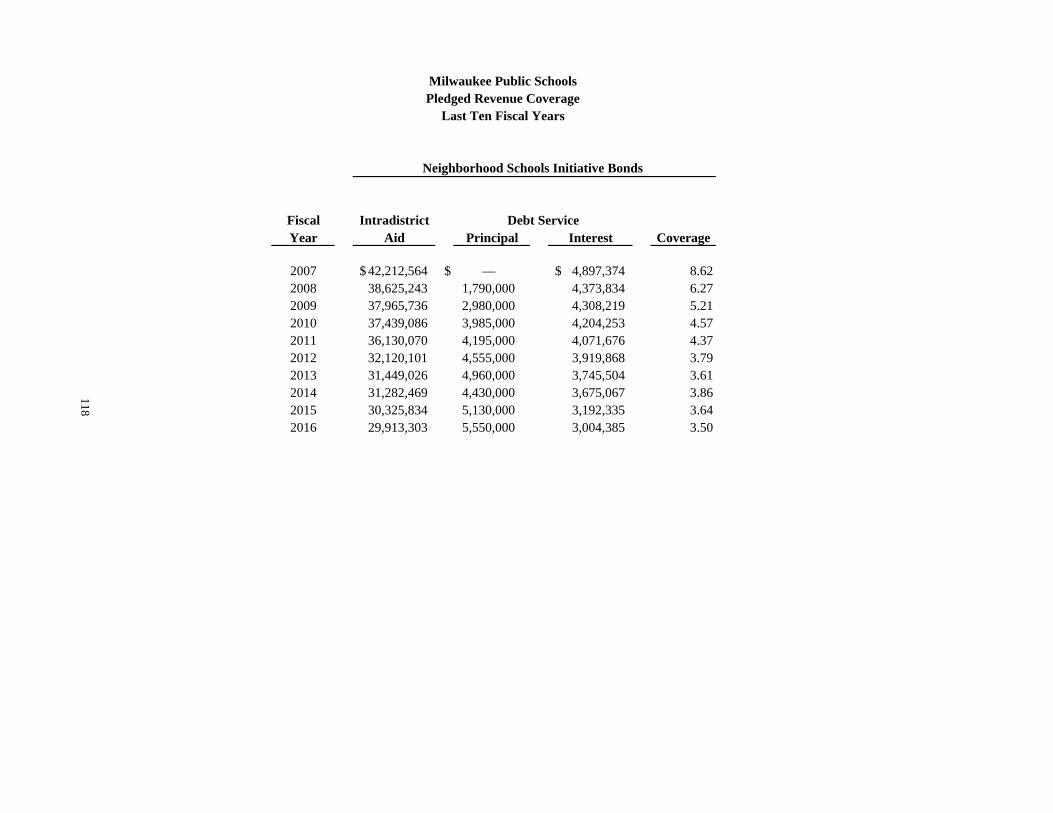
Neighborhood Schools Initiative Bonds
Fiscal IntradistrictYear Aid Principal Interest Coverage
2007 42,212,564$ $ — 4,897,374$ 8.622008 38,625,243 1,790,000 4,373,834 6.272009 37,965,736 2,980,000 4,308,219 5.212010 37,439,086 3,985,000 4,204,253 4.572011 36,130,070 4,195,000 4,071,676 4.372012 32,120,101 4,555,000 3,919,868 3.792013 31,449,026 4,960,000 3,745,504 3.612014 31,282,469 4,430,000 3,675,067 3.862015 30,325,834 5,130,000 3,192,335 3.642016 29,913,303 5,550,000 3,004,385 3.50
Last Ten Fiscal YearsPledged Revenue CoverageMilwaukee Public Schools
Debt Service
118

PersonalIncome Per
(Thousands Capita Median School UnemploymentPopulation of Dollars) Income Age Enrollment Rate
Year (A) (B) (C) (D) (E) (F)
2006 590,370 $ 33,246,601 $ 35,739 30.6 97,509 6.9 %
2007 590,190 34,216,111 36,734 30.6 87,360 6.9
2008 590,870 35,554,719 38,037 30.6 85,369 6.7
2009 584,000 35,850,307 38,031 30.6 82,444 11.4
2010 580,500 36,281,466 38,263 30.3 81,372 11.9
2011 595,525 37,492,098 39,404 30.3 80,098 10.9
2012 595,425 38,795,730 40,644 33.7 78,461 10.1
2013 596,500 38,464,560 40,219 33.7 78,502 8.7
2014 595,993 39,697,233 41,507 33.8 77,391 7.2
2015 595,787 Not available Not available 34.0 75,568 6.7
(A)
(B)
(C)
(D)
(E) Annual School Census by Board of School Directors. Represents Milwaukee Public Schools only.
(F)
source: City of Milwaukee 2015 CAFR; (B) and ( C) - Prior years' amounts have been revised to reflect activity in CAFR15.
MILWAUKEE PUBLIC SCHOOLSDEMOGRAPHIC AND ECONOMIC STATISTICS
LAST TEN CALENDAR YEARS
The December 31, 2006 through 2015 populations are estimated from the Wisconsin Department ofAdministration. (The population differs from the Census Bureau).
Unemployment Rate is the annual average from the Wisconsin's Workforce, Wisconsin Worknet and Labor Market Information System.
Prior to 2012, Median age of the population was determined only during a census. These figuresrepresent the data collected by the American Community Survey.
County of Milwaukee
Personal income is from the Regional Economic Information System, Bureau of Economic Analysis, U.S.Department of Commerce. Personal income includes all of Milwaukee County because a substantialportion of the County is made up of the City of Milwaukee.
Per capita personal income is from the Regional Economic Information System, Bureau of EconomicAnalysis, U.S. Department of Commerce and includes all of Milwaukee County because a substantialportion of the County is made up of the City of Milwaukee.
119

MILWAUKEE PUBLIC SCHOOLSPRINCIPAL EMPLOYERS
Current Year and Nine Years Ago
Employer Employees Rank Employees Rank
Aurora Health Care 24,509 1 5.45 % 15,054 1 3.51 %
Wheaton Franciscan Healthcare 11,281 2 2.51 10,840 2 2.53
Froedtert Memorial Lutheran Hospital and Community Health 9,800 3 2.18
Roundy's Supermarkets 8,260 4 1.84 6,800 7 1.58
GE Healthcare 6,000 5 1.33
Medical College of Wisconsin 5,170 6 1.15
Northwestern Mutual Life 5,100 7 1.13
ProHealth Care Inc. 4,729 8 1.05
Childrens Hospital 4,530 9 1.01
Columbia St. Mary Health System 4,500 10 1.00 5,749 9 1.34
U.S. Government (Includes Zablocki V.A. Medical Center) 10,800 3 2.52
Covenant Health Care 9,000 4 2.10
City of Milwaukee 7,263 5 1.69
Milwaukee Public Schools 7,137 6 1.66
M&I Marshall & Ilsley 6,139 8 1.43
Milwaukee County - - 5,568 10 1.30
83,879 18.65 % 84,350 19.66 %
(1) Reflects full-time equivalent employees of businesses and industrial firms.Note: Data includes all of Milwaukee County and areas contiguous to Milwaukee County.
source: City of Milwaukee CAFR
2015 Estimates (1) 2006
Employmentof Total
Percentageof Total
Percentage
Employment
120

MILWAUKEE PUBLIC SCHOOLS
Comparative per Capita Cost Statistics
Last Ten Fiscal Years
Cost perpupil
2006 – 2007 ...................................................................… 12,174
2007 – 2008 ...................................................................… 13,055
2008 – 2009 ...................................................................… 13,783 **
2009 – 2010 ...................................................................… 14,574 **
2010 – 2011 ...................................................................… 14,803 **
2011 – 2012 ...................................................................… 13,911 **
2012 – 2013 ...................................................................… 14,059
2013 – 2014 ...................................................................… 13,673
2014 – 2015 ...................................................................… 14,269
2015 – 2016 ...................................................................… 14,612
**Cost per pupil is restated from published in 2012 CAFR.
121

MILWAUKEE PUBLIC SCHOOLS
Comparative Statement of Annual School Census
Children Between 4 and 19 Years of AgeResiding in the City of Milwaukee
Increase or Increase or Increase orTotal (decrease) (decrease) (decrease) Attending Attending Total Percent
Fiscal number of over over over public private attending attendingyear children prior year Males prior year Females prior year schools schools schools schools
1981 130,215 (3,424) 66,550 (1,695) 63,665 (1,729) 82,520 31,238 113,758 87.41982 131,748 1,533 67,085 535 64,663 998 80,683 29,623 110,306 83.71983 134,734 2,986 68,642 1,557 66,092 1,429 83,148 31,149 114,297 84.81984 140,729 5,995 71,689 3,047 69,040 2,948 87,243 31,601 118,844 84.41985 147,347 6,618 75,066 3,377 72,281 3,241 93,406 31,464 124,870 84.7
1986 148,768 1,421 75,391 325 73,377 1,096 96,520 30,961 127,481 85.71987 145,593 (3,175) 73,844 (1,547) 71,749 (1,628) 94,744 30,997 125,741 86.41988 148,416 2,823 75,196 1,352 73,220 1,471 98,438 31,140 129,578 87.3
1989 150,714 2,298 76,520 1,324 74,194 974 99,988 29,988 129,976 86.2
1990 150,723 9 76,382 (138) 74,341 147 99,079 29,346 128,425 85.2
1991 * 128,540 (22,183) 65,230 (11,152) 63,310 (11,031) 86,407 27,012 113,419 88.21992 144,452 15,912 73,180 7,950 71,272 7,962 100,017 28,346 128,363 88.91993 145,499 1,047 73,772 592 71,727 455 100,728 27,956 128,684 88.41994 149,545 4,046 75,893 2,121 73,652 1,925 103,452 28,196 131,648 88.01995 151,541 1,996 76,471 578 75,070 1,418 106,886 27,816 134,702 88.8
1996 151,710 169 76,778 307 74,932 (138) 106,910 27,931 134,841 88.91997 151,027 (683) 76,429 (349) 74,598 (334) 107,121 27,455 134,576 89.11998 153,227 2,200 77,533 1,104 75,694 1,096 108,786 27,723 136,509 89.11999 154,328 1,101 78,141 608 76,187 493 111,712 27,207 138,919 90.02000 154,977 649 78,599 458 76,378 191 110,397 28,342 138,739 89.5
2001 150,256 (4,721) 76,048 (2,551) 74,208 (2,170) 107,905 26,479 134,384 89.42002 149,992 (264) 76,142 94 73,850 (358) 109,852 25,066 134,918 90.02003 162,011 12,019 82,187 6,045 79,824 5,974 122,631 23,760 146,391 90.42004 164,641 2,630 83,399 1,212 81,242 1,418 128,862 21,829 150,691 91.52005 165,279 638 85,193 1,794 82,596 1,354 130,664 22,879 153,543 92.9
2006 159,414 (5,865) 81,024 (4,169) 78,390 (4,206) 111,685 27,171 138,856 87.12007 153,233 (6,181) 77,570 (3,454) 75,663 (2,727) 107,950 26,507 134,457 87.72008 152,244 (989) 75,897 (1,673) 76,347 684 102,648 27,847 130,495 85.72009 152,323 79 75,840 (57) 76,483 136 104,316 28,010 132,326 86.92010 151,232 (1,091) 74,710 (1,130) 76,522 39 102,707 28,398 131,105 86.7
2011 148,293 (2,939) 74,624 (86) 73,669 (2,853) 100,101 27,395 127,496 86.02012 146,741 (1,552) 74,476 (148) 72,265 (1,404) 97,900 27,065 124,965 85.22013 144,870 (1,871) 74,017 (459) 70,853 (1,412) 95,602 26,799 122,401 84.52014 ** 146,929 2,059 74,075 58 72,854 2,001 103,291 27,350 130,641 88.92015 ** 146,940 11 73,852 (223) 73,088 234 103,399 31,228 134,627 91.6
2016 ** 138,550 (8,390) 69,981 (3,871) 68,569 (4,519) 95,210 27,788 122,998 88.8
* Data collection method was not consistent with prior years and may not have produced accurate data.
** The U.S. Census Bureau methodology was used to estimate student population residing in the City of Milwaukee.
122

MILWAUKEE PUBLIC SCHOOLS
Annual Enumeration of Children Residingin the City of Milwaukee
As of June 30, 2016
Attended DidAttended parochial not
public or private attendAges** Males Females Total** school school schoolUnder 4 18,748 18,445 37,193 14,245 1,897 21,0514 to 9 26,662 25,634 52,296 32,115 10,550 9,631
10 to 14 20,570 20,124 40,694 31,904 8,179 61115 to 17 11,993 11,761 23,754 19,786 3,201 76718 to 19 10,756 11,050 21,806 11,405 5,858 4,543
20 6,404 6,492 12,896 — * — * — *
Grand total 95,133 93,506 188,639 109,455 29,685 36,603
*Unavailable.** The U.S. Census Bureau methodology was used to estimate student population residing in the City of Milwaukee.
123

Generaladministrative School Interest on Loss on sale/
Fiscal Community Pupil and and central Business Nutrition long-term disposal ofyear Instruction services staff services services services Services debt buildings/software Total2007 676,103$ 20,110$ 122,203$ 111,430$ 162,219$ 36,516$ 18,130$ - 1,146,711$ 2008 826,151 19,658 132,463 117,405 176,007 40,654 16,771 - 1,329,109 2009 864,410 25,574 138,220 118,454 161,739 40,892 16,181 - 1,365,471 2010 887,815 25,538 143,517 132,145 159,725 40,555 17,166 - 1,406,463 2011 863,185 27,499 160,716 117,817 169,960 44,205 17,927 - 1,401,309 2012 685,590 26,042 135,649 113,952 154,702 44,527 17,790 4,028 1,182,280 2013 714,036 30,537 130,190 103,503 149,452 44,946 16,148 260 1,189,072 2014 666,593 27,612 127,674 101,276 167,753 43,657 20,089 - 1,154,653 2015 647,365 29,312 131,799 98,125 160,678 47,234 16,332 - 1,130,845 2016 681,195 27,789 128,940 112,899 169,413 50,101 17,661 - 1,187,998
124
MILWAUKEE PUBLIC SCHOOLS
Government-wide Expenses by Function
Last Ten Fiscal Years
(amounts expressed in thousands)

Federal and Operating Capital state aid not Interest
Charges grants grants restricted to andFiscal for and and Property a specific investmentyear services contributions contributions taxes purpose earnings Miscellaneous Total2007 15,447$ 230,623$ 5,371$ 232,716$ 657,837$ 917$ 3,535$ 1,146,446$ 2008 16,989 268,075 10,907 251,211 641,415 2,496 818 1,191,911 2009 13,690 379,772 1,699 287,828 548,265 1,159 1,045 1,233,459 2010 12,348 355,599 11,118 295,892 590,404 759 1,076 1,267,195 2011 12,448 353,888 11,533 295,237 618,076 290 4,637 1,296,109 2012 12,383 298,422 3,245 298,320 560,070 224 3,286 1,175,950 2013 14,089 288,740 6,492 300,637 553,527 255 2,738 1,166,478 2014 17,279 277,833 3,546 299,505 559,342 2,542 609 1,160,656 2015 17,160 286,680 849 304,116 563,629 2,913 933 1,176,280 2016 19,548 265,979 16,348 301,444 570,219 4,349 1,353 1,179,240
125
Last Ten Fiscal Years
Government-wide Revenues
MILWAUKEE PUBLIC SCHOOLS
(amounts expressed in thousands)
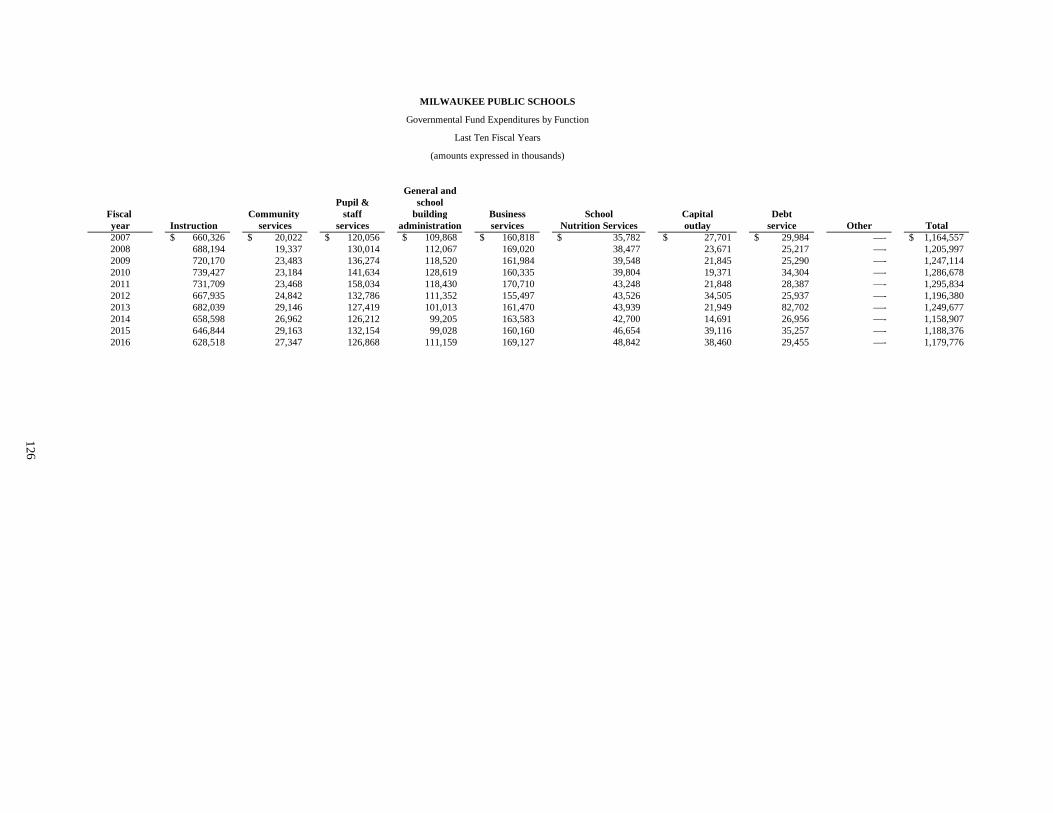
General andPupil & school
Fiscal Community staff building Business School Capital Debtyear Instruction services services administration services Nutrition Services outlay service Other Total2007 660,326$ 20,022$ 120,056$ 109,868$ 160,818$ 35,782$ 27,701$ 29,984$ —- 1,164,557$ 2008 688,194 19,337 130,014 112,067 169,020 38,477 23,671 25,217 —- 1,205,997 2009 720,170 23,483 136,274 118,520 161,984 39,548 21,845 25,290 —- 1,247,114 2010 739,427 23,184 141,634 128,619 160,335 39,804 19,371 34,304 —- 1,286,678 2011 731,709 23,468 158,034 118,430 170,710 43,248 21,848 28,387 —- 1,295,834 2012 667,935 24,842 132,786 111,352 155,497 43,526 34,505 25,937 —- 1,196,380 2013 682,039 29,146 127,419 101,013 161,470 43,939 21,949 82,702 —- 1,249,677 2014 658,598 26,962 126,212 99,205 163,583 42,700 14,691 26,956 —- 1,158,907 2015 646,844 29,163 132,154 99,028 160,160 46,654 39,116 35,257 —- 1,188,376 2016 628,518 27,347 126,868 111,159 169,127 48,842 38,460 29,455 —- 1,179,776
MILWAUKEE PUBLIC SCHOOLS
Governmental Fund Expenditures by Function
Last Ten Fiscal Years
(amounts expressed in thousands)
126

Property Other Interest andFiscal tax Lunchroom local State Federal Intergovernmental Other investmentyear levy sales sources aid aid aid federal aid Miscellaneous earnings Total2007 230,346$ 3,876$ 12,020$ 722,482$ 171,358$ -$ -$ 917$ 3,536$ 1,144,535$ 2008 251,077 3,775 17,056 710,686 196,218 6,000 - 816 2,496 1,188,124 2009 287,779 4,180 12,779 635,413 295,033 - - 932 1,159 1,237,275 2010 295,833 3,853 17,182 675,581 270,854 191 - 1,223 759 1,265,476 2011 293,507 3,227 18,652 706,449 266,201 - - 4,533 290 1,292,859 2012 297,787 2,943 12,065 634,305 229,212 - - 3,347 224 1,179,883 2013 300,605 2,925 19,601 631,567 205,347 - - 3,190 219 1,163,454 2014 299,450 3,113 19,635 640,562 198,629 - - 567 2,542 1,164,498 2015 302,279 803 20,954 651,335 193,461 - - 1,232 2,913 1,172,977 2016 300,634 1,164 31,437 650,524 189,559 - - 1,284 4,349 1,178,951
127
MILWAUKEE PUBLIC SCHOOLS
General Governmental Revenues by Source
Last Ten Fiscal Years
(amounts expressed in thousands)

School Accommodations
Last Thirty-six Years
AverageNumber school
Instructional of school year dailystaff (a) buildings (b) membership
1980 – 1981 5,313 150 84,379 (c)1981 – 1982 5,167 150 82,632 (c)1982 – 1983 5,019 150 82,353 (c)1983 – 1984 5,026 144 82,667 1984 – 1985 5,126 143 84,443 1985 – 1986 5,380 145 86,836 1986 – 1987 5,474 144 87,283 1987 – 1988 5,581 145 87,949 1988 – 1989 5,675 146 89,675 1989 – 1990 5,791 146 90,595 1990 – 1991 5,920 149 90,487 1991 – 1992 6,872 154 91,071 1992 – 1993 6,811 156 94,694 1993 – 1994 6,817 155 96,496 1994 – 1995 6,816 155 98,312 1995 – 1996 6,682 154 99,278 1996 – 1997 6,785 154 101,622 1997 – 1998 7,005 157 102,914 1998 – 1999 7,187 157 102,097 1999 – 2000 7,114 157 100,682 2000 – 2001 7,128 158 99,332 2001 – 2002 7,154 164 99,302 2002 – 2003 7,137 164 99,054 2003 – 2004 7,266 168 98,323 2004 – 2005 6,512 173 96,874 2005 – 2006 6,420 177 94,973 2006 – 2007 6,033 177 92,224 2007 – 2008 6,010 178 89,110 2008 – 2009 5,961 178 87,137 2009 – 2010 5,853 177 85,239 2010 – 2011 5,501 174 84,422 2011 – 2012 5,267 173 82,982 2012 – 2013 4,959 175 81,754 2013 – 2014 5,385 168 81,744 2014 – 2015 5,298 169 80,437 2015 – 2016 5,271 168 78,173
(a) Including principals.(b) Includes leased sites.(c) Kindergarten 1/2 day membership converted to full day equivalents.
MILWAUKEE PUBLIC SCHOOLS
128

2006 – 2007 – 2008 – 2009 – 2010 – 2011 – 2012 – 2013 – 2014 – 2015 –Classifications 2007 2008 2009 2010 2011 2012 2013 2014 2015 2016
Senior high and middle schools:Principals 29 32 30 29 25 22 18 20 18 23Assistant principals 99 74 71 76 61 52 52 54 51 56Teachers 1,724 1,701 1,464 1,404 1,432 1,510 1,406 1,425 1,204 1,392
Total 1,852 1,807 1,565 1,509 1,518 1,584 1,476 1,499 1,273 1,471
Elementary schools:Principals 100 110 101 104 96 96 84 92 88 92Assistant principals 54 59 68 61 55 34 34 55 52 56Teachers 3,497 3,425 3,678 3,610 3,452 2,987 2,616 2,898 2,961 2,912
Total 3,651 3,594 3,847 3,775 3,603 3,117 2,734 3,045 3,101 3,060
Special schools and classes:Principals 2 3 3 4 2 5 10 7 8 9Assistant principals 7 4 4 7 4 6 7 8 9 11Teachers 521 602 542 558 374 555 323 363 374 365
Total 530 609 549 569 380 566 340 378 391 385
Summary:Principals 131 145 134 137 123 123 112 119 114 124Assistant principals 160 137 143 144 120 92 93 117 112 123Teachers 5,742 5,728 5,684 5,572 5,258 5,052 4,345 4,686 4,539 4,669
Total 6,033 6,010 5,961 5,853 5,501 5,267 4,550 4,922 4,765 4,916
Superintendent, deputy andassistant superintendent,department directors andassistants, guidance andpsychological counselors,librarians, and supervisors 415 418 420 421 406 416 409 463 476 484
Grand total 6,448 6,428 6,381 6,274 5,907 5,683 4,959 5,385 5,241 5,400
MILWAUKEE PUBLIC SCHOOLS
Number and Distribution of Instructional Staff
Last Ten Fiscal Years
129

2006- 2007- 2008- 2009- 2010- 2011- 2012- 2013- 2014- 2015-2007 2008 2009 2010 2011 2012 2013 2014 2015 2016
Total number of schoolage children accordingto city-wide child census 153,233 152,244 152,323 151,232 148,293 146,741 144,870 160,214 158,267 144,696 **
Enrollment for state aid:*Third Friday 95,332 91,947 90,053 87,914 87,157 85,886 84,725 84,597 83,126 80,617Summer school 329 428 430 374 382 115 107 163 155 123
Total 95,661 92,375 90,483 88,288 87,539 86,001 84,832 84,760 83,281 80,740
Average number enrolled:Senior high 28,966 28,466 27,839 27,308 26,660 25,337 24,769 24,516 23,957 23,680Junior high/middle 20,698 19,233 18,204 17,469 17,492 17,649 17,201 17,064 16,603 16,396Elementary 47,845 46,273 46,218 45,269 45,262 44,932 44,762 45,259 44,419 43,389
Total 97,509 93,972 92,261 90,046 89,414 87,918 86,732 86,839 84,979 83,465
Average number attending:Senior high 22,916 22,205 22,958 22,469 23,172 21,111 21,010 20,807 20,771 20,035Junior high/middle 18,413 17,047 16,015 15,623 15,737 16,037 15,682 15,491 15,531 15,311Elementary 44,087 42,465 42,363 41,793 41,737 41,254 41,076 41,753 41,561 40,777
Total 85,416 81,717 81,336 79,885 80,646 78,402 77,768 78,051 77,863 76,123130
* Non-resident and choice students not included. ** The U.S. Census Bureau methodology was used to estimate student population residing in the City of Milwaukee which includes 20 year olds.
MILWAUKEE PUBLIC SCHOOLS
Population and PupilsResiding in the City of Milwaukee
Last Ten Fiscal Years
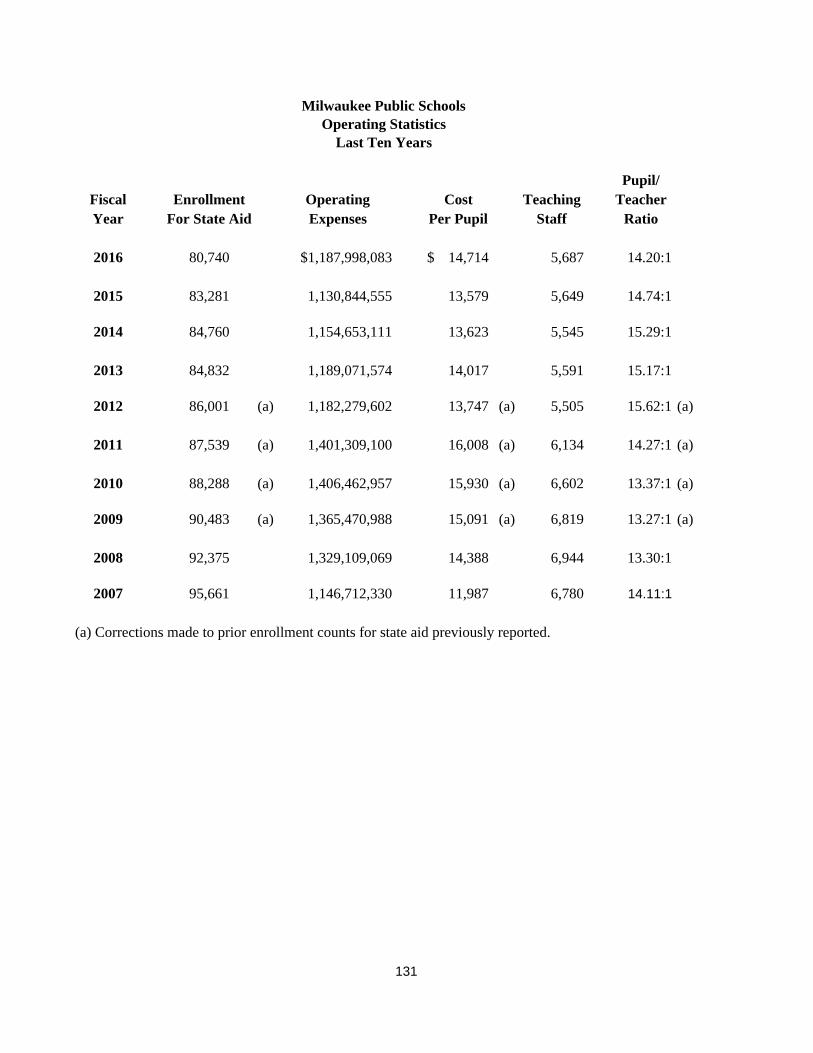
Pupil/Fiscal Enrollment Operating Cost Teaching TeacherYear For State Aid Expenses Per Pupil Staff Ratio
2016 80,740 $1,187,998,083 14,714$ 5,687 14.20:1
2015 83,281 1,130,844,555 13,579 5,649 14.74:1
2014 84,760 1,154,653,111 13,623 5,545 15.29:1
2013 84,832 1,189,071,574 14,017 5,591 15.17:1
2012 86,001 (a) 1,182,279,602 13,747 (a) 5,505 15.62:1 (a)
2011 87,539 (a) 1,401,309,100 16,008 (a) 6,134 14.27:1 (a)
2010 88,288 (a) 1,406,462,957 15,930 (a) 6,602 13.37:1 (a)
2009 90,483 (a) 1,365,470,988 15,091 (a) 6,819 13.27:1 (a)
2008 92,375 1,329,109,069 14,388 6,944 13.30:1
2007 95,661 1,146,712,330 11,987 6,780 14.11:1
(a) Corrections made to prior enrollment counts for state aid previously reported.
Milwaukee Public SchoolsOperating Statistics
Last Ten Years
131

2016 2015 2014 2013 2012 2011 2010 2009 2008 2007
Supervisory
Officials, Admin., Mgrs. 102 96 103 93 91 79 52 56 54 94 Principals 124 117 120 114 124 122 137 134 142 139 Part time profess/Ins. 534 511 419 317 396 361 439 682 574 556 Total supervisory 760 724 642 524 611 562 628 872 770 789
Instruction
Asst. Prin. - Teach 123 114 116 101 91 118 144 143 165 142 Elementary Clsrm. Teach 2,913 2,922 2,867 2,960 3,003 3,264 3,610 3,678 3,697 3,658 Secondary Clsrm. Teach 1,131 1,142 1,173 1,412 1,396 1,546 1,404 1,464 1,680 1,584 Other Clsrm. Teach 625 643 648 343 441 499 558 542 589 452 Other Prof. Staff 497 463 390 417 358 354 494 484 397 441 Teacher Aides 398 365 351 358 216 353 392 508 416 503 Total instruction 5,687 5,649 5,545 5,591 5,505 6,134 6,602 6,819 6,944 6,780
Student Services
Guidance 97 93 94 88 76 70 56 48 49 48 Psychological 137 137 128 135 139 150 163 152 145 159 Librarian/Audiovisual 30 33 30 25 27 36 44 39 32 36 Consultants/Supervisors 118 117 72 61 97 95 96 96 80 94 Technicians 96 94 64 52 70 71 65 71 64 70 Total student services 478 474 388 361 409 422 424 406 370 407
Support and Administration
Clerical/Secretarial 339 359 353 388 350 435 491 520 583 529 Service Workers 408 397 387 397 572 573 416 415 415 415 Craft Workers - Skilled 309 312 354 362 339 351 352 382 448 393 Laborers - Unskilled 52 53 69 13 52 55 67 80 95 77 All other Part-time 3,687 3,820 3,710 4,081 3,928 4,396 4,107 4,961 4,786 4,801 Total support and administration 4,795 4,941 4,873 5,241 5,241 5,810 5,433 6,358 6,327 6,215
Total 11,720 11,788 11,448 11,717 11,766 12,928 13,087 14,455 14,411 14,191
Milwaukee Public SchoolsSchool District Employees - Full Time Staff & Part Time
Last Ten Years
Year Ending June 30,
132

2016 2015* 2014 2013 2012 2011 2010 2009 2008 2007
Number of schools participating in: Lunch - regular schedule 156 158 163 164 158 164 171 175 170 173 Breakfast program 157 158 163 164 152 155 161 158 158 160 Snack program 66 70 93 83 65 82 85 100 99 68
Student lunches served: Free 9,529,532 9,570,975 7,928,445 7,784,596 8,005,894 7,876,717 7,686,178 7,246,531 7,176,603 7,288,629 Reduced - - 368,321 436,303 482,170 537,693 776,288 901,725 954,705 959,040 Fully paid - - 684,351 773,741 884,638 1,078,221 1,207,742 1,380,135 1,381,187 1,353,199 Total 9,529,532 9,570,975 8,981,117 8,994,640 9,372,702 9,492,631 9,670,208 9,528,391 9,512,495 9,600,868
Non-federal program meals served: 325,722 288,695 301,692 152,376 175,783 187,634 194,135 213,691 227,208 275,091
Student breakfasts/snacks served: Free 6,956,879 6,434,123 5,365,033 5,220,603 4,636,128 4,680,041 4,436,904 3,981,425 3,864,927 4,185,851 Reduced - - 177,137 207,954 223,890 253,677 355,182 379,262 384,493 339,181 Fully paid - - 364,781 392,529 407,651 504,831 498,973 517,415 484,573 405,121 Total 6,956,879 6,434,123 5,906,951 5,821,086 5,267,669 5,438,549 5,291,059 4,878,102 4,733,993 4,930,153
Number of serving days: Regular schedule 204 204 204 213 225 234 250 262 225 221
Average daily participation: Student lunch 46,713 46,917 44,025 42,228 41,656 40,567 38,681 40,720 42,278 43,443 Adult lunch 1,597 1,415 1,479 715 781 802 777 913 1,010 1,245 Student breakfast 31,178 29,197 26,278 26,060 22,417 22,157 19,744 19,226 19,331 17,906 Student snacks 2,071 2,178 2,108 2,184 2,184 2,856 2,773 3,588 3,331 2,868
September 15 pupil count 80,617 83,126 84,597 84,725 87,157 87,914 90,053 87,392 90,825 93,516
Percentage of students daily eating school lunch 57.94% 56.44% 52.04% 49.84% 47.79% 46.14% 42.95% 46.59% 46.55% 46.46%
*Starting with Fiscal Year 2015, MPS became elgible for the Community Eligibility Provision which receives reimbursement 100% of elgible meals at the free rate.
Milwaukee Public SchoolsNutrition Services - Facts and Figures
Last Ten Years
Year Ending June 30,
133

2016 2015 2014 2013 2012 2011 2010 2009 2008 2007
Elementary SchoolsNumber of Buildings 124 120 119 119 119 121 121 122 121 121
Square Footage 9,151,094 (a) 8,349,586 (a) 8,028,355 8,028,355 8,028,355 8,201,800 8,217,917 8,282,172 8,479,854 8,479,854Capacity 57,452 (a) 58,399 (a) 65,751 65,751 65,751 66,923 67,095 67,316 66,416 66,416
Enrollment 45,750 46,944 47,605 48,011 48,305 49,689 50,007 50,457 50,275 51,389
Middle SchoolsNumber of Buildings 6 9 7 7 7 8 13 10 14 14
Square Footage 1,070,000 (a) 1,500,105 (a) 1,343,877 1,343,877 1,343,877 1,462,631 2,362,648 1,753,494 2,403,230 2,403,230Capacity 5,393 (a) 7,586 (a) 5,900 5,900 5,900 6,620 11,480 8,300 12,420 10,620
Enrollment 4,174 4,098 4,559 5,198 5,993 6,286 6,343 6,841 8,213 9,651
High SchoolsNumber of Buildings 16 12 13 13 13 13 11 12 14 14
Square Footage 4,584,995 (a) 3,961,021 (a) 3,621,282 3,621,282 3,621,282 3,621,282 3,253,455 3,548,890 4,080,365 4,080,365Capacity 18,512 (a) 15,403 (a) 18,138 18,138 18,138 18,138 15,370 17,370 20,539 20,539
Enrollment 16,996 17,793 18,344 18,960 19,906 20,754 21,590 22,252 23,193 23,863
Other SchoolsNumber of Buildings 13 19 22 22 22 22 16 17 12 11
Square Footage 1,958,914 (a) 2,972,413 (a) 3,833,312 3,833,312 3,833,312 3,833,312 3,419,216 3,668,680 2,373,065 2,297,767Capacity 9,060 (a) 13,671 (a) 17,507 17,507 17,507 17,507 16,289 17,290 10,673 10,430
Enrollment 8,668 8,556 7,994 6,292 5,894 4,643 4,504 5,819 5,679 6,022
Administrative/ServiceNumber of Buildings 56 56 56 56 56 56 58 58 55 55
Square Footage 833,650 833,650 833,650 833,650 833,650 832,871 838,839 838,839 705,268 705,268
AthleticsFootball Fields* 35 35 35 35 35 35 35 35 35 35Soccer Fields** 21 21 21 21 21 21 21 21 21 21Running Tracks 12 12 13 13 13 13 13 13 13 13
Baseball/Softball*** 72 72 72 72 72 72 72 72 72 72Swimming Pools 22 22 22 22 22 22 22 13 13 13
Playgrounds 141 141 144 144 144 147 147 147 147 147
(a) A different method was used *22 Recreation+13 High School**8 Recreation+13 High School
***All Recreation
Note: Excludes leased sites
Milwaukee Public SchoolsCapital Asset Information
Last Ten Years
134