comprehensive annual financial report of the fair lawn
TRANSCRIPT

COMPREHENSIVE ANNUAL
FINANCIAL REPORT
of the
Borough of Fair Lawn Board of Education Fair Lawn, New Jersey
For the Fiscal Year Ended June 30, 2015
Prepared by
Borough of Fair Lawn Board of Education Finance Department

BOARD OF EDUCATION BOROUGH OF FAIR LAWN SCHOOL DISTRICT
TABLE OF CONTENTS
INTRODUCTORY SECTION (Unaudited)
Letter of Transmittal Organizational Chart Roster of Officials Consultants and Advisors
FINANCIAL SECTION
INDEPENDENT AUDITOR'S REPORT
Independent Auditor's Report on General Purpose Financial Statements and Supplementary Schedules of Expenditures of Federal Awards and State Financial Assistance
REQUIRED SUPPLEMENTARY INFORMATION - PART I
Management's Discussion and Analysis (Unaudited)
BASIC FINANCIAL STATEMENTS
A. District - wide Financial Statements: A-I Statement of Net Position A-2 Statement of Activities
B. Fund Financial Statements: Governmental Funds:
B-1 Balance Sheet B-2 Statement of Revenues, Expenditures and Changes
in Fund Balances B-3 Reconciliation of the Statement of Revenues, Expenditures
and Changes in Fund Balances of Governmental Funds to the Statement of Activities
Proprietary Funds: B-4 Statement of Net Position B-5 Statement of Revenues, Expenses and Changes in Fund
Net Position B-6 Statement of Cash Flows
Fiduciary Funds: B-7 Statement of Fiduciary Net Position B-8 Statement of Changes in Fiduciary Net Position
1-5 6 7 8
11-13
14-20
23 24
27
28
29
31
32 33
35 36

BOARD OF EDUCATION BOROUGH OF FAIR LA WN SCHOOL DISTRICT
TABLE OF CONTENTS CONTINUED
NOTES TO BASIC FINANCIAL STATEMENTS
REQUIRED SUPPLEMENTARY INFORMATION - PART II
C. Budgetary Comparison Schedules: C-I Budgetary Comparison Schedule - General Fund C-2 Budgetary Comparison Schedule - Special Revenue Fund
NOTES TO REQUIRED SUPPLEMENTARY INFORMATION - PART II
C-3 Budget to GAAP Reconciliation
REQUIRED SUPPLEMENTARY INFORMATION - PART III
L. Schedules Related to Accounting and Reporting for Pensions (GASB 68) L-l Schedule of the District's Proportionate Share of the Net Pension
Liability - PERS L-2 Schedule of District Contributions - PERS L-3 Schedule of the District's Proportionate share of the Net Pension
Liability - TP AF
NOTES TO REQUIRED SUPPLEMENTARY INFORMATION -PART III
Notes to required Supplementary Information
OTHER SUPPLEMENTARY INFORMATION
D. School Level Schedules:Fund Financial Statements: D-l Combining Balance Sheet D-2 Blended Resource Fund - Schedule of Expenditures
Allocated by Resource Type-Actual D-3 Blended Resource Fund - Schedule of Blended
Expenditures - Budget and Actual
E. Special Revenue Fund: E-l Combining Schedule of Program Revenues and
Expenditures - Budgetary Basis E-I a Combining Schedule of State Program Revenues and
Expenditures - Budgetary Basis E-lb Combining Schedule Federal of Program Revenues and
Expenditures - Budgetary Basis E-l c Combining Schedule of Local Program Revenues and
Expenditures - Budgetary Basis
F. Capital Projects Fund: F-l Summary Schedule of Project Expenditures F-2 Summary Schedule of Revenues, Expenditures and
Changes in Fund Balance - Budgetary Basis F-2a to F-21- Schedule of Project Revenues, Expenditures, Project
Balance and Project Status - Budgetary Basis
38-72
75-79 80
82
85 86 87
89
N/A
N/A
N/A
93
94
95
96
98
99
100-111

BOARD OF EDUCATION BOROUGH OF FAIR LAWN SCHOOL DISTRICT
TABLE OF CONTENTS
REQUIRED SUPPLEMENTARY INFORMATION -PART II (CONTINUED)
O. Proprietary Funds: Enterprise Fund:
G-I Combining Statement of Net Assets G-2 Combining Statement of Revenues, Expenses
and Changes in Fund Net Assets G-3 Combining Statement of Cash Flows
O. Proprietary Funds: Internal Service Fund:
G-4 Combining Statement of Net Assets G-5 Combining Statement of Revenues, Expenses
and Changes in Fund Net Assets G-6 Combining Statement of Cash Flows
H. Fiduciary Fund H-I Combining Statement of Fiduciary Net Assets H-2 Combining Statement of Changes in Fiduciary
Net Assets H-3 Student Activity Agency Fund Schedule of
Receipts and Disbursements H-4 Payroll Agency Fund Schedule of Receipts and
Disbursements
I. Long - Term Debt I-I Schedule of Serial Bonds 1-2 Schedule of Obligation Under Capital Leases 1-3 Debt Service Fund Budgetary Comparison Schedule
STATISTICAL SECTION (UNAUDITED)
J. Financial Trends: J-I Net Assets by Component J-2 Changes in Net Assets 1-3 Fund Balances - Governmental Funds 1-4 Changes in Fund Balances - Governmental Funds 1-5 General Fund - Other Local Revenue by Source
Revenue Capacity J-6 Assessed Value and Estimated Actual Value of Taxable Property J-7 Direct and Overlapping Property Tax Rates J-8 Principal Property Taxpayers J-9 Property Tax Levies and Collections
Debt Capacity 1-10 Ratios of Outstanding Debt by Type J-ll Ratios of Net General Bonded Debt Outstanding 1-12 Direct and Overlapping Governmental Activities Debt as of June 30 1-13 Legal Debt Margin Information
N/A
N/A N/A
N/A
N/A N/A
N/A
N/A
116
117
119 N/A 120
123 124-125
126 127--128
129 130 131 132 133
134 135 136 137

BOARD OF EDUCATION BOROUGH OF FAIR LA WN SCHOOL DISTRICT
T ABLE OF CONTENTS CONTINUED
STATISTICAL SECTION (UNAUDITED) (Continued)
Demographic and Economic Information J-14 Demographic and Economic Statistics J-15 Principal Employers
Operating Information J-16 Full-time Equivalent District Employees by Function/Program J-17 Operating Statistics J-18 School Building Information J-19 Schedule of Required Maintenance for School Facilities J-20 Insurance Schedule
SINGLE AUDIT SECTION
K-l Report on Internal Control over Financial Reporting and on Compliance and Other Matters Based on an Audit of Financial Statements Performed in Accordance with "Government Auditing Standards"
K-2 Report on Compliance for Each Major Program; Report on Internal Control over Compliance; Report on Schedules of Expenditures of Federal Awards and State Financial Assistance Required by OMB Circular A-I33 and New Jersey OMB Circular Letter 04-04
K-3 Schedule of Expenditures of Federal Awards, Schedule A K-4 Schedule of Expenditures of State Financial Assistance, Schedule B K-5 Notes to Schedules of Expenditures of Awards and Financial
Assistance K-6 Schedules of Findings and Questioned Costs
Part I Summary of Auditor's Results Part 2 Schedule of Financial Statement Findings Part 3 Schedule of Federal Awards and State Financial Assistance
Findings and Questioned Costs K-7 Summary Schedule of Prior-Year Audit Findings and Questioned
Costs as Prepared by Management
138 139
140 141 142 143 144
146-147
148-150 151 152
153-154
155-156 157
158
159

Introductory Section

Honorable President and Members of the Board of Education Fair Lawn School District County of Bergen, New Jersey
Dear Board Members:
Board of Education Fair Lawn School District
September, 2015
The comprehensive annual financial report (CAFR) ofthe Fair Lawn School District (District) for the fiscal year ended June 30, 2015, is hereby submitted. Responsibility for both the accuracy of the data and completeness and fairness of the presentation, including all disclosures, rests with the management of the Board of Education (Board). To the best of our knowledge and belief, the data presented in this report is accurate in all material respects and is reported in a manner designed to present fairly, in all material respects, the respective financial position of the governmental activities, the business-type activities, each major fund, and the aggregate remaining fund information of the District as of June 30, 2015 and the respective changes in financial position and cash flows, where applicable, thereof for the year then ended in conformity with accounting principles generally accepted in the United States of America. All disclosures necessary to enable the reader to gain an understanding of the District's financial activities have been included.
The comprehensive annual financial report is presented in four sections: introductory, financial, statistical and single audit. The introductory section includes this transmittal letter, the District's organizational chart and a list of principal officials. The financial section includes the basic financial statements and schedules, as well as the auditor's report thereon. The statistical section includes selected financial and demographic information, generally presented on a multi-year basis. The District is required to undergo an annual single audit in conformity with the provisions of the Single Audit Act Amendments of 1996 and the U.S. Office of Management and Budget Circular A-133, "Audits of State, Local Governments, and nonprofit organizations" and the State Treasury Circular Letter 04-04 OMB, "Single Audit Policy for Recipients of Federal Grants, State Grants and State Aid." Information related to this single audit, including the auditor's report on the internal control structure and compliance with applicable laws and regulations and findings and recommendations, are included in the single audit section of this report.
1. REPORTING ENTITY AND ITS SERVICES
Fair Lawn School District is an independent reporting entity within the criteria adopted by the Governmental Accounting Standards Board (GASB) as established by GASB Statement No. 14. All funds and account groups of the District are included in this report. The Fair Lawn Board of Education and all its schools constitute the District's reporting entity.
The District provides a full range of educational services appropriate to grade levels K through 12. These include regular, vocational as well as special education for students with disabilities. The District completed the 2014-2015 year with an enrollment of 4,717 students. The following details the changes in the student enrollment of the District over the last ten years.
1
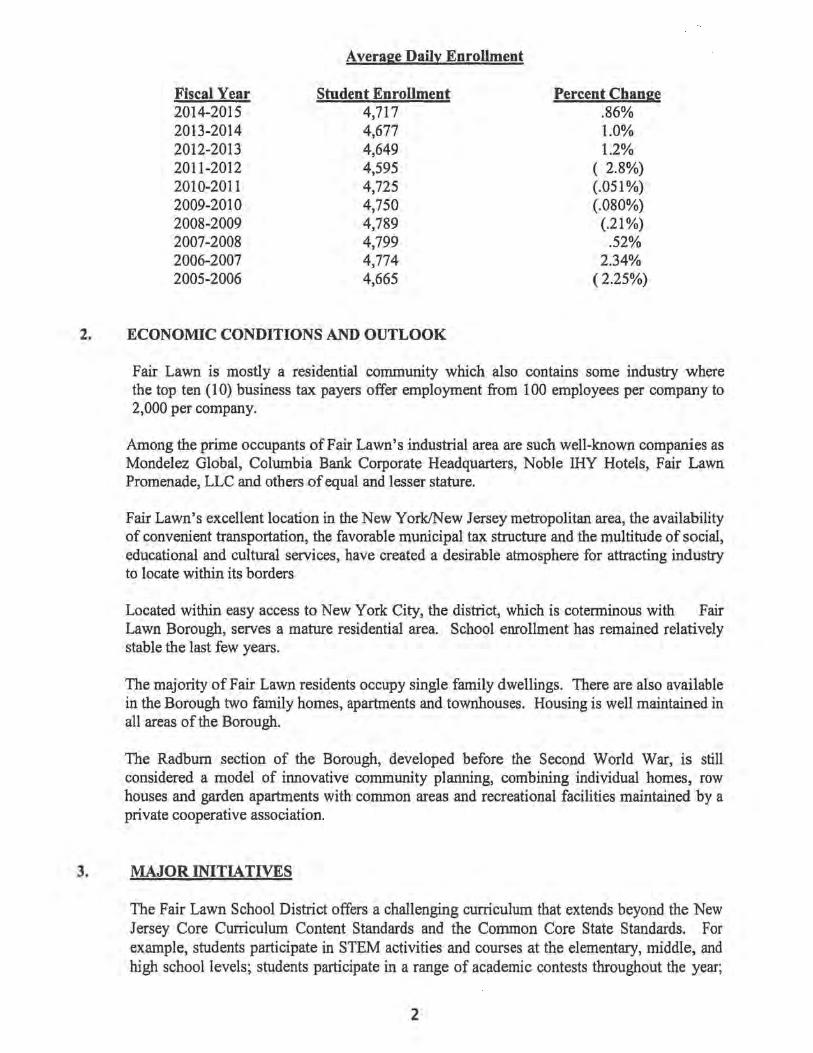
Fiscal Year 2014-2015 2013-2014 2012-2013 2011-2012 2010-2011 2009-2010 2008-2009 2007-2008 2006-2007 2005-2006
Average Daily Enrollment
Student Enrollment 4,717 4,677 4,649 4,595 4,725 4,750 4,789 4,799 4,774 4,665
2. ECONOMIC CONDITIONS AND OUTLOOK
Percent Change .86% 1.0% 1.2%
( 2.8%) (.051 %) (.080%)
(.21%) .52%
2.34% ( 2.25%)
Fair Lawn is mostly a residential community which also contains some industry where the top ten (10) business tax payers offer employment from 100 employees per company to 2,000 per company.
Among the prime occupants of Fair Lawn's industrial area are such well-known companies as Mondelez Global, Columbia Bank Corporate Headquarters, Noble IHY Hotels, Fair Lawn Promenade, LLC and others of equal and lesser stature.
Fair Lawn's excellent location in the New YorklNew Jersey metropolitan area, the availability of convenient transportation, the favorable municipal tax structure and the multitude of social, educational and cultural services, have created a desirable atmosphere for attracting industry to locate within its borders
Located within easy access to New York City, the district, which is coterminous with Fair Lawn Borough, serves a mature residential area. School enrollment has remained relatively stable the last few years.
The majority of Fair Lawn residents occupy single family dwellings. There are also available in the Borough two family homes, apartments and townhouses. Housing is well maintained in all areas of the Borough.
The Radburn section of the Borough, developed before the Second World War, is still considered a model of innovative community planning, combining individual homes, row houses and garden apartments with common areas and recreational facilities maintained by a private cooperative association.
3. MAJOR INITIATIVES
The Fair Lawn School District offers a challenging curriculum that extends beyond the New Jersey Core Curriculum Content Standards and the Common Core State Standards. For example, students participate in STEM activities and courses at the elementary, middle, and high school levels; students participate in a range of academic contests throughout the year;
2

and students benefit from the various partnerships between the school district and local universities/colleges. Additionally, Fair Lawn High School offers 23 AP courses as well as 34 Honors courses. In 2015, Newsweek ranked Fair Lawn High School 426th in the nationplacing us in the top 1.5% of the nation's high schools.
Fair Lawn High School Seniors (2015) recorded their average Scholastic Aptitude Test (SAT) scores at 44 points writing and 46 points math above the national average and 22 points on critical reading above the national average and 36 points math and 29 points writing and 17 points critical reading above the state average. Ninety-eight percent of our 2015 graduates went on to higher education.
The educational experience of students is enhanced by a broad set of extracurricular offerings in the arts, athletics, service organizations, and special-interest activities. FLHS offers 65 such clubs and activities, including Varsity Law Team, Drama Club, Ski Club, and the Astronomy Club. District students participated in regional chorus groups, the New Jersey All State Chorus, as well as regional band and orchestra groups. Fair Lawn High School hosts 27 out of 31 NJSIAA sanctioned programs, and last year, we celebrated 11 league and 2 county championships.
The Fair Lawn School District also believes it is essential to engender productive and humane citizens who are empowered with the tools necessary to function democratically in a global society. This is accomplished through strong academic programs, the establishment of a positive learning climate, a strong partnership with parents and the community, the professionalism and dedication of our staff, and our commitment to ensure high levels of learning for all students.
4. INTERNAL ACCOUNTING CONTROLS
Management of the District is responsible for establishing and maintaining an internal control structure designed to ensure that the assets of the District are protected from loss, theft or misuse and to ensure that adequate accounting data are compiled to allow for the preparation of financial statements in conformity with generally accepted accounting principals (GAAP). The internal control structure is designed to provide reasonable, but not absolute, assurance that these objectives are met. The concept of reasonable assurance recognizes that: (1) the cost of a control should not exceed the benefits likely to be derived; and (2) the valuation of costs and benefits requires estimates and judgments by management.
As a recipient of federal and state financial assistance, the District also is responsible for ensuring that an adequate internal control structure is in place to ensure compliance with applicable laws and regulations related to those programs. This internal control structure is also subject to periodic evaluation by the District management. As part of the District's single audit described earlier, tests are made to determine the adequacy of the internal control structure, including that portion related to federal and state financial assistance programs, as well as to determine that the District has complied with applicable laws and regulations.
5. BUDGETARY CONTROLS
In addition to internal accounting controls the District maintains budgetary controls. The objective of these budgetary controls is to ensure compliance with legal provisions
3

embodied in the annual appropriated budget. Annual appropriated budgets are adopted for the general fund, the special revenue fund, and the debt service fund. Project-length budgets are approved for the capital improvements accounted for in the capital projects fund. The final budget amount as amended for the fiscal year is reflected in the financial section.
An encumbrance accounting system is used to record outstanding purchase commitments on a line item basis. Open encumbrances at year-end are either canceled or are included as re-appropriation of fund balance in the subsequent year. Those amounts to be reappropriated are reported as reservations of fund balance at June 30, 2015.
6. ACCOUNTING SYSTEM AND REPORTS
The District's accounting records reflect generally accepted accounting principles, as promulgated by the Governmental Accounting Standards Board (GASB). The accounting system of the District is organized on the basis of funds and account groups. These funds and account groups are explained in "Notes to the Financial Statements," Note 1.
7. DEBT ADMINISTRATION
At June 30, 2015, the District's outstanding debt issues include Serial Bonds and Loans Payable. In March 2004, the District experienced a successful bond referendum for a total of $23,662,000.00. The proceeds of this bond issue were designed for various school building improvements. The pay down of this outstanding debt began during the 2005-2006 school year and will end February 15,2030.
In 2013, the district refinanced existing school bonds and issued new debt which resulted in annualized savings in excess of $20,000 per year which commenced in August 2013.
In December 2014, the District achieved another successful $10.677 million Bond Referendum. Moody's upgraded the district's bond ratings to an Aa2 underlying and Aa3 enhanced rating. Bond sale was held on February 11,2015.
The proceeds of this bond issue were placed in the District's capital projects fund for use to provide funds for the reroofing of the District's school buildings and an addition to one of the district's elementary schools. The pay down of this outstanding debt will begin during the 2015/2016 school year and will end June 30, 2035.
8. CASH MANAGEMENT
The investment policy of the District is guided in large part by state statute as detailed in "Notes to the Financial Statements", Note 2. The District has adopted a cash management plan which requires it to deposit public funds in public depositories protected from loss under the provisions of the Governmental Unit Deposit Protection Act ("GUDPA"). GUDPA was enacted in 1970 to protect Governmental Units from a loss of funds on deposit with a failed banking institution in New Jersey. The law requires governmental units to deposit public funds only in public depositories located in New Jersey, where the funds are secur~d in accordance with the Act. During the 1993-94
4

fiscal year, the Board approved extending their official Depositories to include the New Jersey Cash Management Fund.
The Fund was established in 1977 and is invested by the Division of Investment of the Treasury Department under the jurisdiction of the State Investment Council. In November 1977, legislation was enacted (P.L. 1977, C.281) which permits counties, municipalities, and school districts to participate
9. RISK MANAGEMENT
The Board carries various forms of insurance, including but not limited to general liability, student accident, environmental liability, excess umbrella liability, automobile liability and comprehensive/collision, workers' compensation, School Board legal liability, hazard and theft insurance on property and contents, and fidelity bonds.
10. OTHER INFORMATION
Independent Audit - State statutes require an annual audit by independent certified public accountants or registered municipal accountants. The accounting finn ofT.M. Vrabel & Associates LL.C, was selected by the Board's audit committee. In addition to meeting the requirements set forth in state statutes, the audit also was designed to meet the requirements of the Single Audit Act Amendments of 1996 and the related OMB Circular A-133 and State Treasury Circular Letter 04-04 OMB. The auditor's report on the general purpose financial statements and combining and individual fund statements and schedules is included in the financial section of this report. The auditor's reports related specifically to the single audit are included in the single audit section of this report.
11. ACKNOWLEDGMENTS
We would like to express our appreciation to the members of the Fair Lawn School Board for their concern in providing fiscal accountability to the citizens and taxpayers of the school district and thereby contributing their full support to the development and maintenance of our financial operation. The preparation of this report could not have been accomplished without the efficient and dedicated services of our financial and bookkeeping staff.
Respectfully submitted,
~N a.:::-'D>-j Bruce Watson Superintendent of Schools
5

01
Director Human
Resources
Director Special
Education
Child Study Teams
Principals
I
Assistant Superintendent
Education
Ed Tech NJSMART
PARCC&DLM Data Specialists
Subject Supervisors
Language arts ... .. Literacy Specialists '----I Science .. ... Ed Tech .. ... Busincss
World Languagcs .. ... ESL ... .. Music Mathematics ..... Mathematics Specialist Social Studics ... .. Art
Support Personnel
School Business Administrator I
Board Secretary Support Personnel
Revised 9/2015
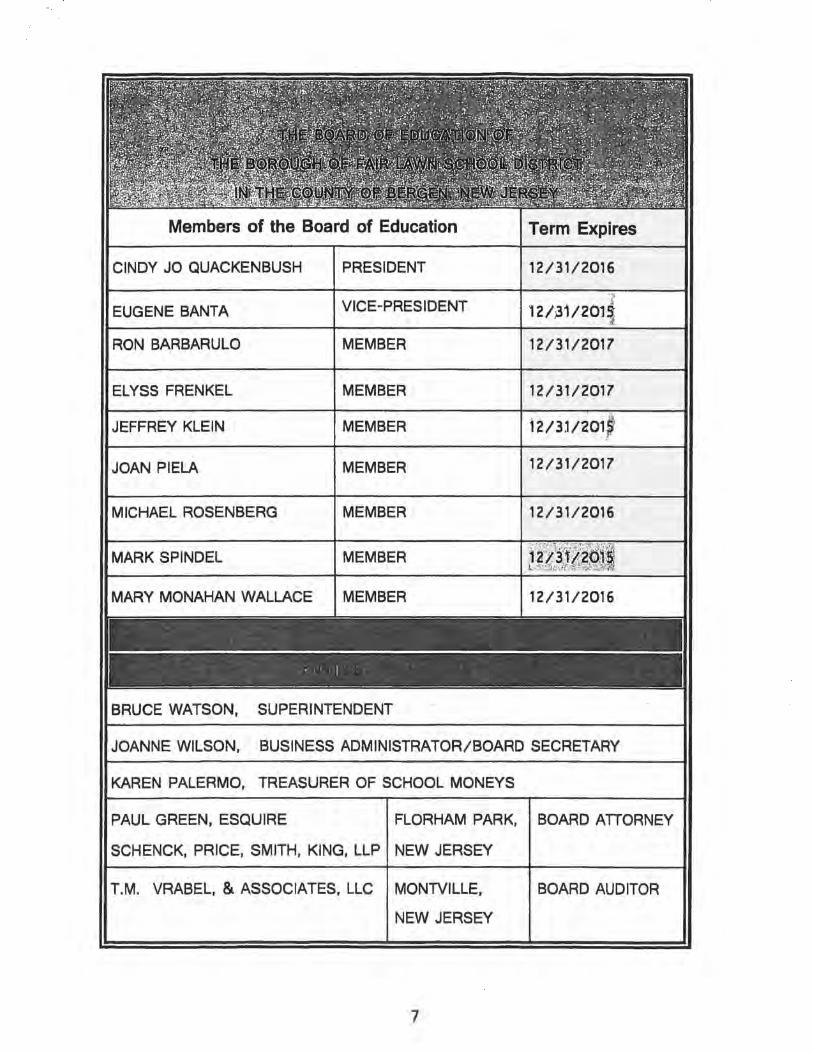
Members of the Board of Education Term Expires
CINDY JO QUACKENBUSH PRESIDENT 12/3112016
EUGENE BANTA VICE-PRESIDENT 121,31/20l
RON BARBARULO MEMBER 12/31/2017
EL YSS FRENKEL MEMBER 12/31/2017
JEFFREY KLEIN MEMBER 12/31/201
JOAN PIELA MEMBER 12/31/2017
MICHAEL ROSENBERG MEMBER 12/31/2016
MARK SPINDEL MEMBER
MARY MONAHAN WALLACE MEMBER
BRUCE WATSON, SUPERINTENDENT
JOANNE WILSON, BUSINESS ADMINISTRATOR/BOARD SECRETARY
KAREN PALERMO, TREASURER OF SCHOOL MONEYS
PAUL GREEN, ESQUIRE FLORHAM PARK, BOARD ATTORNEY
SCHENCK, PRICE, SMITH, KING, LLP NEW JERSEY
T.M. VRABEL, & ASSOCIATES, LLC MONTVILLE, BOARD AUDITOR
NEW JERSEY
7

BOARD OF EDUCATION CONSULTANTS & ADVISORS
2015·2016
Architects/Engineers
LAN Associates, Incorporated 445 Godwin Avenue
Midland Park, NJ 07432
Energy for America, Incorporated 42 Roseland Avenue
Roseland, NJ 07068-1246
Audit Firm
T.M. Vrabel & Associates, LLC 350 Main Road
Suite 104 Montville, NJ 07045
Attorneys
Schenck, Price, Smith & King, LLP 220 Park Avenue
P.O. Box 991 Florham Park, NJ 07932-0991
Official Depository
Columbia Savings Bank 19-01 Route 208 North Fair Lawn, NJ 07410
8

Financial Section
9

Independent Auditor's Report
10

:,,'>'" " ~
I . • ...
:l l
q: 5W. 4'ra6e{ eljlssociates, ££C jlccountants ant! jI uditors
fJimotliy 5W. o/r46e( ~, ~~ Cliris C. J{W4ng, oP.ft
INDEPENDENT AUDITOR'S REPORT
The Honorable President and Members of the Board of Education Borough of Fair Lawn School District County of Bergen, New Jersey
Report on the Financial Statements
We have audited the accompanying basic fmancial statements of the governmental activities, the business-type activities, each major fund, and the aggregate remaining fund information of the Borough of Fair Lawn School District as of and for the year ended June 30, 2015, and the related notes to the fmancial statements which collectively comprise the District's basic fmancial statements as listed in the table of contents.
Management's Responsibility for the Financial Statements
Management is responsible for the preparation and fair presentation of these fmancial statements in accordance with the accounting principles generally accepted in the United States of America; this includes the design, implementation, and maintenance of internal control relevant to the preparation and fair presentation of financial statements that are free from material misstatement, whether due to fraud or error.
Auditor's Responsibility
Our responsibility is to express opinions on these fmancial statements based on our audit. We conducted our audit in accordance with auditing standards generally accepted in the United States of America; the standards applicable to fmancial audits contained in Government Auditing Standards, issued by the Comptroller General of the United States; and in compliance with audit requirements prescribed by the Office of School Finance, Department of Education, State of New Jersey. Those standards require that we plan and perform the audit to obtain reasonable assurance about whether the basic fmancial statements are free of material misstatement.
An audit involves performing procedures to obtain audit evidence about the amounts and disclosures in the financial statements. The procedures selected depend on the auditor's judgment, including the assessment of risks of material misstatement of the fmancial statements, whether due to fraud or error. In making those risk assessments, the auditor considers internal control relevant to the entity's preparation and fair presentation of the financial statements in order to design audit procedures that are appropriate in the circumstances, but not for
11
350 !Main CJ(ptU.( Suiu 104 !Montvilfe, !NJ 07045
973-953-7769 p~ 973-625-8733 fEmai!: [email protected]

the purpose of expressing an opinion on the effectiveness of the entity's internal control. Accordingly, we express no such opinion. An audit also includes evaluating the appropriateness of accounting policies used and the reasonableness of significant accounting estimates made by management, as well as evaluating the overall presentation of the financial statements.
We believe that the audit evidence we have obtained is sufficient and appropriate to provide a basis for our audit opinions.
Opinions
In our opinion, the financial statements referred to above present fairly, in all material respects, the respective financial position of the governmental activities, the business-type activities, each major fund, and the aggregate remaining fund information the Borough of Fair Lawn as of June 30, 2015, and the respective changes in financial position and cash flows, where applicable, thereof for the year then ended in conformity with accounting principles generally accepted in the United States of America.
Other Matters
Required Supplementary Information
Accounting principles generally accepted in the United States of America require that the Management's Discussion and Analysis on Page 14 through 20 and budgetary comparison information of schedules C-l and C-2 be presented to supplement the basic fmancial statements. Such information, although not a part of the basic fmancial statements, is required by the Governmental Accounting Standards Board who considers it to be an essential part of fmancial reporting for placing the basic fmancial statements in an appropriate operational, economic, or historical context. We have applied certain limited procedures to the required supplementary information in accordance with auditing standards generally accepted in the United States of America, which consisted of inquiries of management about the methods of preparing the information and comparing the information for consistency with management's responses to our inquiries, the basic fmancial statements, and other knowledge we obtained during our audit of the basic fmancial statements. We do not express an opinion or provide any assurance on the information because the limited procedures do not provide us with sufficient evidence to express an opinion or provide any assurance.
Other Information
Our audit was conducted for the purpose of forming opinions on the fmancial statements that collectively comprise the Borough of Fair Lawn's basic fmancial statements. The accompanying introductory section, and other supplementary information such as the combining and individual fund fmancial statements, long-term debt schedules, statistical tables and the Schedules of Expenditures of Federal Awards and State Financial Assistance as required by U.S. Office of Management and Budget Circular A-I33, Audits of States, Local Governments, and Non-Profit Organizations; and New Jersey OMB's Circular 15-08, Single Audit Policy for Recipients of Federal Grants, State Grants and State Aid are presented for purposes of additional analysis and are not a required part of the basic fmancial statements.
The combining and individual fund fmancial statements, long-term debt schedules and the Schedules of Expenditures of Federal Awards and State Financial Assistance is the responsibility of management and was derived from and relates directly to the underlying accounting and other records used to prepare the basic financial statements. Such information has been subjected to the auditing procedures applied in audit of the basic fmancial statements and certain additional procedures, including comparing and reconciling such information directly to the underlying accounting and other records used to prepare the basic fmancial statements or to the basic fmancial statements themselves, and other additional procedures in accordance with auditing standards generally accepted in the United States of America. In our opinion, the combining and individual fund financial statements, long-term debt schedules and the Schedules of Expenditures of Federal Awards and State Financial Assistance is fairly stated, in all material respects, in relation to the basic financial statements as a whole.
12
The introductory section and statistical tables have not been subjected to the auditing procedures and applied in the audit of the basic fmancial statements, and accordingly, we do not express an opinion or provide any assurance on it.
Other Reporting Required by Government Auditing Standards
In accordance with Government Auditing Standards, we have also issued our report dated October 9, 2015 on our consideration of the Borough of Fair Lawn's internal control over fmancial reporting and on out tests of its compliance with certain provisions of laws, regulations, contracts, and grant agreements and other matters. The purpose of that report is to describe the scope of our testing of internal control over fmancial reporting and compliance and the results of that testing and not to provide an opinion on the internal control over fmancial reporting or compliance. That report is an integral part of an audit perfonned in accordance with Government Auditing Standards in considering Borough of Fair Lawn's internal control over fmancial reporting and compliance.
Montville, New Jersey October 9,2015
13
~J1J.,LtL TimotHy M. Vrabel Public School Accountant License No. CS000698
Chris C. W. Hwang Certified Public Accountant License No. CC033704

REQUIRED SUPPLEMENTARY INFORMATION -PART I
13a

MANAGEMENT'S DISCUSSION AND ANALYSIS
Our discussion and analysis of the Fair Lawn School District fmancial activities for the fiscal year ended June 30, 2015. Please read it in conjunction with the transmittal letter on page 1 and the District's financial statements, which begin on page 23.
FINANCIAL HIGHLIGHTS
The District's total net position increased $5,114,000 or 22.12 percent as a result of this year's operations mainly because of the increase in the Capital Reserve Account and the decrease in outstanding debt. This year the District continues to recognize capital assets based on original cost less depreciation. (Table I)
Total cost of all of the District's programs was $94,041,000 in 2014-2015 compared to $93,339,000 in 2013-2014. (Table II)
During the year, the District had expenses for governmental activities that were $433,000 less than the $94,674,000 generated in tax and other program revenues (Table III) due to planned control of expenditures.
USING THIS ANNUAL REPORT
This annual report consists of a series of fmancial statements. The Statement of Net Position and the Statement of Activities (on pages 23 and 24) provide information about the activities of the District as a whole and present a longer-term view on the District's finances. Fund financial statements start on page 27. For governmental activities, these statements tell how these services were financed in the short term as well as what remains for future spending. Fund fmancial statements also report the District's operation in more detail than the government-wide statements by providing information about the District's most fmancially significant funds
Reporting the District as a Whole
The Statement of Net Position and the Statement of Activities
Our analysis of the District as a whole begins on page 16. One of the most important questions asked about the District's fmances is "Is the District as a whole better off or worse off as a result of the year's activities?" The Statement of Net Position and the Statement of Activities report information about the District as a whole and about its activities in a way that helps answer this question. These statements include all assets and liabilities using the accrual basis of accounting, which is similar to the accounting used by most private-sector companies. Accrual of the current year's revenues and expenses are taken into account regardless ofwhe~ cash is received or paid.
These two statements report the District's net position and changes in them. You can think of the District's net position, the difference between assets and liabilities, as one way to measure the District's fmancial health, or financial position. Over time, increases or decreases in the District's net position are one indicator whether its financial health is improving or deteriorating. You will need to consider other nonfmancial factors, however, such as changes in the District's property tax base, and the condition of the District's capital assets to assess the overall health of the District.
In the Statement of Net Position and the Statement of Activities, we divide the District into two kinds of activities:
oGovernmental activities: most of the District's basic services are reported here, including general administration. oLocal taxes, tuition and state and federal aid finance most of these activities. oBusiness-type-activities: the District has one (Food Service) proprietary fund as shown on pages 32 and 33.
14
Reporting the District's Most Significant Funds
Fund Financial Statements
Our analysis of the District's major funds begins on page 18. The fund fmancial statements begin on page 27 and provide detailed information about the most significant funds-not the District as a whole. Some funds are required to be established by State law. The District's two kinds of funds, governmental and proprietary, use different accounting approaches.
Governmental funds: most of the District's basic services are reported in governmental funds, which focus on how money flows into and out of those funds and the balances left at year-end that are available for spending. These funds are reported using an accounting method called modified accrual accounting, which measures cash and all other fmancial assets that can readily be converted to cash. The governmental fund statements provide a detailed short-term view of the District's general government operations and the basic services it provides. Governmental fund information helps one determine whether there are more or fewer financial resources that can be spent in the near future to finance the District's programs. We describe the relationship (or differences) between governmental activities (reported in the Statement of Net Position and the Statement of Activities) and governmental funds in a reconciliation on page 29.
Proprietary funds: when the District charges customers for the full cost of the services it provides, these services are reported in proprietary funds. Proprietary funds are reported in the same way that all activities are reported in the Statement of Net Position and the Statement of Activities. In fact, the District's enterprise funds (a component of business type funds) are the same as the business-type activities we report in the government-wide statements but provide more detail and additional information, such as cash flows, for proprietary funds.
The District as Trustee
Reporting the District's Fiduciary Responsibilities
The District is the trustee, or fiduciary, for the Unemployment Compensation Trust, Scholarship Funds and Agency Funds. All of the District's fiduciary activities are reported in separate Statements of Fiduciary Net Position and Changes in Fiduciary Net Position on pages 35 and 36. We exclude these activities from the District's other fmancial statements because the District cannot use these assets to finance its operations. The District is responsible for ensuring that the assets reported in these funds are used for their intended purposes.
15

THE DISTRICT AS A WHOLE
The District's combined net position changed from a year ago, increasing from $23,116,000 to $28,230,000. Looking at the net position and net expenses of governmental and business-type activities separately, different stories emerge. Our analysis below focuses on the net position (Table 1) and changes in net position (Table 2) of the District's governmental and business-type activities as ofJune 30,2015.
Table 1 Net Position (in Thousands)
Governmental Business-type Total Activities Activites PrimaDl GQv!m!ment
2015 2014 2015 2014 2015 2014
Current and other assets 26,030 11,350 212 96 26,242 11,446 Long tenn receivables Capital assets 31,147 30,471 46 53 31,193 301524
Total assets 57,177 41,821 258 149 57,435 41,970
Long-term debt outstanding 27,853 17,965 27,853 17,965 Other liabilities 1,250 855 102 34 1,352 889
Total liabilities 29,103 181820 102 34 29,205 18,854
Net assets: Net investment in capital assets 4,280 13,406 46 53 4,326 13,459 Restricted 20,256 6,127 20,256 6,127 Unrestricted (deficit) 3,538 3,468 110 62 3,648 31530
Total net position 28,074 231001 156 115 28,230 231116
Unrestricted net position, the part of net position that can be used to fmance day-to-day operations without constraints established by debt covenants, enabling legislation, or other legal requirements - increased $118,000. Restricted net position, those restricted mainly for capital projects increased by $14,129,000. This reflects mainly an increase in encumbrances and Capital Reserve funds. Capital assets reflect the original cost of land, buildings, and equipment less the accumulated depreciation. The long term outstanding debt includes the District bonds, leases, loans and compensated absences. The District remains fmancially stable with an unrestricted balance of $3,538,000 which reflects the District's free balance minus the allowance for potential compensated absences.
16

Table 2 Changes in Net Position (in thousands)
Governmental Business-type Total
Activities Activites Prim!!!:y Government
Wl 2014 Wl 2014 2015 1llli
Revenues Program revenues:
Charges for Services 2,466 2,234 938 854 3,404 3,088 Operating Grants and Contributions 12,912 13,237 282 312 13,194 13,549
General revenues: Property Taxes 78,147 76,567 78,147 76,567 Tuition 392 515 392 515 Federal and State Aid 495 290 495 290 Interest and Investment Earnings 55 22 56 23 Other General Revenues 207 136 207 136 Transfer (31) 31 Bond Proceeds 4\0 4\0 Adjustment to Capital Assets (1,046) (1,046) NJ.SOA Grant 3,260 3,260
Total Revenues 97,934 92,334 1,221 1,198 99,155 93,532
Promm eXllen~e~ iIIchu;!illil in!!irect ellllel!~!O:i
Instruction: Regular 34,728 35,171 34,728 35,171 Special 11,739 11,402 11,739 11,402 Other instruciton 4,455 4,438 4,455 4,438
Support services: Tuition 5,261 4,775 5,261 4,775 Student and instruction related services 12,798 12,6\0 12,798 12,610 School administrative services 5,057 5,\07 5,057 5,\07 . General and business administrative services 4,096 4,006 4,096 4,006 Plant operations and maintenance 8,208 8,582 8,208 8,582 P upiJ transportation 3,046 2,814 3,046 2,814
Special schools 2,587 2,547 2,587 2,547 Charter Schools 73 62 73 62 SOA Debt Service Assessment 77 77 77 77 Interest on long-term debt 736 582 736 582 Business-type activities:
Food Services 1,180 1,166 1,180 1,166
Total Expenses 92,861 92,173 1,180 1,166 94,041 93,339
Increase (Decrease) in Net Position 5,073 161 41 32 5,114 193
The district as a whole provides services for the students of Fair Lawn based on a budget adopted annually in March. The budget is consistent with guidelines of the CEIF A law, combining core curriculum and fmancial accountability.
The district outlook reflects a community without additional land to develop and therefore expects to maintain its' current asset base. The total revenues, exclusive of the Capital Assets adjustment and N.J. S.D.A. Grant, increased by approximately $1,294,000 with Property Taxes increasing by $1,733,926. On the expenditure side, the difference in expenditures represents the normal increases associated with continuing staffing levels.
17

THE DISTRICT'S FUNDS Governmental Activities
Table 3 Information below compares revenues and expenditures for aU governmental fund types for 2014-2015 and 2013-2014.
($000 omitted) Revenues by Source: 2014-2015 2013-2014 % Change
Local Tax Levy 78,883 77,149 2.25% Tuition Charges 392 516 -24.03% Transportation Fees 45 42 7.14% Interest Earned to Investments 55 23 139.13% Miscellaneous 1,936 1,790 8.16%
Total- Local Sources 81,311 79,520 2.25% State Sources 11,668 12,054 -3.20% Federal Sources 1,695 1,427 18.78%
Total Revenues 94,674 93,001 1.80%
Expenditures by Function: 2014-2015 2013-2014 % ~himg!< Current:
Regular Instruction 26,051 25,325 2.87% Special education 9,115 8,554 6.56% Other instruction 3,374 3,286 2.68%
Support Services and undistributed costs: Tuition 5,261 4,774 10.20% Student and instruction related services 9,981 9,602 3.95% School administrative services 3,746 3,644 2.80% General and Business administrative services 3,315 3,208 3.34% Plant operations and maintenance 7,235 7,480 -3.28% Pupil transportation 2,575 2,347 9.71% Employee Benefits 17,840 19,632 -9.13%
Capital Outlay 2,027 1,387 46.14% Special Schools 2,124 2,053 3.46% Charter Schools 73 62 Debt Service 1,524 1,849 -17.58%
Total Expenditures 94,241 93,203 1.11%
The District relies on the municipality to collect local tax levy in support of the budget approved by the voters. The District also relies on the continued support of categorical state aid based on student need and fmancial formulas : Federal support for the district is reflected in the IDEA and NCLB grants. The district is capable of generating limited revenue by earned interest, transportation fees, tuition charges and miscellaneous revenue. The district maintains an active Community School which is very successful in providing optional and convenient programs for both students and adults. This program is service oriented using the educational facilities of the district. Based on the district's commitment to state compliance regarding curriculum standards and other student needs, 75% of the budget is expended on salaries and benefits. Capital outlay represents 2.1 % of the total expenditures. This reflects a minimum standard to maintain our current facilities. The District's debt service reflects 1.6% of the total expenditures.
18

Business-type Activities
The District's major Enterprise Funds consist of the Food Service operation. The basic fmancial statements for the major funds are included in this report. Because the focus on business-type funds is a cost of service measurement or capital maintenance, we have included these funds in Table 4, which demonstrates return on ending assets and return on ending net position.
Table 4
($000 omitted)
Total Assets Net Position Change in Net Position
Return on Ending Total Assets
Return on Ending Net Position
Food Service
258 156 41
15.89%
26.28%
The district maintains a business operation for Food Service. This is based on the district qualifying for the National School Lunch Program with a limited number of low income students. The service is provided by a third party vendor which purchases supplies, provides personnel and serves lunches at 10 locations. The Board approves the Food Service contract in compliance with the New Jersey Department of Education guidelines and establishes the cost per lunch and a la carte items.
CAPITAL ASSET AND DEBT ADMINISTRATION
Capital Assets Table 5
Capital Assets at Year-end (Net of Depreciation, in thousands)
Land Land Improvements Buildings Machinery and Equipment Construction-in-progress
Subtotal Accumulated Depreciation
Totals
Governmental Activities
2lill. 2014
1,660 614 2,181 2,180
46,164 45,667 7,769 7,362
57,774 55,823 {26,627) {252353)
31,147 30,470
19
Business-type Activites
2015 2014
268
268 {222)
46
267
267 {214)
53
1,660 2,181
46,164 8,037
58,042 (26,849)
31 2193
614 2,180
45,667 7,629
56,090 {25,567)
30,523

DEBT
At year - end the District had total debt of $ 26,867,000 outstanding versus $17,066,000 last year - a increase of 57.43% - as shown in Table 6.
Outstanding Debt, at year-end (in thousands) Table 6
Serial Bonds Loans Authorized but not Issued
An analysis of District Debt is presented in Note IV:B to the basic fmancial statements.
BUDGETS
Governmental Activities
2014 2014
26,867 17,065
26,867 17,066
The significant variances between the originally adopted budget for the 2014-2015 year and the final budget were caused by the treatment of encumbrances that are added to the original budget and the appropriation of Fund Balance. In addition, transfers are made during the year to cover necessary expenditures without causing any budgetary line to have a negative balance.
The District's unreserved surplus was 3.58% of the budgetary expenditures after all adjustments were executed. The District remains in a stable financial position.
CONTACTING THE DISTRICT'S FINANCIAL MANAGEMENT
This financial report is designed to provide our citizens, taxpayers, customers, and investors and creditors with a general overview of the District's fmances and to show the District's accountability for the money it receives. If you have questions about this report or need additional financial information, contact the School Business Administrator, Fair Lawn School District, New Jersey.
20

BASIC FINANCIAL STATEMENTS
21

Section A
DISTRICT - WIDE FINANCIAL STATEMENTS
22

ExhlbltA-1 BOARD OF EDUCATION
BOROUGH OF FAIR LAWN Statement of Net Position
June 30, 2015
Governmental Business-type Actlvltl~§ Actlvltl~§ Total
ASSETS Cash and cash equivalents $ 4,613,705.83 $ 67,723.68 $ 4,681,429.51 Receivables, net 5,767,571.67 30,152.90 5,797,724.57 Interfunds receivable 5,256.13 104,742.66 109,998.79 Inventory 9,488.74 9,488.74 Prepaid expenses 3,495.00 3,495.00 Restricted assets:
Cash and cash equivalents 11,242,461.07 11,242,461.07 Capital reserve account - cash 4,397,715.18 4,397,715.18
Capital assets, net (Note III:C.): 31,1471067.60 451882.22 31 1192,949.82
Total Assets 571177,272.48 257,990.20 57,435,262.68
DEFERRED OUTFLOWS OF RESOURCES Deferred outflows related to pensions 21673,592.00 21673,592.00
Total Deferred Outflows of Resources 2,673,592.00 216731592.00
LIABILITIES Accounts payable 318,258.06 79,211.61 397,469.67 Interfunds payable 104,742.66 104,742.66 Payable to state government 35,207.42 35,207.42 Bond and loan interest payable 330,092.05 330,092.05 Unearned revenue 462,418.51 22.549.45 Noncurrent liabilities (Note IV:B.):
Due within one year 1,428,557.50 1,428,557.50 Due beyond one year 55,478,276.00 551478,276.00
Total liabilities 58,157,552.20 101,761.06 57,774,345.30
DEFERRED INFLOWS OF RESOURCES Deferred inflows related to pensions 1,731,478.00 1,731,478.00
Total Deferred Inflows of Resources 1,731,478.00 1 ?31 ,478.00
NET POSITION Net Investment In capital assets 4,280,067.60 45,882.22 4,325,949.82 Restricted for:
Capital projects 9,345,137.16 9,345,137.16 Debt service (229,907.14) (229,907.14) Other purposes 11,140,420.77 11,140,420.77
Unrestricted (24,573,884.11 ) 110,346.92 (24,463,537.19)
Total Net Position $ (381165.72) $ 156,229.14 $ 118,063.42
The accompanying Notes to Financial Statements are an Integral part of this statement.
23

ExhlbitA-2 BOARD OF EDUCATION
BOROUGH OF FAIR LAWN Statement of Activities
For the Year Ended June 30, 2015 Net (Expense) Revenue and
P!!!Sram Revenues Changes in Net Position Operating Capital
Charges for Grants and Grants and Governmental BUSiness-type FunctionsiPrograms Expenses Services Contributions Contributions ActIvities Activities I.2!!.!.
Governmental activities: Instruction:
Regular $ 34,812,630.69 $ $ 3,045,817.44 $ $ (31,766,813.25) $ $ (31,766,813.25) S~aleducation 11,765,414.18 3,698,238.13 (8,067,176.05) (8,067,176.05) Other instruction 4,465,706.06 337,243.94 (4,128,462.12) (4,128,462.12)
Support services: Tuition 5,261,421.88 3,129,572.53 (2,131,849.35) (2,131,849.35) Student and instruction related services 12,827,767.07 1,223,645.99 (11,604,121.08) (11,604,121.08) School administrative services 5,069,822.58 413,110.04 (4,656,712.54) (4,656,712.54) General and business administrative services 4,103,071.55 229,291.62 (3,873,779.93) (3,873,779.93) Plant operations and maintenance 8,217,671.27 292,304.17 (7,925,367.10) (7,925,367.10) Pupil transportation 3,050,624.10 45,164.00 388,855.61 (2,616,604.49) (2,616,604.49)
Special schools 2,592,269.66 1,685,141.82 153,757.93 (753,369.91 ) (753,369.91) Charter Schools 73,101.00 (73,101 .oo) (73,101.00) SDA Debt Service Assessment 77,256.00 (77,256.00) (77,256.00)
Interest on long-term debt 735,627.21 735,627.21
IV Total governmental activities 93,052,383.25 2,465,933.03 12,911,837.40 (77,674,612.82) (77.674.612.82)
~ Business-type activities:
Food Service 1.180.225.28 938.008.85 282,864.17 40,647.74 40,647.74
Total business-type activities 1,180,225.28 938,008.85 282,864.17 40,647.74 40,647.74
Total primary government $ 94.232,608.53 $ 3,403.941.88 ~:3,194,701.57 $ $ (77.674.612.82) $ 40.647.74 $ (77.633.965.08)
General revenues: Taxes:
Property taxes, levied for general purposes $ 77,888.891 .00 $ $ 77,888,891 .00 Property taxes. levied for debt service principal 258,353.79 258,353.79
Federal and State aid not restricted 495,180.38 495,180.38 Tuition (other than special schools) 392.162.32 392.162.32 Investment Earnings 54.879.59 156.42 55.036.01 Miscellaneous Income 207.074.31 207.074.31
N.J. School Development Authority Grants 3.260,394.00 3,260,394.00
Total general revenues, special items, extraordinary items and transfers 82,556.935.39 156.42 82,557,091.81
Change in Net Assets 4,882,322.57 40,804.16 4,923,126.73
Net Assets-beginning, as restated (4,920,488.29) 115,424.98 (4,805,063.31 )
Net Assels-ending $ (38,165.72) $ 156,229.14 $ 118,063.42
The accompanying Notes to Financial Statements are an Integral part of this statement

Section B
FUND FINANCIAL STATEMENTS
2S
GOVERNMENTAL FUNDS
26
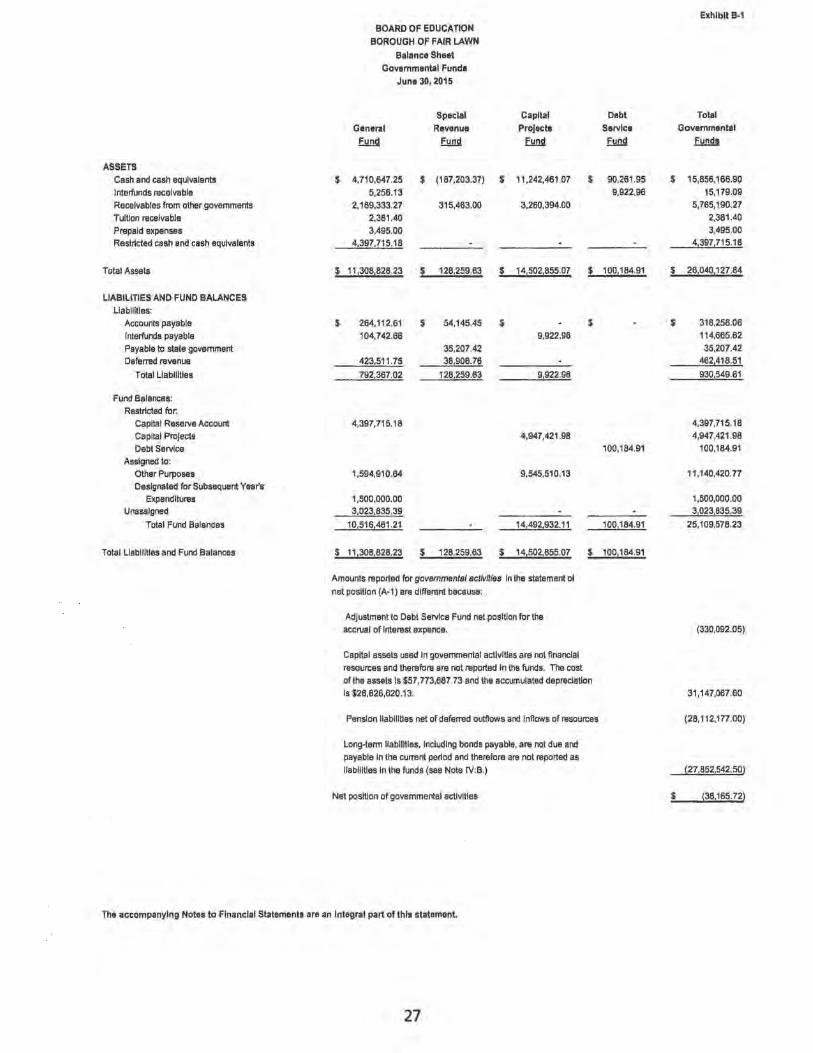
exhibit B-1 BOARD OF EDUCATION
BOROUGH OF FAIR LAWN
Balance Sheet Governmental Fundi
June 30. 2015
Spacial Capital Debt Total General Revenue Projects Service Governmentsl
Fund Fund Elm!l EY!!IJ EYn!Il
ASSETS Cash and cash equivalents $ 4,710,647.25 $ (187,203.37) $ 11,242,461 .07 $ 90,261 .95 $ 15,856,166.90 Interfunds receivable 5,256.13 9,922.96 15,179.09 Receivables from other govemments 2,189,333.27 315,483.00 3,260,394.00 5,785,190.27 TulUon receivable 2,381 .40 2,381 .40
Prepaid expenses 3,495.00 3,495.00 Restricted cash and cash equivalents 4,397,715.18 4,397,715.18
Total Assets $ 11,308,828.23 $ 128,259.63 $ 14,502,855.07 $ 100,184.91 $ 28,040,127.84
L1ABtLlTIES AND FUND BALANCES LIabilities:
Accounts payable $ 264,112.61 $ 54,145.45 $ $ $ 318,258.08 Interfunds payable 104,742.68 9,922.96 114,665.62
Payable to state government 35,207.42 35,207.42 Deferred revenue 423,511 .75 38,906.76 462,418.51
Total LIabilities 792,367.02 128,259.63 9,922.98 930,549.61
Fund Balances: Restricted for:
Capital Reserve Account 4,397,715.18 4,397,715.16 Capital Projects 4,947,421.98 4,947,421.98 Debt Service 100,184.91 100,184.91
Assigned to: Other Purposes 1,594,910.64 9,545,510.13 11 ,140,420.77 Designated for Subsequent Year's
Expenditures 1,500,000.00 1,500,000.00 Unassigned 3,023,835.39 3,023,835.39
Total Fund Balances 10,516,461.21 14,492,932.11 100,184.91 25,109,578.23
Total Uabillties and Fund Balances $ 11,308,828.23 $ 128,259.83 $ 14,502,855.07 $ 100,184.91
Amounts reported for govsrnmental actlvltlas In the statement of net poslUon (A-1) are different beceuse:
Adjustment to Debt Service Fund net position for the accrual of Interest expence. (330,092.05)
Capital assets used In govemmental acUvlUes are not financial resources and therefore are not reported In the funds. The cost of the assets Is $57,773,687.73 and the accumulated depreclaUon Is $26,626,620.13. 31,147,067.60
Pension liabilities net of deferred outflows and Inflows of resources (28,112,177.00)
Long-term liabilities, Including bonds payable, are not due and peyable In the current pertod and therefore are not reported as liabilities In the funds (see Note IV:B.) (27,852,542.50)
Net position of governmental acUvltles $ !38,165.72)
The accompanying Notes to Financial Statements are an Integral part of this statement
27

Exhibit B·2 BOARD OF EDUCATION
BOROUGH OF FAIR LAWN Statement of Revenues, Expenditures, And Changes In Fund Balances
Governmental Fundi For the Year Ended June 30, 2015
Special Capital Debt Total General Revenue ProJecta Service Governmental
Fund Fund Fund Fund Fund.
REVENUES Local sources:
Local tax levy $ 77,BB8,891.00 $ $ $ 993,981.00 S 78,882,872.00 TuiUon charges 392,162.32 392,162.32 Transportation fees 45,184.00 45,164.00 Interest eamed on Investments 43,467.92 9,922.96 53,390.88 Interest eamed on Capital Reserve Funds 1,488.71 1,488.71 Miscellaneous 1,B92,216.13 44,248.17 1,938,484.30
Total· Local Sources 80,263,390.08 44,248.17 9,922.96 993,981.00 81,311,542.21
State sources 11,438,498.45 231,728.58 11,668,227.03 Federal sources 173,364.58 1,521,178.00 1,694,542.58
Total Revenues 91,873,253.11 1,797,154.75 9,922.98 993,9Bl.00 94,674,311.82
EXPENDITURES Current:
Regular Instruction 25,725,538.61 324,975.51 26,050,512.12 Spacial education Instruction 7,987,792.71 1,127,556.00 9,115,350.71 Other Instruction 3,374,071.27 3,374,071.27 Support services and undistributed costs:
Tuition 5,281,421.86 5,261,421.88 Student and Instruction relatad services 9,701,559.15 279,727.24 9,981,266.39 School edmlnlstratlve services 3,745,928.14 3,745,926.14 General and business administrative services 3,314,628.04 3,314,628.04 Ptant operations anel maintenance 7,234,782.88 7,234,7B2.86 Pupil transportation 2,574,590.57 2,574,590.57 Unallocated beneflla 17,775,373.46 84,894.00 17,840,267.46
Special schools 2,124,550.43 2,124,550.43 Transfer to charter school 73,101.00 73,101.00 Capital outlay 981,300.84 1,045,531.69 2,026,832.73 Debt service:
Principal 875,000.00 875,000.00 Interest and other charges 648,858.28 648,856.28
Total expenditures 89,874,636.98 1,797,154.75 1,045,531.89 1,523,858.26 94,241,179.88
Excess (Deficiency) of revenues over expenditures 1,996,616.13 (1,035,608.93) (529,675.26) 433,131 .94
OTHER FtNANCtNG SOURCES AND (USES) N.J. School Development Authority Grants 3,260,394.00 3,260,394.00 Seriel Bond Proceeds 10,677,000.00 10,677 ,000.00 Capital leases (non·budgeted) Transfer to Special Revenue Fund· ECPA Transfers In 1,601,070.00 509,922.96 2,110,992.96 Transfers (out) (2,101,070.00) (9,922.96) (2,110,992.98)
Total Other Financing Sources and (Uses) (2,101,070.00) 15,528,541.04 509,922.96 13,937,394.00
Net change In fund balances (102,453.87) 14,492,932.11 (19,952.30) 14,370,525.94 Fund Balance-July 1 10,618,915.08 120,137.21 10,739,052.29
Fund Balance-June 30 S 10,518,461.21 S S 14,492,932.11 S 100,1B4.91 S 25,109,57B.23
The accompanytng Notes to Flnanctal Statements are an Integral part of this statement
28

BOARD OF EDUCATION BOROUGH OF FAIR LAWN
ReconciliatIon of the Statement of Revenues, Expenditures, and Changes In Fund Balances of Govemmental Funds
to the Statemant of Actlvltlll For the Year Ended June 3D, 2015
Total net change In fund balanclI • governmental fundi (from B-2)
Amounts reported for govemmental activities In the statement of activities (A-2) are different because:
In the statement of activities, Interest on long·term debt In the statement of activities Is accrued. regardless of when due. In the governmental funds, Interest Is reported when due. The difference In accrued Interest Is an addition In the reconciliation. (+)
Interest paid Interest accrued
Capital outlays are reported In governmental funds as expenditures. However, In the statement of activities, the cost of those assets Is allocated over their estimated useful lives as depreciation expense. This Is the amount by which capital outlays exceeded depreciatlon In the period.
Depreciation expense Capital outlays (exclusive of capital lease principal payments and
SDA Debt Servlve Assessment)
Adjustment to Capital Assets In accordance with physical appraisal and dispositions
In the statement of activities, only the gaIn on the dIsposal of capItal assets Is reported, whereas In the governmental funds, the proceeds from a sale Increase financial resources. ThuB, the change In net assets will differ from the change In fund balance by the cost of the asset removed. (-)
In the statement of activItIes, certaIn operetlng expenses, e.g., compensated absences (vacations and unused sick pay) are measured by the amounts earned during the year. In the governmental funds, however, expenditures for these Items are reported In the amount of financial resources used (paId). When the eamed amount exceeds the paid amount, the dIfference Is reduction In the reconcillal/on (.); when the paid amount exceeds the eamed amount the difference Is an addltlon In the reconciliation (+).
Governmental funds report district pension contributions as expenditures. In the statement ofactivitcs, however. the cost of pension benefits eamed net of employee contributions is reported as pension expense.
Dlstrlct pensIon contr1butlons • PERS Cost of benefits eamed net of
employees contrlbutlons
Payment of long-term liability principal Is an expenditure In the governmental funds, but the repayment reduces long-term liabilities In the statement of net assets and Is not reported In the statement of activities.
Debt principal Capital lease prinCipal
Proceeds from debt Issues are a financing source In the governmental funds. They are not revenue In the statement of activities; Issuing debt Increases long-term liabilities In the statement of net assets.
Proceeds of long-term debt Capital lease proceeds
Revenues In the statement of activities which do not provide current financial resources are not reported as revenues In the funds. (+)
Change In net positIon of governmental actlylt111
The accompanyIng Notll to FInancIal Statements are an Integral part of thIs statement.
29
ExhIbit B-3
$ 14,370,525.94
$ 648,856.26 (735,627.21 )
(86,770.95)
(1,273,240.13)
1,949,576.73 676,336.60
(85,115.00)
1,279,297.00
(1,469,951.02) ( 190,654.02)
875,000.00
(10,677,000.00)
$ 4,882,322.57

PROPRIETARY FUNDS
30

ASSETS
Current Assets: Cash and cash equivalents Accounts receivable Interfunds receivable Other receivables Inventories
Total Current Assets
Noncurrent assets: Furniture, machinery and equipment Less accumulated depreciation
Total Noncurrent Assets Total Assets
LIABILITIES
Current Liabilities: Accounts payable Unearned revenue
Total Current Liabilities
NET POSITION
Net Investment in capital assets Unrestricted
Total Net Position
BOARD OF EDUCATION BOROUGH OF FAIR LAWN Statement of Net Position
Proprietary Funds June 30,2015
$
Exhibit B-4
Business-type Activities -Enterprise Funds
Food Service Totals
67,723.68 20,379.70
104,742.66 9,773.20 9,488.74
212,107.98
267,621 .53 (221,739.31)
45,882.22
257,990.20
79,211.61 22,549.45
101,761.06
45,882.22 110,346.92
$ 67,723.68 20,379.70
104,742.66 9,773.20 9,488.74
212,107.98
267,621.53 (221,739.31)
45,882.22
257,990.20
79,211.61 22,549.45
101,761.06
45,882.22 110,346.92
$ 156,229.14 $ 156,229.14
The accompanying Notes to Financial Statements are an integral part of this statement
31 .

BOARD OF EDUCATION BOROUGH OF FAIR LAWN
Exhibit 8-5
Statement of Revenues, Expenses, and Changes In Fund Net Position Proprietary Funds
For the Year Ended June 30, 2015
Operating Revenues: Charges for services:
Daily sales - reimbursable programs Daily sales - non-reimbursable programs Special functions
Total Operating Revenues
Operating Expenses: Cost of sales Salaries Employee benefits Administration and management fees General supplies Other purchased services Depreciation
Total Operating Expenses
Operating Income (Loss)
Nonoperating Revenues (Expenses): State sources:
State school lunch program Federal sources:
National school lunch program Food distribution program
Interest and investment revenue
Total Nonoperating Revenues (Expenses)
Income (loss) before contributions and transfers Transfers in (out)
Change in Net Position Tote Net Position-beginning
Tote Net Position-ending
$
$
The accompanying Notes to Financial Statements are an integral part of this statement.
32
Business-type Activities -Enterprise Funds
Food Service
510,194.73 $ 371,955.78 55,858.34
938,008.85
482,510.91 370,247.14
97,491.10 90,746.20 80,331.44 51,545.71 7,352.78
1,180,225.28
(242,216.43)
11,157.13
237,398.25 34,308.79
156.42 283,020.59
40,804.16
40,804.16 115,424.98
156,229.14 $
510,194.73 371,955.78 55,858.34
938,008.85
482,510.91 370,247.14
97,491.10 90,746.20 80,331.44 51,545.71
7,352.78
1,180,225.28
(242,216.43)
11,157.13
237,398.25 34,308.79
156.42 283,020.59
40,804.16
40,804.16 115,424.98
156,229.14

BOARD OF EDUCATION BOROUGH OF FAIR LAWN Statement of Cash Flows
Proprietary Funds For the Year Ended June 3D, 2015
CASH FLOWS FROM OPERATING ACTIVITIES Recelpls from cuslomers Payments to employees Payments for employee benefits Payments to suppliers
Net cash provided by (used for) operating activities
CASH FLOWS FROM NON CAPITAL FINANCING ACTIVITIES State Sources Federal Sources Operating subsidies and transfers to other funds
Net cash provided by (used for) non-capital financing activities
CASH FLOWS FROM INVESTING ACTIVITIES Interest and dividends
Net cash provided by (used for) investing activities
Net increase (decrease) In cash and cash equivalents Balances-beginning of year
Balances-end of year
Reconciliation of operating Income (loss) to net cash provided by (used for) operating activities:
Operating Income (loss)
Adjustments to reconcile operating income (loss) to net cash provided by (used for) operating activities:
Depreciation and net amortization (Increase) decrease in accounts receivable, net (Increase) decrease In Inventories Increase (decrease) in accounts payable Increase (decrease) In unearned revenue
Total adjustments
Net cash provided by (used for) operating activities
The accompanying Notes to Financial Statements are an Integral part of this statement
33
$
$
$
$
Exhibit B-6
Business-type Activities -Enterprise Funds
Food
823,843.72 $ 823,843.72 (370,247.14) (370,247.14)
(97,491.10) (97,491.10)
(613,408.00) (613,408.00)
(257,302.52) (257,302.52)
11,157.13 11,157.13 271,707.04 271,707.04
282,864.17 282,864.17
156.42 156.42
156.42 156.42
25,718.07 25,718.07 42,005.61 42,005.61
67,723.68 $ 67,723.68
(242,216.43) $ (242,216.43)
7,352.78 7,352.78
(104,888.62) (104,888.62)
14,493.80 14,493.80
77,232.46 77,232.46
(9,276.51) (9,276.51)
(15,086.09) 115,086.09)
(257,302.52) $ (257,302.52)

FIDUCIARY FUNDS
34

ASSETS Cash and cash equivalents
Total Assets
LIABILITIES Payable to district Payable to student groups Payroll deductions and withholdings
Section 125 Plan
Total Liabilities
NET POSITION Held in trust for unemployment
claims and other purposes
Reserved for leases
BOARD OF EDUCATION BOROUGH OF FAIR LAWN
Statement of Fiduciary Net Position Fiduciary Funds
June 30, 2015
Unemployment Compensation
Trust
$ 525,885.30
$ 525,885.30
$
$ 525,885.30
Rental Escrow
$ 10,517.64
$ 10,517.64
$ 3.55
3.55
$ 10,514.09
The accompanying Notes to Financial Statements are an integral part of this statement.
35
Exhibit B-7
Agency Fund
$ 601,784.94
$ 601,784.94
$ 5,252.58 267,468.04 329,064.32
4,375.39
$ 601,784.94

ADDITIONS Contributions:
Plan member Board of Education
Total Contributions
Investment earnings: Interest
BOARD OF EDUCATION BOROUGH OF FAIR LAWN
Statement of Changes in Fiduciary Net Position Fiduciary Funds
For the Year Ended June 3D, 2015
Unemployment Compensation
Trust
$ 138,824.92
138,824.92
496.63 Net investment earnings 496.63
Total Additions 139,321.55
DEDUCTIONS Unemployment claims 125,256.88 Administrative expenses
Total Deductions 125,256.88 Change in Net Position 14,064.67
Net Position-beginning 511,820.63
Net Position-ending $ 525,885.30
The accompanying Notes to Financial Statements are an Integral part of this statement.
36
Exhibit B-8
Rental Escrow
$
812.50 812.50
(812.50) 11,326.59
$ 10,514.09

NOTES TO BASIC FINANCIAL STATEMENTS
37
BOARD OF EDUCATION BOROUGH OF FAIR LAWN
NOTES TO BASIC FINANCIAL STATEMENTS YEAR ENDED JUNE 30, 2015
Note I: Summary of Significant Accounting Policies
A. Basis of Presentation
The financial statements of the Board of Education (Board) of the Borough of Fair Lawn School District (District) have been prepared in confonnity with generally accepted accounting principles (GAAP) as applied to governmental units. The Governmental Accounting Standards Board (GAS B) is the accepted standard-setting body for establishing governmental accounting and fmancial reporting principles. In its accounting and fmancial reporting, the District follows the pronouncements of the Governmental Accounting Standards Board (GASB). The more significant accounting policies established in GAAP and used by the District are discussed below.
B. Reporting Entity
The Borough of Fair Lawn School District is an instrumentality of the State of New Jersey, established to function as an educational institution. The Board consists of elected officials and is responsible for the fiscal control of the District. A superintendent is appointed by the Board and is responsible for the administrative control of the District.
The primary criterion for including activities within the District's reporting entity, as set forth in Section 2100 of the GASB Codification of Governmental Accounting and Financial Reporting Standards, is the degree of oversight responsibility maintained by the District. Oversight responsibility includes fmancial interdependency, selection of governing authority, designation of management, ability to significantly influence operations and accountability for fiscal matters. The combined financial statements include all funds of the District over which the Board exercises operating control. The operations of the District include six elementary, two middle and one senior high schools located in Fair Lawn. There were no additional entities required to be included in the reporting entity under the criteria as described above, in the current fiscal year. Furthennore, the District is not includable in anyother reporting entity on the basis of such criteria.
C. Basic Financial Statements- Government-Wide Statements
The District's basic fmancial statements include both government-wide (reporting the District as a whole) and fund financial statements (reporting the District's major funds). Both the government-wide and fund financial statements categorize primary activities as either governmental or business type. The District's general and special revenue activities are classified as governmental activities. The District's food service program is classified as business-type activity.
In the government-wide Statement of Net Position, both the governmental and business-type activities columns (a) are presented on a consolidated basis by column, (b) and are reported on a full accrual, economic resource basis, which recognizes all long-tenn assets and receivables as well as long-term debt and obligations. The District's net position are reported in three parts-invested in capital assets, net of related debt; restricted net position; and unrestricted net position. The District first utilizes restricted resources to fmance qualifying activities.
38

BOARD OF EDUCATION BOROUGH OF FAIR LAWN
NOTES TO BASIC FINANCIAL STATEMENTS YEAR ENDED JUNE 30, 2015
Note I: Summary of Significant Accounting Policies (Continued)
C. Basic Financial Statements- Government-Wide Statements
The government-wide Statement of Activities reports both the gross and net costs of each of the District's functions and business-type activities. The functions are also supported by general government revenues (property taxes, tuition, certain intergovernmental revenues, etc.). The Statement of Activities reduces gross expenses (including depreciation) by related program revenues, operating and capital grants. Program revenues must be directly associated with the function (regular instruction, vocational programs, student and instruction related services, etc.) or a business-type activity. Operating grants include operating-specific and discretionary (either operating or capital) grants while the capital grants column reflects capita~specific grants.
The net costs (by function or business-type activity are normally covered by general revenue (property taxes, tuition, interest income, etc.).
a. The District allocates indirect costs such as on-behalf TPAF Pension Contributions, and Reimbursed TPAF Social Security Contributions.
The government-wide focus is more on the sustainability of the District as an entity and the change in the District's net position resulting from the current year's activities. Fiduciary funds are excluded from the government-wide financial statements.
D. Basic Financial Statements- Fund Financial Statements
The fmancial transactions of the District are reported in individual funds in the fund fmancial statements. Each fund is accounted for by providing a separate set of self-balancing accounts that comprises its assets, liabilities, reserves, fund equity, revenues and expenditures/expenses. The various funds are reported by generic classification within the fmancial statements.
The emphasis in fund financial statements is on the major funds in either the governmental or businesstype activities category are summarized into a single column. GASBS No. 34 sets forth minimum criteria (percentage of the assets, liabilities, revenues or expenditures/expenses of either fund category or the governmental and enterprise combined) for the determination of major funds. The nonmajor funds are combined in a column in the fund fmancial statements. The State of New Jersey Department of Education has mandated tha: all New Jersey School districts must report all governmental funds as major, regardless of the fund meeting the GASB defmition of a major fund. However, the GASB criteria are applied to proprietary funds.
•
39

BOARD OF EDUCATION BOROUGH OF FAIR LAWN
NOTES TO BASIC FINANCIAL STATEMENTS YEAR ENDED JUNE 30, 2015
Note I: Summary of Significant Accounting Policies (Continued)
D. Basic Financial Statements- Fund Financial Statements (Continued)
The following fund types are used by the District:
Governmental Fund Types
The focus of the governmental funds' measurement (in the fund statements) is upon determination of fmancial position and changes in financial position (sources, uses, and balances of fmancial resources) rather than upon net income. The following is a description of the governmental funds of the District:
General Fund - The general fund is the general operating fund of the District. It is used to account for all financial resources except those required to be accounted for in another fund. Included are certain expenditures for vehicles and movable instructional or non instructional equipment which are classified in the Capital Outlay subfund.
As required by the New Jersey State Department of Education, the District includes budgeted Capital Outlay in this fund. Generally accepted accounting principles as they pertain to governmental entities state that General Fund resources may be used to directly finance capital outlays for long-lived improvements as long as the resources in such cases are derived exclusively from unrestricted revenues.
Resources for budgeted capital outlay purposes are normally derived from State of New Jersey Aid, district taxes and appropriated fund balance. Expenditures are those that result in the acquisition of or additions to fixed assets for land, existing buildings, improvements of grounds, construction of buildings, additions to or remodeling of buildings and the purchase of built-in equipment. These resources can be transferred from and to Current Expense by board resolution and, excluding equipment, with County Superintendent approval.
Special Revenue Fund - The Special Fund is used to account for the proceeds of specific revenue from State and Federal Government, (other than major capital projects, Debt Service or the Enterprise Funds) and local appropriations that are legally restricted to expenditures for specified purposes.
Capital Projects Fund - The Capital Projects Fund is used to account for all financial resources to be used for the acquisition or construction of major capital facilities (other than those financed by Proprietary Funds). The fmancial resources are derived from temporary notes or serial bonds that are specially authorized by the voters as a separate question on the ballot either during the annual election or at a special election.
Debt Service Fund - The Debt Service Fund is used to account for the accumulation of resources for, and the payment of principal and interest on bonds issued to fmance major property acquisition, construction and improvement programs.
Permanent Fund - A permanent fund is used to account for assets held under the terms of a formal trust agreement, whereby the District is under obligation to maintain the trust principal.
40

BOARD OF EDUCATION BOROUGH OF FAIR LAWN
NOTES TO BASIC FINANCIAL STATEMENTS YEAR ENDED JUNE 30, 2015
Note I: Summary of Significant Accounting Policies (Continued)
D. Basic Financial Statements- Fund Financial Statements (Continued)
Fund Balances - Governmental Funds
In the fund fmancial statements, governmental funds report the following classifications of fund balance:
Nonspendable - includes amounts that cannot be spent because they are either not spendable in fonn or are legally or contractually required to be maintained intact.
Restricted - includes amounts restricted by external sources (creditors, laws or other governments, etc.) or by constitutional provision or enabling legislation.
Committed - includes amounts that can only be used for specific purposes. Committed fund balance is reported pursuant to resolutions passed by the Board of Education, the District's highest level of decision making authority. Commitments may be modified or rescinded only through resolutions approved by the Board of Education.
Assigned - includes amounts that the District intends to use for a specific purpose, but do not meet the definition of restricted or committed fund balance. Under the District's policy, amounts may be assigned by the Business Administrator.
Unassigned - includes amounts that have not been assigned to other funds or restricted, committed or assigned to a specific purpose within the General Fund. The District reports all amounts that meet the unrestricted General Fund Balance Policy described below as unassigned.
The details of the fund balances are included in the Governmental Funds Balance Sheet. When an expenditure is incurred for purposes for which both restricted and unrestricted fund balance is available, the District considers restricted funds to have been spent first. When an expenditure is uncured for which committed, assigned, or unassigned fund balance are available, the District considers amounts to have been spent first out of committed funds, then assigned funds, and finally unassigned funds as needed.
Proprietary Fund Type
The focus of Proprietary Fund measurement is upon detennination of net income, changes in net position, financial position and cash flows. The generally accepted accounted principles applicable are those similar to businesses in the private sector. The following is a description of the Proprietary Funds of the District:
Enterprise Funds - The Enterprise Funds are utilized to account for operations that are fmanced and operated in a manner similar to private business enterprises - where the intent of the District is that the costs (i.e. expenses including depreciation and indirect costs) of providing goods or services to the students on a continuing basis be financed or recovered primarily through user charges; or, where the District has decided that the periodic determination of revenues earned, expenses incurred, and/or net income is appropriate for capital maintenance, public policy, management control, a;countability or other purposes.
41
BOARD OF EDUCATION BOROUGH OF FAIR LAWN
NOTES TO BASIC FINANCIAL STATEMENTS YEAR ENDED JUNE 30. 2015
Note I: Summary of Significant Accounting Policies (Continued)
D: Basic Financial Statements- Fund Financial Statements (Continued)
The District's Enterprise Fund is comprised of the Food Service Fund
Depreciation of all exhaustive fixed assets used by proprietary funds is charged as an expense against their operations. Accumulated depreciation is reported on proprietary fund balance sheets. Depreciation has been provided over the estimated useful lives using the straight-line method. The estimated useful lives are as follows:
Food Service Fund: Equipment Light Trucks and Vehicle Heavy Trucks and Vehicle
Fiduciary Fund Types
12 Years 4 Years 6 Years
Fiduciary Funds are used to report assets held in a trustee or agency capacity for others and therefore are not available to support District programs. The reporting focus is on net position and changes in net position and are reported using accounting principles similar to proprietary funds.
The District's fiduciary funds are presented in the fiduciary fund fmancial statements by type (Unemployment Compensation, private purpose and agency). Since by defmition these assets are being held for the benefit of a third party (other local governments, private parties, pension participants, etc.) and cannot be used to address activities or obligations of the government, these funds are not incorporated into the government-wide statements.
E. Basis of Accounting
Basis of accounting refers to the point at which revenues or expenditures/expenses are recognized in the accounts and reported in the financial statements. It relates to the timing of the measurements made regardless of the measurement of focus applied.
l. Accrual:
Both governmental and business-type activities in the government-wide financial statements and proprietary and fiduciary fund financial statements are presented on the accrual basis of accounting. Revenues are recognized when incurred.
42

BOARD OF EDUCATION BOROUGH OF FAIR LAWN
NOTES TO BASIC FINANCIAL STATEMENTS YEAR ENDED JUNE 30, 2015
Note I: Summary of Significant Accourting Policies (Continued)
E. Basis of Accounting (Continued)
2. Modified Accrual:
The governmental fund fmancial statements are presented on the modified accrual basis of accounting. Under the modified accrual basis of accounting, revenues are recorded when susceptible to accrual; Le., both measurable and available. "Available" means collectible within the current period or within 60 days after year end. Expenditures are generally recognized under the modified accrual basis of accounting when the related liability is incurred. The exception to this general rule is that principal and interest on general obligation long-term debt, if any, is recognized when due.
3. Revenues:
Substantially all governmental fund revenues are accrued. Property taxes are susceptible to accrual and under New Jersey State Statutes a municipality is required to remit to its school district the entire balance of taxes in the amount voted upon or certified, prior to the end of the school year. The District records the entire approved tax levy as revenue (accrued) at the start of the fiscal year, since the revenue is both measurable and available. Subsidies and grants to proprietary funds, which fmance either capital or current operations, are reported as non operating revenue. In respect to grant revenues, the provider recognizes liabilities and expenses and recipient recognizes receivables and revenue when the applicable eligibility requirements, including time requirements are met. Resources transmitted before the eligibility requirements are met are reported as advances by the provider and deferred revenue by the recipient. Program revenues, including tuition revenue, are reported as reductions to expenses in the Statement of Activities.
4. Expenditures:
Expenditures are recognized when the related fund liability is incurred. Inventory costs are reported in the period when inventory items are used, rather than in the period of purchase.
F. Budgets/Budgetary Control
Annual appropriated budgets are prepared in the spring of each year for the general, special revenue and debt service funds. The budgets are submitted to the county office for approval and, as long as the District budget is within State mandated CAPs, there is no public vote on the budget. If the budget exceeds State mandated CAPS, the voters have an opportunity to approve or reject the budget at the regular election held in November.
43

BOARD OF EDUCATION BOROUGH OF FAIR LAWN
NOTES TO BASIC FINANCIAL STATEMENTS YEAR ENDED JUNE 30, 2015
Note I: Summary of Significant Accounting Policies (Continued)
F. Budgets/Budgetary Control (Continued)
Budgets are prepared using the modified accrual basis of accounting. The legal level of budgetary control is established at line item accounts within each fund. Line item accounts are defmed as the lowest (most specific) level of detail as established pursuant to the minimum chart of accounts referenced in N.J.A.C. 6:23-2.2(f). All budget amendments must be approved by School Board resolution. Appropriation of additional fund balance in the amount of $1,419, 192.00, and prior year encumbrances in the amount of $1,724,790.87 were made during the year ended June 30, 2015. The Board of Education approved the following material budgetary appropriation transfers during the school year:
Account Name Regular Programs- Instruction
Grades 1-5 - Salaries of Teachers Grades 9-12 - Salaries of Teachers
Regular Programs - Undistributed Instruction Purchased Professional - Educational Services Other Objects
Learning and/or Language Disabilities: Salaries of Teachers Other Salaries for instruction
Preschool Disabilities - Part-Time: Salaries of Teachers Other Salaries for instruction
Preschool Disabilities - Full Time: Salaries of Teachers Other Salaries for Instruction
Home Instruction: Salaries of Teachers
Undistributed Expenditures- Instruction: Tuition to Other LEAs Within the State- Special Tuition to CSSD & Regional Day Schools Tuition to Private Schools for the Disabled -Within State
Undistributed Expenditures- Speech, OT, PT & Related Services Purchased Professional - Educational Services
Undistributed Expenditures- Guidance Salaries of Other Professional Staff
Undistributed Expenditures - Child Study Team Other Salaries
Undistributed Expenditures - Improvement ofInst. Serv, Undistributed Expenditures- Supp. Serv.- - General Admin
Amount
(366,254.43) (425,583.89)
796,185.73 145,286.60
(106,206.00) 13l,272.09
(332,020.00) (542,529.45)
331,625.00 522,038.65
96,973.91
145,998.84 247,063.73 267,561.19
289,320.27
(92,709.39 )
(265,484.31 )
Judgments Against the School District (125,646.44) Undistributed Expenditures- Allowable Maint. for School Facilities
General Supplies 122,400.78 Undistributed Expenditures - Custodial Services
Salaries Purchased Professional and Technical Services
Undistributed Expenditures- Student Transportation Servo Salaries for Pupil Trans. (between Home & School) - Special
Contracted Services (Special Education Students) - ESCs Unallocated Benefits
Health Benefits Undistributed Expenditures:
School Buses - Special
44
(283,294.20) 99,244.28
95,268.35 246,487.21
(90,186.33)
154,330.72

BOARD OF EDUCATION BOROUGH OF FAIR LAWN
NOTES TO BASIC FINANCIAL STATEMENTS YEAR ENDED JUNE 30,2015
Note I: Summary of Significant Accounting Policies (Continued)
F. Budgets/Budgetary Control (Continued)
Formal budgetary integration into the accounting system is employed as a management control device during the year. For governmental funds there are no substantial differences between the budgetary basis of accounting and generally accepted accounting principles with the exception of legally mandated revenue recognition of the one or more June state aid payments for budgetary purposes only and the special revenue fund as noted below. Encumbrance accounting is also employed as an extension of fonnal budgetary integration in the governmental fund types. Unencumbered appropriations lapse at fiscal year end.
The accounting records of the special revenue fund are maintained on the grant accounting budgetary basis. The grant accounting budgetary basis differs from GAAP in that the grant accounting budgetary basis recognizes encumbrances as expenditures and also recognizes the related revenues, whereas the GAAP basis does not. Sufficient supplemental records are maintained to allow for the presentation of GAAP basi; financial reports.
The special revenue fund had no encumbrances at June 30,2015.
The reconciliation of the general and special revenue funds from the budgetary basis of accounting to the GAAP basis of accounting is as follows.
Sources/inflows of resources Actual amounts (budgetary basis) "revenue"
from the budgetary comparison schedule Difference - budget to GAAP:
The last two State aid payments are recognized as revenue for budgetary purposes, and differs from GAAP which does not recognize this revenue until the subsequent year when the State recognizes
the related expense in accordance with GASB 33.
Grant accounting budgetary basis differs from GAAP in that encumbrances are recognized as expenditures, and the related revenue is recognized.
Total revenues as reported on the statement of revenues, expenditures and changes in fund balances - governmental funds.
Uses/outflows of resources Actual amounts (budgetary basis) "total outflows" from the
budgetary comparison schedule Differences - budget to GAAP
Encumbrances for supplies and equipment ordered but not received are reported in the year the order is placed for budgetary purposes, but in the year the supplies are received
for financial reporting purposes.
Total expenditures as reported on the statement of revenues, expenditures, and changes in fund balances - governmental funds
45
General Fund
$ 91,845,798.11
27,455.00
$ 91,873,253.11
$ 89,874,636.98
$ 89.874.636.98
Special Revenue
Fund
$ 1,797,154.75
$ 1,797,154.75
$ 1,797,154.75
$ 1.797.154.75

BOARD OF EDUCATION BOROUGH OF FAIR LAWN
NOTES TO BASIC FINANCIAL STATEMENTS YEAR ENDED JUNE 30, 2015
Note I: Summary of Significant Accounting Policies (Continued)
G. Assets, Liabilities and Fund Equity
1. Deposits and Investments
Deposits are cash and cash equivalents including petty cash, change funds, cash in banks and all highly liquid investments with a maturity of three months or less at the time of purchase and are stated at cost plus accrued interest. Other than Certificates of Deposit, deposits with maturities of greater than three months are considered to be Investments. U.S. Treasury and agency obligations and certificates of deposit with maturities of one year or less when purchased are stated at cost. All other investments are stated at fair value.
New Jersey school districts are limited as to the types of investments and types of financial institutions they may invest in. New Jersey statute 18A:20-37 provides a list of permissible investments that may be purchased by New Jersey school districts.
2. Short - term Interfund Receivables/Payables
Short - term interfund receivables/payables represents amounts that are owed, other than charges for goods or services rendered to/from a particular fund in the District and that are due within one year.
3. Inventories and Prepaid Expenses
Inventories, which benefit future periods, other than those recorded in the enterprise fund are recorded as expenditure during the year of purchase.
Enterprise fund inventories are valued at cost, which approximates market, using the frrst-in-first-{)ut (FIFO) method.
Prepaid expenses represent payments made to vendors for services that will benefit periods beyond June 30, 2015.
4. Capital Assets
Capital assets purchased or acquired with an original cost of $2,000 or more are reported at historical cost or estimated historical cost. Contributed assets are reported at fair market value as of the date received. Additions, improvements and other capital outlays that significantly extend the useful life of an asset are capitalized. Other costs incurred for repairs and maintenance are expensed as incurred. Depreciation on the following assets is provided on the straight-line basis over the following estimated useful lives:
Buildings Machinery and Equipment Land Improvements Other Infrastructure
20-50 years 5-10 years
10-20 years 10-50 years
Land and Construction in Progress are not depreciated.
46
BOARD OF EDUCATION BOROUGH OF FAIR LAWN
NOTES TO BASIC FINANCIAL STATEMENTS YEAR ENDED JUNE 30, 2015
Note I: Summary of Significant Accounting Policies (Continued)
G. Assets, Liabilities and Fund Equity (Continued)
4. Capital Assets (Continued)
GASB No. 34 requires the District to report and depreciate new infrastructure assets effective with the beginning of the current year. Neither their historical cost nor related depreciation has historically been reported in the financial statements. The retroactive reporting of infrastructure is subject to an extended implementation period and is first effective for fiscal years ending in 2006.
5. Compensated Absences
Compensated absences are those absences for which employees will be paid, such as vacation, sick leave, and sabbatical leave. A liability for compensated absences that are attributable to services already rendered, and that are not contingent on a specific event that is outside the control of the District and its employees, is accrued as the employees earn the rights to the benefits. Compensated absences that relate to future services, or that are contingent on a specific event that is outside the control of the District and its employees, are accounted for in the period in which such services are rendered or in which such everts take place.
In governmental and similar trust funds, compensated absences that are expected to be liquidated with expendable available fmancial resources are reported as an expenditure and fund liability in the fund that will pay for the compensated absences. The noncurrent portion (the amount estimated to be used in subsequent fiscal years) for governmental funds is maintained separately and represents a reconciling item between the fund and government- wide presentations. (See Note X)
6. Unearned Revenue
Unearned revenue in the special revenue fund represents cash which has been received but not yet earned.
47

BOARD OF EDUCATION BOROUGH OF FAIR LAWN
NOTES TO BASIC FINANCIAL STATEMENTS YEAR ENDED JUNE 30. 2015
Note I: Summary of Significant Accounting Policies (Continued)
G. Assets. Liabilities and Fund Equity (Continued)
7. Long - term Obligations
Long - term debt is recognized as a liability of a governmental fund when due, or when resources have been accumulated in the debt service fund for payment early in the following year. For other long - term obligations, only that portion expected to be fmanced from expendable available financial resources is reported as a fund liability of a governmental fund. The noncurrent portion (the amount estimated to be used in subsequent fiscal years) for governmental funds is maintained separately and represents a reconciling item between the fund and government- wide presentations.
8. Fund Equity
Reserves represent those portions of fund equity not appropriable for expenditure or legally segregated for a specific future use. Designated fund balances repre~nt plans for future use of fmancial resources.
9. Net Position
Net Position represents the difference between assets and liabilities in the Distric~wide financial statements. Net investment in capital assets consists of capital assets, net of accumulated depreciation, reduced by the outstanding balance of any long-term debt used to build or acquire the capital assets. Net position is reported as restricted in the District-wide fmancial statements when there are limitations imposed on their use through external restrictions imposed by creditors, grantors, or laws or regulations of other governments.
10. Use of Estimates
The preparation of fmancial statements in conformity with generally accepted accounting principles requires management to make estimates and assumptions that affect certain reports, amounts and disclosures. Accordingly, actual results could differ from those estimates.
11 Allocation of Costs
In the government-wide statement of activities, the District has allocated unallocated benefits to various programs based on the original budgetary expenditures by program.
48

BOARD OF EDUCATION BOROUGH OF FAIR LAWN
NOTES TO BASIC FINANCIAL STATEMENTS YEAR ENDED JUNE 30, 2015
Note I: Summary of Significant Accounting Policies (Continued)
H. Recent Accounting Pronouncements Not Yet Effective
In June 2012, the Governmental Accounting Sandards Board (GASB) issued Statement No. 68 "Accounting and Financial Reporting for Pensions - an amendment of GASB Statement No. 27". This statement, which is
effective for fiscal periods beginning after June 15,2014, will have an effect on the entity's fmancial reporting. The provisions of this statement will require significant modifications to the disclosure requirements related to the entity's proportionate share of the cost-sharing defmed benefit plans reported at the State of New Jersey level.
In November 2013, the Governmental Accounting Standards Board (GASB) issued Statement No. 71 "Pension Transition for Contributions Made Subsequent to the Measurement Date-an amendment to GASB Statement No. 68". The provisions of this statement are required to be applied simultaneously with the provisions of Statement 68 which is effective for periods beginning after June 15, 2014. The provisions of this statement will require significant modifications to the disclosure requirements related to the entity's proportionate share of the cost-sharing defined benefit plans reported at the State of New Jersey level.
49

HUKuuyn ur rAm LAWN
~QTES TO BASIC EI~A~CIAL STAIE~NTS YEMENPED NNE 30 2015
t!gl~ II' R~cgo!<iliuligO g[Qg:i~mm~OI Wid~ IIDd Ellod FiollD!<il!l SIIII~m~o~
Explanation of Differences between Governmental Funds Balance Sheet and the Statement of Net Position
"Total fund balances" of the Districfs governmental funds in B-1 differs from "net position" of governmental activities reported in the statement of net position in A- I. This difference primarily results from the long - term economic focus of the statement of net position versus the current financial resources focus of the governmental fund balance sheets.
BulllDke Sb~~IlSIIl!~mCDI g[ ~~I fg~iligD Statement
Total Long - term of Net Governmental Assets Reclassifications Position
Ama flInIb Liabilities ()) aod Eliminaligos Il1lIIli
Cash and cash equivalents $ 15,856,166.90 $ S (11,242,461.07) S 4,613,705.83 Receivables, net 5,767,571.67 5,767,571.67 Interfund Receivables 15,179.09 (9,922.96) 5,256.13 Receivables from Other Governments 5,765,190.27 (5,765,190.27) Tuition Receivable 2,381.40 (2,381.40) Prepaid Expenses 3,495.00 3,495.00 Restricted assets:
Cash and cash equivalents 11,242,461.07 11,242,461.07 Capital Reserve Account - cash 4,397,715.18 4,397,715.18
Capital Assets, net 31,147,067.60 31,147,067.60 Total Assets 26,040,127.84 31,147,067.60 (9,922.96) 57,177,272.48
Qcrm~d Ql!lflg»:~ g[R~SllIl[m Deferred outflows related to pensions 2,673,592.00 2,673,592.00
Total Deferred Outflows of Resources 2,673,592.00 2,673,592.00
Total Assets and Deferred Outflows of Resources $ 26,040,127.84 S 33,820,659.60 S ~9,922.96) $ 59,850,864.48
LiIII!i.li1i§
Accounts Payable $ 318,258.06 $ $ $ 318,258.06 Interfunds Payable 114,665.62 (9,922.96) 104,742.66 Payable to State Government 35,207.42 35,207.42 Bond Interest Payable 330,092.05 330,092.05 Unearned Revenue 462,418.51 462,418.51 Noncurrent Liabilities 55,921 ,291.00 985,542.50 56,906,833.50
Total Liabilities 930,549.61 55,921,291.00 1,305,711.59 58,157,552.20
Qef~m!lloflg»:~ g[ !l.~~gl
yyl\yuy" yr fOU\ LO Yf l"!
NOTES TO BASIC FINANCIAL STATEMENTS YEAR ENDED NNE 30 2015
Note II; Reconciliation ofGoyernment Wide and Fund Financial Statements (Continued)
Explanation of Differences between Governmental Funds Balance Sheet and the Statement of Net Position (Continued)
I. When Capi!al Assets (land, buildings, equipment) that are to be used in governmental activities are purchased or constructed, the cost of those assets are reported as expenditures in governmental funds. However, the statement of net position includes those capital assets among the assets of the District as a whole.
Cost of capital assets Accumulated depreciation
Long - term liabilities applicable to the Districrs governmental activities are not due and payable in the current period and accordingly are not reported as fund liabilities. All liabilities - both current and long - term are reported in the statement of net position.
Adjustment to Debt Service Fund net position for the accrual of interest expense.
Net PERS Pension Liability Deferred outflows related to pensions Deferred inflows related to pensions
Serial Bonds Compensated Absences
51
$
$
$
$
$
57,773,687.73 (26,626,620.13)
31,147,067.60
29,054,29\.00 (2,673,592.00) 1,731,478.00
26,867,000.00 985,542.50
$ 27,852,542.50
$ (330,092.05)

Note II· Reconciliptjon ofGgyernntenl Wide And fund Fiogoslpl Stgtement. (Cgntinyed)
E:~phmalion of DiITcrenCCl between Governmental Funds OpcrAlins Slllemenl of AclivlliCJ
NOTES TO BASIC FINANCIAL SIATEMENTS YEAR ENDED JUNE 30 2W
The "net chanlc in fund baJancca" for IDvcnuncntal funds in Ba 2 difi'en from the "chanse in nct poIitioo" for governmental activities reponed in ilia ItAtement of activities in A·2. The difTcn::ncc IlriIC primarily for the lon& • Icon economic focus ofthcltatemcnl of IctiviliCl venus the cunent finlllCiall"ClOW'a:l focus of tho JOvcmmenlal funds The effect of tho dilTcnmccJ il ilIwlrated below.
Slg"ment gC&CyeolHlll Exgc;nditum god ChIDle! jn Fund eglgncclSlglemenl gCActjVlljea
Revenue! god Other Spwg;a
Local IL' I.cvy Tuition CharBCI Transportation Feci Inlcrest Earned on In\'C!ltmcnlJ MilcelJaftCOUi S'aID Sources Federal 50UfCCI
TOIII
Curren!: Regular instruction Special education Other instruction
Suppan Services and undistributed cosll: Tuition Student Dnd inJtruction related IcrviCCJ 5ehoolDdminiltllliyo lentices GencralDnd business Ddminillrllivc services Plant opcratiolll iUKI maintenance Pupiltranaponluon Unallocated Benalitl
Special School. IrlllUrcr 10 Chor1er .chool Capital Outlay Debt Service:
Principal Interest
Total
Olhcr Financina UscslChllnacs in Not AJlell: N.J. Schaal Dcvclopncnl Aulhority Omnll Bondi Proceeds
IOIIII
Iolal Govcmmenlll
fImda
71,882,172.00 392,162.32 4l,I64.00 l4,179.l9
1,936,464.30 11,661,227.03
1,694,l42.ll
94,674,311.12
26,OlO,lI2, 12 9,11l,3l0.71 3,374,071.27
l,261,421.11 9,911,216.39 3,74l,92114 3,31.,621.04 7,23.,712.11 2,l74,l90.l7
17,140,26746 2,124,llO.43
73,101,00 2,026,132.73
17l,000,00 641,ll6.26
94,241,179,11
3,260,394.00 10,677,000.00
13,937,394.00
Lana-term Reyenue,
W;nm.ill
16,7709l
16,770,9l
Capilli Rol.lcd IwnLill
747,ml4 112,127Bl lI,42l.46
43,097.40 19,74941 62,301.41 76,7l714 19,.12,29
9,1.'49
(I,949,l76,73)
(676J36.60)
Net Chanae for tho Year 14,370,l2l.94 (16,770,9l) ::0-_....::.67"'6"',33"'6"'.6""0
2. In the ltatement of DctiyitiCl, inlerat on lana ·!crm debt in the IlDtcmcnt of activitiCi is accrued, reaardlCiI of when due. In the aovcnunenlll funds, interest il reported when due. The at:enled interest is an addition in tho rewncilialioRi. (+)
3. Capital outlaYI QI'C reported in JOycnunental funds .. e:<penditurc!. However, in the ltatement or activities, tho cosl orLholo AS5etl il allocated over their csLimltcd uscfulliyCl DI depreciation c.'pcnlO. This is the amount which capilli outlays c:u:ccdcd depreciauon in the period.
Depreciation c.'PCD!lO
Lana - term Dobl
TrannCljODJ (4)
644,764.00 20l,360.26 1II,4l767
223,12420 120,190.01 BI,6l4.12 99,316.17 16,1I7.3l
37,611 .14
(17l,000.00)
610,066.02
RcclDlsificDlions pod ElimjnptjQDI Ul
7,369,l31.03 2,311,17l.36
921,7l1.66
2,l79,ll9.01 1,143,9l4,9l
637,417.lI 106,114,31 369,103.19
(17,140,267.46) 420,192.60
Statement of
ActIVities
71,1I2,ln 00 392,162.32 4l,I64.oo l4,179.l9
1,936,464 30 11,661,227 03 1,694,l42.l1
94.674.3IU2
34,112,630.69 II,76l,414.18 4,46l,706.06
l,261,42UI 12,127,767.07 l,069,122.l1 4,103,071,ll 1,217,671.27 3,OlO,624.10
2,l92,269.66 73,101.00 77,2l6.00
73l,627.21
(1,279,297.00) __ 9",3""0",'2",J",13,,,.2:.'
3,260,394.00 (10,677000.00) _____ -'-
(10,677,000.00) __ ~3,~26O~J~94~.00~
(610,066.02) =-_--1(.<;9,"'39 .. 7"'.7"'03"'.=00) !..._....:!J4,~BI~2.!,3.=22!.:;.l~7
(16,770.9l)
Capital outlays (c.,clusivCl ofcapilallelsc pnncipil payment! and SOA Debllcrvica AslCl5ment) (1,273,24013) 1,949,l76,73
3 AdjuslmCntto Capital AsSCIl in accordance with ph)'li~1 apprailll
3. In the statement of activities, only the lain on the disposal of capital assoll is reported, whereAS in Lhc goyernmental funds, the proceeds from a laic increase financial resources. Thw, the chanlo in netRlsel! will differ Cram Lhc change in fund balance by the cost of tho alSct removed. (-)
4 In the statement of activities, certain operating D."(pcn5CS, e.l. compensated absCDCCI (va~lions) are mCDIW'Cd by the amounts earned durinS tlle year. In the goycmmental funds, however, e,'~penditurel for these itCml arc reported in tho amount of financial resources used (PAid). When the earned amount c:<ecedJ the paid amount, the dilTerence is reduction in the rceoneiliauon (~) : when the paid amount exceeds Lhc camcd amount the diITen:nCCl i. an addition to the reconciliation (+).
Governmental funds report dislrict pension contributions al cxpcnditurcl. In the statement of actwi1e.s, however, the coli of pension benefits eamcd nct of employee conlnbutions is reported III pension expense.
Cost of benefill euned net of employee contributions
Payment oflons-tcnn liability principal is an expenditure in thc lovcmment funds, but the payment reduces Ions - tenn liabilities in the statement of
ncllllsell and is not reported in the statement of aetivitics.
Debt principII Capital leue principal
4. Proceeds from debt issUCIlre a Onancinl lOurce in the govcnuncnlal funds. nley arc not revenue in the statement of activities, ISluing debt increases long - tenn li.bilitiel in the statement of net Dssoll.
t Allocate Benefill e:~pcnditurcs and eliminate PERS conlribution
Proceeds oflong • lorm debl CapilalleDse proceeds
(1,279,29700)
52
676,336.60
(ll,IIloo)
(1,469,9l1 02)
17l,000.00
(610,066.02)
(10,677,00000)
(l0,677,ooO.UO)

BOARD OF EDUCATION BOROUGH OF FAIR LAWN
NOTES TO BASIC FINANCIAL STATEMENTS YEAR ENDED JUNE 30, 2015
Note III: Detailed Disclosure Regarding Assets and Revenues
A. Deposits and Investments
Deposits
New Jersey statutes permit the deposit of public funds in institutions located in New Jersey which are insured by the Federal Deposit Insurance Corporation (FDIC), the Savings Association Insurance Fund, or by any other agencies of the United States that insure derosits or the State of New Jersey Cash Management Fund.
N.J.S.A. 17:9-41 et. Seq. establishes the requirements for the security of deposits of governmental units. The statute requires that no governmental unit shall deposit public funds in a public depository unless such funds are secured in accordance with the Governmental Unit Deposit Protection Act. Public depositories include Savings and Loan institutions, banks (both state and national banks) and savings banks the deposits of which are federally insured. All public depositories must pledge collateral, having a market value at least equal to five percent of the average daily balance of collected public funds, to secure the deposits of Governmental Units. If a public depository fails, the collateral it has pledged, plus the collateral of all other public depositories, is available to pay the full amount of their deposits to the Governmental Units.
At June 30, 2015 the Borough of Fair Lawn School District's cash and cash equivalent'S amounted to $25,846,424.51. Of this amount, $250,000.00 was covered by federal depository insurance (F.D.I.C.) and $25,594,942.88 was covered by a collateral pool maintained by the banks as required by GUDPA
At June 30, 2015 the Borough of Fair Lawn School District's participation in the State of New Jersey Cash Management Fund amounted to $1,481.63.
GASB Statement No. 40, Deposit and Investment R'isk Disclosures, requires the disclosure of bank deposits that are subject to custodial credit risk. The custodial credit risk for deposits is the risk that, in the event of the failure' of a depository financial institution, the Borough of Fair Lawn School District will not be able to recover deposits or will not be able to recover collateral securities that may be in the possession of an outside party.
As of June 30, 2015, $1,481.63 of the Borough of Fair Lawn School District's cash and cash equivalents of $25,846,424.51 was exposed to custodial credit risk as follows:
Uninsured and collateral held by public depository or by its' trust department not in the Borough of Fair Lawn
School District's name
53
$1,481.63
$1.481.63

BOARD OF EDUCATION BOROUGH OF FAIR LAWN
NOTES TO BASIC FINANCIAL STATEMENTS YEAR ENDED JUNE 30, 2015
Note III: Detailed Disclosure Regarding Assets and Revenues (Continued)
A. Deposits and Investments (Continued)
Investments
New Jersey statutes (NJ.S.A. IBA:20-37) permit the Borough of Fair Lawn School District to purchase the following types of securities:
a. When authorized by resolution adopted by a majority vote of all its members the board of education of any school district may use moneys which may be in hand for the purchase of the following types of securities which, if suitable for registry, may be registered in the name of the school district;
(I) Bonds or other obligations of the United States of America or obligations guaranteed by the United States of America;
(2) Government money market mutual funds; (3) Any obligation that a federal agency or a federal instrumentality has issued in accordance with an
act of Congress, which security has a maturity date not greater than 397 days from the date of purchase, provided that such obligation bears a fixed rate of interest not dependent on any index or other external factor;
(4) Bonds or other obligations of the school district or bonds or other obligations oflocal unit or units within which the school district is located;
(5) Bonds or other obligations, having a maturity date not more than 397 days from the date of purchase, approved by the Division ofInvestment of the Department of the Treasury for investment by school district;
(6) Local government investment pools: (7) Deposits with the State of New Jersey Cash Management Fund established pursuant to section 1 of
P.L. 1977, c.2BI (C.52:1 BA-90.4) or (B) Agreements for the repurchase of fully collateralized securities, if:
(a) the underlying securities are permitted investments pursuant to paragraphs (I) and (3) of this subsection a;
. (b) the custody of collateral is transferred to a third party; (c) the maturity of the agreement is not more than 30 days; (d) the underlying securities are purchased through a public depository as defmed in section I of
P.L. 1970, c.236 (C.l7:9-41) and for which a master repurchase agreement providing for the custody and security of collateral is executed.
The Borough of Fair Lawn School District had no investments as described in NoteI:G .1 at June 30,2015.
B. Interfund Receivables and Payables
As of June 30, 2015, interfund receivables and payables resulting from various interfund transactions were as follows:
General Fund Capital Projects Fund Debt Service Fund Enterprise Fund Trust and Agency Fund
54
Due from
Other Funds
$ 5,256.13
9,922.96 104,742.66
$119.921.75
Due to
Other Funds
$104,742.66 9,922.96
5,256.13 $119.921.75
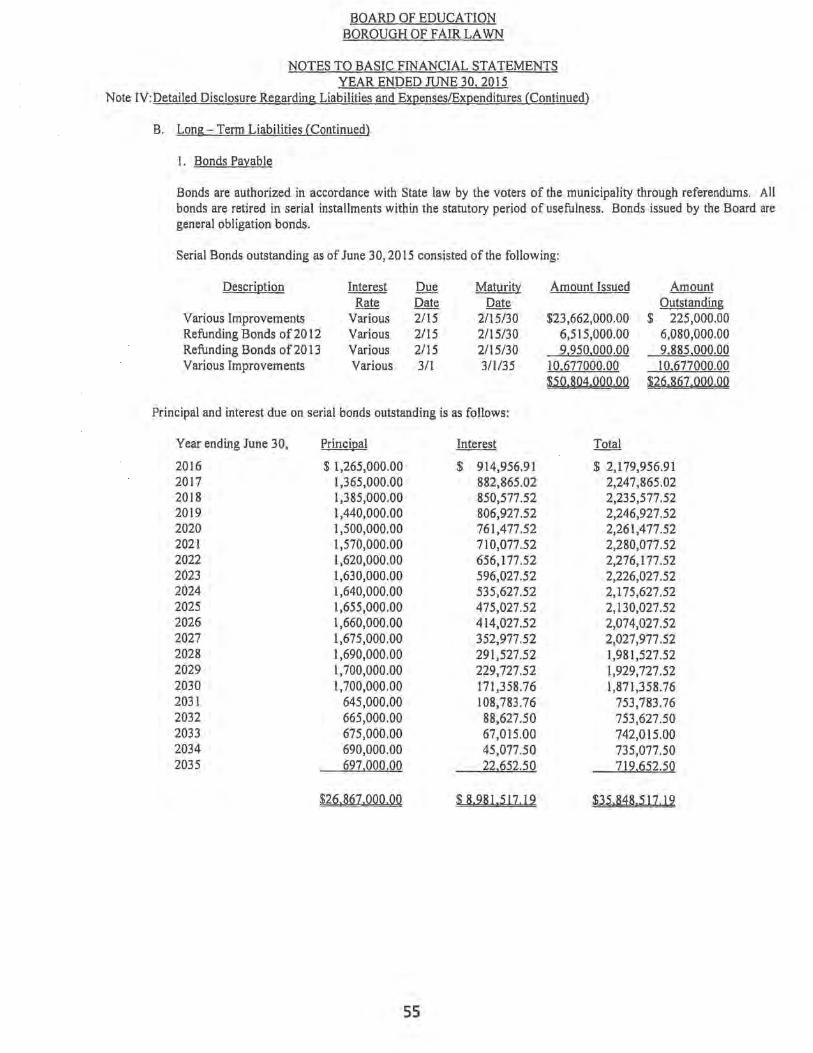
BOARD OF EDUCATION BOROUGH OF FAIR LAWN
NOTES TO BASIC FINANCIAL STATEMENTS YEAR ENDED JUNE 30, 2015
Note IV: Detailed Disclosure Regarding Liabilities and ExpenseslExpenditures (Continued)
B. Long - Term Liabilities (Continued)
I. Bonds Payable
Bonds are authorized in accordance with State law by the voters of the municipality through referendums. All bonds are retired in serial installments within the statutory period of usefulness. Bonds issued by the Board are general obligation bonds.
Serial Bonds outstanding as of June 30,2015 consisted of the following:
Description Interest Due Maturity Amount Issued Amount Rate Date Date Outstanding
Various Improvements Various 2/15 2115/30 $23,662,000.00 $ 225,000.00 Refunding Bonds of 2012 Various 2/15 2115/30 6,515,000.00 6,080,000.00 Refunding Bonds of 20 13 Various 2/15 2/15/30 9,950,000.00 9,885,000.00 Various Improvements Various 311 3/1/35 10,677000.00 10,677000.00
$50,804.000.00 $26.867.000.00
Principal and interest due on serial bonds outstanding is as follows:
Year ending June 30, Principal Interest Total
2016 $ 1,265,000.00 $ 914,956.91 $ 2,179,956.91 2017 1,365,000.00 882,865.02 2,247,865.02 2018 1,385,000.00 850,577.52 2,235,577.52 2019 1,440,000.00 806,927.52 2,246,927.52 2020 1,500,000.00 761,477.52 2,261,477.52 2021 1,570,000.00 710,077.52 2,280,077.52 2022 1,620,000.00 656,177.52 2,276,177.52 2023 1,630,000.00 596,027.52 2,226,027.52 2024 1,640,000.00 535,627.52 2,175,627.52 2025 1,655,000.00 475,027.52 2,130,027.52 2026 1,660,000.00 414,027.52 2,074,027.52 2027 1,675,000.00 352,977.52 2,027,977.52 2028 1,690,000.00 291,527.52 1,981,527.52 2029 1,700,000.00 229,727.52 1,929,727.52 2030 1,700,000.00 171,358.76 1,871,358.76 2031 645,000.00 108,783.76 753,783.76 2032 665,000.00 88,627.50 753,627.50 2033 675,000.00 67,015.00 742,015 .00 2034 690,000.00 45,077.50 735,077.50 2035 697,000.00 22,652.50 719,652.50
$26,B6Z,QQQ.QQ $ B,281,511.12 $35,848,511.12
55

BOARD OF EDUCATION BOROUGH OF FAIR LA WN
NOTES TO BASIC FINANCIAL STATEMENTS YEAR ENDED JUNE 30,2015
Note IV: Detailed Disclosure Regarding Liabilities and Expenses/Expenditures (Continued)
B. Long - Tenn Liabilities (Continued)
2. Temporary Notes
There were no Temporary Notes outstanding as of June 30, 2015.
3. Bonds Authorized But Not Issued
There were no authorized but not issued bonds as of June 30, 2015.
4. Capital Leases Payable
There were no capital leases payable as of June 30, 2015.
56

BOARD OF EPUCATION BOROUGH OF FAIR LAWN
NOTES TO BASIC FINANCIAL STATEMENTS YEAR ENDED JUNE 30. 2015
Note ill: Detailed Pisclosure Regarding Assets and Revenues (Continued) •
C. Caoital Assets
Capital asset activity for the year ended June 30, 2015 was as follows:
Governmental activities: Capital assets not being depreciated:
Land Construction in Progress
Total Capital assets not being depreciated
Land Improvements Buildings and Improvements Machinery and Equipment
Totals at historical cost
Less accumulated depreciation for: Land Improvements Buildings and Improvements Machinery and Equipment
Total accumulated depreciation Net capital assets being depreciated
Governmental activities capital assets, net
Business - type activities: Equipment Less accumulated depreciation
Business - type activities capital assets, net
$
$
$
$
Beginning Balance
614,091.00
614,091.00
2, I 80,460.00 45,667,280.00 7,362,280.00
55,210,020.00
(1,755,223.00) (17,351,227.00) (6J46,930.00)
(25,353,380.00) 29,856,640.00
30,470,731.00
267,621.53 (214,386.53)
53,235.00
(I) Depreciation expense was charged to governmental functions as follows: Instruction Special Education Other Instruction Student and Instruction Related Services School Administrative Services General and Business Administrative Services Plant Operations and Maintenance Pupil Transportation Special Schools
57
$ 1,045,531.89
1 ,045,531.89
496,898.02 407,146.82 904,044.84
(44,257.00) (940,291.71) (288,691.42)
(1,273J40.l3) (I) (369,195.29)
$ 676,336.60
$ (7,352.78)
$ (7,352.78)
$ 747,823.54 132,827.85 51,425.46 43,097.40 59,749.48 62,301.48 76,757.14 89,412.29 9,845.49
$ 1,2731240.13
Adjustment
$ $
$ $
$ $
$ $
Ending ~
1,659,622.89
1,659,622.89
2,180,460.00 46,164,178.02 7,769,426.82
56,114,064.84
(1,799,480.00) (18,291,518.71) (6,535,621.42)
(26,626,620.13) 29,487,444.71
31,147,067.60
267,621.53 (221,739.31)
451882.22

BOARD OF EDUCATION BOROUGH OF FAIR LAWN
NOTES TO BASIC FINANCIAL STATEMENTS YEAR ENDED JUNE 30 2015
Note IV: Detailed Disclosures Regarding Liabilities and ExpenseslExpenditures
A. Operating Leases
The District has commitments to lease copying equipment under operating leases which expire in 2019. Total operating lease payments made during the year ended June 30, 2015 were $94,587.95. Future minimum lease payments are as follows:
June 30,2016 June 30,2017 June 30,2018 June 30,2019 June 30, 2020
Year Ended
Total future minimum lease payments
B. Long - Term Liabilities
Long - Term liability activity for the year ended June 30, 2015 was as follows:
Beginning Balance Additions
Governmental activities: Long - Term debt:
Serial Bonds $ 17,065,000.00 $ 10,677,000.00
Total debt payable 17,065,000.00 10,677,000.00
Other liabilities: Compensated absences 900,427.50 189,367.50
Total other liabilities 900,427.50 189,367.50
Governmental activities long - term liabilities 17,965,427.50 10,866,367.50
(I) Paid by debt service fund (2) Paid by general fund
58
$
s
$
75,200.07 57,555.08 42,110.08 9,317.99 1,413.45
185,596.67
Reductions
{875,000.00) {875,000.00) (I)
{104,252.50) {104,252.50) (2)
(979,252.50)
$
Amounts Ending Due Within Balance One Year
26,867,000.00 $ 1,265,000.00
26,867,000.00 1,265,000.00
985,542.50 163,557.50 985,542.50 163,557.50
27,852,542.50 1,428,557.50

BOARD OF EDUCATION BOROUGH OF FAIR LA WN
NOTES TO BASIC FINANCIAL STATEMENTS YEAR ENDED JUNE 30. 2015
Note V: Detailed Disclosure Regarding Fund Equity
A. Capital Reserve Account
Capital reserve accounts may be established by New Jersey school districts for the accumulation of funds for use as capital outlay expenditures in subsequent fiscal years. A capital reserve account is maintained in the general fund and its activity is included in the general fund annual budget.
During fiscal year 1991-1992 the Board passed a resolution for the establishment of a capital reserve account. The 1992-1993 certified budget included an increase in the capital reserve account of $3,500,000.00 comprised of a voter approved transfer from unreserved fund balance.
Funds placed in the capital reserve account are restricted to capital projects in the district's approved Long Range Facilities Plan (LRFP). Upon submission of the LRFP to the department, a district may increase the balance in the capital reserve by appropriating funds in the annual general fund budget certified for taxes or by transfer by board resolution at year end of any unanticipated revenueor unexpended line-item appropriation amount, or both. A district may also appropriate additional amounts when the express approval of the voters has been obtained either by a separate proposal at budget time or by a special question at one of the four special elections authorized pursuant to N.J.S.A. 19:60-2. Pursuant to N.J.A.C. 6A:23A-14.l(g), the balance in the account cannot at any time exceed the local support costs of uncompleted capital projects in i5 approved LRFP.
59

BOARD OF EDUCATION BOROUGH OF FAIR LA WN
NOTES TO BASIC FINANCIAL STATEMENTS YEAR ENDED JUNE 30, 2015
Note V: Detailed Disclosure Regarding Fund Equity (Continued)
A. Capital Reserve Account (Continued)
A summary of the account's transactions is as follows
1992-1993 Budget (described above)
For the period 7/1/92 - 6/30/09: Investment Income Budget (Unreserved Fund Balance) Resolution (Unreserved Fund Balance Transfer from Fund 30 Budgetary Expenditures
2009-2010 Investment Income 2009-2010 Transfer from Fund 30 2009-2010 Budget Expenditures 2010-2011 Investment Income 2010-2011 Transfer from Fund 30 2010-2011 Resolution (Unreserved Fund Balance) 2010-2011 Budget Expenditures 2011-2012 Investment Income 2011-2012 Budget (Unreserved Fund Balance) 2011-2012 Resolution (Unreserved Fund Balance) 2011-2012 Budget Expenditures 2012-2013 Investment Income 2012-2013 Resolution (Unreserved Fund Balance) 2012-2013 Budget Expenditures 2012-2013 Transfer to Fund 30 2013-2014 Resolution (Unreserved Fund Balance) 2013-2014 Investment Income 2013-2014 Budget Expenditures 2014-2015 Resolution (Unreserved Fund Balance) 2014-2015 Investment Income 2014-2015 Transfer to Fund 30 2014-2015 Transfer to Fund 40 2014-2015 Budget Expenditures
Balance June 30, 2015
$3,500,000.00
282,104.25 585,000.00 985,000.00
8,608.00 (4,739,431.60)
3,836.35 21,460.52
(529,100.00) 685.69
6,399.39 619,300.95 (66,305.30)
2,131.43 223,000.00 324,338.57
(7,862.98) 2,479.59
1,488,926.84 (200,000.00)
(1,812.26) 3,265,282.29
1,629.70 (1,250,000.00) 2,471,625.04
1,488.71 (1,601,070.00)
(500,000.00) (500,000.00)
$4,397.715.18
The June 30, 2015 LRFP balance of local support costs of uncompleted capital projects at June 30, 2015 is $14,956,800.00.
60

Note VI: Pension Plans
Description of Systems
BOARD OF EDUCATION BOROUGH OF FAIR LAWN
NOTES TO BASIC FINANCIAL STATEMENTS YEAR ENDED JUNE 30. 2015
Substantially all of the Board's employees participate in one of the following contributory defined benefit public employee retirement systems which have been established by State statute: the Teachers' Pension and Annuity Fund (TPAF) or the Public Employees' Retirement System (PERS). These systems are sponsored and administered by the New Jersey Division of Pensions and Benefits. The Teachers' Pension and Annuity Fund retirement system is considered a cost sharing plan with special funding situations as under current statute, all employer contributions are made by the State of New Jersey on behalf of the Board and the system's other related non-contributing employers. The PERS is considered a cost sharing multiple-employer defmed benefit plan.
The Public Employees' Retirement System (PERS) was established in January 1955, under the provisions ofN.J.S.A. 43: 15A to provide coverage including post-retirement health care to substantially all full time employees of the State or any county, municipality, school district or public agency provided the employee is not a member of another Stateadministered retirement system. Membership is mandatory for such employees and vesting occurs after 8 to 10 years of service for pension benefits and 25 years for post- retirement health care coverage.
Th~ Teachers' Pension and Annuity Fund (TPAF) was established in January 1955, under the provisions ofN.J.S.A. 18:66 to provide coverage including post-retirement health care to substantially all full time public school employees in the State. Membership is mandatory for such employees and vesting occurs after 10 years of service for pension benefits and 25 years for post - retirement health care coverage.
The Defined Contribution Retirement Program (DCRP) was established as of July I, 2008 under the provisions of Chapter 92, P.L. 2008 and Chapter 103, P.L. 2008 (NJSA 43:15C-l et seq .. ). The DCRP is a cost sharing multipleemployer defined contribution pension fund. The DCRP provides eligible members, and their beneficiaries with a tax-sheltered, defined contribution retirement benefit, along with life insurance and disability coverage. Vesting and benefit provisions are established by NJSA 43:15C-l et seq ..
According to the state law, all obligations of each retirement system will be assumed by the State of New Jersey should any retirement systems terminate. The State of New Jersey, Department of the Treasury, Division of Pensions and Benefits issues a publicly available financial report that includes the financial statements and required supplementary information of each of the above systems. The fmancial reports may be accessed via the New Jersey Division of Pensions and Benefits website atwww.state.nj.us/treasury/pensions
Retirement Benefits
For PERS and TPAF employees, the benefits will be 1/55 of the average of the three highest years compensation for each year of service. However, for PERS and TPAF who are veterans of the U.S. armed forces, the benefits will be 1/55 of final compensation for each year of service.
61
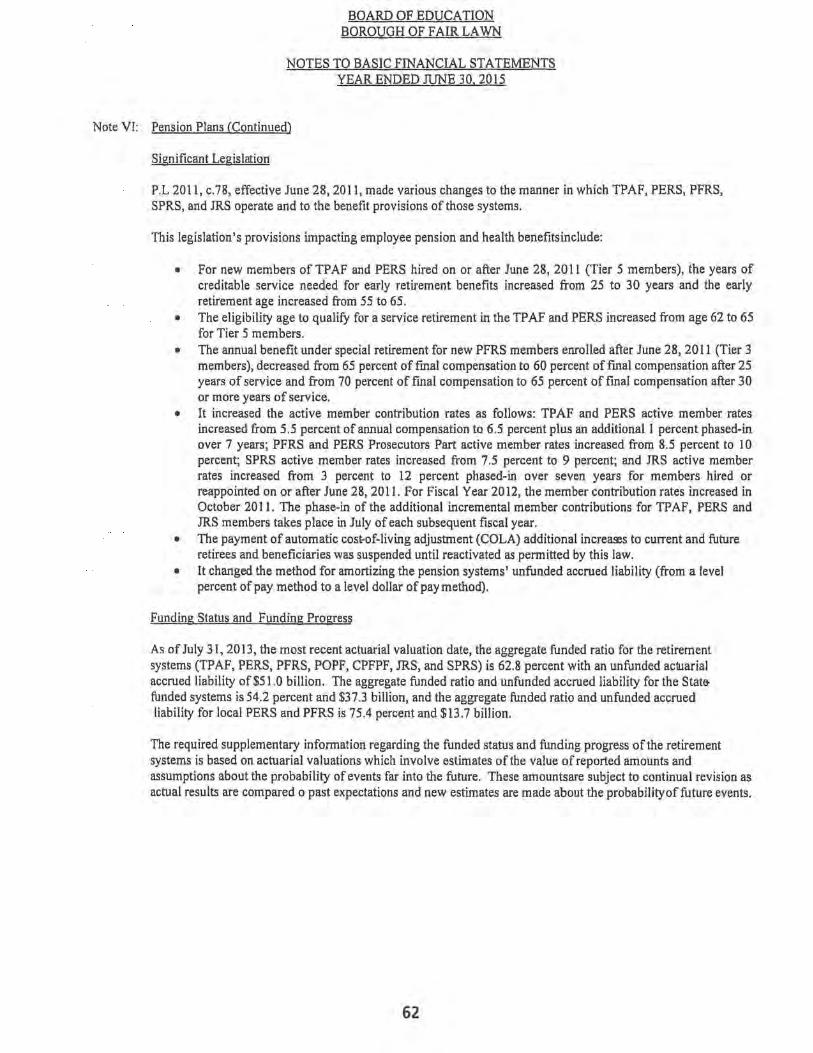
BOARD OF EDUCATION BOROUGH OF FAIR LAWN
NOTES TO BASIC FINANCIAL STATEMENTS YEAR ENDED JUNE 30, 2015
Note VI: Pension Plans (Continued)
Significant Legislation
P.L 2011, c.78, effective June 28, 2011, made various changes to the manner in which TPAF, PERS, PFRS, SPRS, and JRS operate and to the benefit provisions ofthose systems.
This legislation's provisions impacting employee pension and health benefits include:
• For new members of TPAF and PERS hired on or after June 28, 2011 (Tier 5 members), the years of creditable service needed for early retirement benefits increased from 25 to 30 years and the early retirement age increased from 55 to 65.
• The eligibility age to qualify for a service retirement in the TPAF and PERS increased from age 62 to 65 for Tier 5 members.
• The annual benefit under special retirement for new PFRS members enrolled after June 28, 2011 (Tier 3 members), decreased from 65 percent of fmal compensation to 60 percent of fmal compensation after 25 years of service and from 70 percent of fmal compensation to 65 percent of fmal compensation after 30 or more years of service.
• It increased the active member contribution rates as follows: TPAF and PERS active member rates increased from 5.5 percent of annual compensation to 6.5 percent plus an additional 1 percent phased-in over 7 years; PFRS and PERS Prosecutors Part active member rates increased from 8.5 percent to 10 percent; SPRS active member rates increased from 7.5 percent to 9 percent; and JRS active member rates increased from 3 percent to 12 percent phased-in over seven years for members hired or reappointed on or after June 28, 2011. For Fiscal Year 2012, the member contribution rates increased in October 20 II. The phase-in of the additional incremental member contributions for TP AF, PERS and JRS members takes place in July of each subsequent fiscal year.
• The payment of automatic cost-of-living adjustment (COLA) additional increares to current and future retirees and beneficiaries was suspended until reactivated as permitted by this law.
• It changed the method for amortizing the pension systems' unfunded accrued liability (from a level percent of pay method to a level dollar of pay method).
Funding Status and Funding Progress
As of July 31, 2013, the most recent actuarial valuation date, the aggregate funded ratio for the retirement systems (TPAF, PERS, PFRS, POPF, CPFPF, JRS, and SPRS) is 62.8 percent with an unfunded aclllarial accrued liability of $51.0 billion. The aggregate funded ratio and unfunded accrued liability for the Statefunded systems is 54.2 percent and $37.3 billion, and the aggregate funded ratio and unfunded accrued liability for local PERS and PFRS is 75.4 percent and $13.7 billion.
The required supplementary information regarding the funded status and funding progress of the retirement systems is based on actuarial valuations which involve estimates of the value of reported amounts and assumptions about the probability of events far into the future. These amounts are subject to continual revision as actual results are compared 0 past expectations and new estimates are made about the probability of future events.
62

BOARD OF EDUCATION BOROUGH OF FAIR LAWN
NOTES TO BASIC FfNANCIAL STATEMENTS YEAR ENDED JUNE 30, 2015
Note VI: Pension Plans (Continued)
Contribution Requirements
The contribution policy is set by laws of the State of New Jersey and contributions are required by active members and participating employers. Plan member and employer contributions may be amended by State of New Jersey legislation, with the amount of contributions by the State of New Jersey contingent upon the annual Appropriations Act. The pension funds provide for employee contributions based on 6.9 percent for TPAF and 6.9 percent for PERS of employees' annual compensation.
During the state fiscal year ended June 30, 2014, for TPAF, which is a cost sharing plan with special funding situations, the annual pension cost differs from the annual required contribution. For PERS, which is a cost sharing multi-employer defmed benefit pension plan, annual pension cost equals contributions made.
The District's total payroll for the year ended June 30, 2015 was $54,607,243.74 and covered payroll was $38,887,483.00 for TPAF, $9,719,098.00 for PERS and $2,275,547.42 for DCRP. Contributions to the TPAF, PERS and the DCRP for the last three years made by the employees, Borough of Fair Lawn School District and the State were as follows:
Percent Percent of Percent of
of Covered Covered Covered
TPAF Payroll PERS Payroll DCRP Payroll
Employees 6/30/13 $2,446,585.22 6.68% $ 652,906.83 6.68 % $66,197.16 5.49 % 6/30/14 2,589,430.31 6.83 % 665,777.32 6.83 % 92,681.40 5.39 % 6/30/15 2,714,994.78 6.98 % 686,837.28 7.07% 124,454.30 5.47 %
District 6/30/13 N/A N/A% 1,227,514.70 12.56 % 36,107.88 3.00% 6/30/14 N/A N/A% 1,167,786.02 11.97 % 51,576.47 3.00 % 6/30/15 N/A N/A% 1,279,297.00 13.16 % 68,266.49 3.00%
State ofNJ 6/30/13 $4,865,474.00 13.18 % NIA N/A% N/A NIA% 6/30/14 4,130,864.00 10.89 % NIA N/A% N/A N/A% 6/30/15 5,225,671.00 13.44 % N/A N/A% N/A N/A%
In accordance with N.J.S.A. 18A:66-66 the State of New Jersey reimbursed the Board $2,792,049.45 during the year ended June 30, 2015 for the employer's share of social security contributions for TPAF members as calculated on their base salaries. This amount and the State of New Jersey's Contribution to the TPAF have been included in the basic financial statements and the budgetary comparison schedule - General Fund as a revenue and expenditure in accordance with GASB 24.
63

BOARD OF EDUCATION BOROUGH OF FAIR LAWN
NOTES TO BASIC FINANCIAL STATEMENTS YEAR ENDED JUNE 30. 2015
Note VII: Public Employees Retirement System
At June 30, 2015, the District reported a liability of $29,054,291.00 for its proportionate share of the net pension liability. The net pension liability was measured as of June 30, 2014, and the total pension liability used to calculate the net pension liability was determined by an actuarial valuation as of that date. The District's proportion of the net pension liability was based on a projection of the District's long-term share of contributions to the pension plan relative to the projected contributions of all participating employers, actuarially determined. At June 30, 2014, the District's proportion was 0.1551818755%, which was an increase of 1.96% from its proportion measured as of June 30,2013.
For the year ended June 30, 2015, the District recognized pension expense of $1 ,469,951.02. At June 30, 2015, the District reported deferred outflows of resources and deferred inflows of resources related to PERS from the following sources:
Difference between expended and actual experience
Changes of assumptions Net difference between projected and
actual earnings on pension plan investments
Changes in proportion District contributions subsequent to
the measurement data Total
Deferred Outflows of Resources
$
913,623
480,672
1.279,297 $2.673,592
Deferred Inflows of Resources
$
1,731,478
$1,731.478
$1,279,297 reported as deferred outflows of resources related to pensions resulting from the school district contributions subsequent to the measurement date (June 30, 2014) will be recognized as a reduction of the net pension liability in the year ended June 30, 2015. Other amounts reported as deferred outflows of resources and deferred inflows of resources related to pensions will be recognized in pension expense as follows:
Year ended June 30. 2016 2017 2018 2019 2020 Thereafter Total
$(264,924) (264,924) (264,924) (264,924) 167,945
73,896 $(883.855)
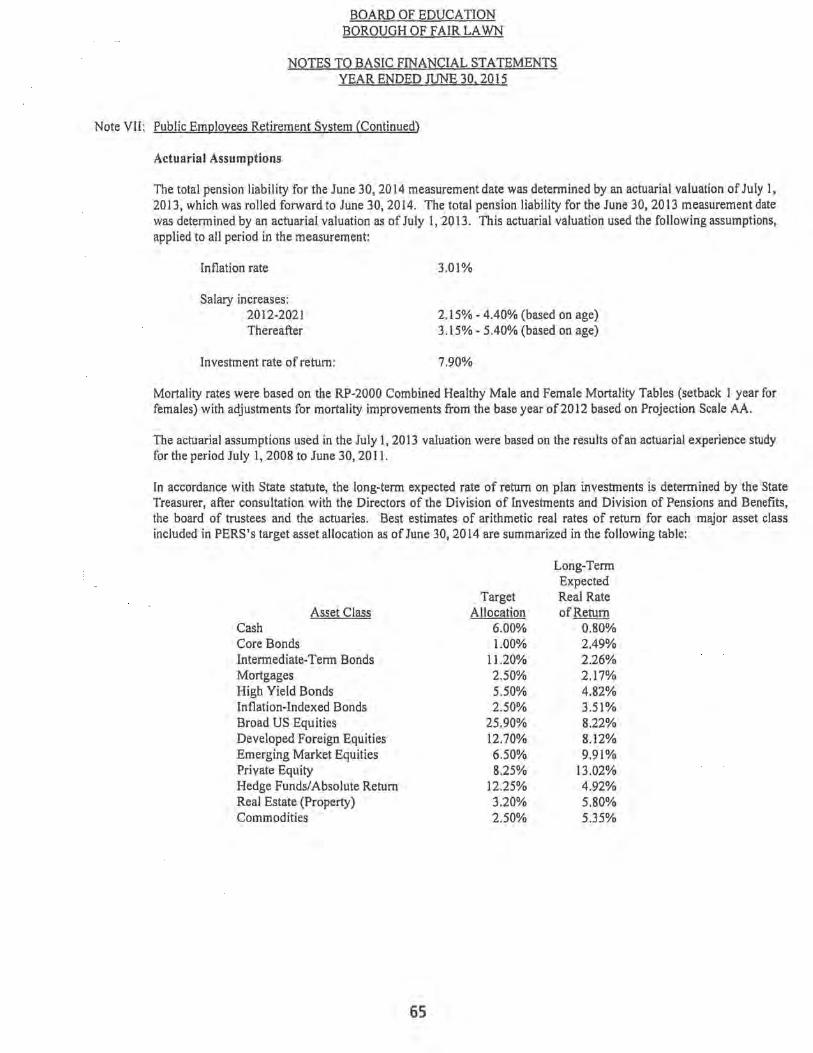
BOARD OF EDUCATION BOROUGH OF FAIR LA WN
NOTES TO BASIC FINANCIAL STATEMENTS YEAR ENDED JUNE 30, 2015
Note VII: Public Employees Retirement System (Continued)
Actuarial Assumptions
The total pension liability for the June 30, 2014 measurement date was determined by an actuarial valuation of July 1, 2013, which was rolled forward to June 30, 2014. The total pension liability for the June 30,2013 measurement date was determined by an actuarial valuation as of July I, 2013. This actuarial valuation used the following assumptions, applied to all period in the measurement:
Inflation rate
Salary increases: 2012-2021 Thereafter
Investment rate of return:
3.01%
2.15% - 4.40% (based on age) 3.15% - 5.40% (based on age)
7.90%
Mortality rates were based on the RP-2000 Combined Healthy Male and Female Mortality Tables (setback 1 year for females) with adjustments for mortality improvements from the base year of2012 based on Projection Scale AA.
The actuarial assumptions used in the July 1, 2013 valuation were based on the results of an actuarial experience study for the period July 1, 2008 to June 30, 2011.
In accordance with State statute, the long-term expected rate of return on plan investments is determined by the State Treasurer, after consultation with the Directors of the Division of Investments and Division of Pensions and Benefits, the board of trustees and the actuaries. Best estimates of arithmetic real rates of return for each major asset class included in PERS's target asset allocation as ofJune 30, 2014 are summarized in the following table:
Long-Term Expected
Target Real Rate Asset Class Allocation of Return
Cash 6.00% 0.80% Core Bonds 1.00% 2.49% Intermediate-Term Bonds 11.20% 2.26% Mortgages 2.50% 2.17% High Yield Bonds 5.50% 4.82% Inflation-Indexed Bonds 2.50% 3.51% Broad US Equities 25.90% 8.22% Developed Foreign Equities 12.70% 8.12% Emerging Market Equities 6.50% 9.91% Private Equity 8.25% 13.02% Hedge Funds/Absolute Return 12.25% 4.92% Real Estate (Property) 3.20% 5.80% Commodities 2.50% 5.35%
65

BOARD OF EDUCATION BOROUGH OF FAIR LAWN
NOTES TO BASIC FINANCIAL STATEMENTS YEAR ENDED JUNE 30, 2015
Note VII: Public Employees Retirement System (Continued)
Discount Rate
The discount rate used to measure the total pension liability was 5.39% and 5.55% as of June 30, 2014 and 2013, respectively. This single blended discount rate was based on the long-term expected rate of return on pension plan investments of 7.9%, and a municipal bond rate of 4.29% and 4.63% as of June 30, 2014 and 2013, respectively, based on the Bond Buyer Go 20-Bond Municipal Bond Index which includes tax-exempt general obligation municipal bonds with an average rating of AA/Aa or higher. The projection of cash flows used to determine the discount rate assumed that contributions from plan members will be made at the current member contribution rates and that contributions from employers will be made based on the average of the last five years of contributions made in relation to the last five years of recommended contributions. Based on those assumptions, the plan's fiduciary net position was projected to be available to make projected future benefit payments of current plan members through 2033, and the municipal bond rate was applied to projected benefit payments after that date in detennining the total pension liability.
Sensitivity of the District's proportionate share of the net pension liability to changes in the discount rate
The following presents the District's proportionate share of the net pension liability calculated using the discount rate of 5.39%, as well as what the District's proportionate share of the net pension liability would be if it were calculated using a discount rate that is I-percentage point lower (4.39%) or I-percentage point higher (6.39%) than the current rate:
District's proportionate share of the net pension
1% Decrease (4.39%)
Current Discount
Rate (5.39%)
1% Increase (6.39%)
liability $36,550,298 29,054,291 22,749,510 Detailed information about the pension plan's fiduciary net position is available in separately issued PERS financial report.
Note VIII: Teachers Pension and Annuity Fund (TPAF)
At June 30, 2015, the District reported a liability for its proportionate share of the net pension liability that reflected a reduction for State pension support to the District. The arnomt recognized by the District as its proportionate share of the net pension liability, the related State support, and the total portion of the net pension liability that was associated with the District were as follows:
District's proportionate share ofthe net pension liability
State's proportionate share of the net position liability associated with the District
Total
$
197,714,201
$197.714.201
The net pension liability was measured as of June 30,2014 and the total pension liability to calculate the net pension liability was determined by an actuarial valuation as of that date. The District's proportion of the net pension liability was based on a projection of the District's long-term share of contributions to the pension plan relative to the projected contributions of all participating school districts and the State, actuarially determined. At June 30,2014, the District's proportion was 0.00%, which was a decrease of 0.00% from its proportion measured as of June lJ, 2013.
66

BOARD OF EDUCATION BOROUGH OF F AIR LAWN
NOTES TO BASIC FINANCIAL STATEMENTS YEAR ENDED JUNE 30, 2015
Note VI1I: Teachers Pension and Anrtuity Fund (TPAF)(Continued)
For the year ended June 30, 2015, the District recognized pension expense of $10,638,880 and revenue of $10,638,880 for support provided by the State. At June 30, 2015, the District reported deferred outflows of resources and deferred inflows of resources related to TPAF from the following sources:
Differences between expected and actual experience Changes of assumptions Net difference between projected and actual earnings on pension plan investments Changes in proportion State's contribution associated with the District subsequent to the measurement date
Total
$
Deferred Outflows
Of Resources
15,870,325
1,571,410 $17.441.735
Deferred Inflows
Of Resources
$80,716
6,397,465
308,280
$6.786.461
$1,571,410 reported as deferred outflows of resources related to pensions resulting from district contributions subsequent to the measurement date (June 30, 2014) will be recognized as a reduction of the net pension liability in the year ended June 30, 2015. Other amounts reported as deferred outflows of resources and deferred inflows of resources related to pensions will be recognized in pension expense as follows:
Year ended June 30, 2016 2017 2018 2019 2020 Thereafter Total
Actuarial Assumptions
$(483,453) (483,453) (483,453) (483,453) 1,126,875 2,812,218
$(2,005,281)
The total pension liability in the June 30, 2014 actuarial valuation was determined using the following assumptions, applied to all period included in the measurement:
Inflation rate
Salary increases: 2012-2021 Thereafter
Investment rate of return:
67
2.50%
Varies based on experience Varies based on experience
7.90%

BOARD OF EDUCATION BOROUGH OF FAIR LAWN
NOTES TO BASIC FINANCIAL STATEMENTS YEAR ENDED JUNE 30, 2015
Note VIII: Teachers Pension and Annuity Fund (TPAF)(Continued)
Mortality rates were based on the RP-2000 Health Annuitant Mortality Table for Males or Females, as appropriate with adjustments for mortality improvements based on Scale AA from the base year of 2000 until the valuation date plus 15 years to account for future mortality improvement. Post-retirement mortality improvements for non-disabled annuitants are projected using Scale AA from the base year of 2000 for males and 2003 for females until the valuation date plus 7 years to account for future mortality improvement.
The actuarial assumptions used in the July 1,2013 valuation were based on the results of an actuarial experience study for the period July 1,2009 to June 30, 2012.
In accordance with State statute, the long-term expected rate of return on plan investments is determined by the State Treasurer, after consultation with the Directors of the Division of Investments and Division of Pensions and Benefits, the board of trustees and the actuaries. Best estimates of arithmetic real rates of return for each major asset class included in TPAF's target asset allocation as ofJune 30, 2014 are summarized in the following table:
Long-Term Expected
Target Real Rate of Asset Class Allocation Return
Cash 6.00% 0.50% Core fixed income 0.00% 2.19% Core Bonds 1.00% 1.38% Short-term bonds 0.00% 1.00% Intermediate-Term Bonds 11.20% 2.60% Long-term bonds 0.00% 3.23% Mortgages 2.50% 2.84% High Yield Bonds 5.50% 4.15% Non-US fixed income 0.00% 1.41% Inflation-Indexed Bonds 2.50% 1.30% Broad US Equities 25.90% 5.88% Large cap US equities 0.00% 5.62% Mid cap US equities 0.00% 6.39% Small cap US equities 0.00% 7.39% Developed Foreign Equities 12.70% 6.05% Emerging Market Equities 6.50% 8.90% Private Equity 8.25% 9.15% HedgeFunds/Absolute Returns 12.25% 3.85% Real Estate (Property) 3.20% 4.43% Real Estate (REITS) 0.00% 5.58% Commodities 2.50% 3.60% Long credit bonds 0.00% 3.74%
68

BOARD OF EDUCATION BOROUGH OF FAIR LAWN
NOTES TO BASIC FINANCIAL STATEMENTS YEAR ENDED JUNE 30, 2015
Note VIII: Teachers Pension and Annuity Fund (TPAF)(Continued)
Discount Rate
The discount rate used to measure the total pension liability was 4.68% and 4.95% as of June 30, 2014 and 2013, respectively. This single blended discount rate was based on the long-tenn expected rate of return on pension plan investments of 7.9%, and a municipal bond rate of 4.29% and 4.63% as of June 30, 2014 and 2013, respectively, based on the Bond Buyer Go 20-Bond Municipal Bond Index which includes tax-exempt general obligation municipal bonds with an average rating of AAIAa or higher. The projection of cash flows used to determine the discount rate assumed that contributions from plan members will be made at the current member contribution rates and that contributions from employers will be made based on the average of the last five years of contributions made in relation to the last five years of recommended contributions. Based on those assumptions, the plan's fiduciary net position was projected to be available to make projected future benefit payments of current plan members through 2033, and the municipal bond rate was applied to projected benefit payments after that date in detennining the total pension liability.
Note IX: Health Benefit and Post-Retirement Medical Benefits
P.L. 2011, c.78 effective October 2011, sets new employee contribution requirements towards the cost of employerprovided health benefit coverage. Employees are required to contribute a certain percentage of the cost of coverage. The rate of contribution is determined based on the employee's annual salary and the selected level of coverage. The increased employee contributions will be phased in over a 4-year period for those employed prior to this new legislation's effective date with a minimum contribution required to be at least 1.5% of salary.
Health Benefits Program Fund (HBPF)- Local Education (including Prescription Drug Program Fund)- The State of New Jersey provides free coverage to members of the Teachers' Pension and Annuity Fund who retirefrom a board of education or county college with 25 years of service or on a disability retirement. Under the provisions of P.L. 1992, c.126, the State also provides free coverage to members of the Public Employees' Retirement System and Alternate Benefits Program who retire from a board of education or county college with 25 years of service or on a disability retirement if the member's employer does not provide this coverage.
P.L. 1987, c.384 and P.L. 1990, c.6 required the Teachers' Pension and Annuity Fund and the Public Employees' Retirement System, respectively, to fund post-retirement medical benefits for those employees who retire after accumulating 25 years of credited service or on a disability retirement. As of June 30, 2014, there were 103,432 retirees receiving post-retirement medical benefits and the state contributed $1.04 billion on their behalf. The cost of these benefits is funded through contributions by the State in accordance with P.L. 1994, c.62. Funding of postretirement medical benefits changed from a pre-funding basis to a pay-as-you-go basis beginning in Fiscal Year 1994.
The State is also responsible for the cost attributable to P.L. 1992 c.126 which provides free health benefits to members of PERS and the Alternate Benefit Program who retired from aboard of education or county college with 25 years of service. The State paid $165.8 million toward Chapter 126 benefits for 18,122 eligible retired members in Fiscal Year 2014.
69

BOARD OF EDUCATION BOROUGH OF FAIR LAWN
NOTES TO BASIC FINANCIAL STATEMENTS YEAR ENDED JUNE 30, 2015
Note X: Deferred Compensation Plan
The Board offers its employees a deferred compensation plan (the "Plan") created in accordance with Internal Revenue Code Section 403(b). The plans, which are administered by the entities listed below, permits participants to defer a portion of their salary until future years. Amounts deferred under the plans are not available to employees until termination, retirement, death or unforeseeable emergency or upon death to their beneficiaries. The plan administrators are as follows:
Equitable Lincoln Investment Planning VALlC
All amounts of compensation deferred under this plan, all property and rights purchased with those amounts, and all income attributable to those amounts, property and rights are (until paid or made available to the employee or other beneficiary) solely the property and rights of the Borough of Fair Lawn School District (without beingrestricted to the provisions of benefits under the Plan) subject only to the claims of the Borough of Fair lawn's general creditors. Participants' right under the Plan are equivalent to those of general creditors of the Borough of Fair lawn School District in an amount equal to the fair market value ofthe deferred account for each participant.
The maximum amount of deferred compensation for any participant for any taxable year shall not exceed the lesser of $18,000.00 or 100 percent of the participant's includible compensation for the taxable year except as provided by the limited catch-up provision which may effect a participant's last three taxable years ending before a participant attains normal retirement age as defmed by plan.
During the year ended June 30, 2014 and 2015, the employees' contributions to the plan were $1,423,672.94, and $1,779,591.18
Note XI: Risk Management
New Jersey Unemployment Compensation Insurance - The District has elected to fund its New Jersey Unemployment Compensation Insurance under the "Benefit Reimbursement Method". Under this plan, the District is required to reimburse the New Jersey Unemployment Trust Fund for benefits paid to its former employees and charged to its account with the State. The District is billed quarterly for amounts due to the State.
The following table is a summary of district contributions, employee contributions, reimbursements to the state for benefits paid and the ending balance of the district's trust fund for the current and previous two years:
Fiscal Year District Employee Amount Ending Contributions Contributions Reimbursed Balance
2014-2015 $ 0.00 $ 138,824.92 $ 6,842.18 $ 525,885.30 2013-2014 0.00 139,478.19 121,515.87 511,820.63 2012-2013 0.00 107,885.64 225,173.56 497,677.33
The Borough of Fair Lawn School District is exposed to various risks of loss related to torts; theft of, damage to, and destruction of assets; errors and omissions; injuries to employees; and natural disasters.
The District is a member of the School Alliance Insurance Fund. (the "Fund"). The Fund is both an insured and selfadministered group of school districts established for the purpose of providing certain low-cost Property Damage, Employer's Liability, School Board Legal Liability, Automobile and Equipment Liability, insurance coverage for member school districts in order to keep local property taxes at a minimum. The District pays an annual assessment
70

BOARD OF EDUCATION BOROUGH OF FAIR LAWN
NOTES TO BASIC FINANCIAL STATEMENTS YEAR ENDED JUNE 30, 2015
Note XI:Risk ManagementfContinued)
to the Fund and should it be determined that payments received by the Fund are deficient, additional assessments may be levied. Additionally, the Fund maintains a contract of excess insurance with a commercial reinsuror to secure the payment of benefits.
The District is a member of the New Jersey School Board Association Insurance Group (the "Group").
The Group is both an insured and self-administered group of school districts established for the purpose of providing certain low-cost Workers' Compensation coverage for member school districts in order to keep local property taxes at a minimum. The District pays an annual assessment to the Group and should it be determined that payments received by the Group are deficient, additional assessments may be levied. Additionally, the Group maintains a contract of excess insurance with a commercial reinsuror to secure the payment of benefits.
The Borough of Fair Lawn School District continues to carry commercial insurance coverage for all other risks of loss, including employee health and accident insurance. Settled claims resulting from these risks have not exceeded commercial insurance coverage in any of the past three fiscal years.
Note XII:Compensated Absences
The District accounts for compensated absences (e.g., unused vacation, sick leave) as directed by Governmental Accounting Standards Board Statement No. 16 (GASB 16), "Accounting for Compensated Absences". A liability for compensated absences attributable to services already rendered and not contingent on a specific event that is outside the control of the employer and employee is accrued as employees earn the rights to the benefits.
District employees are granted vacation and sick leave in varying amounts under the District's personnel policies. In the event of termination, an employee is reimbursed for accumulated vacation. Sick leave benefits provide for ordinary sick pay are paid upon retirement to employees over 50 years old with 15 years of service. In the district-wide Statement of Net Position, the liabilities whose average maturities are greater than one year are reported in two components - the amount due within one year and the amount due inmore than one year.
The liability for vested compensated absences of the proprietary fund types is recorded within those funds as the benefits accrue to employees. As of June 30, 2015, no liability existed for compensated absences in the Food Service Fund.
Note XIII:Contingent Liabilities
The Borough of Fair Lawn School District is a defendant in several lawsuits, none of which is unusual for a Board of Education of its size. Additional liabilities, if not covered by insurance, should not be materialin amount.
71

BOARD OF EDUCATION BOROUGH OF FAIR LAWN
NOTES TO BASIC FINANCIAL STATEMENTS YEAR ENDED JUNE 30, 2015
Note XIV: Restatement of Prior Year Balances
Net position has been restated as required by the implementation of GASB 68, as discussed in noted VII and VIII above.
Beginning net position as previously reported at June 30, 2014 Prior period adjustment - Implementation GASB 68
Net pension liability (measurement date) Deferred outflows - District's contributions made during fiscal year 2014
Total prior period adjustment Net position as restated, July 1,2014
Note XV:Subseguent Events
$23,001,034.69
(29,089,309.00 1,167,786.02
(27,921.522.98) $4.920.488.29)
The Borough of Fair Lawn School District has evaluated subsequent events through October 9, 2015, the date which the financial statements were available to be issued and no additional items were noted for disclosure or adjustment.
72
REQUIRED SUPPLEMENTARY INFORMATION -PART II
73

Section C
BUDGETARY COMPARISON SCHEDULES
74

Exhibit C.1 BOARD OF EDUCATION
BOROUGH OF FAIR LAWN Budgetary COmPlNon Schedule
Gln.,.1 Fund Flaeal Ylir Ended Junl 30, 201.
Varlinci Orlglnll Budglt Final Flnllto ilIlIll!! l!!n!1!!I BY!!A!I M!!I!I .&llII1
REVENUES: Local Sources:
Local Tax Levy S 77,888,891 .00 S S 77,8ea,891.00 S 77,e88,891.00 Tuition 355,000.00 355,000.00 392,182.32 37,182.32 TransporleUon Fees 39,700.00 39,700.00 45,184.00 5,484.00 Inlarasl Eamed on Inveallnents 45,000.00 45,000.00 43,487.92 (1,532.08) Interast Eamad on Capital Raserve Funds 2,000.00 2,000.00 1,4e8.71 (511.29) Mlacallanaous 1,749,304.00 1,749,304.00 1,892,218.13 142,912.13
Total- Local Source. 80,079,895.00 80,079,895.00 80,283,390.08 183,495.08
Slala Sources: Equalization AId 147,343.00 147,343.00 147,343.00 Categorical TranaporlaUon Aid 198,378.00 198,378.00 198,378.00 Catagorlcal Special Education Aid 2,837,781 .00 2,837,781.00 2,837,781.00 Categorical Security AId 88,295.00 88,295.00 e8,295.00 Per PupN Growth Aid 45,520.00 45,520.00 45,520.00 PARCC Readiness Aid 45,520.00 45,520.00 45,520.00 Extraordinary AId 554,000.00 554,000.00 1,991,403.00 1,437,403.00 NonpubllcTransporlaUon Aid 58,8e8.00 58,8e8.oo TPAF PRM (On-Bah8~ - Non-Budgeted) 3,2DB,oe8.0o 3,208,Oe8.00 TPAF Social Security (Relmbursad • Non-Budgeted) 2,792,049.45 2,792,049.45
Total Slata Sources 3,914,837.00 3,914,837.00 11,409,043.45 7,494,208.45
FadaraJ Sources: Medical AIIlslanca Program 33,108.00 33,108.00 173,384.58 140,258.58
Tolal- FaaaraJ Sources 33,108.00 33,108.00 173,384.58 140,258.58 Totll Rlvinul. 84,027,840.00 84,027,840.00 91,845,7e8.11 7,817,958.11
EXPENOITURES: Cumnt Expen •• : Regular Progl'lm •• tn.tructlon
PraschoollKlnaergarten - Salarlas of Teachm 110-100-101 803,403.40 (78,237.48) 527,185.94 527,103.40 82.54 Grades 1-5· Salaries of Teachers 120·100·101 9,153,224.23 (388,253.43) 8,788,970.80 8,741,884.70 45,1DB.1o Grades ~ - Salaries of TaBeIlara 130-100-101 8,450,109.87 15,085.79 8,485,175.88 6,437,944.41 27,231.25 Graaas 9-12· Salaries otTeaellers 140-100-101 8,491,879.20 (425,583.89) 8,088,295.31 8,044,722.52 21,572.79
Regullr Progl'lm •• Home Instruction: Salaries otTeachera 150-100-101 170,897.58 (57,158.17) 113,739.41 111,387.48 2,351.95 Purchasad Professional-Educational Sarvlcas 150-100-320 38,000.00 (19,631.20) 18,388.80 16,3e8.80
Regul.r Progl'lm •• Undistributed tnltructlon Other Salar1es for Instruction 190-100-108 25,932.00 (21,521 .43) 4,410.57 4,194.90 215.67 Purchased Profasslonal·Educational Sarvlcas 190-100-320 798,185.73 798,185.73 678,389.29 117,818.44 Other Purchasad Servlcas (400-500 sarias) 190-10D-500 19,000.00 (9,585.52) 9,414.48 8,282.05 1,152.43 General Suppllas 190-100-810 830,315.24 (37,587.82) 792,747.42 766,2DB,85 26,540.77 Textbooks 190-100-840 84,166.00 51,414.03 135,570.03 104,379.71 31,190.32 Other Objects 190-10D-800 144,338.00 145,2ea.80 289,824.80 282,732.72 8,891.ea TOTAL REGULAR PROGRAMS • INSTRUCTION 28,011,255.52 (5,5ea·m 28,005,888.75 25,725,538.81 280,132.14
SPECIAL EOUCATION • INSTRUCTION Cognilivi • Mild:
Salarias of Taachers 201-100-101 154,095.00 850.00 154,945.00 154,945.00 Other Salaries for Instruction 201-100-108 160,748.00 (1,771.91) 158,976.09 129,358.26 29,617.83 Purchased Profasslonal-Educational Servless 201-100-320 10,541.DB 10,541.DB 8,485.69 2,055.37 General Supplies 201-100-810 4,000.00 (3,141.38) 858.64 858.64 Othar Objects 201-100-800 1,500.00 (148.00) 1,352.00 1,352.00
Totll Cogniliv •• Mild 320,343.00 6,329.79 326,672.79 294,999.59 31,673.20 Cognltlvl • Moderall:
Selerles of Teechers 202-100-101 167,195.00 850,00 168,045.00 168,045.00 Other Salarias tor Instruction 202·1 00-1 DB 152,714.00 3,101.15 155,815.15 155,815.15 Purchased Professlonal·Educationai Sarvless 202-100-320 15,554.22 15,554.22 13,982.41 1,571 .81 Genaral SuppMes 202·100-810 1,800.00 448,47 2,048.47 2,046.47 Other Objectl 202·10D-800 750.00 (391.00) 359.00 359.00
Total CognlUv •• Modll'lt. 322,259.00 19,580.84 341,819.84 340,248.03 1,571.81 Learning andlar Language DlllbIllUI.:
Salarlas of Teachers 204·100-101 844,210.00 (108,208.00) 538,004.00 507,087.89 30,918.31 Other Salar1es for InstrucHon 204·1 00·1 DB 674,016.00 131,272.09 805,2e8.09 805,288.09 Purchased Profasslonal·EducaUonal Sarvlce. 204·100-320 82,108.OS 62,108.08 73,138.38 8,969.68 General Suppllas 204·100-810 8,100.00 (1,167.29) 4,932.71 1,770.11 3,182.80 Textbooks 204·100-840 20,000.00 (4,808.47) 15,191.53 15,153.77 37.76
Tat.t LI.mlng Indlor Languagl DI •• bIlIUH 1,344,326.00 101,196.39 1,445,522.39 1,402,438.04 43,088.35 Behlvlol'll OIHbItlUe.:
Salartes otTeachera 209·100-101 327,410.00 30,410.27 357,820.27 345,944.02 11,878.25 Other Salarias for Instruction 209-100·108 242,303.00 23,708.17 288,009.17 255,523.83 10,485.54 Purchased Professional·Educational Servlcaa 209·100-320 13,080.66 13,DBO.68 11,081.91 1,978.n General Supplies 209-100-810 4,500.00 267.22 4,787.22 1,794.19 2,973.03 TextboDks 209-100-840 6,000.00 (2,578.82) 3,421.38 3,421.38 Othar ObJacts 209-100-800 1,500.00 j7S1.96) 738.04 452.85 285.39
Total Behavioral DIHbIllUe. 561,713.00 84,103.78 845,816.76 618,217.78 27,598.98 Re.oun:e RoomlRtaaun:e Cenllr:
Salaries otTeachers 213·100-101 2,575,845.00 1,708.48 2,577,551.46 2,525,793.37 51,758.09 Purchased Professlonal·Educational Services 213·100-320 47,014.48 47,014.46 39,638.09 7,378.37 General Supplies 2130100-810 4,000.00 (2,763.20) 1,218.80 1,216.80 TaxtboDks 213·100-840 9,000.00 9,527.81 18,527.81 12,472.43 8,055.38
Tolal Rlloun:a RoomiRHoun:a Center 2,566,845.00 55,465.53 2,644,310.53 2,579,120.89 65,189.84
7S

ExhlbllC·1 BOARD OF EDUCATION
BOROUGH OF FAIR LAWN Budgellry Complrllon Schedula
Gen.,11 Fund Flacil Vllr Endld June 30, 2015
Varllnce Orlglnll Budgel Flnll Finella ~ Ir!n!fm .I!l!!IlItI &!!!!I M!YII
AuUam: SalaMes of Taachers 214-100-101 400,875.00 525.78 401,400.78 398,169.40 3,231 .36 Other Salaries for InslrucHon 214-100-106 785,911.00 19,423.92 785,334.92 779,861.86 5,473.26 Purchasad Profassional·EducaUonal Servlcas 214-100-320 155,000.00 15,064.78 170,064.78 123,881.04 46,183.72 General Supplies 214-100-610 17,948.90 l5,691.58) 12,257.32 12,059.38 197.94
TolllAuUam 1,339,734.90 29,322.86 1,389,057.76 1,313,971.48 55,088.26 Preachool Dillblllllea· PlrI-Tlme:
SeiaMBs of Teachera 215-100-101 555,040.00 (332,020.00) 223,020.00 206,296.76 16,723.24 Other SaieMBs for InslrucUon 215-100-106 783,318.00 (542,529.45) 220,786.55 197,799.20 22,987.35 Purchased Profel8lonal-EducaUonal SeMces 215-100-320 59,761.04 59,781.04 52,099.05 7,681 .99 GeneralSuppllBi 215-100-610 10,000.00 (3,349.75) 8,650.25 6,438.80 213.45 Other ObjeCII 215-100-800 400.00 l375.00) 25.00 25.00
Tolll Preachool DlllblllUea • Pari-Time 1,328,756.00 l818,513.18) 510,242.84 462,656.81 47,586.03 Preachool DlaablllU .. - Full-Tlma:
SalaMes ofTeachers 216-100-101 331,625.00 331,625.00 331,510.18 114.62 Other SalaMes for InslrucHon 216-100-108 522,038.85 522,038.85 522,038.85
Tolil Preachool DlllbIllU •• - Full-Tlma 853,863.85 853,863.85 853,548.83 114.82 Homa InatrucUon:
Salaries ofTeachers 219-100-101 98,973.91 98,973.91 89,592.64 7,381.27 Purchased Professlonal-EducaUonal Services 219-100-320 33,071.81 33,071 .81 33,000.82 70.711
Tolil HomalnstrucUon 130,045.52 130,046.52 122,593.46 7,452.06 TOTAL SPECIAL EDUCATION • INSTRUCTION 7,825,978.90 441,175.18 8,287,152.06 7,987,792.71 279,359.37
Basic Skllll/Remedill • InstrucUon Salaries ofTeachers 230-100-101 $ 215,133.00 $ $ 215,133.00 $ 209,032.80 $ 6,100.40 General Supplies 230-100-810 38,900.00 986.93 39,888.93 39,876.58 12.35
Tolil Blalc SklllalRamadlal·lnatrucUon 254,033.00 986.93 255,021.93 248,909.18 8,112.75 Bilingual EducaUon ·lnatrucUon
SalaMes of Teachers 240-100-101 700,925.00 351.14 701,278.14 890,886.43 10,5811.71 General SuppKes 240-100-610 8,870.00 !130.92) 8,739.08 8,881.64 57.24
Tolil Bilingual EducIUon ·Inatrucllon 709,795.00 220.22 710,015.22 899,388.27 10,848.95 School.Spon, Cocumcular Actvta, • Inat.
SalaMes 401-100-100 377,008.00 (2,458.94) 374,5411.06 343,486.97 31,082.011 Supplies and Materials 401·100-600 17,000.00 2,910.00 19,910.00 17,829.34 2,280.66 Other Objects 401·100-800 27,800.00 l3,224.23) 24,575.77 20,661.80 3,913.117
Tolil School-8pon, Cocurrlcular AclVll. ·Inat. 421,808.00 l2,773.17) 419,034.83 381,758.11 37,278.72 School-8pon, AthlaUca • InatrucUon
SalaMes 402-100-100 607,715.00 33,892.25 641,807.25 804,518.85 37,090.40 Purchased Services (300-500 sarias) 402-100-500 80,500.00 1,838.43 82,138.43 80,746.75 1,389.68 Supplies and MataMals 402-100-800 87,086.74 9,440.18 78,528.92 86,343.80 10,183.12 Olhar Objects 402-100-800 141,493.00 l15,758.38) 125,738.84 91,207.94 34,528.70
TolIl School-8pon, Athletics ·lnllrucUon 898,794.74 29,212.50 928,007.24 642,815.34 83,191.90 Other SupplementaUAt·Rlek Programa ·lnatrucHon
Salaries ofTeachars 424-100-101 1,197,856.00 1,197,858.00 1,044,870.82 152,987.38 Salarias of Reeding Specialists 424·100-179 156,130.00 156,130.00 158,130.00 General Supplies 424·100-610 1,000.00 (970.25) 29.75 29.75 Textbooks 424·100-640 500.00 l310.00) 190.00 190.00
Tolal Olher SupplementeUAI·Rlak Programa ·lnalrucUon 1,355,488.00 !1,280.25) 1,354,207.75 1,201,220.37 152,987.38 Tolliinatrucllon 37,475,151.16 481,956.84 37,937,107.80 37,087,400.59 849,707.21
UndlabMbuled Expendlturea ·lnstrucUon: TulUon to Other LEAs Within the State - Speelal 000·100-562 291,502.00 145,998.84 437,500.84 434,706.05 2,794.79 TulUon to County Voc. School Dlsl • Regular 000-100-583 458,388.00 (1,150.00) 457,238.00 443,528.00 13,712.00 TulUon to County Voe. School Disl • Spaelal 000-100-564 156,800.00 28,912.00 165,512.00 184,660.00 832.00 TullIon to CSSD & Regional Day Schools 000-100-565 1,092,459.00 247,083.73 1,339,522.73 1,339,522.73 TulUon to PMvate Schools for the Disabled - WIthin State 000-100-586 3,572,576.00 267,581.19 3,840,137.19 2,849,987.10 990,150.011 TulUon • Stata FacliUes 000-100-588 32,306.00 32,306.00 9,000.00 23,308.00
Tollt UndlabMbuted Expendlturea ·lnllrucUon: 5,571,525.00 720,891.78 6,292~18.76 5,281,421.88 1,030,794.66 UndlsbMbuted expand •• Attend, & Social Work
Salaries 000-211-100 82,228.00 881.52 83,107.52 83,107.48 0.04 TolIl Undt.bMbuled Expend, • Attend. & Soclll Work 82,228.00 861.52 83,107.52 83,107.46 0.04 Undlat. Expend,. He.lth Servicli
Saleriss 000-213-100 941,837.27 (24,341.81) 917,295.46 914,528.56 2,788.90 Purchased Professlonel and Technlcel Services 000-213-300 27,000.00 7,575.00 34,575.00 34,575.00 Other Purchased Services (400-500 series) 000-213-500 1,280.00 1,280.00 1,044.78 235.22 Supplleland Matarials 000-213-600 81,320.00 21,237.54 102,557.54 101,284.43 1,273.11 Other Objacts 000-213-600 2,822.00 1,063.00 3,685.00 3,867.00 18.00
TolIl UndlabMbuled expenditure •• Health ServlcII 1,053,859.27 5,533.73 1,059,393.00 1,055,097.77 4,295.23 Undlat. Expend, • Spuch,OT,PT & Ralalad Servicli
Salaries of Other Professional Stall 000-216-100 1,538,390.00 (1,720.00) 1,534,870.00 1,519,644.92 15,025.08 Purchesed Professional - Educational Sarvlcas 000-216-320 860,800.00 289,320.27 950,120.27 788,680.71 181,439.56 Suppnes and MateMels 000-218-600 22,561.80 l14,455.88) 8,125.74 8,747.89 l,3n.85
TolIl UndlaL Expend, • Spllch,OT,PT & Rallied Servlcea 2,219,771.80 273,144.41 2,492,916.01 2,315,073.52 177,842.411 UndilL Expend.· OIhar Supp, Serv, Studanta • Extra Serv,
Purchased Profelllonal· EducaUonal Services 000-217-320 21,000.00 19,902.98 40,902.98 39,978.20 928.76 Supplill and MataMals 000-217-800 5,000.00 8,174.58 11,174.56 11,173.91 0.67
TolIl UndlaL Expend. • Other Supp, Serv, Studenll • exira Serv, 26,000.00 28,077.54 52,077.54 51,150.11 927.43 UndlaL Expend, • Guidance
Salanes of Other Profasslonal Stall 000-218·104 1,249,510.60 (92,709.39) 1,158,801.21 1,098,383.51 58,417.70 Salaries of SacrataMel and Clerical Assistanta 000-218-105 181,821.00 3,769.78 185,590.78 185,590.72 0.04 Other Selanas 000-218-110 4,091.00 (4,091.00)
76

ExhlbllC-1 BOARO OF EDUCATION
BOROUGH OF FAIR LAWN Budgetary Compartlon Schedule
Genaral Fund Fllcal Vear Endad June 3D, 2011
Vartance Ortglnel Budget Final Flnello !l!!!!lId IwI!fm il!l!lW Am!II .&lIIII
Supplle. and Malarlals 000-218.aoo 1,550.00 (725.78) 824.24 824.204 Other Objeeta 000-218-800 23,971.00 !1,784.27) 22,188.73 18,922.44 3,284.29
Total UndilL Expend, - Guidance 1,480,943.80 !95,540.88) 1,365,402.94 1,303,720.91 61,682.03 UndilL Expand, - Child Study Tllm
Selerles of Olhar Professional Staff 000-219-104 1,960,517.88 71,811.57 2,052,329.43 1,936,251.02 114,076.41 Salerles of Secralarlal and Clerlcel Aaslslanll 000-219-105 192,379.00 4,872.00 197,251.00 198,465.78 785.24 Other Salartes 000-219-110 2,195,035.00 (265,484.31) 1,929,550.89 1,735,897.32 193,853.37 Purchased Profasllonal - Educedonal Services 000-219-320 23,625.00 42,297.04 65,922.04 57,451.56 8,470.48 Misc. Pur. Servo (400-500 serl .. ) Olher Than Resldendal Costa 000-219-592 4,500.00 1,134.35 5,834.35 3,908.35 1,728.00 Supplies and Materiels 000-219-800 13,788.00 11,879.78 25,885.78 21,102.19 4,563.57 Other Objacta 000-219-800 4,500.00 3,723.18 8,223.16 5,956.78 2,288.40
Total Undt,L Expend, - Child Study Taam 4,414,342.88 !129,788.43) 4,284,578.43 3,956,832.98 325,743.47 UndlaL Expend. -Improvement of InlL Servo
Salaries of Other Professional Stefl 000-221-104 414,600.00 8,171.02 S 420,771.02 420,771.02 Other Selerles 000-221-110 1,938.00 (1,938.00) Selarl .. 01 FaclHtators, Math end LKerecy Coachel 000-221-178 48,932.00 (13,785.94) 35,188.08 35,188.08 Supplies and Materlels 000-221.aoo 4,000.00 15.08 4,015.08 2,532.84 1,482.42 Other Objeeta 000-221-800 1,000.00 70.00 1,070.00 1,070.00
Total UndtlL Expand. - Improvement of tnlL Servo 470,488.00 !9,445.88) 481,022.14 459,539.72 1,482.42 UndilL Expend. - Edu. Media SlrvJSch. Ubrary
Selarl .. 000-222-100 331,184.08 21,898.92 353,081.00 352,713.39 367.81 Supplies and Materials 000-222-800 58,476.00 (5,028.18) 53,449.84 52,954.29 495.55 Other Objacta 000-222-800 3,500.00 793.42 4,293.42 4,102.27 191.15
Total UndllL expand. - Edl!- Madll SarvJSch. Ubrary 393,182.08 17,882.18 410,824.28 409,789.95 1,054.31 UndilL Expend. -Inltrucdonal slIrr Training Servo
Selarles 01 Other Professional Stefl 000-223-104 33,571.00 (11,525.85) 22,045.15 22,045.05 0.10 Purchased Professional - EduceUonal Service 000-223-320 59,900.00 5,000.00 84,900.00 38,827.54 28,072.46 Other Purchasad Services (400-500 serlel) 000-223-500 18,300.00 4,999.29 23,299.29 21,830.14 1,469.15 Supplies and Materiels 000-223-800 1,000.00 (70.00) 930.00 584.00 388.00 Other Objacta 000-223-800 4,000.00 4,000.00 4,000.00
Total UndilL expend. -tnatrucUonel Starr Training Serv. 116,771.00 !1,598.56) 115,174.44 65,288.73 29,907.71 UndlaL Expend. - Supp. Servo - General Admin.
Salarlll 000-230-100 359,379.50 3,608.25 382,987.75 362,140.15 647.80 Legal ServlcII 000-230-331 251,000.00 84,270.37 315,270.37 124,335.87 190,934.70 AudttFees 000-230-332 35,375.00 35,375.00 32,500.00 2,875.00 ArchlleclurallEnglneerlng ServiceS 000-230-334 102,563.00 (29,705.50) 72,857.50 17,650.00 55,207.50 Other Purchased Professional Sarvlces 000-230-339 33,950.00 8,888.32 40,838.32 24,078.82 18,759.50 CommunlcallonlfTelephone 000-230-530 183,170.00 (23,723.08) 159,448.92 132,333.26 21,113.88 Other Purchased Services (400-500 serles) 000-230-590 108,237.00 (2,888.14) 105,370.88 19,184.09 26,188.77 Supplies and Materiels 000-230-810 11,137.00 8,329.03 17,488.03 14,395.13 3,070.90 Judgments Agalnattha School Dlslr1C1 000-230-820 150,000.00 (125,848.44) 24,353.56 5,561.56 18,792.00 Miscananeous Expendttunas 000-230-890 42,933.80 42,933.60 39,422.18 3,511.44
TolIl UndilL Expend. - Supp. Servo - General Admin. 1,277,745.10 1100,845.19) 1,178,899.91 831,800.64 345,299.07 UndilL Expend. - Support Servo - School Admin.
Salari .. of Principals/Assistant Principals 000-240-103 2,425,985.00 19,425.64 2,445,390.64 2,421,184.68 11,628.18 Salar1es of Other Profeulonal Stall 000-240-104 426,800.00 (158.84) 428,443.36 428,443.34 0.02 Salaries of Seaatarlal and Clerical Assistants 000-240-105 822,740.50 36,159.76 856,900.26 856,133.98 788.28 Olher Salari .. 000-240-110 19,447.00 (19,447.00) SuppWas and Matar1a11 000-240-800 500.00 (288.00) 232.00 232.00 Other Objeeta 000-240-800 33,725.00 !318.48) 33,408.54 33,354.14 54.40
Total UndilL Expend. - Support Sirv. - School Admin. 3,728,977.50 35,397.50 3,784,315.00 3,145,928.14 18,446.88 UndlsL Expend •• Central Servlc ..
Salaries 000-251-100 1,180,268.00 1,653.18 1,161,921.18 1,148,515.88 21,345.30 Purchased Profaaalonal Services 000-251-330 60,410.00 4,888.92 65,078.92 50,706.59 14,372.33 MlsceVaneous Purchaaad ServiceS (400-500 serlee) 000-251-592 35,500.00 3,856.57 39,156.57 39,001.23 151.34 Supplies and Malerlels 000-251-800 9,102.00 3,916.80 13,618.80 13,541.80 77.00 Olher 0bJ8c1I 000-251-890 72,200.00 1,627.00 73,827.00 73,827.00
TolIl UndllL Expend •• Central S.rvlc .. 1,338,080.00 21,524.27 1,359,804.27 1,323,858.30 35,945.97 UndlsL Expend. - Admin. Info. Technology
Salarlas 000-252-100 568,832.00 (14,483.25) 574,368.75 551,773.56 22,595.19 Purchased Professional Services 000-252-330 105,133.15 23,322.48 128,456.21 82,138.56 48,311.83 Purchased Tachnlcal Services 000-252-340 84,900.00 (15,111.39) 49,188.81 47,140.64 2,647.77 Olher Purchased Services (400-500 aeries) 000-252-500 188,200.00 (52,208.31 ) 135,993.69 121,842.31 14,351.38 SuppHII end Maler1als 000-252-800 52,200.00 (927.95) 51,272.05 41,534.29 3,731.18 Oilier Objects 000-252-800 341,040.00 !31,131.10) 309,908.90 309,139.32 769.56
Total Undl,L Expend. - Admin. InfD, Technology 1,340,305.75 !90,517.54) 1,249,788.21 1,159,388.90 90,419.31 UndilL Expend •• Allowable MllnL For School Flcll"l ..
Salaries 000-281-100 546,473.93 3,498.75 549,970.88 545,384.85 4,605.83 Claanlng, Repair and Malntenence Services 000-261-420 542,442.24 51,907.78 800,350.00 538,388.28 81,983.12 Ganeral Suppllas 000-261-810 219,081.40 122,400.78 341,482.18 328,103.49 13,378.69
TolIl UndlaL Expend. - Allowable MalnL For School Fecllltl.1 1,301,997.51 183,805.29 1,491,802.88 1,411,834.62 79,988.24 UndilL Expend, - CUltodll1 Service.
Selarta, 000·282-100 1,751,042.08 (283,294.20) 1,473,747.88 1,471,481.02 2,288.88 Salarlas of Non-lnstrucUonal Aid .. 000-262-107 288,413.80 (28,490.14) 251,983.88 251,983.88 Purchased Professional and Technical Services 000-262-300 1,542,880.00 99,244.28 1,842,104.28 1,838,104.28 4,000.00 Cleaning, Repair and Melntenance Services 000-282-420 142,808.98 28,888.97 111,873.95 123,539.64 48,134.11 Other Purchased Properly Servlcas 000-282-490 261,314.00 (298.90) 287,015.10 152,800.10 114,215.00 Insurance 000-282-520 314,070.00 18,432.00 332,502.00 332,502.00 Miscellaneous Purchaaad Services 000-282-590 31,270.00 (312.75) 30,957.25 30,135.28 621.99 Genenal Supplies 000-262-810 278,655.00 (20,241.07) 258,413.93 256,815.57 1,538.38 Energy (NaluraJ Gas) 000-282-821 394,088.00 (47,531.22) 348,556.78 335,526.16 11,030.82 Energy (Electricity) 000-262-822 743,326.00 (1,436.28) 741,889.72 882,521.04 59,356.88 Other ObJecll 000-262-800 8,750.00 !4,427.00) 2,323.00 2,323.00
77
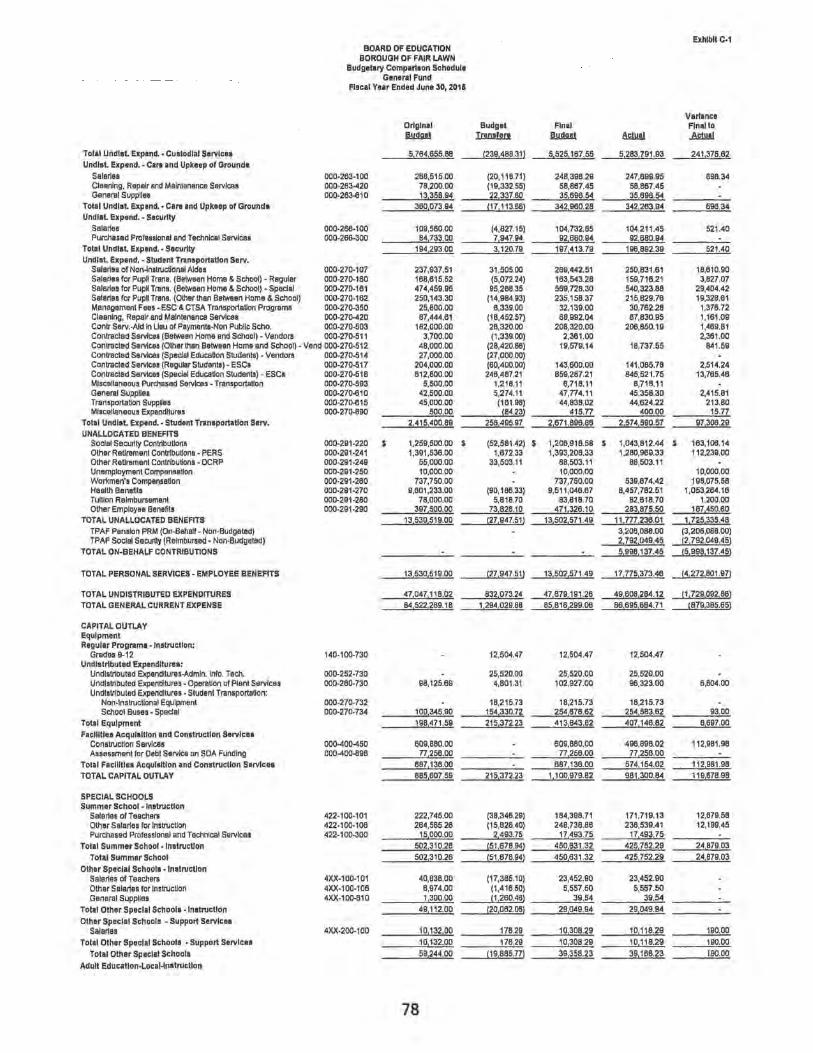
Exhibit C·1 BOARD OF EDUCATION
BOROUGH OF FAIR LAWN Budgetary Comparllon Schedule
General Fund Fiscal Ve., Ended June 3D, 2016
Variance Orlglnel Budget Final Flnllto ~ IwlIfm ~ &llIIl .&1lII1
Totll Undlst Expand •• Custodial Servlca. 5,784,855.88 {239,4BB.31) 5,525,187.55 5,283,791.93 241,375.62 Undlst Expend •• Clre and Upkeep 01 Ground.
Salaries 000·263·100 268,515.00 (20,118.71) 248,398.29 247,699.95 898.34 Cleaning, Repair and Maintenance Services 000·283-420 7B,2oo.oo (19,332.55) 58,887.45 58,887.45 General Supplies 000·283-810 13,358.94 22,337.60 35,898.54 35,696.54
Total Undlst Expand •• Care and Upkeep 01 Ground. 360,073.94 {17,113.88) 342,960.28 342,263.94 696.34 Undllt Expend •• Security
Salaries 000·258·100 109,580.00 (4,827.15) 104.732.B5 104,211 .45 521 .40 Purchesed Profes.lonal and Technical Services 000·266-300 84,733.00 7,947.94 92,680.94 92,680.94
Total Undlst Expend •• Security 194,293.00 3,120.79 197,413.79 198,892.39 521.40 Undlst Expend •• Sludent TransportaUon Servo
Salarlas of Non~n.tructlonal Aides 000·270·107 237,937.51 31 ,505,00 289.442.51 250.831.61 lB,810.90 Salaries for Pupil Trans. (Batwaen Home & School) • Reguler 000·27Q..160 168,815.52 (5,072.24) 163,543.28 159,716.21 3,827.07 Salarlas for PupH Trans. (Between Home & School) • Special 000·270·161 474,459.95 95,268.35 569,728.30 540,323.68 29,404.42 Salaries for PupH Trans. (Other then Between Homa & School) 000·270·162 250,143.30 (14,984.93) 235,156.37 215,829.76 19,328.81 Managem8f11 Faas· ESC & CTSA TransportaUon Programs 000·270·350 25,800.00 8,339.00 32.139.00 30.762.28 1,376.72 Cleaning, Repair and Maintenance Services 000·27a..420 87,444.61 (18,452.57) 68,992.04 87,830.95 1,161 .09 Conlr Serv.·Ald In Usu of Payments·Non Public Schoo 000·270·503 182,000.00 26,320.00 208,320.00 208,850.19 1,489.81 Conlracled Servlcee (Between Home end School) • Vandors 000·270·511 3,700.00 (1,339.00) 2,361.00 2.361.00 Conlracted Services (Olher then Betwean Home end School) • Vend OOQ..270·512 48.000,00 (28,420.86) 19.579.14 18,737.55 841 .59 Conlracted Servlcas (Special Educetion Siudenl.) • Vendors 000·270-514 27,000.00 (27,000,00) Conlracted Services (Regular Students) • ESCs 000·270·517 204,000.00 (60,400.00) 143,600.00 141,065.76 2,514.24 Conlracted Services (Spedal Education Siudents) • ESCs 000·270·518 612,600.00 246,487.21 859,267.21 645,521.75 13,765.46 Miscellaneous Purchased Sarvices • Transportation 000·270-593 5,500.00 1.218.11 8.718.11 6.718.11 General Suppllu 000.270-810 42,500.00 5,274.11 47,774.11 45.356.30 2,415.81 Transportation SuppHes 000·27Q.615 45,000.00 (161.98) 44,638.02 44,624.22 213.60 Miscellaneous expenditure. 000·270-890 500.00 184.23) 415.77 400.00 15.77
Tot.1 Undlst. Expend •• Sludent Tran'portatlon Servo 2,415,400.69 256,495.97 2,671,896.86 2,574,590.57 97,306.29 UNALLOCATED BENEFITS
Social Security Contribution. 000·291·220 $ 1,259,500.00 $ (52,581.42) $ 1.206,918.58 1,043,812.44 $ 163,106.14 Other Retirement Contributions· PERS 000·291·241 1.391.536.00 1,672.33 1,393,208.33 1,260,969.33 112,239.00 Other Retiremenl Contributlona • DCRP 000·291·249 55,000.00 33,503.11 68,503.11 88,503.11 Unemployment Compensation 000·291·250 10,000.00 10,000.00 10,000.00 Worl<men's Compensation 000·291·260 737.750.00 737,750.00 539.674.42 198,075.58 Health Benefits 000·291·270 9,601,233.00 (90,188.33) 9,511,046.87 6,457.762.51 1,053,264.18 Tuition Reimbursement 000-291·260 76,000.00 5,816.70 63,818.70 62,618.70 1,200.00 Other Employee Benefits OOQ..291·290 397,500.00 73,828.10 471,326.10 283,675.50 187,450.60
TOTAL UNALLOCATED BENEFITS 13,530,519.00 {27,947.51) 13,502,571.49 11,777,238.01 1,725,335.46 TPAF Pension PRM (On·BeheW. Non·Budgeled) 3,206,088.00 (3.206,088.00) TPAF Social Security (Reimbursed. Non-Budgeted) 2,792,049.45 {2,792,049.45)
TOTAL ON·BEHALF CONTRIBUTIONS 5,998,137.45 {5,998,137.45)
TOTAL PERSONAL SERVICES· EMPLOVEE BENEFITS 13,530,519.00 {27,947.51) 13,502,571.49 17,775,373.48 {4,272,601 .97)
TOTAL UNDISTRIBUTED EXPENDITURES 47,047,118.02 832,073.24 47,879,191 .28 49,608,284.12 {1,729,092.86) TOTAL GENERAL CURRENT EXPENSE 64,522,269.16 1,294,029.88 85,816,299.06 66,695,684.71 {B79,385.65)
CAPITAL OUTLAY Equipment Regular Program •• Instruction:
Grades 9·12 140·100·730 12,504.47 12,504.47 12.504.47 Undistributed Expenditure.:
Undistributed Expendiluras·Admln, Info. Tech. 000·252·730 25,520.00 25.520.00 25,520.00 Undlstr1buted expenditures· Operation of Plent Services 000-260·730 96,125.69 4,801.31 102,927.00 96,323.00 6,604.00 Undlstr1buted expenditures· Student Transportation:
Non·lnstructional Equipment 000·270·732 16,215.73 16,215.73 16,215.73 School Buses· Spedel 000·270-734 100,345.90 154,330.72 254,676.62 254,563.82 93.00
Total Equipment 198,471.59 215,372.23 413,843.82 407,148.82 6,697.00 Facilities Acquisition and Construction Service.
ConstrucHon Servlcas 000-400-450 609,880.00 B09,680.00 496,696.02 112,981.98 Assessmenlfor Dabt Service on SDA Funding 000-400-896 77,256.00 77,256.00 77,258,00
Total Facilltle. AcquiSition and Construction Slrvlce. 687,136.00 687,136.00 574,154.02 112,981.98 TOTAL CAPITAL OUTLAY 885,607,59 215,372.23 1,100,979.82 981 ,300.84 119,678.96
SPECIAL SCHOOLS Summer School· Instruction
Salerles ofTeachers 422·100·101 222,745.00 (36,346.29) 1B4,396.71 171,719.13 12,679.58 Other Selarles for InstrucHon 422·100·108 284.56528 (15,826.40) 248,738.68 236,539.41 12,199.45 Purchased Professional and Technical Services 422·100-300 15,000.00 2,493.75 17,493.75 17,493.75
Total Summer School ·lnstrucUon 502,310.28 !51,678.94) 450,831 .32 425,752.29 24,879,03 Total Summer School 502,310.28 {51 ,878.94) 450,631 .32 425,752.29 24,679.03
Other Special School •• Inotructlon Salaries of Teechers 4XX·100-101 40,638.00 (17,385.10) 23,452.90 23,452.90 Other Salaries for Instruction 4XX·l00·l06 6,974.00 (1,418.50) 5,557.50 5,557.50 General Supplies 4XX·10Q.610 1,300.00 {1,260,46) 39.54 39.54
Total Other Special School •• Instruction 49,112.00 !20,062.06) 29,049.94 29,049.94 O1hor Special School •• Support Servlc ••
Salaries 4XX·200·100 10,132.00 176,29 10,308.29 10,118.29 190.00
Totll Other Special School' • Support Services 10,132.00 176,29 10,308.29 10,118.29 190.00
Total Other Splclal School. 59,244.00 (19,685.77) 39,356.23 39, 166.23 190.00
Adult Educatlon.Local~nstruction
78
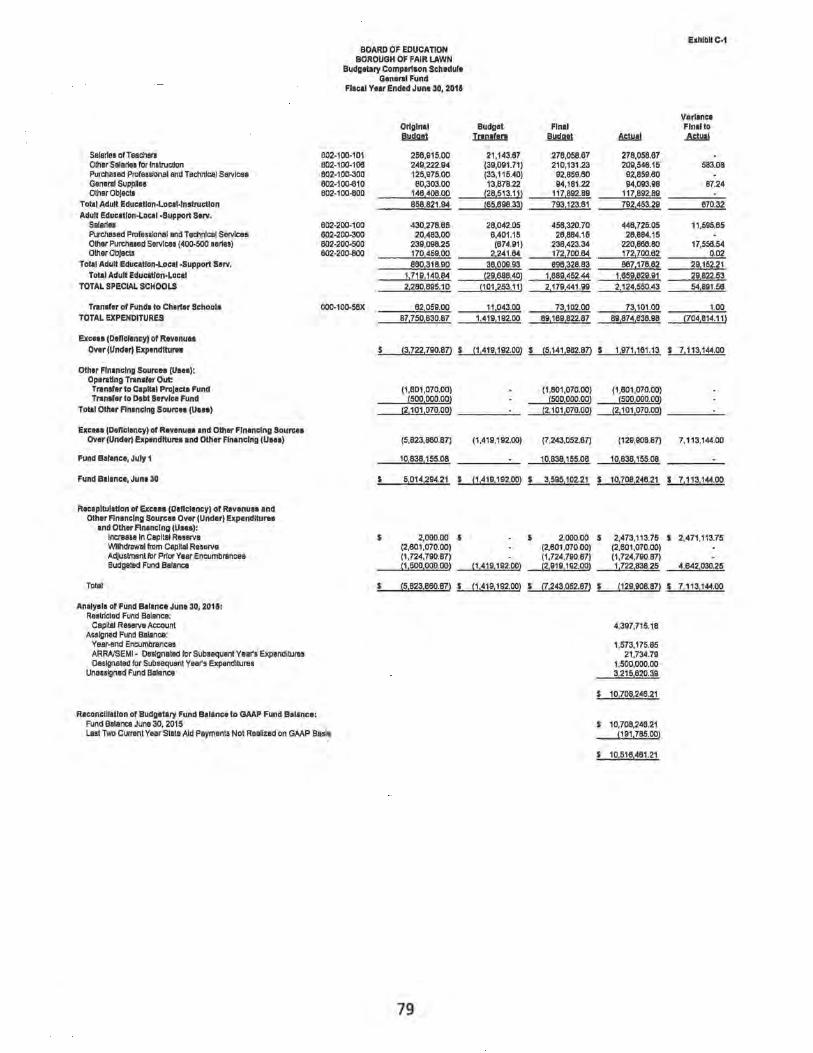
Sala~es ofTaachers Olher Sala~s for Instruction Purchasee! Professional ane! Technical Services General Supplies Olher ObjeclJ
Total Adult EducaUon-Local-lnstructlon Adult Education-Local -Support Serv,
Sala~es Purchased Professional ane! Technical Services Olher Purchased Services (400-500 se~as) Olher ObjacIJ
Total Adult EducaUon-Local -Support Serv, Total Adult EducaUon-Local
TOTAL SPECIAL SCHOOLS
Tran.fer of Fund. to Ch.rter School. TOTAL EXPENDITURES
Exce.a (Del1clency) of Rev.nue. Over (Undar) Exp.ndlturas
Oth.r FInancing Source. (U .. a): OparaUng Tran.far Out: Tran.far to Clpltal Prejecta Fund Tran.far to Debt Slrvlce Fund
Tot.1 Oth.r Financing Sourca. (U.a.)
ExCH. (Del1clency) of Ravenue. and Other Financing Source. Over (Und'r) Exp.ndlturH and Othar Financing (U.e.)
Fund Balanca, July 1
Fund Bal.nca, Juna 30
RecapltulaUon of Exce .. (Del1clancy) of Revenues and Othar FInancing Sourca. Over (Under) expenditure.
and Other Fln.nclng (Use.):
Total
Incraase In CepllBl Reserve Wlthe!rawal from Capilli Raserve Ae!justmanl for P~orYeer Encumbrances Bue!geled Fune! Balance
Analysis of Fund Balance June 30, 2015: Restrictee! Fune! Balance:
Capital Raserve Acccunt Assignee! Fund Belance:
Yaar-ene! Encumbrancas ARRAISEMI- DeSignated for Subsequent Yea~s expenditures Designated for Subsequent Yea~s expenditures
Unasslgnee! Fune! Balance
Reconciliation of Budgetary Fund Balanca to GAAP Fund Balance: Fune! Balance June 30, 2015
BOARD OF EDUCATION BOROUGH OF FAIR LAWN
Budgetary Compartaon Schadula General Fund
Flecal Year Ended June 30, 2011
Ortglnsl B!!.!!lI!l
602-100-101 256,915.00 602-100-106 249,222.94 602-100-300 125,975.00 602-100-610 60,303.00 602-100-800 146,406.00
658,621.94
602-2()()"100 430,278.65 602-200-300 20,483.00 602-200-500 239,098.25 602-200-800 170,459.00
660,318.90 1,719,140.64 2,260,695.10
000-100-56X 62,059.00 87,750,630.87
S !3,722,790.67)
(1,601,070.00) !500,OOO.00)
!2,101,070.00)
(5,623,660.67)
10,636,155.08
S 5,014,294.21
2,000.00 S (2,601,070.00) (1,724,790.87) !1,500,OOO.00)
S !5,B23,660.67)
Last Two Current Year State Aid PaymenlJ Not Reallzee! on GAAP Basis
79
ExhlbltC-1
Vartance Budget Final Final to
Ir!Il!fm ~ Actual .&!!!II
21,143.67 276,056.67 278,056.67 (39,091.71) 210,131.23 209,548.15 563.08 (33,115.40) 92,859.60 92,659.60 13,876.22 94,181.22 94,093.98 67.24
!28,513.11) 117,892.69 117,892.69 !65,696.33) 793,123.61 792,453.29 670.32
26,042.05 458,320.70 446,725.05 11,595.65 6,401.15 26,884.15 26,684.15 (674.91) 238,423.34 220,668.60 17,556.54
2,241.84 172,700.84 172,700.62 Q.02 36,009.93 696,328.63 667,176.62 29,152.21
!29,686.40) 1,689,452.44 1,659,629.91 29,622.53 !101,253.11) 2,179,441.99 2,124,550.43 54,691.56
11,043.00 73,102.00 73,101.00 1.00 1,419,192.00 89,169,622.87 69,674,636.98 (704,814.11)
!1,419,192.00) s !5,141,982.6n s 1,971,161.13 7,113,144.00
(1,601,070.00) (1,601,070.00) !500,000.00) !500,OOO.00)
!2,101,070.00) !2,101,070.oo)
(1,419,192.00) (7,243,052.67) (129,906.87) 7,113,144.00
10,638,155.08 10,838,155.06
!1,419,192.00) S 3,595,102.21 S 10,708,246.21 S 7,113,144.00
S 2,000.00 S 2,473,113.75 2,471,113.75 (2,601,070.00) (2,601,070.00) (1,724,790,87) (1,724,790.67)
!1,419,192.00) !2,919,192.00) 1,722,838.25 4,642,030.25
!1,419,192.oo) S 17,243,052.87) S m9,908.87) S 7,113,144.00
4,397,715.16
1,573,175.85 21,734.79
1,500,000.00 3,215,620.39
S 10,706,246.21
S 10,708,246.21 !191 ,765.00)
10,516,461.21
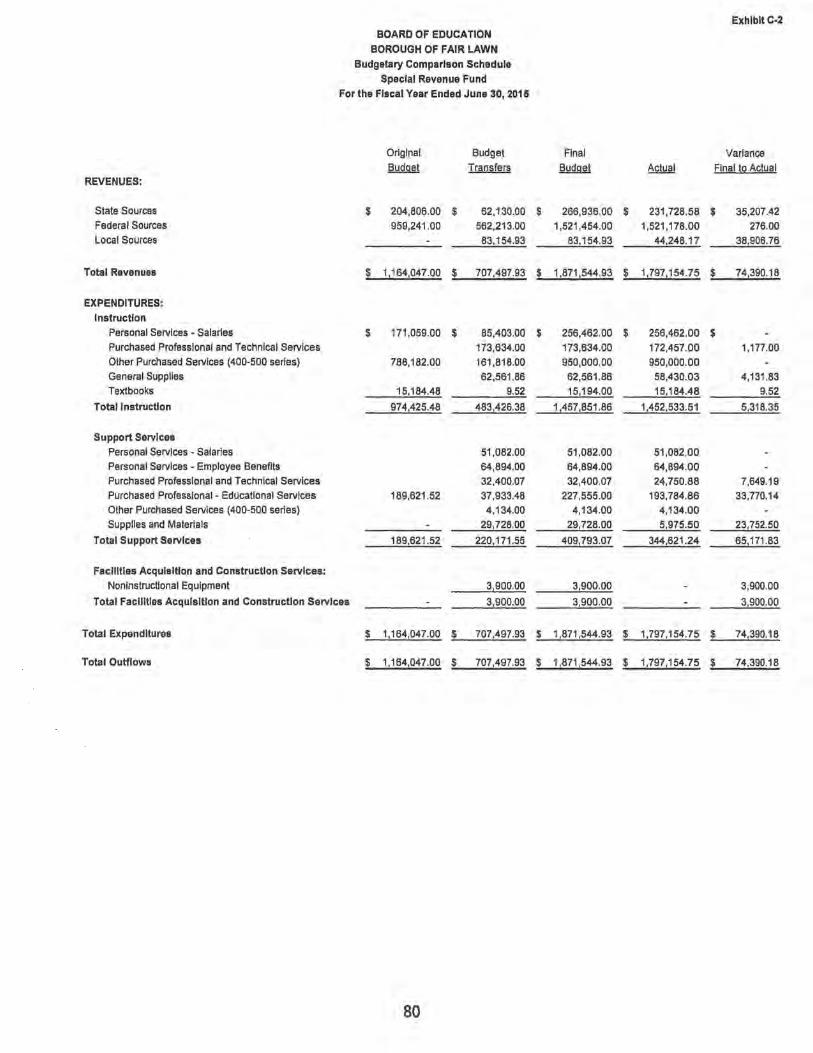
BOARD OF EDUCATION
BOROUGH OF FAIR LAWN
Budgetary Comparison Schedule
Special Revenue Fund
For the Fiscal Year Ended June 30, 2015
Original Budget
Budget Transf~r§
REVENUES:
State Sources $ 204,806.00 $ 62,130.00 Federal Sources 959,241.00 562,213.00 Local Sources 83,154.93
Total Revenues $ 1,164,047.00 $ 707,497.93
EXPENDITURES:
Instruction
Personal Services· Salaries $ 171,059.00 $ 85,403.00 Purchased Professional and Technical Services 173,634.00
Other Purchased Services (400·500 series) 788,182.00 161,818.00 General Supplies 62,561.86 Textbooks 15,184.48 9.52
Total Instruction 974,425.48 483,426.38
Support Services
Personal Services· Salaries 51,082.00 Personal Services - Employee Benefits 64,894.00 Purchased Professional and Technical Services 32,400.07 Purchased Professional· Educational Services 189,621.52 37,933.48 Other Purchased Services (400·500 series) 4,134.00
Supplies and Materials 29,728.00
Total Support Services 189,621.52 220,171.55
Facilities Acquisition and Construction Services:
Noninstructlonal Equipment 3,900.00
Total Facilities Acquisition and Construction Services 3,900.00
Total Expenditures $ 1,164,047.00 $ 707,497.93
Total Outflows $ 1,164,047.00 $ 707,497.93
80
ExhlbltC·2
Final Variance
Budget Actual Final to Act!,!al
$ 266,936.00 $ 231,728.58 $ 35,207.42
1,521,454.00 1,521,178.00 276.00
83,154.93 44,248.17 38,906.76
$ 1,871,544.93 $ 1,797,154.75 $ 74,390.18
$ 256,462.00 $ 256,462.00 $ 173,634.00 172,457.00 1,177.00
950,000.00 950,000.00
62,561.86 58,430.03 4,131.83
15,194.00 15,184.48 9.52
1,457,851.86 1,452,533.51 5,318.35
51,082.00 51,082.00
64,894.00 64,894.00
32,400.07 24,750.88 7,649.19
227,555.00 193,784.86 33,770.14 4,134.00 4,134.00
29,728.00 5,975.50 23,752.50
409,793.07 344,621.24 65,171.83
3,900.00 3,900.00
3,900.00 3,900.00
$ 1,871,544.93 $ 1,797,154.75 $ 74,390.18
$ 1,871,544.93 $ 1,797,154.75 $ 74,390.18

NOTES TO REQUIRED SUPPLEMENTARY INFORMATION -
PART II
81

BOARD OF EDUCATION BOROUGH OF FAIR LAWN
Required Supplementary Information Budgetary Comparison Schedule
Note to RSI For the Fiscal Year Ended June 3D, 2015
Note A - Explanation of Differences between Budgetary Inflows and Outflows and GAAP Revenues and Expenditures
Exhibit Sourceslinflows of resources Actual amounts (budgetary basis) "revenue"
from the budgetary comparison schedule [C-1&C-2J Difference - budget to GAAP:
The last State aid payment is recognized as revenue for budgetary purposes, and differs from GAAP which does not recognize this revenue until the subsequent year when the State recognizes the related expense in accordance with GASS 33.
Grant accounting budgetary basis differs from GAAP in that encumbrances are recognized as expenditures, and the related revenue is recognized.
Total revenues as reported on the statement of revenues, expenditures and c~anges in fund balances - governmental funds. [B-2J
Uses/outflows of resources Actual amounts (budgetary basis) "total outflows" from the
budgetary comparison schedule [C-1&C-2J Differences - budget to GAAP
Encumbrances for supplies and equipment ordered but not received are reported in the year the order is placed for budgetary purposes, but in the year the supplies are received for financial reporting purposes.
Transfers to and from other funds are presented as outflows of budgetary resources but are not expenditures for financial reporting purposes.
Net transfers (outflows) to general fund
Total expenditures as reported on the statement of revenues, expenditures, and changes in fund balances - governmental funds [B-2)
82
Exhibit C-3
Special General Revenue
Fund Fund
$ 91,845,798.11 $ 1,797,154.75
27,455.00
$ 91,873,253.11 $ 1,797,154.75
$ 89,874,636.98 $ 1,797,154.75
$ 89,874,636.98 $ 1,797,154.75

REQUIRED SUPPLEMENTARY INFORMATION -PART III
83

Section L
SCHEDULES RELATED TO ACCOUNTING AND REPORTING FOR PENSIONS (GASB 68)
84

BOARD OF EDUCATION BOROUGH OF FAIR LAWN
Schedule of the District's Proportionate Share of the Net Pension Llabillty- PERS
Exhibit L-1
Fiscal Year Ending June 30. 2014 2015
District's proportion of the net pension liability
District's proportionate share of the net pension liability
District's covered employee payroll
District's proportionate share of the net pension liability as a percentage of its covered employee payroll
Plan fiduciary net position as a percentage of the total pension liability
$
$
0.1522045239%
29,089,309.00 $
7,754,894.00 $
375.11%
48.72%
Note: This schedule does not contain ten years of Information as GASe No. 68 was implemented during fiscal year ended June 30, 2015.
85
0.1551818755%
29,054,291.00
9,719,098.00
298.94%
52.08%

Contractually required contribution
BOARD OF EDUCATION BOROUGH OF FAIR LAWN
Schedule of District Contributions- PERS
$
Contributions In relation to the contractually required contribution
Contribution deflciency/(excess) $
District's covered employee payroll $
Contributions as a percentage of covered employee payroll
Exhibit L-2
Fiscal Year Ending June 30, 2014 2015
1,167,786.02 $ 1,279,297.00
(1,167,786.02) (1.279.297.00\
$
7,754,894.00 $ 9,719,098.00
15.06% 13.16%
Note: This schedule does not contain ten years of Information as GASB No. 68 was implemented during fiscal year ended June 30, 2015.
86

BOARD OF EDUCATION BOROUGH OF FAIR LAWN
Schedule of the District's Proportionate Share of the Net Pension Liability- TPAF
Exhibit L·3
Fiscal Year Ending June 30, 2014 2015
District's proportion of the State's net pension liability
District's proportionate share of the State's net pension liability
District's covered employee payroll
District's proportionate share of the net pension liability as a percentage of its covered employee payroll
Plan fiduciary net position as a percentage of the total pension liability
$
$
0.3533917251 %
17B,601,39B.38 $
37,910,489.00 $
471.11%
33.76%
Note: This schedule does not contain ten years of information as GASB No. 68 was implemented during fiscal year ended June 30, 2015.
87
0.3699274843%
197,714,200.58
38,887,483.00
50B.43%
33.64%

NOTES TO REQUIRED SUPPLEMENTARY INFORMATION -
PART III
88

BOARD OF EDUCATION BOROUGH OF FAIR LAWN
NOTES TO REQUIRED SUPPLEMENTARY INFORMATION YEAR ENDED JUNE 30. 2015
PUBLIC EMPLOYEES' RETIREMENT SYSTEM
A. Benefit Changes
There were none.
B. Changes of Assumptions
The discount rate changed from 5.55% as of June 30,2013 to 5.39% as of June 30, 2014 in accordance with Paragraph 44 of GASB Statement No. 67.
TEACHERS' PENSION AND ANNUITY FUND
A. Benefit Changes
There were none.
B. Changes of Assumptions
The discount rate changed from 4.95% as of June 30, 2013 to 4.68% as of June 30 , 2014 in accordance with Paragraph 44 of GASB Statement No. 67.
89

OTHER SUPPLEMENTARY INFORMATION
90

Section D
SCHOOL LEVEL SCHEDULES
91

Section E
SPECIAL REVENUE FUND
92

BOARD OF EDUCATION
BOROUGH OF FAIR LAWN
Special Revenue Fund
Combining Schedule of Program Revenues and Expenditures - Budgetary Basis
For the Fiscal Year Ended June 3D, 2015
State
Total A!!t REVENUES
State Sources $ 231,728.58 $ 231,728.58 $ Federal Sources 1,521,178.00
Local Sources 44,248.17
Total Revenues $ 1,797,154.75 $ 231,728.58 $
EXPENDITURES:
Instruction:
Personal Services - Salaries 100-100 $ 256,462.00 $ $ Purchased Professional and Technical Services 100-300 172,457.00
Other Purchased Services (400-500 series) 100-500 950,000.00
General Supplies 100-610 58,430.03
Textbooks 100·640 15,184.48 15,184.48
Total Instruction 1,452,533.51 15,184.48
Support Services:
Personal Services - Salaries 200-100 51,082.00
Personal Services - Employee Benefits 200-200 64,894.00
Purchased Professional and Technical Services 200-300 24,750.88 23,754.24
Purchased Professional - Educational Services 200-320 193,784.88 192,789.86
Other Purchased Services (400·500 series) 200-500 4,134.00
Supplies and Materials 200-600 5,975.50
Total Support Services 344,621 .24 216,544.10
Total Expenditures $ 1,797,154.75 $ 231,728.58 $
93
Exhibit E-1
Federal Local
Aid Aid
$ 1,521,178.00
44,248.17
1,521,178.00 $ 44,248.17
256,462.00 $ 172,457.00
950,000.00
21,154.00 37,276.03
1 ,400,073.00 37,276.03
51,082.00
64,894.00
996.64
995.00
4,134.00
5,975.50
121,105.00 6,972.14
1,521,178.00 $ 44,248.17

\.0 ~
BOARD OF EDUCATION
BOROUGH OF FAIR LAWN
Special Revenue Fund
Combining Schedule of State Program Revenues and Expenditures - Budgetary Basis For the Fiscal Year Ended June 30, 2015
N.J. N.J. N.J.
Nonpublic Nonpublic Nonpublic Textbook Auxiliary Handicapped
I!!t!! Ai!! Services Services
REVENUES State Sources $ 231 .728.58 $ 15.184.48 $ 108.857.40 $ 75.772.48
Total State Revenues $ 231.728.58 $ 15,184.48 $ 108,857.40 $ 75,772.48
EXPENDITURES:
Instruction: Textbooks 100-640 $ 15,184.48 $ 15,184.48 $ $
Total Instruction 15,184.48 15,184.48
Support Services: Purchased Professional and Technical Services 200-300 23,754.24
Purchased Professional - Educational Services 200-320 192,789.86 108,857.40 75,772.48
Total Support Services 216,544.10 108,857.40 75,772.48
Total Expenditures $ 231,728.58 $ 15.184.48 $ 108.857.40 $ 75.772.48
exhibit E-1a
N.J. N.J. Nonpublic Nonpublic
Nursing Technology Services Initiative
$ 23.754.24 ~159.98
$ 23,754.24 L..!!.: 159.98
$ $
23,754.24
8,159.98
23,754.24 8,159.98
$ 23.754.24 $ 8.159.98

1.0 U1
BOARD OF EDUCATION
BOROUGH OF FAIR LAWN
Special Revenue Fund
Combining Schedule of Federal Program Revenues and Expenditures - Budgetary Basis
For the Fiscal Year Ended June 3D, 2015
E.S.E.A.
Total Title I Title II Title III
REVENUES Federal Sources $ 1,521 ,178.00 $ 268,197.00 $ 85,Q11 .00 $ 40,412.00
Total Federal Revenues L..,1521 ,178.00 $ 268,197.00 $ 85,011.00 $ 40,412.00
EXPENDITURES:
Instruction:
Personal Services - Salaries 100-100 $ 256,462.00 $ 194,674.00 $ 52,995.00 $ 8,793.00
Purchased Professional and Technical Services 100-300 172,457.00
Other Purchased Services (400-500 series) 100-500 950,000.00
General Supplies 100-610 21,154.00 10,146.00 5,907.00
Total Instruction 1,400,073.00 204,820.00 52,995.00 14,700.00
Support Services: Personal Services - Salaries 200-100 51,082.00 17,144.00 16,017.00 17,921.00 Personal Services - Employee Benefits 200-200 64,894.00 46,233.00 15,004.00 3,657.00
Purchased Professional - Educational Services 200-320 995.00 995.00 Other Purchased Services (400-500 series) 200-500 4,134.00 4,134.00
Total Support Services 121,105.00 63,377.00 32,016.00 25,712.00
Total Expenditures $ 1,521,178.00 $ 268,197.00 $ 85,011.00 $ 40,412.00
Exhibit E-1b
I.D.E.A. Part B
Basic Preschool
$ 1,093,648.00 $ 33,910.00
$ 1,093,648.00 $ 33,910.00
$ $ 138,547.00 33,910.00
950,000.00 5,101.00
__ 1,093,648.00 33,910.00
$ 1,093,648.00 $ 33,910.00

'-0 0"1
REVENUES
Local Sources
Total Local Revenues
EXPENDITURES: Instruction:
General Supplies
Total Instruction
Support Services:
BOARD OF EDUCATION
BOROUGH OF FAIR LAWN
Special Revenue Fund
Combining Schedule of Local Program Revenues and Expenditures - Budgetary Basis
For the Fiscal Year Ended June 30,2015
PTO/PTA Environmental NJSBAIG
Total Donations Grants Safety Grant
$ 44,248.17 $ 34,830.94 $ 638.71 $ 5,975.50
$ 44,248.17 $ 34,830.94 $ 638.71 $ 5,975.50
100-610 $ 37,276.03 $ 34,830.94 $ 638.71 $
37,276.03 34,830.94 638.71
Purchased Professional and Technical Services 200-300 996.64 Supplies & Materials 200-600 5,975.50 5,975.50
Total Support Services 6,972.14 5,975.50
Total Expenditures $ 44,248.17 $ 34,830.94 $ 638.71 $ 5,975.50
Exhibit E-1c
Miscellaneous
$ 2,803.02
$ 2,803.02
$ 1,806.38
1,806.38
996.64
996.64
$ 2,803.02
Section F
CAPITAL PROJECTS FUND
97

BOARD OF EDUCATION BOROUGH OF FAIR LAWN
Capital Projects Fund Summary Schedule of Project Expenditures
For the Year Ended June 30, 2015
Revised GAAP Exeendltures to Date Approval GAAP
Project TItle/Issue Qm A~~roerll!tI2DI ~rl2rY!!I!!! !;;u!!!nl Y!i!lr
Additions/Renovations - Westmoreland Elementary School 1219/14 7,387,480.00 518,019.95 Roof Replacement- High School 1219/14 2,003,520.00 9,411.14 Roof Replacement- Thomas Jefferson Middle School 1219/14 925,200.00 286,308.70 Roof Replacement- John A. Forrest Elementary School 1219/14 514,100.00 2,552.22 Roof Replacement- Lyncrest Elementary School 1219/14 678,277.00 3,400.96 Roof Replacement- Warren Point Elementary School 1219/14 616,800.00 31,546.96 Roof Replacement- Westmoreland Elementary School 1219/14 744,637.00 35,557.98 Window Replacement - High School 9/3/14 581,000.00 34,480.00 Window Replacement - Memorial Middle School 9/3/14 874,150.00 48,620.00 Window Replacement - Radburn Elementary School 215/15 50,200.00 3,300.00 Window Replacement - Edison School 215/15 812,650.00 44,160.00 Window Replacement - Warren Point Elementary School 9/3/14 350,450.00 28,174.00
Totals $ 15,538,464.00 $ $ 1,045,531.89
98
Exhibit F-1
Unexpended Appropriations
QiQQl1§
6,869,460.05 1,994,108.88
636,891 .30 511,547.78 674,876.04 585,253.04 709,079.04 546,520.00 825,530.00
46,900.00 766,490.00 322,276.00
$ 14,492,932.11
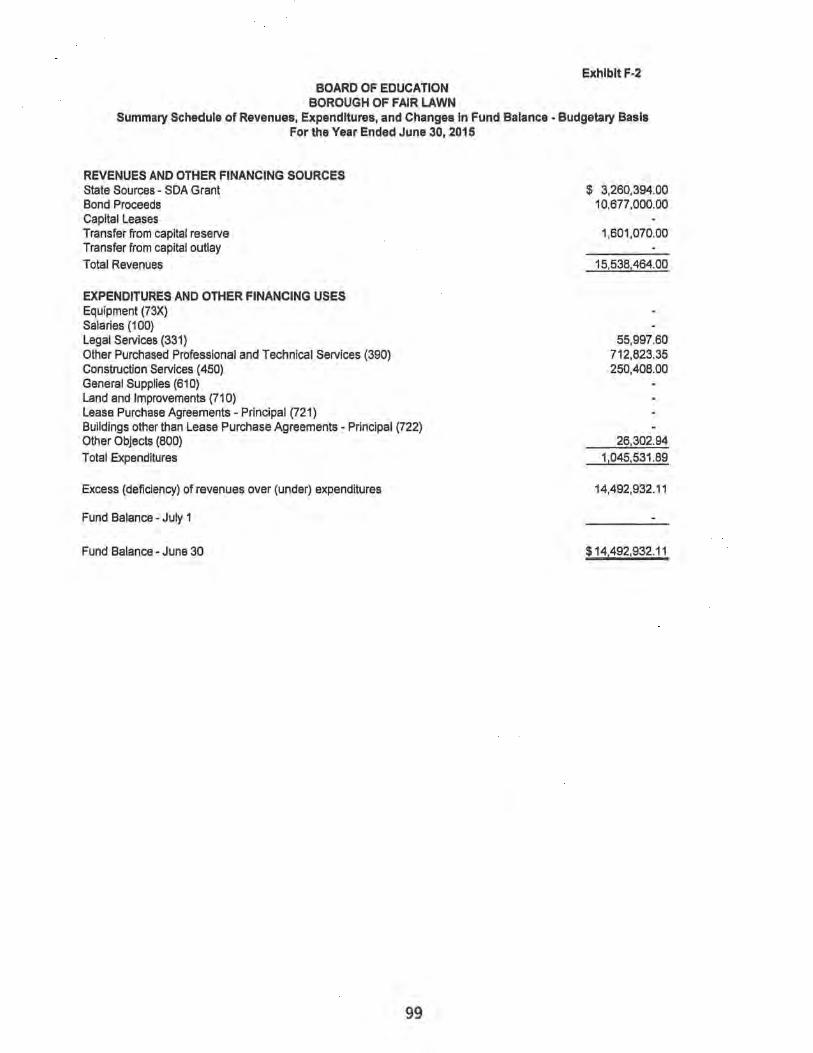
BOARD OF EDUCATION BOROUGH OF FAIR LAWN
Exhibit F-2
Summary Schedule of Revenues, Expenditures, and Changes In Fund Balance - Budgetary Basis For the Year Ended June 30, 2015
REVENUES AND OTHER FINANCING SOURCES State Sources - SDA Grant Bond Proceeds Capital Leases Transfer from capital reserve Transfer from capital outlay Total Revenues
EXPENDITURES AND OTHER FINANCING USES Equipment (73X) Salaries (100) Legal Services (331) Other Purchased Professional and Technical Services (390) Construction Services (450) General Supplies (610) Land and Improvements (710) Lease Purchase Agreements - Principal (721) Buildings other than Lease Purchase Agreements - Principal (722) Other Objects (600) Total Expenditures
Excess (deficiency) of revenues over (under) expenditures
Fund Balance - July 1
Fund Balance - June 30
99
$ 3,260,394.00 10,677,000.00
1,601,070.00
15,536,464.00
55,997.60 712,623.35 250,406.00
26,302.94 1,045,531.69
14,492,932.11
$14,492,932.11

Exhibit F·2a BOARD OF EDUCATION
BOROUGH OF FAIR LAWN Schedule of Project Revenues, Expenditures, Project Balance and Project StatuI· Budgetary Basis
Additions/Renovations· Westmoreland Elementary School From Inception and for the Year Ended June 3D, 2015
Prior Period. Current Year Totals
REVENUES AND OTHER FINANCING SOURCES State Sources· SDA Grant $ $ Bond Proceeds 7,387,480.00 7,387,480.00 Capital Leases Transfer from capital reserve Transfer from capital outlay Total Revenues 7 ,387 ,480.00 7,387,480.00
EXPENDITURES AND OTHER FINANCING USES Equipment (73X) Salaries (100) Legal Services (331) 55,842.60 55,842.60 Other Purchased Professional and Technical Services (390) 462,177.35 462,177.35 Construction Services (450) General Supplies (610) Land and Improvements (710) Lease Purchase Agreements· Principal (721) Buildings other than Lease Purchase Agreements· Principal (722) Other Objects (800) Total Expenditures 518,019.95 518,019.95
Excess (deficiency) of revenues over (under) expenditures 6,869,460.05 6 ,869,460.05
ADDITIONAL PROJECT INFORMATION Project Number NIA Grant Date NIA Bond AuthorlzaUon Date 1219/14 Bonds Au1horlzed $ 7,388,466.00 Bonds Issued $ 7,387,480.00 Original Authorized Cost $ 7,388,466.00 Additional Authorized Cost $ Revised Authorized Cost $ 7,388,468.00
Percentage Increase over Original Authorized Cost 0.00% Percentage Completed 7.01% Original Target CompleUon Date 11/16/18 Revised Target Completion Dale 11/16/16
100
Revised Authorized
Co.t
$ 7,388,466.00
7,388,466.00
125,000.00 886,772.00
5,796,994.00
579?00.00 7,388,466.00

Exhibit F-2b BOARD OF EDUCATION
BOROUGH OF FAIR LAWN Schedule of Project Revenues, Expenditures, Project Balance and Project Status· Budgetary Basis
Roof Replacement· High School From Inception and for the Year Ended June 3D, 2015
REVENUES AND OTHER FINANCING SOURCES State Sources - SDA Grant Bond Proceeds Capital Leases Transfer from capital reserve Transfer from capital outlay Total Revenues
EXPENDITURES AND OTHER FINANCING USES Equipment (73X) Salaries (100) LegaISennces(331) Other Purchased Professional and Technical Services (390) Constructlon Services (450) General Supplies (610) Land and Improvements (710) Lease Purchase Agreements· Principal (721) Buildings other than Lease Purchase Agreements - Principal (722) Other Objects (800) Total Expenditures
Excess (deficiency) of revenues over (under) expenditures
ADDITIONAL PROJECT INFORMATION Project Number Grant Date Bond Authorization Date Bonds Authorized Bonds Issued Original Authorized Cost Additional Authorized Cost Revised Authorized Cost
Percentage Increase over Original Authorized Cost Percentage Completed Original Target Completion Date Revised Target Completion Date
Prior Period.
$ $
SP1450-050-14-G1DQ 4/14/15 1219114
$ 1,202,112.00 $ 1,202,112.00 $ 2,003,520.00 $ $ 2,003,520.00
0.00% 0.47%
9/9/16 9/9/16
101
Current Year
801,408.00 1,202,112.00
2,003,520.00
55.00
9,356.14 9,411.14
1,994,108.66
Totals
$ 801,408.00 1,202,112.00
2,003,520.00
55.00
9,356.14 9,411.14
1,994,108.86
$
Revised Authorized
COlt
801,408.00 1,202,112.00
2,003,520.00
113,500.00 1,718,200.00
171,820.00 2,003,520.00

Exhibit F-2c BOARD OF EDUCATION
BOROUGH OF FAIR LAWN Schedule of Project Revenues, Expenditures, Project Balance and Project Status - Budgetary Balli
Roof Replacement - Thomal Jefferson Middle School From Inception and for the Year Ended June 30,2015
REVENUES AND OTHER FINANCING SOURCES State Sources - SDA Grant Bond Proceeds Capital Leases Transfer from capital reserve Transfer from capital outlay Total Revenues
EXPENDITURES AND OTHER FINANCING USES Equipment (73X) Salaries (100) Legal Services (331) Other Purchased Professional and Technical Services (390) Construction Services (450) General Supplies (610) Land and Improvements (710) Lease Purchase Agreements - Principal (721) Buildings other than Lease Purchase Agreements - Principal (722) Other Objects (800) Total expenditures
Excess (deficiency) of revenues over (under) expenditures
ADDITIONAL PROJECT INFORMATION Project Number Grant Date Bond Authorization Date Bonds Authorized Bonds Issued Original Authorized Cost Additional Authorized Cost Revised Authorized Cost
Percentage Increase over Original Authorized Cost Percentage Completed Original Target Completion Date Revised Target Completion Date
Prior Periods
$
SP1450-060-14-G1DS 4/14/15 12/9/14
$ 555,120.00 $ 555,120.00 $ 925,200.00 $ $ 925,200.00
0.00% 30.95%
9/16/15 9/16/15
102
Current Year
370,080.00 555,120.00
925,200.00
25.00 38,500.00
243,530.00
4,253.70 286,308.70
638,891 .30
$
Totall
370,080.00 555,120.00
925,200.00
25.00 38,500.00
243,530.00
4,253.70 286,308.70
638,891.30
$
Reviled Authorized ~
370,080.00 555,120.00
925,200.00
54,000.00 792,000.00
79,200.00 925,200.00

BOARD OF EDUCATION BOROUGH OF FAIR LAWN
Schedule of Project Revenues, Expenditures, Project Balance and Project Status· Budgetary Basis Roof Replacement· John A. Forrest Elementary School
From Inception and for the Year Ended June 30, 2015
REVENUES AND OTHER FINANCING SOURCES Slate Sources· SDA Grant Bond Proceeds Capital Leases Transfer from capital reserve Transfer from capilal outlay Tolal Revenues
EXPENDITURES AND OTHER FINANCING USES Equipment (73X) Salaries (100) Legal Services (331) Other Purchased Professional and Technical Services (390) Construction Services (450) General Supplies (610) Land and Improvements (710) Lease Purchase Agreements· Principal (721) Buildings other than Lease Purchase Agreements· Principal (722) Other Objects (800) Tolal Expenditures
Excess (deficiency) of revenues over (under) expenditures
ADDITIONAL PROJECT INFORMATION Project Number Grant Date Bond Authorization Date Bonds Authorized Bonds Issued Originai Authorized Cost Additional Authorized Cost Revised Authorized Cost
Percentage Increase over Original Authorized Cost Percentage Completed Original Target Completion Date Revised Target Completion Date
Prior Periods
SP1450-085·14·G1 DU 4/14/15 1219114
$ 308,460.00 $ 308,460.00 $ 514,100.00 $ $ 514,100.00
0.00% 0.50%
9/9/16 9/9/16
103
Current year
$ 205,640.00 308,460.00
514,100.00
15.00
2,537.22 2,552.22
511,547.78
!21!!1
$ 205,640.00 308,460.00
514,100.00
15.00
2,537.22 2,552.22
511,547.78
Exhibit F·2d
$
Revised Authorized ~
205,640.00 308,460.00
514,100.00
30,100.00 440,000.00
44,000.00 514,100.00

Exhibit F·2e BOARD OF EDUCATION
BOROUGH OF FAIR LAWN Schedule of Project Revenues, Expenditures, Project Balance and Project Status· Budgetary Basis
Roof Replacement· Lyncrest Elementary School From Inception and for the Yaar Ended June 30, 2016
REVENUES AND OTHER FINANCING SOURCES State Sources - SDA Grant Bond Proceeds Capital Leases Transfer from capital reserve Transfer from capital outlay Total Revenues
EXPENDITURES AND OTHER FINANCING USES Equipment (73X) Salaries (100) Legal Services (331) Other Purchased Professional and Technical Services (390) Construction Services (450) General Supplies (610) Land and Improvements (710) Lease Purchase Agreements - Principal (721) Buildings other than Lease Purchase Agreements - Principal (722) Other Objects (800) Total Expenditures
Excess (deficiency) of revenues over (under) expenditures
ADDITIONAL PROJECT INFORMATION Project Number Grant Date Bond Authorization Date Bonds Authorized Bonds Issued Original Authorized Cost Additional Authorized Cost Revised Authorized Cost
Percentage Increase over Original Authorized Cost Percentage Completed Original Target Completion Date Revised Target Completion Date
Prior Periods
$
SP1450-100-14-G1OV 4/14/15 12/9/14
$ 406,966.00 $ 406,966.00 $ 678,277.00 $ $ 678,277.00
0.00% 0.50%
9/9/16 9/9116
104
Current Year
271,311.00 406,966.00
678,277.00
20.00
3,380.96 3,400.96
674,876.04
~
$ 271,311.00 $ 406,966.00
678,277.00
20.00
3,380.96 3,400.96
674,876.04
Revised Authorized
£m
271,311.00 406,966.00
678,277.00
39,300.00 580,888.00
58,089.00 678,277.00

Exhibit F·2f BOARD OF EDUCATION
BOROUGH OF FAIR LAWN Schedule of Project Revenues, Expenditures, Project Balance and Project Status· Budgetary Basis
Roof Replacement· Warren Point Elementary School From Inception and for the Year Ended June 30,2015
Prior Periods Current Year
Revised Authorized
Cost
REVENUES AND OTHER FINANCING SOURCES State Sources· SDA Grant Bond Proceeds
$ 246,720.00 $ 246,720.00 $ 246,720.00 370,080.00 370,080.00 I 370,080.00
Capital Leases Transfer from capital reserve Transfer from capital outlay Total Revenues
EXPENDITURES AND OTHER FINANCING USES Equipment (73X) Salaries (100) Legal Services (331) Other Purchased Professional and Technical Services (390) Construction Services (450) General Supplies (610) Land and Improvements (710) Lease Purchase Agreements· Principal (721) Buildings other than Lease Purchase Agreements · Principal (722) Other Objects (800) Total Expenditures
Excess (deficiency) of revenues over (under) expenditures
ADDITIONAL PROJECT INFORMATION Project Number Grant Date Bond Authorization Date Bonds Authorized Bonds Issued Original Authorized Cost Additional Authorized Cost Revised Authorized Cost
Percentage Increase over Original Authorized Cost Percentage Completed Original Target Completion Date Revised Target Completion Date
SP1450·140-14-G1DY 4114/15 1219/14
$ 370,080.00 $ 370,080.00 $ 616,800.00 $ $ 616,800.00
0.00% 5.11%
9/16/15 9116115
105
616,800.00
20.00 28,160.00
3,366.96 31,546.96
565,253.04
616,800.00
20.00 28,160.00
3,366.96 31 ,546.96
585,253.04
616,800.00
36,000.00 528,000.00
52,800.00 616,800.00

Exhibit F-2g BOARD OF EDUCATION
BOROUGH OF FAIR LAWN Schedule of Project Revenues, Expendltur8l, Project Balance and Project Statua - Budgetary Basla
Roof Replacement - Westmoreland Elementary School From Inception and for the Year Ended June 30, 2015
REVENUES AND OTHER FINANCING SOURCES State Sources - SDA Grant Bond Proceeds Capital Leases Transfer from capital reserve Transfer from capital outlay Total Revenues
EXPENDITURES AND OTHER FINANCING USES Equipment (73X) Salariea (100) Legal Services (331) Other Purchased Professional and Technical Services (390) Construction Services (450) General Supplies (610) Land and Improvements (710) Lease Purchase Agreements - Principal (721) Buildings other than Lease Purchase Agreements - Principal (722) Other Objects (800) Total expenditures
Excess (deficiency) of revenues over (under) expenditures
ADDITIONAL PROJECT INFORMATION Project Number Grant Date Bond Authorization Date Bonds Authorized Bonds Issued Original Authorized Cost Additional Authorized Cost Revised Authorized Cost
Percentage Increase over Original Authorized Cost Percentage Completed Original Target Completion Date Revised Target Completion Date
Prior Periods
$
SP1450-160-14-G1 EA 4/14115 12/9/14
$ 446,782.00 $ 446,782.00 $ 744,637.00 $ $ 744,637.00
0.00% 4.78%
9/16115 9/16/15
106
Current Year
297,855.00 446,782.00
744,637.00
20.00 32,130.00
3,407.96 35,557.96
709,079.04
$
Totals
297,855.00 446,782.00
744,637.00
20.00 32,130.00
3,407.96 35,557.96
709,079.04
$
Revlaed Authorized ~
297,855.00 446,782.00
744,637.00
43,200.00 637,670.00
63,767.00 744,637.00
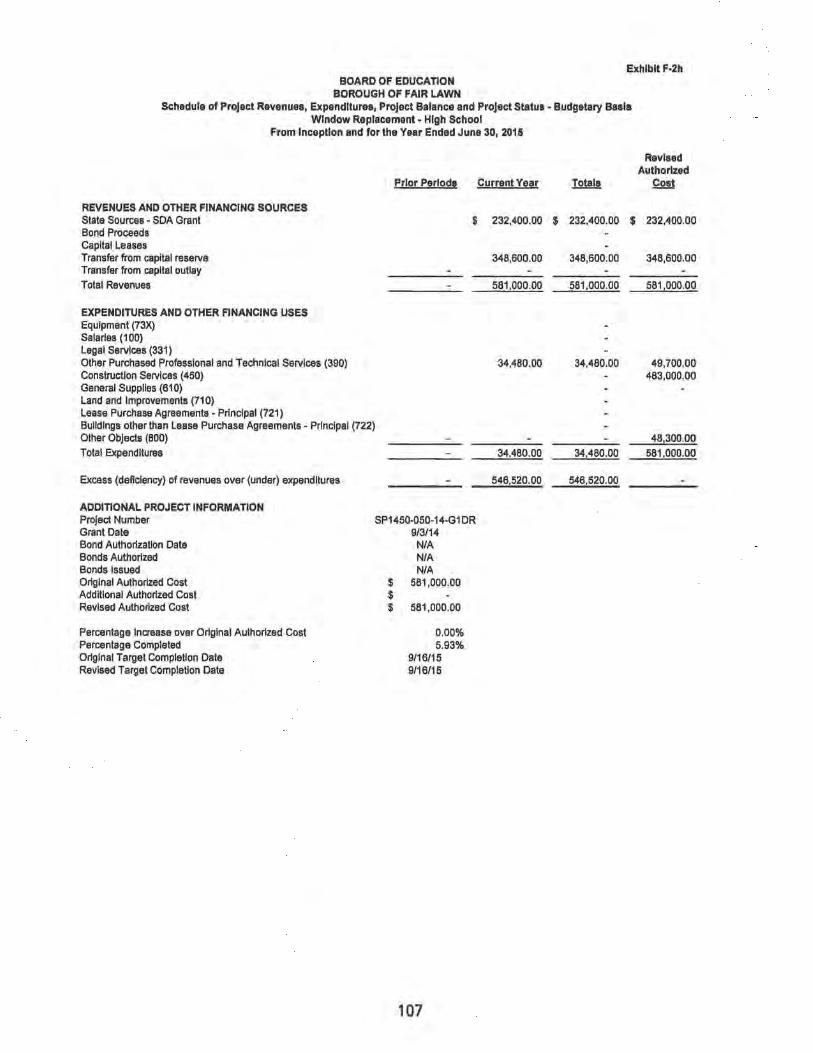
Exhibit F·2h BOARD OF EDUCATION
BOROUGH OF FAIR LAWN Schedule of Project Revenues, Expenditures, Project Balance and Project Status· Budgetary Basis
Window Replacement· High School From Inception and for the Year Ended June 30, 2015
REVENUES AND OTHER FINANCING SOURCES State Sources· SDA Grant Bond Proceeds Capital Leases Transfer from capital reserve Transfer from capital outlay Total Revenues
EXPENDITURES AND OTHER FINANCING USES Equipment (73X) Salaries (100) Legal Services (331) Other Purchased Professional and Technical Services (390) Construction Services (450) General Supplies (610) Land and Improvements (710) Lease Purchase Agreements· Principal (721) Buildings other than Lease Purchase Agreements· Principal (722) Other Objects (800) Total Expenditures
Excess (defiCiency) of revenues over (under) expenditures
ADDITIONAL PROJECT INFORMATION Project Number Grant Date Bond Authorization Date Bonds Authorized Bonds Issued Original Authorized Cost Additional Authorized Cost Revised Authorized Cost
Percentage Increase over Original Authorized Cost Percentage Completed Original Target Completion Date Revised Target Completion Date
Prior Periods
$
SP1450-050·14-G1 DR 9/3/14 NIA NIA NlA
$ 581,000,00 $ $ 581,000,00
0,00% 5,93%
9116/15 9/16/15
107
Current Year
232,400,00
348,600,00
581,000,00
34,480,00
34,480,00
546,520,00
!2m!!
$ 232,400,00 $
348,600,00
581,000,00
34,480,00
34,480,00
546,520,00
Revised Authorized ~
232,400,00
348,600,00
581,000,00
49,700,00 483,000,00
48,300,00 581,000,00

Exhibit F·21 BOARD OF EDUCATION
BOROUGH OF FAIR LAWN Schedule of Project Revenuel, Expenditures, Project Balance and Project StatUI· Budgetary BallI
Window Replacement· Memorial Middle School From Inception and for the Year Ended June 30, 2016
REVENUES AND OTHER FINANCING SOURCES State Sources - SDA Grant Bond Proceeds Capital Leases Transfer from capital reserve Transfer from capital outlay Total Revenues
EXPENDITURES AND OTHER FINANCING USES Equipment (73X) Salaries (100) Legal Services (331) other Purchased Professional and Technical Services (390) Construction Services (450) General Supplies (610) Land and Improvements (710) Lease Purchase Agreements - Principal (721) Buildings other than Lease Purchase Agreements - Principal (722) Other Objects (800) Total Expenditures
Excess (deficiency) of revenues over (under) expenditures
ADDITIONAL PROJECT INFORMATION Project Number Grant Date Bond Authorization Date Bonds Authorized Bonds Issued Original Authorized Cost Additional Authorized Cost Revised Authorized Cost
Percentage Increase over Original Authorized Cost Percentage Completed Original Target Completion Date Revised Target Completion Date
Prior Perlodl
$
SP1450-070-14-G1DT 9/3/14
NIA NlA N/A
$ 874,150.00 $ $ 874,150.00
0.00% 5.56%
9/16/15 9/16/15
108
Current Year
349,660.00
524,490.00
874,150.00
48,620.00
48.620.00
825.530.00
Total.
$ 349,660.00 $
524,490.00
874,150.00
48,620.00
48,620.00
825,530.00
Revised Authorized ~
349,660.00
524,490.00
874.150.00
77,200.00 724,500.00
72,450.00 874,150.00
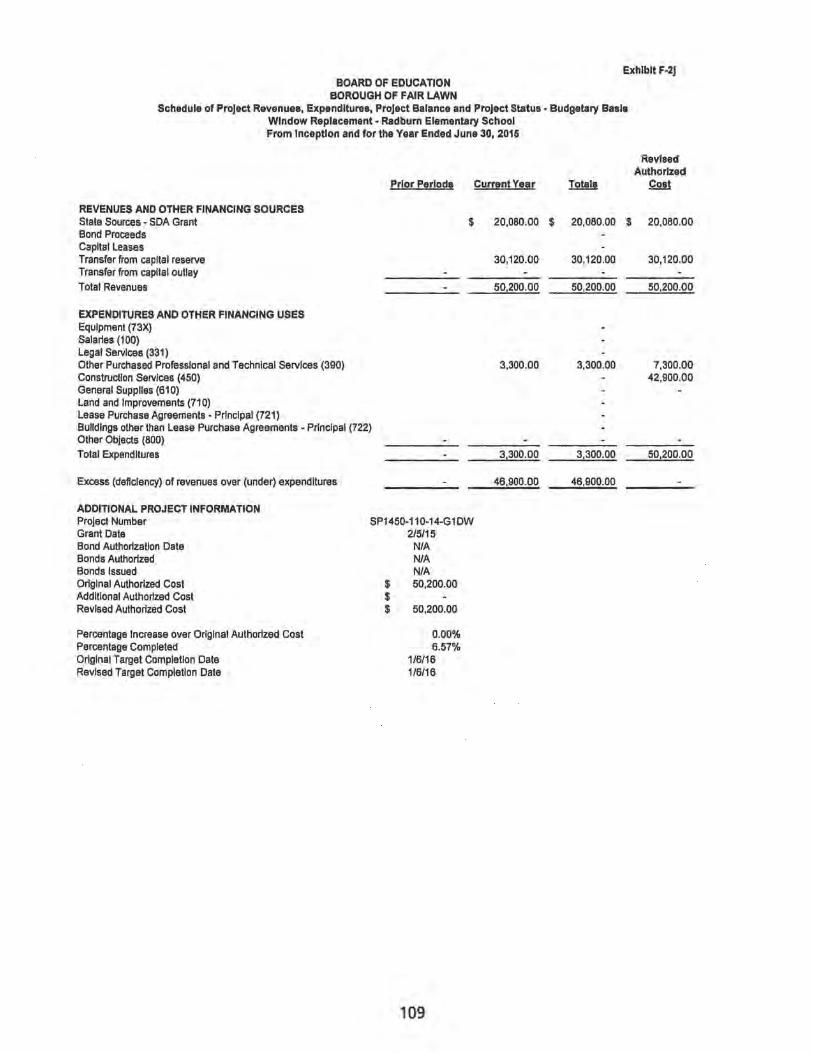
Exhibit F-2J BOARD OF EDUCATION
BOROUGH OF FAIR LAWN Schedule of Project Revenues, Expenditures, Project Balance and Project Status - Budgetary Basis
Window Replacement - Radburn Elementary School From Inception and for the Year Ended June 30, 2015
REVENUES AND OTHER FINANCING SOURCES State Sources - SDA Grant Bond Proceeds Capital Leases Transfer from capital reserve Transfer from capital outlay Total Revenues
EXPENDITURES AND OTHER FINANCING USES Equipment (73X) Salaries (100) Legal Services (331) Other Purchased Professional and Technical Services (390) Construction Services (450) General Supplies (610) Land and Improvements (710) Lease Purchase Agreements· Principal (721) Buildings other than Lease Purchase Agreements - Principal (722) Other Objects (800) Total expenditures
Excess (deficiency) of revenues over (under) expenditures
Prior Periods
$
ADDITIONAL PROJECT INFORMATION Project Number SP1450-110-14·G1DW Grant Date Bond Authorization Date Bonds Authorized Bonds Issued Original Authorized Cost Additional Authorized Cost Revised Authorized Cost
Percentage Increase over Original Authorized Cost Percentage Completed Original Target Completion Date Revised Target Completion Date
2/5/15 NIA N/A NIA
$ 50,200.00 $ $ 50,200.00
0.00% 6.57%
1/6/16 1/6/16
109
Current Year
20,080.00
30,120.00
50,200.00
3,300.00
3,300.00
46,900.00
Totals
$ 20,080.00 $
30,120.00
50,200.00
3,300.00
3,300.00
46,900.00
Revised Authorized
QW
20,080.00
30,120.00
50,200.00
7,300.00 42,900.00
50,200.00

Exhibit F·2k BOARD OF EDUCATION
BOROUGH OF FAIR LAWN Schedule of Project Revenues, expenditure., Project Balance and Project Statue· Budgetary Basle
Window Replacement· Edison School From Inception and for the Year Ended June 30, 2015
REVENUES AND OTHER FINANCING SOURCES State Sources· SDA Grant Bond Proceeds Capital Leases Transfer from capital reserve Transfer from capital outiay Total Revenues
EXPENDITURES AND OTHER FINANCING USES Equipment (73X) Salaries (100) Legal Services (331) Other Purchased Professional and Technical Services (390) Construction Services (450) General Supplies (610) Land and Improvements (710) Lease Purchase Agreements· Principal (721) Buildings other than Lease Purchase Agreements· Principal (722) Other Objects (800) Total Expenditures
Excess (deficiency) of revenues over (under) expenditures
ADDITIONAL PROJECT INFORMATION Project Number Grant Date Bond Authorization Date Bonds Authorized Bonds Issued Original Authorized Cost Additional Authorized Cost Revised Authorized Cost
Percentage Increase over Original Authorized Cost Percentage Completed Original Target Completion Date Revised Target Completion Date
Prior Periods
$
SP1450·130·14·G1 DX 215/15
N/A N/A NIA
$ 812,650.00 $ $ 812,650.00
0.00% 5.43%
1/6116 1/6/18
110
Current Year
325,060.00
487,590.00
812,650.00
44,160.00
44,160.00
768,490.00
Totals
$ 325,060.00 $
487,590.00
812,650.00
44,160.00
44,160.00
768,490.00
Revised Authorized ~
325,060.00
487,590.00
812,650.00
66,300.00 678,500.00
67,650.00 812,650.00

Exhibit F·21 BOARD OF EDUCATION
BOROUGH OF FAIR LAWN Schedule of Project Revenues. Expenditures. Project Balance and Project Status· Budgetary Basis
Window Replacement· Warren Point Elementary School From Inception and for the Year Ended June 30. 2015
REVENUES AND OTHER FINANCING SOURCES State Sources· SDA Grant Bond Proceeds Capital Leases Transfer from capital reserve Transfer from capital outlay Total Revenues
EXPENDITURES AND OTHER FINANCING USES Equipment (73X) Salaries (100) Legal Services (331) Other Purchased Professional and Technical Services (390) Construction Services (450) General Supplies (610) Land and Improvements (710) Lease Purchase Agreements· Prlnclpal (721) Buildings other than Lease Purchase Agreements· Principal (722) Other Objects (800) Total expenditures
Excess (deficiency) of revenues over (under) expendItures
ADDITIONAL PROJECT INFORMATION Project Number Grant Date Bond Authorization Date Bonds Authorized Bonds Issued Original Authorized Cost Additional Authorized Cost Revised Authorized Cost
Percentage Increase over Original Authorized Cost Percentage Completed OrigInal Target Completion Date RevISed Target Completion Date
Prior Periods
$
SP1450·140-14-G1DZ 9/3/14
NIA NIA NlA
$ 350,450.00 $ $ 350,450.00
0.00% 8.04%
9/16/15 9/16/15
111
Current Year
140,180.00
210,270.00
350,450.00
21,296.00 6,878.00
28,174.00
322,276.00
$
Totals
140,180.00
210,270.00
350,450.00
21,296.00 6,878.00
28,174.00
322,276.00
$
Revised Authorized
£m
140,180.00
210,270.00
350,450.00
34,200.00 283,600.00
32,650.00 350,450.00
Section G
PROPRIETARY FUNDS
112

ENTERPRISE FUND
113

INTERNAL SERVICE FUND
114

Section H
FIDUCIARY FUND
115

Schools
Student Activity Funds Athletic Fund
BOARD OF EDUCATION BOROUGH OF FAIR LAWN
Student Activity Agency Fund Schedule of Receipts and Disbursements For the Fiscal Year Ended June 30, 2015
Balance Cash Cash June 30, 2014 Receipts Disbursements
$ 244,283.04 $ 701,089.35 $ 677,977.02 58.62 58,577.85 58,563.80
$ 244,341.66 $ 759,667.20 $ 736,540.82
116
Exhibit H-3
Balance June 30,2015
$ 267,395.37 72.67
$ 267,468.04

Payroll Deductions and With holdings Net Salaries and Wages Section 125 Plan Interfunds Payable
BOARD OF EDUCATION BOROUGH OF FAIR LAWN
Payroll Agency Fund Schedule of Receipts and Disbursements For the Fiscal Year Ended June 30,2015
Balance Cash June 30, 2014 Receipts
$ 431,989.69 $ 27,449,402.75 612.90 32,589,205.82
4,371.02 4.37 94.32 5,730.75
$ 437,067.93 $ 60,044,343.69
117
Exhibit H-4
Cash Balance Disbursements June 30,2015
$ 27,551,259.07 $ 330,133.37 32,590,887.77 (1,069.05)
4,375.39 572.49 5,252.58
$ 60,142,719.33 $ 338,692.29
Section I
LONG - TERM DEBT
118
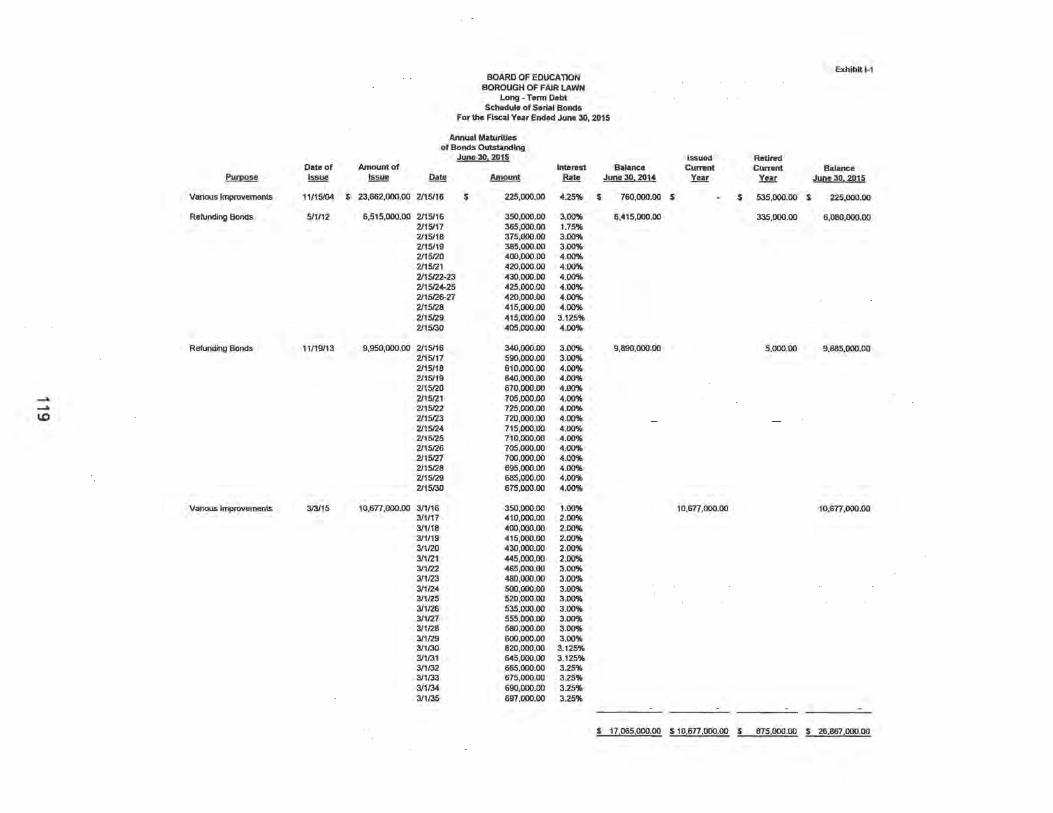
Exhibit 1-1 BOARD OF eDUCATION
BOROUGH OF FAIR LAWN Long - Term Debt
Schedule of Serial Bonds For the Fiscal Year Ended June 30, 2015
Amual Maturitles of Bonds Outstanding
JUI!! 30, 2015 Issued Retired Date of Amount of Interest Balance Current Currant Balance
Purpose Issue ~ ~ ~ ~ J!!!l! 30, 2014 Year Year J!!!l! 30, 2015
Vanous Improvements 11115104 $ 23,662,000.00 2115116 $ 225,000.00 4.25% $ 760,000.00 $ $ 535,000.00 $ 225,000.00
Refunding Bonds 511/12 6,515,000.00 2115116 350,000.00 3.00% 6,415,000.00 335,000.00 6,080,000.00 2115117 365,000.00 1.75% 2115/18 375,000.00 3.00% 2115/19 385,000.00 3.00% 2115120 400,000.00 4.00% 2115121 420,000.00 4.00% 2115122-23 430,000.00 4.00% 2115124-25 425,000.00 4.00% 2115126-27 420,000.00 4.00% 2115128 415,000.00 4.00% 2115129 415,000.00 3.125% 2115130 405,000.00 4.00%
Refunding Bonds 11/19113 9,950,000.00 2115/16 340,000.00 3.00% 9,890,000.00 5,000.00 9,885,000.00 2115117 590,000.00 3.00% 2115118 610,000.00 4.00% 2115119 640,000.00 4.00% 2115120 670,000.00 4.00%
....... 2115121 705,000.00 4.00%
....... 2115122 725,000.00 4.00%
'" 2115123 720,000.00 4.00% 2115124 715,000.00 4.00% 2115125 710,000.00 4.00% 2115126 705,000.00 4.00% 2115127 700,000.00 4.00% 2115128 695,000.00 4.00% 2115129 685,000.00 4.00% 2115130 675,000.00 4.00%
Various Improvements 313115 10,6n,OOO.00 3/1/16 350,000.00 1.00% 10,sn,OOO.00 10,6n,OOO.00 311117 410,000.00 2.00% 311/18 400,000.00 2.00% 311/19 415,000.00 2.00% 311120 430,000.00 2.00% 311121 445,000.00 2.00% 311122 465,000.00 3.00% 311123 480,000.00 3.00% 311124 500,000.00 3.00% 311125 520,000.00 3.00% 311126 535,000.00 3.00% 311127 555,000.00 3.00% 311128 580,000.00 3.00% 311129 600,000.00 3.00% 311130 620,000.00 3.125% 311131 645,000.00 3.125% 311132 665,000.00 3.25% 311133 675,000.00 325% 311134 690,000.00 325% 311135 697,000.00 3.25%
$ 17,065,000.00 510,6n,OOO.00 5 875,000.00 5 26.867,000.00
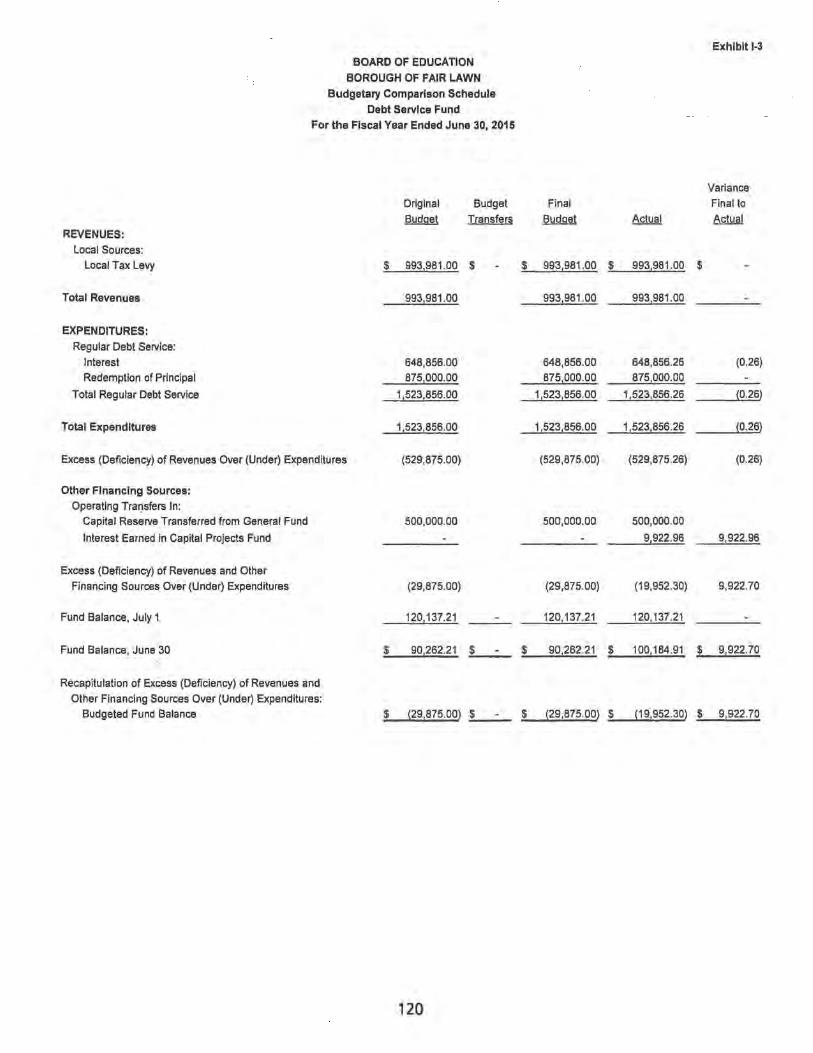
BOARD OF EDUCATION BOROUGH OF FAIR LAWN
Budgetary Comparison Schedule Debt Service Fund
For the Fiscal Year Ended June 30, 2015
Original Budget
~ Transf!ilrlj REVENUES:
Local Sources: Local Tax Levy $ 993,981.00 $
Total Revenues 993,981 .00
EXPENDITURES: Regular Debt Service:
Interest 648,856.00 Redemption of Principal 875,000.00
Total Regular Debt Service 1,523,856.00
Total Expenditures 1,523,856.00
Excess (Deficiency) of Revenues Over (Under) Expenditures (529,875.00)
Other Financing Sources: Operating Trar:Jsfers In:
Capital Reserve Transferred from General Fund 500,000.00
Interest Earned In Capital Projects Fund
Excess (Deficiency) of Revenues and Other Financing Sources Over (Under) Expenditures (29,875.00)
Fund Balance, July 1 120,137.21
Fund Balance, June 30 $ 90,262.21 $
Recapitulation of Excess (Deficiency) of Revenues and Other Financing Sources Over (Under) Expenditures:
Budgeted Fund Balance $ ~291875.00) $
120
Exhibit 1-3
Variance Final Final to
~ Actual ~
$ 993,981.00 $ 993,981 .00 $
993,981 .00 993,981 .00
648,856.00 648,856.26 (0.26)
875,000.00 875,000.00
1,523,856.00 1,523,856.26 (0.26)
1,523,856.00 1,523,856.26 (0.26)
(529,875.00) (529,875.26) (0.26)
500,000.00 500,000.00
9,922.96 9,922.96
(29,875.00) (19,952.30) 9,922.70
120,137.21 120,137.21
$ 90,262.21 $ 100,184.91 $ 9,922.70
$ ~29,875 . 00) $ ~191952 . 30) $ 91922.70

STATISTICAL SECTION (UNAUDITED)
GASB requires that ten years of statistical data be presented. Pursuant to State of New Jersey Department of Education requirements issued for the fiscal year ended June 30, 1994, only two years statistical data needed to be presented. Additional year's data will be included each year thereafter until ten years of data is presented.
121

Financial Trends J-1 J-2 J-3 J-4 J-5
Revenue Capacity
STATISTICAL SECTION (Unaudited)
Net Position by Com ponent Changes in Net Position Fund Balances - Governmental Funds Changes in Fund Balances - Governmental Funds General Fund - Other Local Revenue by Source
J-6 Assessed Value and Estimated Actual Value of Taxable Property J-7 Direct and Overlapping Property Tax Rates J-8 Principal Property Taxpayers J-9 Property Tax Levies and Collections
Debt Capacity J-10 J-11 J-12 J-13
Ratios of Outstanding Debt by Type Ratios of Net General Bonded Debt Outstanding Direct and Overlapping Governmental Activities Debt as of June 30 Legal Debt Margin Information
Demographic and Economic Information J-14 Demographic and Economic Statistics J-15 Principal Employers
Operating Information J-16 Full-time Equivalent District Employees by Function/Program J-17 Operating Statistics J-18 School Building Information J-19 Schedule of Required Maintenance for School Facilities J-20 Insurance Schedule
122

-a. N W
Goverrvnental activities Net Inveslment in capital assets Reslricted Unreslricted
Total governmental activities net position
Business-type activities Net Invesbnent in capital assets Restricted Unrestricted
Total business-type activities net position
Dislrict-wide Net Investment in capitaJ assets Restricted Unrestricted
Total dislrict net position
Source: District records
2015
$ 4,280,067.60 20,255,650.79
3,538,292.89 $ 28,074,011.28
$ 45,882.22
110.346.92 S 156,229.14
S 4,325,949.82 20.255.650.79
3,648.639.81 S 28.230,240.42
2014 2013
$ 13,405,731.00 $12,732,213.28 6,127,278.41 6,899,681.13 3,468,025.28 3.208,464.31
_~ ;13,001.034.69 $ 22,840,358.72
$ 53,235.00 $ 27,659.78
62,189.98 55,135.63 S 115.424.98 $ 82.795.41
S 13.458,966.00 S 12,759.873.06 6.127,278.41 6.899.681.13 3.530.215.26 3,263.599.94
$ 23.119.459.67 $ 22,923,154.13
BOARD OF EDUCATION BOROUGH OF FAIR LAWN
Net Position by Component LasITen Fiscal Years
(acauaJ basis of eccounting) Unaudited
Fiscal Year Ending June 30, 2012 2011 2010
$ 12,271,881.39 $12.437,954.98 $12,358,935.76 6,147,807.66 4,152,683.64 1,356,184.10 3,058,399.14 2,638,429.38 1,329,157.59
$ 21.478,088.19 119,229,068.00 $lL~,2n.45
$ 24,354.14 $ 29,647.37 $ 35,645.62
95,001.48 97,476.20 145.893.32 1 119,355.62 S~~,123.57 S 181,538.94
$ 12,296,235.53 $12,467,602.35 S 12,394,581.38 6,147.807.66 4.152,683.64 1,356,184.10 3,153,400.62 2,735,905.58 1,475,050.91
S 21,597,443.81 119,356,191.57 $ 15,225,1t16.39
2009
$10,560,039.16 1,928,764.47 2,014.433.61
S14JiQ3,23724
$ 38,683.98
136,496.17 S 175.180.15
$10,598,723.14 1,928,764.47 2,150,929.78
$ 14J;lM17.39
ExhlbitJ-
2008 2007 2006
$ 9,870,986.33 $ 8,096,730.11 $ 4,356,344.71 3,111,012.47 4,688,124.28 11,081,525.97 1,746.48025 1,032.006.34 1,050,372.03
S 14.728.479.05 $ 13.816.860.73 $ 16.488.242.71
$ 44.435.67 $ 30,856.12 $ 35,635.25
111,358.56 90,420.80 116,908.67 S 155.794.23 $ 121.276.92 $ 152.543.92
$ 9,915.422.00 S 8.127.586.23 $ 4.391,979.96 3.111.012.47 4.688.124.28 11.081,525.97 1.857,838.81 1,122.427.14 1,167.280.70
$ 14.884.273.28 $ 13.938.137.65 $16.640.786.63

...... N ~
Expenses Governmental activities
instruction Regular Special education Other Instruction
Support Services: Tuition Sludent and instruction related services School administrative services General and business administrative services Plant operations and maintenance PupU transportation
Special Schools Charter Schools SOA Debt Service Assessment klterest on long-term debt
Total governmental activities expenses
BuSlness-type activities: Food service
Total business-type activities expense T ota! district-v.ide expenses
Program Revenues Governmental activities:
Charges for services: Pup~ transportation Special Schools klterest on Ic>ng4erm debt
Operabng grants and contributions Total governmental activities program revenues
2015 2014
$ 34,728,209.98 $ 35,170,95626 11,738,627.48 11,402,396.35 4,454,986.58 4,437,94621
5,261,421.88 4,774,496.11 12,797,764.10 12,610,391.69 5,056,691 .66 5,106,682.76 4,095,783.39 4,006,276.79 8,208,38023 8,582,066.80 3,046,497.36 2,813,841 .33 2,587,382.36 2,548,808.06
73,101.00 61,582.00 77,256.00 77,256.00
735,62721 582,167.72
92,861,72923 92,172,867.88
1,180~528 1,165,252.32 1,180,225.28 1,165~52.32
$ 94.041,954.51 $ 93,338.12020
$ 45,164.00 $ 42,416.80 1,685,141.82 1,609,02324
735,62721 582,167.72 12,911,837.40 13,236,608.46 15,377,770.43 15,470,;!1622
BOARD OF EDUCATION BOROUGH OF FAIR LAWN
Changes In Net Position I..ast Ten F\sQI Y NfS
(acaual basis of arxounDngJ Unauditad
FIScal Year Ending June 30, 2013 2012 ~ 2010
$35,721,711 .17 $34,640,160.52 $32,573,602.83 $33,680,890.85 10,819,495.77 10,441,443.81 9,513,221 .90 10,417,029.62 4,275,795.03 3,758,175.68 3,631,484.01 4,242,269.36
4,274,644.59 4,402,971.93 3,882,456.52 4,152,946.08 12,207,5n.73 11,940,973.60 11,189,962.19 12,200,992.70 5,079,807.50 4,841,843.87 4,769,773.42 4,979,802.36 4,115,794.68 3,577,001.76 3,605,452.63 3,934,086.49 8,992,963.39 7,660,728.37 7,161,297.94 7,796,910.31 2,654,604.98 2,637,156.82 2,560,997.54 2,667,032.13 2,601,832.39 2,502,783.81 2,533,880.44 2,920,547.33
59,127.00 80,792.00 74,956.00 55,086.00 77,256.00 55,821 .00 93,421 .00
676,479.36 943,014.66 934,101.77 972,927.53 91,557,084.59 ~.482,867.83 82,524.1iQ8.19 88,020,500.76
1,134,41327 1,215,172.39 1,214,717.27 1,180,944.84 1,134,413.27 1,215,172.39 1,214,71727 1,180,944.84
591.6!11,497.86 .S8!I,698,04022 $83,739,325.46 589.201 .445.60
$ 40,324.00 $ 39,115.00 $ 37,539.00 $ 31,674.00 1,650,266.92 1,586,918.00 1,575,267.93 1,593,438.49
676,479.36 943,014.66 934,101 .77 972,927.53 14,012,815.31 12,407,58323 10,290,997.63 12,742,759.49 16,379,885.59 14,976,63O.8j 12,837,906.33 15,346,799.51
2009 2008
$32,452,088.09 $31 ,819,62928 9,034,633.71 9,101,749.93 3,503,221.91 3,421,45629
3,993,585.78 3,882,395.49 12,691,148.84 13,155,315.60 4,731,933.15 4,237,977.91 4,595,993.11 3,895,153.86 8,140,841 .13 8,268,241 .74 2,621,788.02 2,587,954.93 3,119,050.95 3,196,162.52
10,437.00 4,478.00
1,008,964.55 1,042,706.39 85,903,68624 84,613,221 .94
1~8.487.90 1.195,328.18 1~8,487.90 1,195,328.18
$87,112,174.14 585,808.550.12
$ 37,200.00 $ 32,773.20 1,886,131.75 1,960,37427 1,008,964.55 1,042,706.39
12,337,815.09 14,854,520.92 15,270,111 .39 17,890,374.78
2007
$30,802,324.65 8,087,254.56 3,178,215.83
3,788,99320 12,318,861.60 4,084,714.54 3,526,145.15 7,754,504.34 2,533,643.42 3,007,257.30
1,067,547.67 80,149.46226
1,146,842.57 1,146,842.57
$81.296.304.83
$ 36,676.50 1,817,105.45 1,067,547.67
14,435,386.51 17,356,716.13
ExhIbI1 ShI
2006
$28,675,957 7,274,943 2,972,702
3,496,984 11 ,730,962 4,120,214 3291,282 7,005,520 2,209,827 2,788,015
1,103,397 74,669,809
1.100.553 1,100,553
575,770,363
$ 35,494 1,781,219 1,103,391
12,330,198 15,250,310

-"' IV U1
Business-type activities: Chalges for_
Food servia! Operating granls and conlribulions
Total business-type activities program revenues Total d4s1nct-wKle program I"tMftJ8S $
Not (ElIpense)IR.v ...... GovemmentaJ actiVIties $ Busines&-type activities Total dlslricl-wlde net expense
General R.v.nues and au- Ch_1n Net Position Govemmenlal activities:
Taxes: Property !axes. levied for general purposes $ Property laxes. levied lor dabl servia! principal
Federal and Slale aid notreslricied Tuition (olller !han special schools) Inveslment earnings Prenuum on sale 01 notes MlSCeHaneous InaJme Transf"", N J. Eoonomoc Oevelopment Autho<IIy 9rants AdjuslmentlD Capital AsseIs RefwQng bond proceeds
Total govenvnenlal adivities
BUSiness-type activities: Invesbnent earnings Transfers
Total business-type activities Total dI&Inct-w1de g8IlOflII revenues S
Change In N.t Position Govenvnental actiVibes $ Bus,ness-type activilles Total dlslricl-wode change in net pOSition
Source: DIstIIc:t 18t:ords
2015 2014 2013
938.008.85 S 854.357.72 820.309.09 262,864.17 312,540.12 2n,25O.55
1,220,873 02 1,166,897.84 1,097.559.64 16.598.643.45 $ 16.637.114,06 $ 17.4~5.23
(n.483.958.80) S (76.702.651 .66) $ (75.1n.199.00) ~,647.74 1,645.52 (36853.63)
In.443.311.06) 176.701.006.14) S (75.214.052.631
n.888.891 .00 $ 75.823.913.00 $ 74.548.206.00 258.353.79 742.86528 1.272.664.64 495.180.38 289.687.17 276.950.72 392.162.32 515.497.79 551.374.40
54.879.59 22.586.10 49.068.66
207.074.31 135.970.83 308.823.93 (30.850.00)
3.260.394.00 (1.046.~2.54) (487.618.62)
410,000.00 62.556.935.39 76.863.327.63 76.539.469.53
156.42 1~.05 293.42 30,850.00
156.42 30,984.05 293.42 62.557.091 .81 S 76.894.311 .68 S 76.539.762.95
5.072.976.59 $ 160.675.97 $ 1.362.270.53 ~,804. 16 32,629.57 {36,56O.21}
5.113.780.75 193.305.54 1.325.710.32
BOARD OF EDUCATION BOROUGH OF FAIR LAWN
Chonges In Net Position Last Ton Fiscal Y.ars
/acauaI_. 01 act:txn/ing) U..-
Fiscal Year Endinq June 30. 2012 ~ ----l!!!.Q.
S 897.547.60 S 896.923.52 S 911.540.11 292,054.62 262,4~.90 274,736.01
1,189,602.~2 1, 159,358.~2 1,186,276.12 $ L~I66,233.31 ~_13.997.264.75 $ 16.533.075.63
$ (72.506.236.94) S (69.686.701 .86) S (72.673.701 .25) (25,569.97) (55,358.85) 5,331 .28
$ m.531.806.91) S (69.742.060.71) S (72.668.369.97)
$ 73.158.200.00 $ 71.900.203.00 $ 68.935.957.00 997.207.~ 994.208.23 875.210.47 223.195.66 159.612.13 1.653.262.08 501,205.00 515.573.94 439.412.35
81.979.30 120.210.56 187.708.94
231.664.29 152.580.51 84.505.50
(1.230.76) (25.259.29) (~3.963. 70) 54.363.33 1.038.685.12 (93,000.00)
74.755.257.13 73.871.492.~1 73.214.741 .46
641.55 943.48 1.027.51
641 .55 943.48 1,027.51 $ H .755.896.68 5 73.872.435.89 $ 73.215.768.97
$ 2,249.020.19 S 4.184.790.55 5 541.040.21 {24,928.42} {54,415.37l 6,358.79
2.224.091 n 4.130.375.18 S 547.399.00
2009
S 988.681 .64 237,683.03
1,226,364.67 $ 16.~96.476.06
$ (70.633.574.85) 17,876.77
$ (70.615.698.08)
S 66.380.728.00 749.83145
1.430.226.57 413.135.10 297.856.80
nO.680.88
365.872.24
70.408.333.04
1.509.15
1,509.15 S 70.409.842.19
5 (225.241.81) 19,385.92
S 1205.855.89)
2008 2007
S 1.004.639.39 S 933.~5O.94 221,501.84 In,387.28
1,226,141.23 1.110,838.22 $ 19.116.516.01 $ 18.~.554.35
$ (66.722.847.16) $ (62.792.746.13) 30,813.05 (36,004.35)
5 166.692.~.11) 5 (62.628.750.48)
$ 64.233.192.00 $ 61.516.737.00 541.442.61 690.983.33 983.293.51 690.701 .63 447.344.69 490.375.27 583.935.76 741.906.02
845,256.89 256.861 .03
(4.266.200.13)
67.~.465.48 60.121.364.15
3.70426 4.737.35
3,70426 4,737,35 5 67.638.169.74 5 60.126.101 .50
5 911.618.32 S (2.671.381.90) ~,517.31 pl.26700}
S 946.135.63 $ 12.702.648 90)
S
$
ExhlbltJ-Z _tZ
2006
908.401 .00 190,218.13
1,098,619.13 16._.929.91
$ (59.~19.498.78) (1,9~.73)
$ (59.421.433"51)
$ 57.316.226.00 914.494.57 684.236.10 499.505.30 735,454.11
132.139.06
(38.522.14)
60.243.533.00
3.51173
3,51173 $ 60.247.044 73
S 62~.034.22
1,57700 625.611 .22

ExhIbltJ-3
BOARD OF EDUCATION BOROUGH OF FAIR LAWN
Fund Balances - Governmental Funds, Last Tan Fiscal Years
(modified accrual baSIS of accounling) Unaudited
FIScal Year Ending June 30, 2015 2014 2013 2012 2011 2010 2009 2008 --1!!Q7 2006
General Fund Reslricled $ 4 ,397,715.18 $ 4,525,671 .43 $ 3,306,381 .44 $ 2,016,787.27 $ 677,558.25 $ $ $ $ $ Assigned 3,094,910.64 3,224,790.87 5,349,036.05 6,003,450.88 5,306,594.63 Unassigned 3,023,835.39 2,888,452.78 2,284,476.81 2,111,659.14 1,659,454.38 RBSefVed 1,616,066.03 1,669,316.87 2,620,129.19 2,574,383.41 1,738,736.65 UnreselVed 2,011,240.09 2,661 ,888.61 2,431,150.25 1,757,183.84 1.778,162.03
T alai general fund $ 10,516,461 .21 S 10,618,915.08 ~ 10,939,894.30 ~ 10,131 ,897.D9 S~t;43,607.26 _ $ 3,627,306.12 S 4,331,185.48 S 5.051.279.44 $ 4.331 ,567.25 S 3.516,898.68
All Other Governmental Funds RescIricIed, reported in:
Capilal projects fund $ 4,947,421 .98 $ $ $ (1,812.26) $ (10,298.00) $ $ $ $ $ Debt service fund 100,184.91 120,137.21 32,497.28 4,027.99 8,058.07
Assigned, repof1ed in: Capital projects fund 9,545,510.13 10,021.50
Reserved 15,149.16 908,854.61 537,435.91 1,235,088.97 6,672,615.84 Unreserved, reported on:
....... Special revenue fund
N Capital projects fund 53,972.05 (374,964.57) 100,354.42 782,545.70 2,605,139.10
C'I Debt service fund 24,425.93 92,199.24 232.201 .83 486,929.78 473.708.34 Total aU oIher govemmenlal funds $ 14,593.117.02 $ 120,137.21 S 32,497.28 $ 2,215.73 $ 7,781.57 $ 93,547.14 $ 626,089.28 $ 869,992.16 $ 2,504
1564.45 ,J, 9.751,463.28
Tolat Fund Balances S 25.109,578.23 $ 10,739,052.29 S 101972,391 .58 S 10
11341112.82 S 7.651
1388.83 S 3,7201853.26 S 4,957,274.76 S 5,921.271 .60 $ 6,836.131 .70 $ 13.268,361 .96
Source: District records

ExhlbltJ-4 SMfl1
BOARD OF EDUCATION BOROUGH OF FAIR LAWN
Changes In Fund &lances • Governmental Funds, Last Ten FIscal Y .....
(modified aeausl basis of accoun/ing) Unaudited
FIScal Year Endi~ June 30, 2015 2014 2013 2012 2011 2010 2009 2008 2007 2006
Ravenuea Tax levy $ 78,882,872.00 $ n,148,946.oo S 76,497,350.00 $ 75,098,422.00 $ 73,828,513.00 $ 70,784,095.00 $88,139,524.00 $65,817,341.00 $ 63,275,268.00 $ 59,334,118.00 TuitJon charges 392,162.32 515,497.79 551,374.40 501,205.00 515,573.94 439,412.35 413,135.10 447,344.69 490,37527 499,505.30 Transportation fees 45,164.00 42,416.80 40,324.00 39,115.00 37,539.00 37,674.00 37,200.00 32,n320 36,676.50 35,494.80 interest eamings 54,879.59 22,586.10 49,068.66 81,979.30 120,210.56 187,708.94 297,856.80 563,935.78 741,906.02 735,454.11 Miscellaneous 1,936,464.30 1,790,178.70 2,059,459.45 1,996,15220 1,952,502.67 l,n3,209.16 2,721,139.19 3,019,066. n 2,091,35021 1,913,359.03 State sources 11,668,227.03 12,053,965.16 12,700,087.85 10,800,944.11 8,649,010.22 11,688,197.03 12,187,059.73 14,183,470.66 13,739,069.49 11,567,683.65 Federal sources 1,694,542.56 1,427,145.84 1,489,309.56 1 ,652~64.87 1,576,945.31 2,612,559.37 1,516,655.37 1,440,906.14 1 ,369,634.92 1,446,751.03
Total revenues 94,674,311 .82 93,000,736.39 93,386,973.94 90,170,082.48 86,660.294.70 87,522,855.85 85,312,572.19 85,524,84026 81,744,280.41 75,532,365.92
Ex~8S Instruction
Regular instruction 26,050,512.12 25,325,03320 25,456,34021 24,983,713.48 22,883,527.07 24,082,292.06 23,900,762.60 22,684,874.15 21,645,582.72 20,628,53127 Special education instruction 9,115,350.71 8,553,728.72 8,010,794.10 7,869,881.57 7,163,495.19 8,055,954.73 6,946,909.35 6,839,940.34 5,964,859.03 5,575,122.88 Oth .... instruction 3,374,07127 3,286,457.87 3,123,749.60 2,n9,476.63 2,507,808.69 3,128,792.55 2,657,522.70 2,509,742.80 2,373,547.01 2,199,688.73
Support Services: Tuition 5,261,421.88 4,n4,496.11 4,274,644.59 4,402,971 .93 3,882,456.52 4,152,946.08 3,993,565.78 3,882,395.49 3,788,99320 3,496,98427 Student and instruction related services 9,981,286.39 9,601,712.87 9,108,040.11 9,060,817.43 8,408,796.91 9,158,194.05 9,804,591.46 9,871,104.74 9,205,419.95 8,888,706.63 School adm,nistrative services 3,745,928.14 3,643,694.46 3,571 ,871.n 3,499,949.93 3,442,810.51 3,525,978.15 3,519,603.49 3,049,312.11 2,894,310.14 2,901,097.51 General and business administrative services 3,314,628.04 3,208,20627 3,273,028.15 2,836,084.32 2,837,235.71 3,148,884.02 3,957,433.84 3,179,813.67 2,892,42326 2,697,022.19
........ Piant operations and maintenance 7,234,782.88 7,479,566.10 7,726,024.89 6,378,196.55 5,879,831.43 6,271,474.43 6,696,249.78 6,660,412.41 6,198,92021 5,684,202.18
N Pup~ transpor1abon 2,574,590.57 2,346,791 .18 2,188,113.69 2,098,2n.32 2,037,876.07 2,127,On.19 2,216,543.04 2,156,686.94 2,121,531 .56 1,845,764.31
-...J Employee benefits 17,840,267.46 19,632,166.14 20,671,736.97 19,284,567.n 19,352,024.01 19,709,084.73 17,437,919.47 18,979,112.53 18,498,40628 16,793,672.48 Special Schools 2,124,550.43 2,053,006.75 2,066,562.44 2,014,651.59 1,997,041.81 2,336,459.43 2,584,416.44 2,809,536.87 2,440,172.73 2,304,262.91 Transfers to Charter Schools 73,101.00 61,582.00 59,127.00 80,792.00 74,956.00 55,086.00 10,437.00 4,478.00 Capital ouUay 2,026,832.73 1,387,246.03 1,092,953.03 449,873.35 310,556.96 1,086,511.02 999,893.39 2,076,99023 8,249,259.05 17,3n,395.64 Debt servoce:
Principal 875,000.00 1,222,457.72 1,160,816.89 1,039,254.41 997,802.93 936,422.n 895,141 .18 858,878.99 817,667.48 756,540.97 interest and Dill .... charges 648,856.26 627,080.26 762,891 .74 907,618.82 946~80.66 986,140.14 1,021,431.75 1,054,421.09 1,085,398.05 1,374,518.21
Total expenditures 94,241,179.88 93,203,225.66 92,548,895.18 87,686,127.10 82,724,500.47 88,759~n.35 86,642,44127 86,439,700.38 88,176,510.67 92,503,490.18 Excess (DefiCIency) of revenues
over (under) expenditures 433,131 .94 (202,489.29) 838,278.76 2,483,955.38 3,955,794.23 (1.236,421.5O) (1,329,869.08) (914,860.10) (6,432,230.26) (16,971,12426)

-"' rv 00
Other FInancIng sources (usesl Proceeds from borrowing Proceeds from Leas&'Purchase N.J.S.D.A Grants Serial Bond Proceeds Transfers In
Transfers 001 TOlai DIh .... financing sources (uses)
Net change ,n fund balances
Debl service as a percentage of noncapitaI 8lCpenddures
Source: District records
201S
3.260.394.00 1 0.6n .000.00 2.110.992.96
!2,110,992.96] 13,937,394.00
14.370,52S.94
1.6S%
2014 2013
600.000.00 1.973.97 !630,850.00] !1,973.97]
!3O,850.00]
$ (233.339.29) 838.278.76 $
2.01% 2.10%
BOARD OF EDUCATiON BOROUGH OF FAIR LAWN
Changes In Fund Balances - Governmental Funds, Last Ten Ascal Years
(modified acaual basis 01 acmurting) Unaudlt8cl
FlScal Year Ending June 30. 2012 ~ 2010
(1.230.76) (2S.259.29)
8.7n.13 67.711.03 557.212.12 !8,7n.13] !67,711.03] !557 ~12.12] p,23O.76] !2S,259.29]
2,482.724.62 3.930.534.94 p,236,421.50)
2.23% 2.36% 2.19%
$
2009 2008
365.872.24
74.423.13 {14,423.13]
365,872.24
(963,996.84] $ (914.860.10) $
2.24% 2.27%
2007
157.nS.97 p57,nS.97]
(6,432.230.26)
2.38%
ExhlbltJ-4 SheetZ
2006
(38.522.14)
414.882.26 !414,882.26]
(38,522.14]
$ (17,009,646.40)
2.84%

Tuition Transportation Interest Accounts Payable Canceled Adult & Summer School Fees Rentals Refunds Custodial Fees and Gate Receipts Miscellaneous
Total
...... Source: District records N \D
~ 2Qll
$ 392.162.32 $ 515,497.79 $ 45.164.00 42.416.80 44.956.63 22.586.10
1.685.141.82 1.609.023.24 6.147.00 36.955.00
17.108.80 27.n2.57 183.818.51 40.003.35
BOARD OF EDUCATION BOROUGH OF FAIR LAWN
General Fund· Other Local Revenue by Source Last Ten Fiscal Years
w.a 551.374.40
40.324.00 49.068.66 17.nO.52
1.650.266.92 117.225.00
39.699.80 131.256.40
(modifie{/ accrual basis of accounting) Unaudited
2012 2lill
$ 501.205.00 $ 515.573.94 39.115.00 37.539.00 81.065.15 118.804.83
1.644.973.00 1.575.267.93 110.194.00 47,275.00
61.708.29 105.305.51
$
&!Wl ~
439.412.35 $ 413.135.10 $ 37.674.00 37.200.00
181.057.34 280.084.46 5.076.n 385.74
1.593.438.49 1.886.131.75 48.206.00 45.880.00
661.967.00 17.570.42 22,481.72 7.152.31 39.966.42
2l!lm
447.344.69 $ 32.n3.20
509.512.65 6.559.35
1.960.374.27 57.202.34
750.000.00 20.605.36 10.889.84
ZQQ1.
490.375.27 36.676.50
741.906.02 666.00
1.870.029.80 53.782.95
7.052.98 142.434.75
ExhibltJ·5
~
$ 499.505.30 35.494.80
412.166.39 8.520.66
1.781.219.97 71.275.00
7.036.40 12.446.01
$ 2.374,499.08 $ 2.294,254.85 $ 2.596.985.70 $ 2.438.260.44 $ 2.399.766.21 $ 2.329.587.68 $ 3.387,232.19 $ 3.795.261.70 $ 3.342.924.27 $2,827.664.53

-.a. W o
Fiscal Year Ended
December 31_. _ Vacant Land
2006 $ 11.363.700 2007 30.195.800 2008 30.140.600 2009 29.188.500 2010 28.929.200 2011 33.262.300 2012 30,421.800 2013 25.218.000 2014 22.706.500 2015 12.589.500
Source: Municipal Tax AsseSlior
Residential Farm
$ 1.874.824.800 $ 4.171.669.200 4.174,425.200 4.190.550.300 4.198.049.100 4.202.671.100 3.301.846.100 3.305.n2.1oo 3.311 .604.600 3.318,936,900
BOARD OF EDUCATION BOROUGH OF FAIR LAWN
AsseSIied Value and Estimated Actual Value of Taxable Property. Last Tan Fiscal Years
Unaudited
T otaJ Assessed Commercial IndusJrial AIlartment Value
$ 230.957,100 $ 119,On,800 $ 57.888,800 $ 2.294,112,200 498,913,900 220,147,700 144,874,700 5,065,801,300 501.403,300 218.628.700 144.874,700 5.069,472.500 497,681.000 223,275,200 139.681 .900 5,080.376,900 480,255,300 216,482,000 135,219,700 5,058,935,300 475.737,700 212.041,000 130,785.300 5,054,497.400 458,062,200 206,415,400 135,390,800 4.132,136,300 465,894,300 205,422,700 135,290,800 4,137,597,900 466,325,300 203.460,800 134,921.200 4.139,018.400 498,705,500 201,810,800 134,921,200 4,168,963,900
ExhibitJ-6
Tolal Eslimaled Actual Direct
Net Vaiualion (Courty Equalized) School Public Ulilihes Taxable Value TaxRale
$ 4,335.095 $ 2,298,447.295 $ 4,566,010.284 2.667 8,318,373 5,074,119,673 5,046,726,114 1.272 9.782.801 5.079.255.301 5.374,008.691 1.319
10,886.928 5.091,263,828 5,392,062,818 1.364 11,397,254 5,070,332,554 5,160,042,949 1.426 10.145,085 5,064.642,485 5,093,674.514 1.471
1,000,000 4,133,136.300 4,513,685,965 1.834 917 4,137,598,817 4,540,063,262 1.657 941 4.139.019,341 4,428.212.069 1.885 926 4,166,964,826 4,526,605,525 1.920
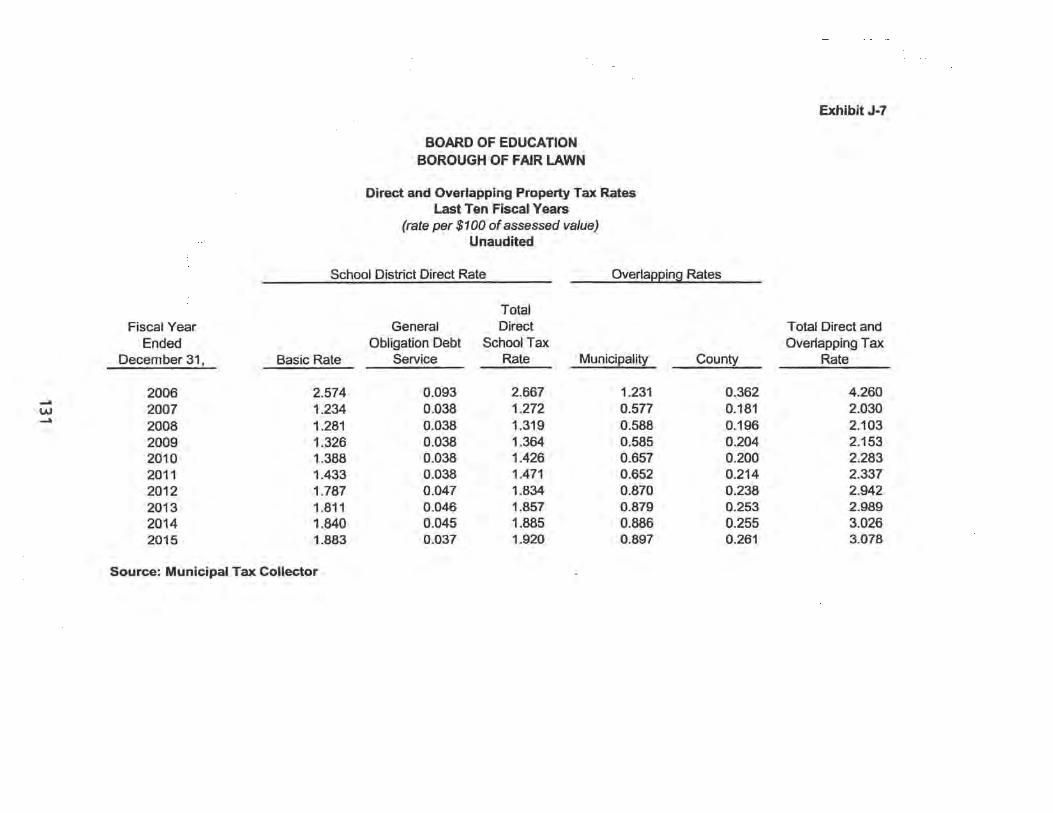
-w -
BOARD OF EDUCATION BOROUGH OF FAIR LAWN
Direct and Overlapping Property Tax Rates Last Ten Fiscal Years
(rate per $100 of assessed value) Unaudited
School District Direct Rate Overlapping Rates
Fiscal Year Ended
Decem ber 31,
2006 2007 2008 2009 2010 2011 2012 2013 2014 2015
Basic Rate
2.574 1.234 1.281 1.326 1.388 1.433 1.787 1.811 1.840 1.883
Source: Municipal Tax Collector
General Obligation Debt
Service
0.093 0.038 0.038 0.038 0.038 0.038 0.047 0.046 0.045 0.037
Total Direct
School Tax Rate Municipality County --
2.667 1.231 0.362 1.272 0.577 0.181 1.319 0.588 0.196 1.364 0.585 0.204 1.426 0.657 0.200 1.471 0.652 0.214 1.834 0.870 0.238 1.857 0.879 0.253 1.885 0.886 0.255 1.920 0.897 0.261
Exhibit J-7
Total Direct and Overlapping Tax
Rate
4.260 2.030 2.103 2.153 2.283 2.337 2.942 2.989 3.026 3.078

...... w rv
Fiscal Year Ended June 30,
Fair Lawn Estates Assoc. Fair Lawn Promenade, LLC Fairlawn Associates Nabisco clo Kraft Foods Columbia Savings Bank Bon-Marc Realty 17-17 Realty Associates Fairlawn Industries, LP Novle I/HY Fair Lawn, LLC Oster Fair Lawn Properties, LLC
Total
Source: Municipal Tax Assessor
BOARD OF EDUCATION BOROUGH OF FAIR LAWN
Principal Property Taxpayers Current Year and Ten Years Ago
Unaudited
Taxable Assessed
Value
$ 44,202,700 40,854,700 34,589,000 29,319,600 21,968,800 20,256,000 18,000,000 14,475,900 13,200,500 13,076,900
$ 249,944,100
2015 % of Total
District Net Assessed Value
1.07% 0.99% 0.84% 0.71% 0.53% 0.49% 0.43% 0.35% 0.32% 0.32%
6.04% "$
Taxable Assessed
Value
Exhibit J-8
2005 % of Total
District Net Assessed Value
0.00%

-a. W W
Fiscal Year Ended
Decem ber 31 ,
2005 2006 2007 2008 2009 2010 2011 2012 2013 2014
Taxes Levied for the Fiscal Year
$ 75,212,423 89,814,196 98,444,012
103,227,821 110,139,698 116,342,968 118,879,999 122,138,055 124,087,905 126,147,730
Source: Municipal Tax Collector
BOARD OF EDUCATION BOROUGH OF FAIR LAWN
Property Tax Levies and Collections Last Ten Fiscal Years
Unaudited
Collected within the Fiscal Year of the Levy Collections in
Percentage of Subsequent Amount Levy Years
$ 74,499,210 99.05% $ 682,995 88,973,789 99.06% 824,440 97,519,674 99.06% 884,696
102,183,039 98.98% 944,358 108,730,126 98.72% 997,339 114,796,203 98.67% 1,342,472 117,368,343 98.72% 1,085,844 121,006,621 99.07% 1,084,946 123,057,247 99.16% 957,824 125,079,266 99.15%
Exhibit J-9
Total Collections to Date
Percentage of Amount Levy
$ 75,182,205 99.95% 89,798,229 99.98% 98,404,370 99.95%
103,127,397 99.90% 109,727,465 99.62% 116,138,675 99.82% 118,454,187 99.64% 122,091,567 99.96% 124,015,071 99.94% 125,079,266 99.15%

~
IN ~
Fiscal Year
Ended June 30,
2006 2007 2008 2009 2010 2011 2012 2013 2014 2015
General Obligation
Bonds
$ 24,972,000 $ 24,192,000 23,372,000 22,517,000 21,622,000 21,372,000 19,765,000 18,650,000 17,065,000 26,867,000
BOARD OF EDUCATION . BOROUGH OF FAIR LAWN
Ratios of Outstanding Debt by Type Last Ten Fiscal Years
Unaudited
Governmental Activities Business-Type
Activities
Bond Capital Anticipation
Loans Leases Notes (BANs) Capital Leases
338,462 $ 244,669 $ $ 300,775 261,896 221,755 180,332 137,529 93,275 47,458
Exhibit J-10
Percentage of Personal
Total District Income Per Capita
$ 25,555,131 2.30% 835 24,492,775 2.17% 804 23,633,896 2.06% 777 22,738,755 1.94% 745 21,802,332 1.64% 671 21,509,529 1.60% 658 19,858,275 1.45% 605 18,697,458 1.36% 567 17,065,000 1.20% 509 26,867,000 1.84% 801

....... w U1
Fiscal Year
Ended June 30,
2006 2007 2008 2009 2010 2011 2012 2013 2014 2015
General
BOARD OF EDUCATION BOROUGH OF FAIR LAWN
Ratios of Net General Bonded Debt Outstanding Last Ten Fiscal Years
Unaudited
General Bonded Debt Outstanding
Percentage of Net General Actual Taxable Bonded Debt Value of
Obligation Bonds Deductions Outstanding Property
$ 24,972,000 $ $ 24,972,000 1.09% 24,192,000 24,192,000 0.48% 23,372,000 23,372,000 0.46% 22,517,000 22,517,000 0.44% 21,622,000 21,622,000 0.43% 21,372,000 21,372,000 0.42% 19,765,000 19,765,000 0.48% 18,650,000 18,650,000 0.45% 17,065,000 17,065,000 0.41% 26,867,000 26,867,000 0.65%
Exhibit J-11
Per Capita
816 794 769 738 665 654 602 568 517 801

-" w ~
Net Direct Debt of School District as of December 31,2014
Net Overlapping Debt of School District: Borough of Fair Lawn (100%)
BOARD OF EDUCATION BOROUGH OF FAIR LAWN
Direct and Overlapping Governmental Activities Debt As of December 31,2014
Unaudited
County of Bergen - Borough's share (2.7271%) Passaic Valley Sewerage Commissioners -
Borough's share (1.262%)
Total Direct and Overlapping Debt as of December 31,2014
$ 36,782,976.00 25,455,932.16
3,658,520.31
Source: Borough of Fair Lawn School District Chief Financial Officer and Bergen County Treasurer's Office, Bergen County Utility Authority and Passaic Valley Sewerage Commissioners.
Exhibit J-12
$ 17,065,000.00
65,897,428.47
$ 82,962,428.47

....... w .......
Debt limit
Total net debt applicable to limit
Legal debt margin
Total net debt applicable to the limit as a percentage of debt limit
Debt limit
Total net debt applicable to limit
$
$
$
BOARD OF EDUCATION BOROUGH OF FAIR LAWN
Legal Debt Margin Information Last Ten Fiscal Years
Unaudited
Legal Debt Margin Calculation for Fiscal Year 2014
2011
206,925,768
21,509,529
185,416,239
10.39%
&QQ§
Equalized valuation basis 2012 2013 2014
Average equalized valuation of taxable property
Debt limit (4 % of average equalization value) Total Net Debt Applicable to Limit
Legal debt margin
Fiscal Year
2012 ~ 2014
$ 200,307,829 $ 191,946,457 $ 183,181,602
19,858,275 18,697,458 17,065,000
$ 180,449,554 $ 173,248,999 $ 166,116,602
9.91% 9.74% 9.32%
Fiscal Year
~ 2008 ~
$
$
$ $
$
$
161,632,996 $ 173,864,248 $ 174,102,857 $ 185,143,959 $
25,310,462 24,492,775 23,633,896 22,378,755
Exhibit J-13
4,506,146,456 4,397,022,210 4,469,782,289
13,372,950,955
4,457,650,318
178,306,013 26,867,000
151,439,013
~
178,306,013
26,867,000
151,439,013
15.07%
2010
210,513,372
21,802,585
Legal debt margin $ 136,322,534 $ 149,371,473 $ 150,468,961 $ 162,765,204 $ 188,710,787
Total net debt applicable to the lim it as a percentage of debt limit 15.66% 14.09%
Source: Equalized valuation bases were obtained from the Annual Report of the State of New Jersey, Department of Treasury, Division of Taxation
13.57% 12.09% 10.36%

...... W 00
Year
2006 2007 2008 2009 2010 2011 2012 2013 2014 2015
Sources:
Population
30,599 30,472 30,405 30,522
BOARD OF EDUCATION BOROUGH OF FAIR LAWN
Demographic and Economic Statistics Last Ten Fiscal Years
Unaudited
Per Capita Personal Personal Income Income
$ 1,112,045,831 $ 36,343 1,127,364,072 36,997 1,145,133,227 37,663 1,170,231,475 38,341
32,497 Actual 1,329,387,276 40,908 32,669 1,347,114,840 41,235 32,847 1,365,290,354 41,565 32,998 1,376,346,580 41,710 33,549 1,418,283,975 42,275
Actual
33,549 (Est.) 1,460,832,494 43,543 (Est)
Population information provided by the NJ Dept of Labor and Workforce Development
Unemployment Rate
3.80% 3.80% 3.50% 8.20% 8.50% 8.90% 8.40% 7.20"'" 5.00%
Personal Income has been estimated based upon the municipal population and per capita personal Income presented
Exhibit J-14
Per capita personal income by municipality estimated based upon the 2000 Census published by the US Bureau of Economic Analysis. Unemployment data provided by the NJ Dept of Labor and Workforce Development
...... W \D
Source:
Employer Employees
BOARD OF EDUCATION BOROUGH OF FAIR LAWN
Principal Employers Current Year and Ten Years Ago
Unaudited
2015
Rank [Optional]
Not Available
Percentage of Total Municipal
Employment
0.00%
Employees
2005
Rank [Optional]
Not Available
Exhibit J-15
Percentage of Total Municipal
Employment
0.00%

Exhibit J-16
BOARD OF EDUCA nON BOROUGH OF FAIR LAWN
Full-time Equivalent District Employees by Function/Program Last Nine Fiscal Years
Unaudited
2006 2007 2008 2009 2010 2011 2012 2013 2014 2015 Function/Program
I nstructioo Regular 266 263 269 285 278 266 277 304 304 328 Special education 48 50 62 53 52 54 59 70 97 110 Other instruction 35 29 29 29 30 43 40 28 20 20 School sponsored/other instructional
Support Services: Tuition 0 0 0 0 0 0 0 0 0 0 Student and instruction related services 10 9 10 12 12 14 12 12 12 12 School administrative services 54 60 68 64 68 65 68 68 68 68 General and business administrative services 43 43 42 45 45 45 45 45 45 45 Central Services 5 5 5 5 5 5 5 5 5 5
-... Administrative information technology 5 4 6 6 6 5 6 6 6 6
~ Plant operations and maintenance 63 58 61 68 68 69 51 44 39 34 0 Pupil transportation 3 4 7 7 7 5 5 3 5 5
Special Schools Food Service Child Care
Total 532 525 559 574 571 571 568 585 601 633 =
Source: District Personnel Records

Fiscal Operating Cost Per Percentage Teaching
~ Enrollment Exf!nditures Pupil Cha!!lle Staff
2006 4,664.7 $ 72,995,035 15,648 8.01% 436 2007 4,788.5 78,024,166 16,294 4.13% 458 2008 4,777.9 82,449,410 17,258 5.91% 487 2009 4,788.4 83,725,975 17,485 1.33% 495 2010 4,750.1 85,750,203 18,052 3.24% 499 2011 4,725.6 80.467,860 17,028 -5.67% 488 2012 4,595.0 85,289,381 18,581 2.82% 504 2013 4,649.0 89,532,034 19,258 13.10% 518 2014 4,6n.O 89,966,442 19,236 3.63% 522 2015 4,717.4 90,690.491 19,225 -0.17% 509
Source: District records -'" ~ Nota: ElYoilmeni basad on annual October district count. -'"
BOARD OF EDUCATION BOROUGH OF FAIR LAWN
Operating Statistics Last Ten Fiscal Years
Unaudited
PupillTaachar RatIo
SaniorHigh Elamenta!l! Middle School School
17.0 12.7 14.1 15.6 13.9 15.7 16.3 11 .4 14.1 15.8 11 .3 14.0 16.8 12.1 14.3 16.6 12.1 15.0 16.3 11 .6 14.4 15.4 11.8 13.7 19.6 10.2 13.3 19.7 9.3 13.1
Average Dally Average Dally
Enrollment Attendance IADEI IADAI
4664.7 4,479.2 4748.2 4,544.7 4777.9 4,584.1 4788.4 4,582.1 4750.1 4,551 .9 4725.6 4,504.1 4595.0 4,404.8 4649.0 4,455.4 46n.0 4,481 .0 4717.4 4,540.9
% Change in Average Daily
Enrollment
-2.20% 1.79% 0.63% 0.22"--0.80% -0.52% -3.27% -1.62% 1.78% 1.47%
Exhibit J-17
Student Attendance Percentage
96.02% 95.71% 95.94% 95.69% 95.83% 95.31% 95.86% 95.84% 95.81% 96.26%

Exhibit J-18
BOARD OF EDUCATION BOROUGH OF FAIR LAWN
School Building Information Last Nine Fiscal Years
Unaudited
2006 2007 2008 2009 2010 2011 2012 2013 2014 ~ District Building Elementary Henry B. Milnes (1951)
Square Feet 42,907 42,907 42,907 42,907 42,907 42,907 42,907 42,907 42,907 42,907 Capacity (students) 334 334 395 395 395 395 395 395 395 395 Enrollment 421 407 406 411 389 385 382 393 417 428
John A. Forrest (1924) Square Feet 40,013 40,013 40,013 40,013 40,013 40,013 40,013 40,013 40,013 40,013 Capacity (students) 288 288 286 286 286 286 286 286 286 286
Enrollment· 2n 294 286 286 288 289 280 284 298 2n Lyncrest (1952)
Square Feet 24,793 24,793 24,793 24,793 24,793 24,793 24,793 24,793 24,793 24,793 Capacity (students) 197 197 234 234 234 234 234 234 234 234 Enrollment 218 232 231 225 218 228 221 219 225 231
Radburn (1930) Square Feet 46,806 46,806 46,806 46,806 46,806 46,806 46,806 46,806 46,806 46,806 Capacity (students) 371 371 351 351 351 351 351 351 351 351 Enrollment 362 3n 372 353 330 345 359 365 435 448
Waren Point (1922) Square Feet 44,174 44,174 44,174 44,174 44,174 44,174 44,174 44,174 44,174 44,174 Capacity (students) 346 346 466 466 466 466 466 466 466 466 Enrollment 465 444 459 446 439 436 434 405 394 405
Westmoreland (1958) - Square Feet 24,971 24,971 24,971 24,971 24,971 24,971 24,971 24,971 24,971 24,971
~ Capacity (students) 195 195 246 246 246 246 246 246 246 246 !'oJ Enrollment 281 297 301 342 338 343 356 350 373 362
Middle School Thomas Jefferson Middle School (1953)
Square Feet 103,958 103,958 103,958 103,958 103,958 103,958 103,958 103,958 103,958 103,958 Capacity (students) 754 754 662 662 662 662 862 662 662 662 Enrollment 718 704 718 732 734 699 680 634 640 661
Memorial Middle School (1956) Square Feet 78,323 78,323 78,323 78,323 78,323 78,323 78,323 78,323 78,323 78,323 Capacity (students) 567 567 466 466 466 466 466 466 466 466 Enrollment 468 458 443 433 442 434 463 443 450 463
Hjoh School Fair Lawn High School (1943)
Square Feet 194,066 244,339 244,339 244,339 244,339 244,339 244,339 244,339 244,339 244,339 Capacity (students) 1,591 1,531 1,637 1,637 1,637 1,637 1,637 1,637 1,637 1,637 Enrollment 1,481 1,537 1,562 1,557 1,572 1,521 1,522 1,493 1,478 1,469
QIlw: Edison School (1955)
Square Feet 47335 47335 47335 47335 47335 47335 47335 47335 47335 47335 Capacity (students) 9 9 9 9 9 9 9 9 9 9 Enrollment
Number of Schools at June 30, 2015 Elementary = 6 Middle School = 2 Senior High School = 1 Other = 1
Source: District Facilities Office
Note: Year of original construction is shown in parentheses. Increases in square footage and capacity are the result of alterations and additions. Enrollment is based on the annual October district count.
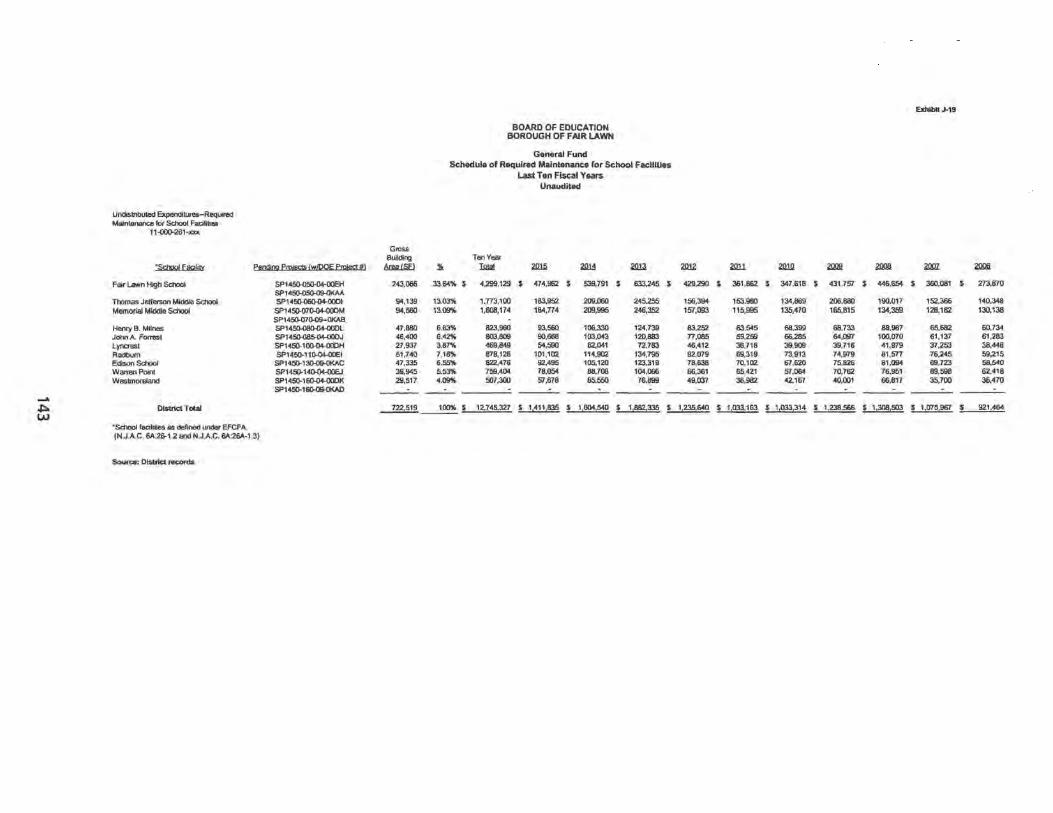
...... ~ W
Undisbibu!ed Expenditures-ReqW1ld Maintenance for School Facilib ..
11-000-261->"'"
05c!wt facjljlY PenOOg Prpjeds (w!DOE P!l!!ec1 HI
Fair Lawn High School
Thomas JeHerson Middle School Memorial Middle School
Henry B. Milnes John A. Fones! Lynaes! Radburn Edison School WIIITefl Point Wesbnorelend
District Total
°School faciliUes as defined UI1der EFCFA. (N.J.A.C. 6A:26-1.2 and N.JAC. 6A:26A-l.3)
Soun:e: District noc:onIs
SP145O-05O-1l4-OOEH SP1451l-05O-O!HlKAA SP1450-060-04-0001
SP1451Hl7()..()4..{1OOM SP1451Hl7~
SPI450-080-04-000L SPI4~J
SP1450-101l-04-000H SP1450-11 Q.04.OOE1
SP1450-13O-09-OKAC SPI450-14().04.OOEJ SP1450-16Q.04.OODK SPI450-161Hl!HlKAD
Gross Building ~
243.066
94.139 94.560
47.880 46.400 27.937 51 .740 47.335 39.945 29.517
----
BOARD OF EDUCA nON BOROUGH OF FAIR LAWN
General Fund Schedule of Required Maintenance for School Facilities
Last Ten Fiscal Years Unaudited
Ten Year ~ IIlliI! 2lI1li 2lIH ~
33.64% $ 4.299.129 $ 474.962 $ 539.791 $ 633,245 $
13.03% 1.773.100 183.952 209.060 245.255 13.09% 1.608.174 184.774 209.995 246.352
6.63% 823.960 93.560 106.330 124.739 6.42% 803.609 90.668 103.043 12O.B83 3.87% 469.849 54.590 62.041 72,783 7.16% 878.126 101.102 114.902 134.795 6 .55% 822,476 92.495 105.120 123.319 5.53% 759.404 78.054 88.708 104.066 4.09% 507.300 57.678 65.550 76.899
~~ $ 12.745.327 $ 1.411.835 $ 1.604.540 $ 1.882.335
ExhIbIt .1-19
~ 2l!ll 2O.1J! 2Il!ll! 2IXIII ZlKlZ <!Il!lIi
429.290 $ 361.862 $ 347.618 $ 431.757 $ 446.654 $ 360.081 $ 273.870
156._ 153.960 134.869 206.880 190.017 152.366 140.348 157.093 115.995 135.470 165,815 134.359 128.182 130.138
83,252 63.545 68.399 68.733 88.987 65.682 60.734 77.085 59.259 66,285 64.097 100.070 61.137 61.283 46.412 36.718 39.909 39.716 41.979 37.253 38.448 92.079 69.319 73.913 74.979 81.577 76,245 59,215 78.638 70.102 67.620 75.826 81 .094 69.723 58.540 66.361 65.421 57.064 70.762 76.951 89.598 62.418 49.037 36.982 42.167 40.001 66.817 35.700 36.470
1.235.640 $ 1.033.163 $ 1.033.314 1.238.566 ~ 1.075.967 $ 921.464

BOARD OF EDUCATION BOROUGH OF FAIR LAWN
Insurance Schedule As of June 30, 2015
Unaudited
School Alliance Insurance Fund: Package Policy:
Blanket Real and Personal Property Extra Expense Earthquake Flood Commercial Liability
Bodily Injury Each Occurance Fire Legal Liability Sexual Misconduct Medical Expense Employee Benefits Liability
Crime Coverage: Depositors Forgery Employee Dishonesty Money and Securities
Automobile School Board Legal Liability Primary Umbrella Liability Enviommental Liability
Group Aggregate Firemen's Fund:
Catastrophe Umbrella Liability
Educational Risk Insurance Consortium - North (N.J. School Boards Association Insurance Group):
Workers Compensation
Bollinger Insurance Company: Student Accident Insurance
Surety Bonds: Board SecretarylBusiness Administrator Treasurer of School Moneys
Flood: Memorial School
Building 1 Contents Source: District records
144
COVERAGE
$ 159,289,293 1,000,000
10,000,000 10,000,000
1,000,000 1,000,000
1,000,000/3,000,000 10,OOO/per person
1,000,000/3,000,000
100,000 500,000 50,000
1,000,000 1,000,000/3,000,000
10,000,000 1,000,000
25,000,000
50,000,000
2,000,000
5,000,000
80,000 400,000
500,000
Exhibit J·20
DEDUCTIBLE
$ 5,000
7,500
10,000 10,000

Single Audit Section
145

~,,'~:.'-. ~ I , . "."r
t ••
rz: ~. 'Vra6eC e:l jlssociates, ££C jlccountants and' jI uditors
flimotliy 5W. o/r46e' ~, cp~ cliris Co J{wang, oP~ "'
~ •• _. - . ,;.tfI'
, .
1
' . .:1 Sheet I :.' .
REPORT ON INTERNAL CONTROL OVER FINANCIAL REPORTING AND ON COMPLIANCE AND OTHER MA TIERS BASED ON AN AUDIT OF FINANCIAL STATEMENTS PERFORMED IN ACCORDANCE WITH
GOVERNMENT AUDITING STANDARDS
INDEPENDENT AUDITOR'S REPORT
The Honorable President and Members of the Board of Education Borough of Fair Lawn County of Bergen, New Jersey
We have audited, in accordance with auditing standards generally accepted in the United States of America; the standards applicable to fmancial audits contained in Government Auditing Standards issued by the Comptroller General of the United States; and in compliance with audit requirements prescribed by the Office of School Finance, Department of Education, State of New Jersey, the fmancial statements of the governmental activities, the business-type activities, each major fund, and the aggregate remaining fund information of Borough of Fair Lawn as of and for the year ended June 30, 2015, and the related notes to the fmancial statements, which collectively comprise Borough of Fair Lawn's basic financial statements, and have issued our report thereon dated October 9,2015.
Internal Control Over Financial Reporting
Management of the Borough of Fair Lawn is responsible for establishing and maintaining effective internal control over financial reporting. In planning and performing our audit, we considered the Borough of Fair Lawn's internal control over financial reporting to determine the audit procedures that are appropriate in the circumstance for the purpose of expressing our opinions on the fmancial statements, but not for the purpose of expressing an opinion on the effectiveness of the Borough of Fair Lawn's internal control over fmancial reporting. Accordingly, we do not express an opinion on the effectiveness of the Borough of Fair Lawn's internal control over financial reporting.
A deficiency in internal control exists when the design or operation of a control does not allow management or employees, in the normal course of performing their assigned functions, to prevent, or detect and correct misstatements on a timely basis. A material weakness is a deficiency, or combination of deficiencies, in internal control, such that there is a reasonable possibility that a material misstatement of the entity's fmancial statements will not be prevented, or detected and corrected on a timely basis. A significant deficiency is a deficiency, or a combination of deficiencies, in internal control that is less severe than a material weakness, yet important enough to merit attention by those charged with governance.
146
350 !Main (}(pad; Suiu 104 !M.ont1lilfe, Xl 0704J
973-953-7769 p~ 973-625-8733 .Email: tm1l1.a6eUl ... [email protected]

K-l Sheet 2
Our consideration of internal control over fmancial reporting was for the limited purpose described in the fIrst paragraph of this section and was not designed to identify all defIciencies in internal control over fmancial reporting that might be signifIcant defIciencies or material weaknesses. Given these limitations, during our audit we did not identify any defIciencies in internal control over fmancial reporting that we consider to be material weaknesses. However, material weaknesses may exist that have not been identifIed.
Compliance and Other Matters
As part of obtaining reasonable assurance about whether the Borough of Fair Lawn's fmancial statements are free of material misstatement, we performed tests of its compliance with certain provisions of laws, regulations, contracts, and grant agreements, noncompliance with which could have a direct and material effect on the determination of fmancial statement amounts. However, providing an opinion on compliance with those provisions was not an objective of our audit, and accordingly, we do not express such an opinion. The results of our tests disclosed no instances of noncompliance or other matters that are required to be reported under Government Auditing Standards.
Purpose of This Report
The purpose of this report is solely to describe the scope of our testing of internal control and compliance and the results of that testing, and not to provide an opinion on the effectiveness of the Borough of Fair Lawn's internal control or on compliance. This report is an integral part of an audit performed in accordance with Government Auditing Standards in considering the Borough of Fair Lawn's internal control and compliance. Accordingly, this communication is not suitable for any other purpose.
Montville, New Jersey October 9, 2015
147
Q11!.£JL Timothy M. Vrabel Public School Accountant License No. CS000698
) It"...-, ,/ ' " ( . ~(,~ .~ . /- )
/ / / Chris C. W. Hwang (.--/ CertifIed Public Accountant License No. CC033704

~~ .• ~ q: 5W. o/ra6eC ~;4.ssociates, ££C
;4.ccountants anti;4. uditors
tzimotliy ~. 1Ira6" ~, ~~ cliris C. J{wang, ()P~
,,<.' .;:.w< . .
' .. ; ..
tJ.:' l
K-2 Sheet I
REPORT ON COMPLIANCE FOR EACH MAJOR PROGRAM; REPORT ON INTERNAL CONTROL OVER COMPLIANCE; REPORT ON SCHEDULES OF EXPENDITURES OF FEDERAL A WARDS AND STATE
FINANCIAL ASSISTANCE REOUIRED BY OMB CIRCULAR A-133 AND
The Honorable President and Members of the Board of Education Borough of Fair Lawn County of Bergen, New Jersey
NEW JERSEY OMB CIRCULAR LETTER 15-08
INDEPENDENT AUDITOR'S REPORT
Report on Compliance for Each Major Federal and State Program
We have audited the Borough of Fair Lawn's compliance with the types of compliance requirements described in the U.S. Office of Management and Budget COMB) Circular A-133 Compliance Supplement and the New Jersey Compliance Manual State Grants Compliance Supplement that could have a direct and material effect on each of its major federal and state programs for the year ended June 30, 2015. Borough of Fair Lawn's major federal and state programs are identified in the Summary of Auditor's Results Section of the accompanying schedule offmdings and questioned costs.
Management's Responsibility
Management is responsible for compliance with the requirements of laws, regulations, contracts and grants applicable to its federal and state programs.
Auditor's Responsibility
Our responsibility is to express an opinion on compliance for each of Borough of Fair Lawn's major federal and state programs based on our audit of the types of compliance requirements referred to above. We conducted our audit of compliance in accordance with auditing standards generally accepted in the United States of America; the standards applicable to financial audits contained in Government Auditing Standards, issued by the Comptroller General of the United States; in compliance with the audit requirements as prescribed by the Office of School Finance, Department of Education, State of New Jersey; OMB Circular A-I33, Audits of States, Local Governments, and Non-Profit Organizations; and New Jersey Office of Management and Budget Circular Letter 15-08 Single Audit Policy for Recipients of Federal Grants, State Grants and State Aid. Those
148
350 !Main tJ(paJ; Suiu 104 !Mont1lilTe, NJ 07045
973-953-7769 p~ 973-625-8733 ~maiJ: tmvra6eUf'[email protected]

K-2 Sheet 2
standards, OMB Circular A-I33 and New Jersey OMB's Circular Letter 15-08 require that we plan and perform the audit to obtain reasonable assurance about whether noncompliance with the types of compliance requirements referred to above that could have a direct and material effect on a major federal and state program occurred. An audit includes examining, on a test basis, evidence about Borough of Fair Lawn's compliance with those requirements and performing such other procedures as we considered necessary in the circumstances.
We believe that our audit provides a reasonable basis for our opinion. Our audit does not provide a legal determination of Borough of Fair Lawn's compliance with those requirements.
Opinion on Each Major Federal and State program
In our opinion, the Borough of Fair Lawn, in the County of Bergen, State of New Jersey, complied, in all material respects, with the types of compliance requirements referred to above that could have a direct and material effect on each of its major federal and state programs for the year ended June 30, 2015.
Report on Internal Control Over Compliance
The management of Borough of Fair Lawn is responsible for establishing and maintaining effective internal control over compliance with the types of compliance requirements referred to above. In planning and performing our audit of compliance, we considered Borough of Fair Lawn's internal control over compliance with the types of requirements that could have a direct and material effect on a major federal or state program to determine the auditing procedures that are appropriate in the circumstances for the purpose of expressing an opinion on compliance and to test and report on internal control over compliance in accordance with OMB Circular A-I33 and New Jersey OMB Circular 15-08, but not for the purpose of expressing an opinion on the effectiveness of the Borough of Fair Lawn's internal control over compliance. Accordingly, we do not express an opinion on the effectiveness of the Borough of Fair Lawn's internal control over compliance.
A deficiency in internal control over compliance exists when the design or operation of a control over compliance does not allow management or employees, in the normal course of performing their assigned functions, to prevent or detect and correct noncompliance with a type of compliance requirement of a federal or state program on a timely basis. A material weakness in internal control over compliance is a deficiency, or combination of deficiencies in internal control over compliance, such that there is a reasonable possibility that material noncompliance with a type of compliance requirement of a federal or state will not be prevented or detected and corrected, on a timely basis. A significant deficiency in internal control over compliance is a deficiency, or a combination of deficiencies, in internal control over compliance with a type of compliance requirement of federal or state program that is less severe than a material weakness in internal control over compliance, yet important enough to merit attention by those charged with governance.
Our consideration of internal control over compliance was for the limited purpose described in the first paragraph of this section and was not designed to identify all deficiencies in internal control over compliance that might be significant deficiencies or material weaknesses. We did not identify any deficiencies in internal control over compliance that we consider to be material weaknesses. However, material weaknesses may exist that have not been identified.
The purpose of this report on internal control over compliance is solely to describe the scope of our testing of internal control over compliance and the results of that testing based on the requirements ofOMB Circular A-I33 and New Jersey OMB Circular 15-08. Accordingly, this report is not suitable for any other purpose.
149

K-2 Sheet 3
Report on Schedules of Expenditures of Federal Awards and State Financial Assistance Required by OMB Circular A 133 and New Jersey OMB Circular 15-08
We have audited the financial statements of the Borough of Fair Lawn as of and for the year ended June 30, 2015, and havt issued our report thereon dated October 9, 2015, which contained an unmodified opinion on those fmancial statements. AU audit was conducted for the purpose of forming an opinion on the financial statements as a whole. The accompanyin! Schedules of Expenditures of Federal Awards and State Financial Assistance are presented for purposes of additional analysi: as required by OMB Circular A-133 and New Jersey OMB Circular 15-08 and is not a required part of the financial statements Such information is the responsibility of management and was derived from and relates directly to the underlying accountin, and other records used to prepare the financial statements. The information has been subjected to the auditing procedure: applied in the audit of the financial statements and certain additional procedures, including comparing and reconciling sud information directly to the underlying accounting and other records used to prepare the financial statements or to the financia statements themselves, and other additional procedures in accordance with aUditing standards generally accepted in the Unite( States of America. In our opinion, the Schedules of Expenditure of Federal Awards and State Financial Assistance are fairl~ stated in all material respects in relation to the financial statements as a whole.
Montville, New Jersey October 9, 2015
150
Timothy M. Vrabel Public School Accountant License No. CS000698
'l//I ~.~(?z)
Chris C. W. Hwang Certified Public Accountant License No. CC033704

...... U1 ......
_ ora-..u-lbrougII
Graotal1Pl'DClnlm TItle
U.S. Depallmenl ofTrusury: _R_ Tatli U.S. DepaI1monI of Trusury
u.s. DepatIment of Agric:utIunt Passedl1wugh _ DepaI1monI of EducaIIon:
Food DisIribuIlon Program Food ~ Program NatIonal S<:hooI Lunch Program Regular __ Program
TOIaI U.S. DepaI1monI of Agric:uIIut8
u.s. Department of Education Pas5ed -l1vough _ Department of Education:
SpecIal Revenue Funds:
Federal CFDA or_
flI!!m!!!I:
93.n8
10.550 10.550 10.555 10.553
E.S.EA TIlle I 84.01OA E.S.EA TIlle II A 84.367" E.S.EA TIlle III 84.365A I.D.EA Part B, Basic 84.027A I.D.EA Part B. Prachoal 84.173-'
TCICaI U.S. DepaI1men\ of Education (Fund 2Il)
TOIaI F_ FInancial AssI_
GIant fId!!!t
711114-6130115
711114-6130115 711113-&10114 711114-6130115 711114-6130115
711114-6130115 711114-6130115 711114-6130115 711114-6130115 711114-&'30115
A_nI Am2IIDl
151 ,629.79 $
34,308.79 72,730.14
234,823.80 2.574.45
288,197.00 85,011 .00 40,412.00
1,093,848.00 34,1811.00
$
BaJance ~
2,2156.65
2,266.65
BOARD OF EDUCATION BOItOUGH OF FAIR LAWN
__ of ExpendIIures of FedenI A_nls. __ A
Fara. FlICaI V.., ~ June 38. 2015
BUDGETARY DIIby""""", ~s -
$ S
cash BIsII!I
K~
BOARD OF EDUCA110N BOROUGH OF FAIR LAWN
Schedule of Expenditunl:s of Stale Financial Assistance. Schedule B Forlhe fiscal Year Ended June 30, 2915
1I!!Il!!EIA!!Y ~1!Ef,lI!!II.IRIa Repayment of Balince June 30 2015 Grant or State Grant Award Balance Cash Accounts PriorYeafS' Accounts DeI.nwd OualD
Stale GrantortPnHI£iilm Title Proiect Number I!!!i!!!I &!l2!!!!1 .!!!IlLL.1!!1! ~ ~ Olsbu!Stl!lents ~ Encumbrances I2III ~ ~ I!!l!!nl!2 liwII2I:
state Department of Education:
General Funds: Equalization Aid 1~!r.HIJ.4-5120-078 7/1/14-6130115 $ 147,343.00 $ 46,819.74 (1) $ 92,115,17 147,343.00 $ 147,343.00 $ (8,408.09) $ Equalization Aid 1~95-0J.4-5120-078 7I1/1J.6/30114 147,343.00 (9,879.35) 9,879.35 Categorical Transportation Aid 1~!r.HIJ.4-5120-014 7/1/14-6/30115 198,378.00 187,057.63 198,378.00 198,378.00 (11,320.37) Categorical Transportation Aid 1~95-0J.4-5120-014 7I1/1J.6/J0/14 198,378.00 (13,30125) 13,30125 Categorical Special Education Aid 1~95-0J.4-5120-089 7/1/14-6/30/15 2,837,781.00 2,675,844.01 2,837,781.00 2,837,781.00 (161,936.99) Calegorical Special EdU<ation Aid 1~95-0J.4-5120-089 711/13-6/30114 2,837,781.00 (190,273.31) 190,273.31 Categorical Security Aid 1~95-0J.4-5120-084 711/14-6130115 86.295.00 81,370.61 86.295.00 86,295.00 (4,924.39) Categorical Security Aid 1~95-0J.4-5120-084 711/13-6/30114 86,295.00 (5,786.09) 5,786.09 Per Pupil Growth Aid 1 ~!r.HIJ.4-5120-097 711/14-6/30115 45,520.00 42,922.42 45,529.00 45,529.00 (2.597.58) PARCC Rea1linass Aid 1~!r.HIJ.4-5120-098 7/1/14-6/30115 45,520.00 42,922.42 45,529.00 45,529.00 (2.597.58) Ex1raanlinary Aid 15-100-1lJ.4-51~73 7/1/14-6130115 1,991,403.00 1,991,403.00 1,991,403.00 (1,991,403.00) Ex1raordlnary Aid 14-1D0-0J.4-512~73 711/1 J.6/3OI14 1,616,246.00 (1,616,246.00) 1,616,246.00 Noo-Public Transportation Aid 1~!r.HIJ.4-5120-014 711/14-6130115 58,666.00 58,666.00 58,666.00 (58,666.00) Non-Public Transportation Aid 1~95-0J.4-5120-014 7I1/1J.6/JD/14 52,946.00 (52,946.00) 52,946.00 Reimbursed TPAF Social Security Cootribution 1 ~!r.HIJ.4-5D95-002 711/14-6130115 2,792,049.45 2,652,785.18 2,792,049.45 2,792,049.45 (139,26427) Rolmbursed TPAF Social Security Cootribution 1~!r.HIJ.4-5D95-002 711/1 J.6/J0/14 2,752,225.90 (138,363.33) 138,363.33 On-aahaH TPAF Pension Conbibulions 1~!r.HIJ.4-5D95-001 711/14-6130115 2,019,583.00 2,019,583.00 2,019,583.00 2,019,583.00 On-BehaIfTPAF PRM Conbibulions 1 ~!r.HIJ.4-5D95-001 7/1/14-6130115 3,206,088.00 3~,O88.00 3,206,088.00 3,206,088.00
Total General Funds g 026l95.33) 46819.74 13027,483.77 13,428,626.45 1314281626.45 !<!,381,1182!)
Special Revenue Funds: New Jenoey NonpubUc Aid:
Textbook Aid 15-1 DO-Q34-5120-064 711/14-6130115 15,194.00 15,194.00 15,184.48 15,184.48 9 .52 Textbook Aid 14-100-034-5120-064 711/1 J.6I3OI14 16,128.00 723.32 (723.32) (1) AUdiiHy Sorvices:
Compensatory Education 15-100-1lJ.4-5120-067 711/14-6/30/15 129,891.00 129,891.00 107,943.90 107.943.90 21,947.10 Compensatory Education 14-100-1lJ.4-5120-067 711/1J.6/JD/14 154,076.00 26,449.10 (26,449.10) (1)
...... Engish as a Second Language 15-1 00-Il34-5120-067 7/1114-6/30/15 1,827.00 1,827.00 913.50 913.50 913.50
U1 English as a Second Language 14-100-1l34-5120-067 711/1 J.6/JD/14 4,016.00 1,222.72 (1,222.72) (1)
""' Handicapped Services:
Examination and Classification 15-1 00-IlJ.4-5120-066 7/1/14-6/30115 38,724.00 38,724.00 34,936.92 34,936.92 3,787.08 Examination and Classibtion 14-100-1l34-5120-066 7/1/13-6/30114 32,807.00 3,505.00 (3,505.00) (1) Comtdive Speech 15-100-1lJ.4-5120-066 7/1/14-6/30115 29,232.00 20,232.00 14,312.70 14,312.70 5,919.30 Corrective Speech 14-1 00-IlJ.4-5120-066 7/1/13-6/3D/14 29,311.00 11,092.84 (11,D92.84) (1) Supplementary Instruction 15-100-1lJ.4-5120-068 7/1/14-6130115 28,721.00 28,721.00 26,522.86 26,522.86 2,198.14 Supplementary Instrucbon 14-1 00-IlJ.4-512Q.Q66 711/13-6/30114 24,978.00 3,122.16 (3,122.16) (1)
Nursing Senrices 15-100-1lJ.4-5120-070 7/1/14-6130115 24,187.00 24,187.00 23,028.63 725.61 23,75424 432.76 Nursing Sorvicus 14-100-1lJ.4-5120-070 711/13-6/30114 22.156.00 664.68 (664.66) (1) Technology Initiative 15-100-1lJ.4-512D-373 7/1/14-6130115 8,180.00 8,160.00 8,159.98 8,159.98 0.D2 Technology 1_ 14-100-1lJ.4-512D-373 711/1 J.6I3OI14 5,880.00 39.94 ~9.94) (1)
T .... I Special Revenue Funds 46,819.74 (46,819.74) 266,936.00 231,002.97 725.61 231,728.58 35,207.42
Capital Projod Funds: N.J. Schools Development Au1hority Grant SP1450-05D-14-G1DQ 801,408.00 3,764.46 3,764.46 (3,764.46) N.J. Schools Development Au1hority Grant SP1450-D60-14-G1DS 370,DBD.00 114,523.48 114,523.48 (114,523.48) N.J. School& OeveJopmani AuIhorily Grant SP1450-085-14-G1 DU 205.640.00 1,020.89 1.020,89 (1,020.89) N.J. Schools Development Au1hority Grant SP145D-1DD-14-G1DV 271,311.00 1,360.38 1,360.38 (1,360.38) N.J. Schools Development Authority Grant SP145D-141l-14-G1DY 246,720.00 12,618.78 12,618.78 (12,618.78) N.J. Schools Development Authority Grant SP1450-160-14-G1EA 297,855.00 14223.18 14,223.18 (14223.18) N.J. Schools Oevelopment Au1hority Grant SP1450-05D-14-G1DR 232,400.00 13,792.00 13,792.00 (13,792.00) N.J. Schools Development Au1hority Grant SP1450-071l-14-G1DT 349,660.00 19,4411.00 19,448.00 (19,448.00) N.J. Schools Development Au1hority Grant SP145D-llIl-14-G1DW 20,DBD.00 1,329.00 1,32900 (1,320.00) N.J. Schools Development Authority Grant SP145D-131l-14-GlOX 325,060.00 17,664.00 17,664_00 (17,664.00) N.J. Schools Development Au1hority Grant SP145D-14D-14-G1DZ 140,180.00 11~9.60 11.269.60 (11.269.60)
T .... I Capital Project Funds 211,004.77 211,004.77 (211,OO4.m
Enterprise Funds: State School Lunch Program 15-100-1l11l-3350-023 7/1/14-6/30115 11,157.13 10,303.31 11,157.13 11,157_13 (853.82)
10,303.31 11,157.13 ---- 11,157.13 (853.82)
T .... IAIIFunds $ (1,979,975.59) 10.00) 13,304,723.08 13,881,791.32 ~ 13,882.516.93 (2,592,976.86) _$ ___ - _ $ 35,207.42
(1) Reallocated
The accompanying Notes to Schedules of Awards and Financial Ass5tance are an integml part of this schedule.

BOARD OF EDUCATION BOROUGH OF FAIR LAWN
NOTES TO SCHEDULES OF EXPENDITURES OF AWARDS AND FINANCIAL ASSISTANCE YEAR ENDED JUNE 30, 2015
Note I: General
K-5 Sheet I
The accompanying schedules of expenditures of awards and financial assistance present the activity of all federal and state programs of the Borough of Fair Lawn School District Board of Education. The Board of Education is defined in NoteI:B. to the Board's basic fmancial statements. All federal awards and state financial assistance received directly from federal and state agencies, as well as federal awards and state financial assistance passed through o~her government agencies is included on the schedule of expenditures of federal awards and state financial assistance.
Note 2: Basis of Accounting
The accompanying schedules of expenditures of awards and fmancial assistance are presented using the budgetary basis of accounting with the exception of programs recorded in the food service fund, which are presented using the accrual basis of accounting. These bases of accounting are described in Notes I:E and Note I:F. to the Board's basic fmancial statements. The information in the schedules is presented in accordance with the requirements of OMB Circular A-133, Audits of States, Local Governments, and Non-Profit Organizations. Therefore, some amounts presented in the schedules may differ from amounts presented in, or used in the preparation of, the basic fmancial statements.
Note 3: Relationship to Basic Financial Statements
The basic financial statements present the general fund and special revenue fund on a GAAP basis. Budgetary comparison statements or schedules are presented for the general fund and special revenue fund to demonstrate fmance-related legal compliance in which certain revenue is permitted by law or grant agreement to be recognized in the audit year, whereas for GAAP reporting, revenue is not recognized until the subsequent year or when expenditures have been made.
The general fund is presented in the accompanying schedules on the modified accrual basis with the exception of the revenue recognition of the one or more deferred June state aid payments in the current budget year, which is mandated pursuant to NJ.S.A. I SA:22-44.2. For GAAP purposes, payments are not recognized until the subsequent year due to the state deferral and recording of the state aid payments in the subsequent year. The special revenue fund is presented in the accompanying schedules on the grant accounting budgetary basis which recognizes encumbrances as expenditures and also recognizes the related revenues, whereas the GAAP basis does not. The special revenue fund also recognizes the one or more deferred June state aid payments in the current budget year, consistent with NJ.S.A. ISA:22-44.2.
153

BOARD OF EDUCATION BOROUGH OF FAIR LAWN
NOTES TO SCHEDULES OF EXPENDITURES OF A WARDS AND FINANCIAL ASSISTANCE YEAR ENDED JUNE 30, 2015
(CONCLUDED)
K-5 Sheet 2
Note 3: Relationship to Basic Financial Statements (Continued)
Note 4:
The net adjustment to reconcile from the budgetary basis to the GAAP basis is $27,455.00 for the general fund and $ -0- for the special revenue fund. See the Notes to Required Supplementary Information for a reconciliation of the budgetary basis to the GAAP basis of accounting for the general and special revenue funds. Awards and financial assistance revenues are reported in the Board's basic fmancial statements on a GAAP basis as follows:
Federal State Total General Fund $ 173,346.58 $ 11,436,498.45 $ 11,609,863.03 Special Revenue Fund 1,521,178.00 231,728.58 1,752,906.58 Food Service Fund 271,707.04 11.157.13 282,864.17
Total Awards and Financial Assistance $ 1.966,249.62 $ 11.679.384.16 $ 13.645.633.78
Relationship to Federal and State Financial Reports
Amounts reported in the accompanying schedules agree with the amounts reported in the related federal and state financial reports.
Note 5: Other
Revenues and expenditures reported under the Food Distribution Program represent current year value received and current year distributions respectively. The amount reported as TPAF Pension Contributions represents the amount paid by the state on behalf of the district for post-retirement medical benefits and the normal and accrued liability pension costs for the year ended June 30, 2015. TPAF Social Security Contributions represents the amount reimbursed by the state for the employer's share of social security contributions for TPAF members for the year ended June 30, 2015.
154

BOARD OF EDUCATION BOROUGH OF FAIR LAWN
SCHEDULE OF FINDINGS AND OUESTIONED COSTS FOR THE YEAR ENDED JUNE 30, 2015
Part I - Summary of Auditor's Results Financial Statement Section
A) Type of auditor's report issued:
B) Internal Control over fmancial reporting:
1) Material weakness( es) identified? 2) Were significant deficiencies identified
that were not considered to be material weaknesses?
C) Noncompliance material to basic financial statements noted?
Federal Awards Section
D) Dollar threshold used to determine Type A programs
E) Auditee qualified as low-risk auditee?
F) Type of auditor's report on compliance for major programs
G) Internal Control over compliance:
1) Material weakness(es) identified? 2) Were significant deficiencies identified
that were not considered to be material weaknesses?
H) Any audit findings disclosed that are required to be reported in accordance with OMB Circular A-133 (section .510 (a))?
I) Identification of major programs:
CFDA Numberfs)
84.027A
84.173A
155
Unmodified
__ ---Jyes X no
----Yes, __ ~X~ __ nonereported
__ ---Jyes X no
$ 300,000.00
_~X~-.Jyes ___ no
Unmodified
__ ---Jyes X no
----yes X none reported
__ -.Jyes X no
Name of Federal Program or Cluster
I.D.E.A Part B. Basic
I.D.E.A. Part B Preschool
K-6 Sheet 1

BOARD OF EDUCATION BOROUGH OF FAIR LAWN
SCHEDULE OF FINDINGS AND OUESTIONED COSTS FOR THE YEAR ENDED JUNE 30, 2015
Part I - Summary of Auditor's Results (Continued)
State Financial Assistance Section
J) Dollar threshold used to detennine Type A Programs
K) Auditee qualified as low-risk auditee?
L) Type of auditor's report on compliance for major programs.
M) Internal Control over compliance:
1) Material weakness(es) identified? 2) Were significant deficiencies identified
that were not considered to be material weaknesses?
N) Any audit findings disclosed that are required to be reported in accordance with N.J. OMB Circular 15-08?
0) Identification of major programs:
GMIS Number(s)
\5-495-034-5120-078
\5-100-034-5120-089
\5-495-034-5120-084
\5-495-034-5120-097
\5-495-034-5120-098
\5-100-034-5120-473
\5-495-034-5095-002
156
$ 300,000.00
X yes ___ no
Unmodified
~no
-yes ~none reported
~no
Name of State Program
Equalization Aid
Categorical Special Education Aid
Categorical Security Aid
Per Pupil Growth Aid
PARCC Readiness Aid
Extraordinary Aid
Reimbursed TPAF Social Security Contribution
K-6 Sheet 2

BOARD OF EDUCATION BOROUGH OF FAIR LA WN
SCHEDULE OF FINDINGS AND QUESTIONED COSTS FOR THE YEAR ENDED JUNE 30, 2015
(CONTINUED)
Part 2 - Schedule of Financial Statement Findings
K-6 Sheet 3
This section identifies the significant deficiencies, material weaknesses, and instances of noncompliance related to the basic fmancial statements that are required to be reported in accordance with Chapter 5.18 of Government Auditing Standards.
Not Applicable
157

BOARD OF EDUCATION BOROUGH OF FAIR LAWN
SCHEDULE OF FINDINGS AND OUESTIONED COSTS FOR THE YEAR ENDED JUNE 30, 2015
(CONTINUED)
Part 3 - Schedule of Federal Awards and State Financial Assistance Findings and Questioned Costs
K-6 Sheet 4
This section identifies the significant deficiencies, material weaknesses, and instances of noncompliance, including questioned costs, related to the audit of major federal and state programs, as required by OMB Circular A-l33 and New Jersey OMB's Circular 15-08.
Not Applicable
158
BOARD OF EDUCATION BOROUGH OF FAIR LAWN
SUMMARY SCHEDULE OF PRIOR-YEAR AUDIT FINDINGS AND OUESTIONED COSTS
FOR THE YEAR ENDED JUNE 30. 2015
K-7
This section identifies the status of prior-year findings related to the basic financial statements and federal and state awards that are required to be reported in accordance with Chapter 6.12 of Government Auditing Standards, U.S. OMB Circular A-133 (section .315 (a) (b)) and New Jersey OMB's Circular 15-08.
Not Applicable
159