comprehensive housing market analysis for fargo, nd€¦ · fargo north dakotaminnesota...
TRANSCRIPT
COMPREHENSIVE HOUSING MARKET ANALYSIS
Fargo, North Dakota-
U.S. Department of Housing and Urban Development, Office of Policy Development and Research
As of July 1, 2019
Minnesota
Share on:
Executive Summary 2Fargo, North Dakota-Minnesota Comprehensive Housing Market Analysis as of July 1, 2019
Comprehensive Housing Market Analysis Fargo, North Dakota-Minnesota U.S. Department of Housing and Urban Development, Office of Policy Development and Research
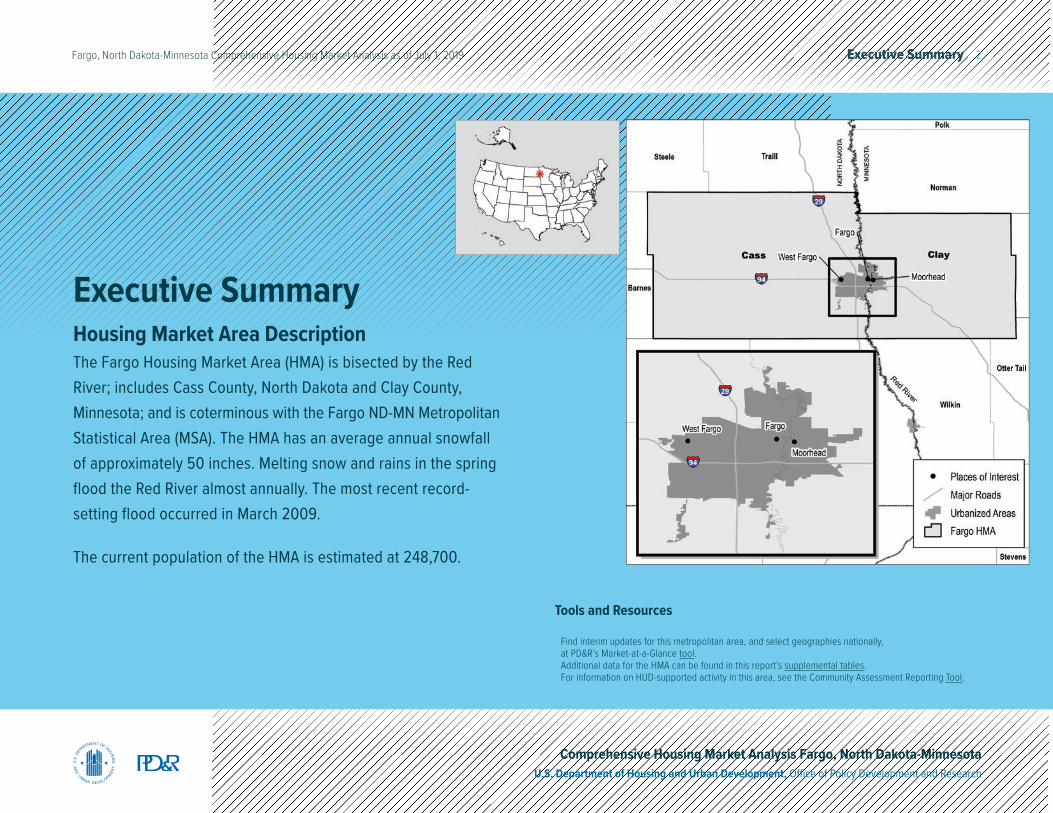
Executive SummaryHousing Market Area DescriptionThe Fargo Housing Market Area (HMA) is bisected by the Red River; includes Cass County, North Dakota and Clay County, Minnesota; and is coterminous with the Fargo ND-MN Metropolitan Statistical Area (MSA). The HMA has an average annual snowfall of approximately 50 inches. Melting snow and rains in the spring flood the Red River almost annually. The most recent record-setting flood occurred in March 2009.
The current population of the HMA is estimated at 248,700.
Tools and Resources
Find interim updates for this metropolitan area, and select geographies nationally, at PD&R’s Market-at-a-Glance tool.Additional data for the HMA can be found in this report’s supplemental tables.For information on HUD-supported activity in this area, see the Community Assessment Reporting Tool.
Executive Summary 3Fargo, North Dakota-Minnesota Comprehensive Housing Market Analysis as of July 1, 2019
Comprehensive Housing Market Analysis Fargo, North Dakota-Minnesota U.S. Department of Housing and Urban Development, Office of Policy Development and Research
Market Qualifiers
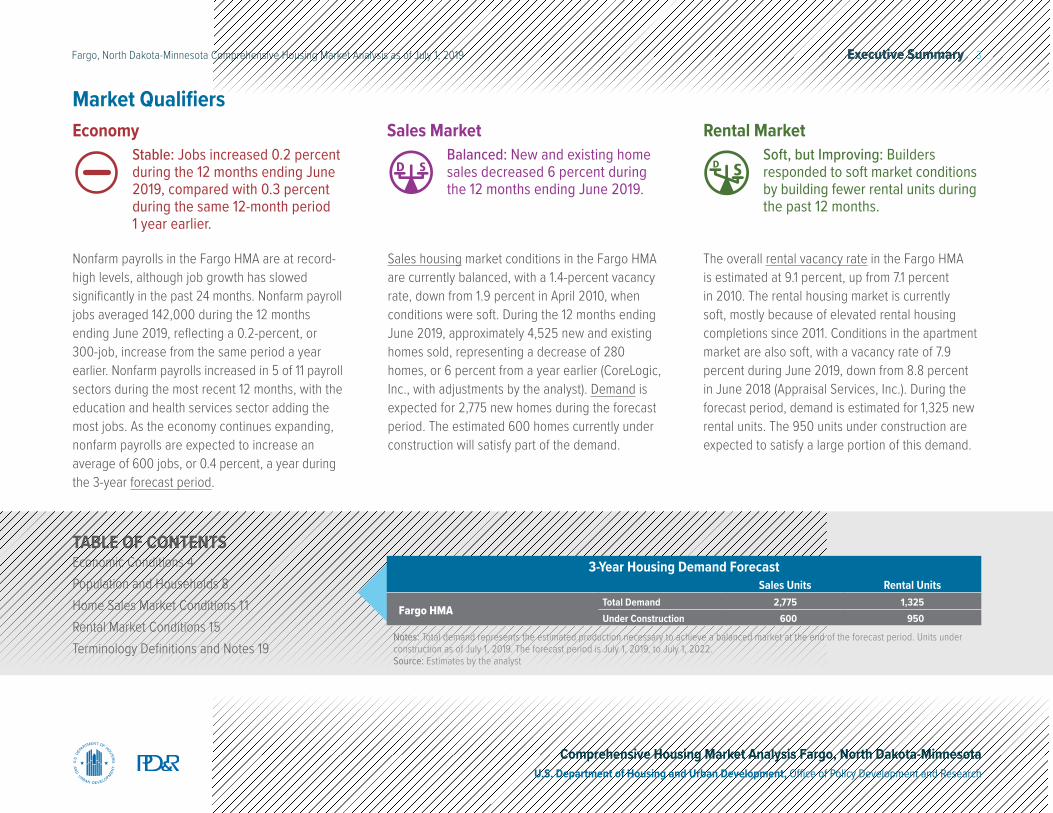
Nonfarm payrolls in the Fargo HMA are at record-high levels, although job growth has slowed significantly in the past 24 months. Nonfarm payroll jobs averaged 142,000 during the 12 months ending June 2019, reflecting a 0.2-percent, or 300-job, increase from the same period a year earlier. Nonfarm payrolls increased in 5 of 11 payroll sectors during the most recent 12 months, with the education and health services sector adding the most jobs. As the economy continues expanding, nonfarm payrolls are expected to increase an average of 600 jobs, or 0.4 percent, a year during the 3-year forecast period.
Sales housing market conditions in the Fargo HMA are currently balanced, with a 1.4-percent vacancy rate, down from 1.9 percent in April 2010, when conditions were soft. During the 12 months ending June 2019, approximately 4,525 new and existing homes sold, representing a decrease of 280 homes, or 6 percent from a year earlier (CoreLogic, Inc., with adjustments by the analyst). Demand is expected for 2,775 new homes during the forecast period. The estimated 600 homes currently under construction will satisfy part of the demand.
The overall rental vacancy rate in the Fargo HMA is estimated at 9.1 percent, up from 7.1 percent in 2010. The rental housing market is currently soft, mostly because of elevated rental housing completions since 2011. Conditions in the apartment market are also soft, with a vacancy rate of 7.9 percent during June 2019, down from 8.8 percent in June 2018 (Appraisal Services, Inc.). During the forecast period, demand is estimated for 1,325 new rental units. The 950 units under construction are expected to satisfy a large portion of this demand.
EconomyStable: Jobs increased 0.2 percent during the 12 months ending June 2019, compared with 0.3 percent during the same 12-month period 1 year earlier.
Rental MarketSoft, but Improving: Builders responded to soft market conditions by building fewer rental units during the past 12 months.
Sales MarketBalanced: New and existing home sales decreased 6 percent during the 12 months ending June 2019.
TABLE OF CONTENTSEconomic Conditions 4Population and Households 8Home Sales Market Conditions 11Rental Market Conditions 15Terminology Definitions and Notes 19
Notes: Total demand represents the estimated production necessary to achieve a balanced market at the end of the forecast period. Units under construction as of July 1, 2019. The forecast period is July 1, 2019, to July 1, 2022. Source: Estimates by the analyst
3-Year Housing Demand Forecast Sales Units Rental Units
Fargo HMATotal Demand 2,775 1,325Under Construction 600 950
Economic Conditions 4Fargo, North Dakota-Minnesota Comprehensive Housing Market Analysis as of July 1, 2019
Comprehensive Housing Market Analysis Fargo, North Dakota-Minnesota U.S. Department of Housing and Urban Development, Office of Policy Development and Research
Mining, Logging, & Construction 6%
Manufacturing 7%
Wholesale 6%
Retail 11%
Transportation & Utilities 4%
Information 2%
Financial Activities 8%
Professional & Business Services 11%
Health 16%
Education 2%
Leisure & Hospitality 10%
Other Services 4%
Federal 1%State 4%
Local 8%
Government 13%
Education & Health Services
18%
Trade 17%Total142.0
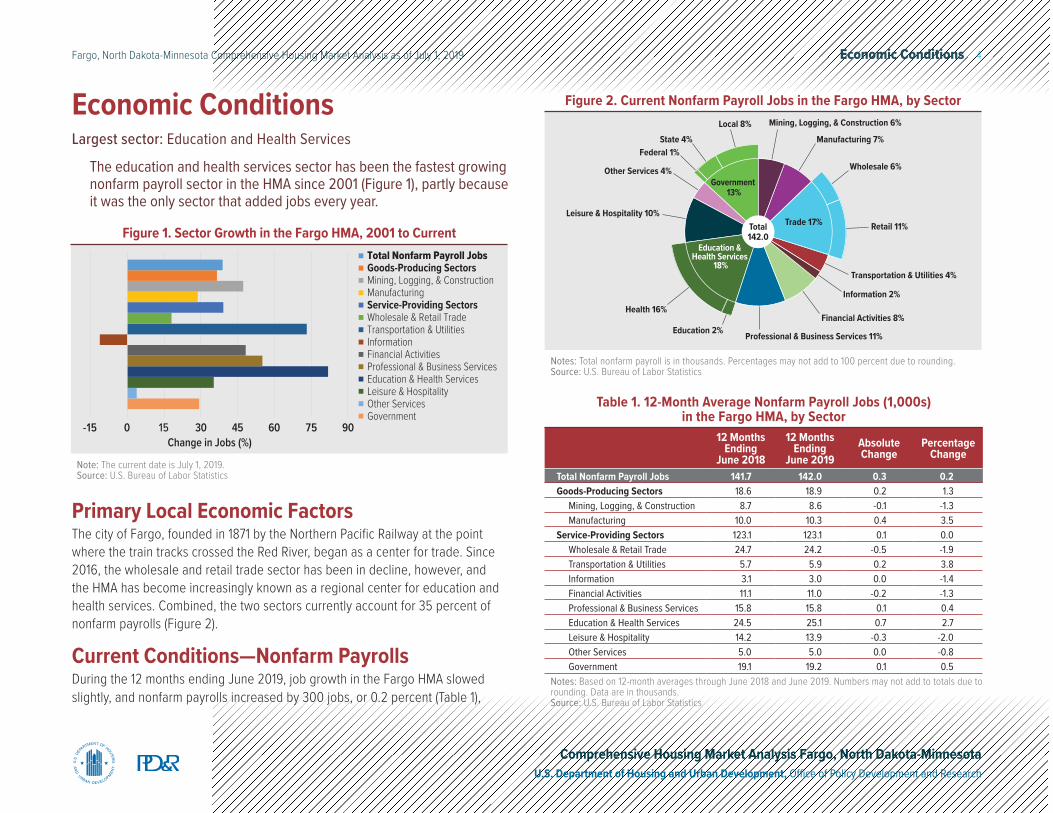
Notes: Total nonfarm payroll is in thousands. Percentages may not add to 100 percent due to rounding.Source: U.S. Bureau of Labor Statistics
Figure 2. Current Nonfarm Payroll Jobs in the Fargo HMA, by Sector
Primary Local Economic FactorsThe city of Fargo, founded in 1871 by the Northern Pacific Railway at the point where the train tracks crossed the Red River, began as a center for trade. Since 2016, the wholesale and retail trade sector has been in decline, however, and the HMA has become increasingly known as a regional center for education and health services. Combined, the two sectors currently account for 35 percent of nonfarm payrolls (Figure 2).
Current Conditions—Nonfarm PayrollsDuring the 12 months ending June 2019, job growth in the Fargo HMA slowed slightly, and nonfarm payrolls increased by 300 jobs, or 0.2 percent (Table 1),
Economic ConditionsLargest sector: Education and Health Services
The education and health services sector has been the fastest growing nonfarm payroll sector in the HMA since 2001 (Figure 1), partly because it was the only sector that added jobs every year.
-15 0 15 30 45 60 75 90Change in Jobs (%)
Total Nonfarm Payroll JobsGoods-Producing SectorsMining, Logging, & ConstructionManufacturingService-Providing SectorsWholesale & Retail TradeTransportation & UtilitiesInformationFinancial ActivitiesProfessional & Business ServicesEducation & Health ServicesLeisure & HospitalityOther ServicesGovernment
Figure 1. Sector Growth in the Fargo HMA, 2001 to Current
Note: The current date is July 1, 2019.Source: U.S. Bureau of Labor Statistics
Table 1. 12-Month Average Nonfarm Payroll Jobs (1,000s) in the Fargo HMA, by Sector
12 Months Ending
June 2018
12 Months Ending
June 2019Absolute Change
Percentage Change
Total Nonfarm Payroll Jobs 141.7 142.0 0.3 0.2Goods-Producing Sectors 18.6 18.9 0.2 1.3
Mining, Logging, & Construction 8.7 8.6 -0.1 -1.3Manufacturing 10.0 10.3 0.4 3.5
Service-Providing Sectors 123.1 123.1 0.1 0.0Wholesale & Retail Trade 24.7 24.2 -0.5 -1.9Transportation & Utilities 5.7 5.9 0.2 3.8Information 3.1 3.0 0.0 -1.4Financial Activities 11.1 11.0 -0.2 -1.3Professional & Business Services 15.8 15.8 0.1 0.4Education & Health Services 24.5 25.1 0.7 2.7Leisure & Hospitality 14.2 13.9 -0.3 -2.0Other Services 5.0 5.0 0.0 -0.8Government 19.1 19.2 0.1 0.5
Notes: Based on 12-month averages through June 2018 and June 2019. Numbers may not add to totals due to rounding. Data are in thousands.Source: U.S. Bureau of Labor Statistics
Economic Conditions 5Fargo, North Dakota-Minnesota Comprehensive Housing Market Analysis as of July 1, 2019
Comprehensive Housing Market Analysis Fargo, North Dakota-Minnesota U.S. Department of Housing and Urban Development, Office of Policy Development and Research
compared with a 500-job, or 0.3-percent growth rate during the 12 months ending June 2018. By comparison, the national growth rate was 1.7 percent during the 12 months ending June 2019. During that period, job gains in the HMA were mostly supported by the education and health services and the manufacturing sectors, which rose by 700 and 400 jobs, or 2.7 and 3.5 percent, respectively. In October 2018, Aldevron, LLC, a global manufacturer of plasmid DNA, opened a $30 million, 70,000-square-foot headquarters facility in the HMA. It is the largest DNA manufacturing facility in the world, employing 197 workers with capacity for about 270.
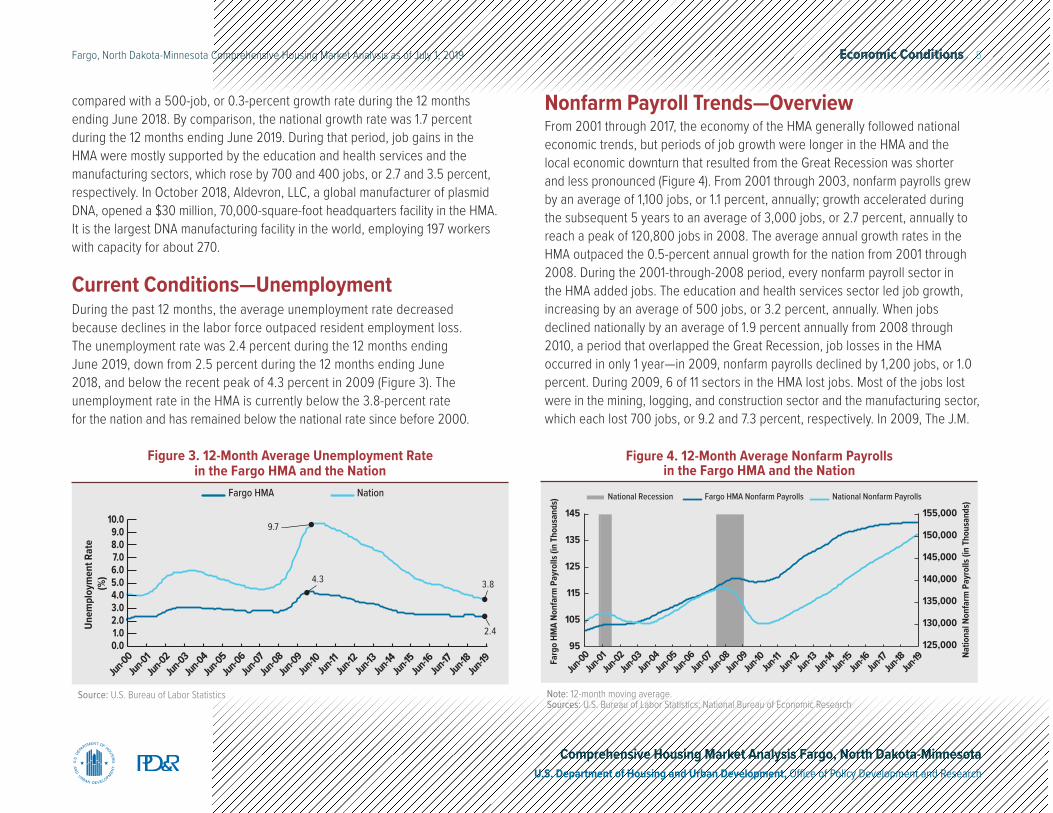
Current Conditions—UnemploymentDuring the past 12 months, the average unemployment rate decreased because declines in the labor force outpaced resident employment loss. The unemployment rate was 2.4 percent during the 12 months ending June 2019, down from 2.5 percent during the 12 months ending June 2018, and below the recent peak of 4.3 percent in 2009 (Figure 3). The unemployment rate in the HMA is currently below the 3.8-percent rate for the nation and has remained below the national rate since before 2000.
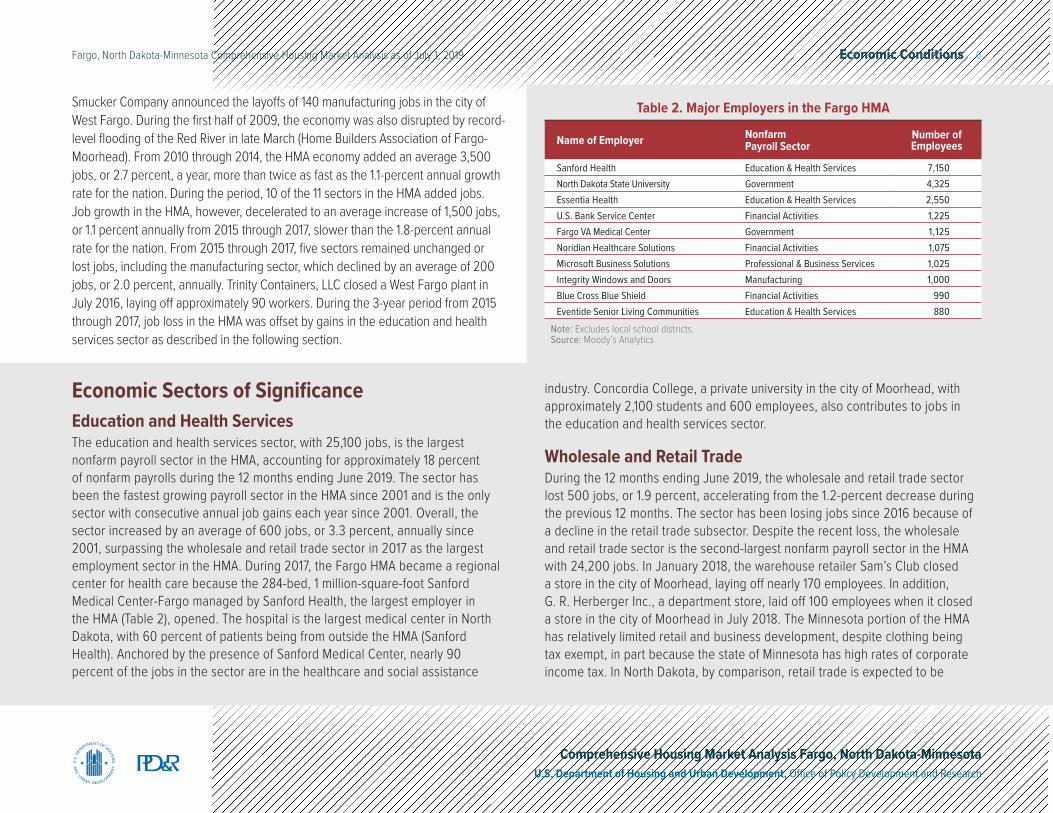
Nonfarm Payroll Trends—OverviewFrom 2001 through 2017, the economy of the HMA generally followed national economic trends, but periods of job growth were longer in the HMA and the local economic downturn that resulted from the Great Recession was shorter and less pronounced (Figure 4). From 2001 through 2003, nonfarm payrolls grew by an average of 1,100 jobs, or 1.1 percent, annually; growth accelerated during the subsequent 5 years to an average of 3,000 jobs, or 2.7 percent, annually to reach a peak of 120,800 jobs in 2008. The average annual growth rates in the HMA outpaced the 0.5-percent annual growth for the nation from 2001 through 2008. During the 2001-through-2008 period, every nonfarm payroll sector in the HMA added jobs. The education and health services sector led job growth, increasing by an average of 500 jobs, or 3.2 percent, annually. When jobs declined nationally by an average of 1.9 percent annually from 2008 through 2010, a period that overlapped the Great Recession, job losses in the HMA occurred in only 1 year—in 2009, nonfarm payrolls declined by 1,200 jobs, or 1.0 percent. During 2009, 6 of 11 sectors in the HMA lost jobs. Most of the jobs lost were in the mining, logging, and construction sector and the manufacturing sector, which each lost 700 jobs, or 9.2 and 7.3 percent, respectively. In 2009, The J.M.
10.09.08.07.06.05.04.03.02.01.00.0
Jun-00Jun-01
Jun-02Jun-03
Jun-04Jun-05
Jun-06Jun-07
Jun-08Jun-09
Jun-10Jun-11
Jun-12Jun-13
Jun-14Jun-15
Jun-16Jun-17
Jun-18Jun-19
Unem
ploy
men
t Rat
e (%
)
NationFargo HMA
3.8
2.4
9.7
4.3
Source: U.S. Bureau of Labor Statistics
Figure 3. 12-Month Average Unemployment Rate in the Fargo HMA and the Nation
145
135
125
115
105
95
155,000
150,000
145,000
140,000
135,000
130,000
125,000
National Recession Fargo HMA Nonfarm Payrolls National Nonfarm Payrolls
Farg
o HM
A No
nfar
m P
ayro
lls (i
n Th
ousa
nds)
Natio
nal N
onfa
rm P
ayro
lls (i
n Th
ousa
nds)
Jun-00Jun-01
Jun-02Jun-03
Jun-04Jun-05
Jun-06Jun-07
Jun-08Jun-09
Jun-10Jun-11
Jun-12Jun-13
Jun-14Jun-15
Jun-16Jun-17
Jun-18Jun-19
Note: 12-month moving average.Sources: U.S. Bureau of Labor Statistics; National Bureau of Economic Research
Figure 4. 12-Month Average Nonfarm Payrolls in the Fargo HMA and the Nation
Economic Conditions 6Fargo, North Dakota-Minnesota Comprehensive Housing Market Analysis as of July 1, 2019
Comprehensive Housing Market Analysis Fargo, North Dakota-Minnesota U.S. Department of Housing and Urban Development, Office of Policy Development and Research
Economic Sectors of SignificanceEducation and Health ServicesThe education and health services sector, with 25,100 jobs, is the largest nonfarm payroll sector in the HMA, accounting for approximately 18 percent of nonfarm payrolls during the 12 months ending June 2019. The sector has been the fastest growing payroll sector in the HMA since 2001 and is the only sector with consecutive annual job gains each year since 2001. Overall, the sector increased by an average of 600 jobs, or 3.3 percent, annually since 2001, surpassing the wholesale and retail trade sector in 2017 as the largest employment sector in the HMA. During 2017, the Fargo HMA became a regional center for health care because the 284-bed, 1 million-square-foot Sanford Medical Center-Fargo managed by Sanford Health, the largest employer in the HMA (Table 2), opened. The hospital is the largest medical center in North Dakota, with 60 percent of patients being from outside the HMA (Sanford Health). Anchored by the presence of Sanford Medical Center, nearly 90 percent of the jobs in the sector are in the healthcare and social assistance
Table 2. Major Employers in the Fargo HMA
Name of Employer Nonfarm Payroll Sector
Number of Employees
Sanford Health Education & Health Services 7,150North Dakota State University Government 4,325Essentia Health Education & Health Services 2,550U.S. Bank Service Center Financial Activities 1,225Fargo VA Medical Center Government 1,125Noridian Healthcare Solutions Financial Activities 1,075Microsoft Business Solutions Professional & Business Services 1,025Integrity Windows and Doors Manufacturing 1,000Blue Cross Blue Shield Financial Activities 990Eventide Senior Living Communities Education & Health Services 880
Note: Excludes local school districts.Source: Moody’s Analytics
industry. Concordia College, a private university in the city of Moorhead, with approximately 2,100 students and 600 employees, also contributes to jobs in the education and health services sector.
Wholesale and Retail TradeDuring the 12 months ending June 2019, the wholesale and retail trade sector lost 500 jobs, or 1.9 percent, accelerating from the 1.2-percent decrease during the previous 12 months. The sector has been losing jobs since 2016 because of a decline in the retail trade subsector. Despite the recent loss, the wholesale and retail trade sector is the second-largest nonfarm payroll sector in the HMA with 24,200 jobs. In January 2018, the warehouse retailer Sam’s Club closed a store in the city of Moorhead, laying off nearly 170 employees. In addition, G. R. Herberger Inc., a department store, laid off 100 employees when it closed a store in the city of Moorhead in July 2018. The Minnesota portion of the HMA has relatively limited retail and business development, despite clothing being tax exempt, in part because the state of Minnesota has high rates of corporate income tax. In North Dakota, by comparison, retail trade is expected to be
Smucker Company announced the layoffs of 140 manufacturing jobs in the city of West Fargo. During the first half of 2009, the economy was also disrupted by record-level flooding of the Red River in late March (Home Builders Association of Fargo-Moorhead). From 2010 through 2014, the HMA economy added an average 3,500 jobs, or 2.7 percent, a year, more than twice as fast as the 1.1-percent annual growth rate for the nation. During the period, 10 of the 11 sectors in the HMA added jobs. Job growth in the HMA, however, decelerated to an average increase of 1,500 jobs, or 1.1 percent annually from 2015 through 2017, slower than the 1.8-percent annual rate for the nation. From 2015 through 2017, five sectors remained unchanged or lost jobs, including the manufacturing sector, which declined by an average of 200 jobs, or 2.0 percent, annually. Trinity Containers, LLC closed a West Fargo plant in July 2016, laying off approximately 90 workers. During the 3-year period from 2015 through 2017, job loss in the HMA was offset by gains in the education and health services sector as described in the following section.
Economic Conditions 7Fargo, North Dakota-Minnesota Comprehensive Housing Market Analysis as of July 1, 2019
Comprehensive Housing Market Analysis Fargo, North Dakota-Minnesota U.S. Department of Housing and Urban Development, Office of Policy Development and Research
encouraged with the repeal of the ban on Sunday morning shopping which will take effect on August 1, 2019. From 2001 through 2015, the wholesale and retail trade sector increased by an average of 300 jobs, or 1.4 percent, annually, despite a 400-job decline in 2009.
GovernmentThe government sector has provided steady job growth in the HMA since 2002. With 19,200 jobs or approximately 13 percent of nonfarm payrolls, the government sector is the third-largest in the HMA. The local government subsector accounts for nearly two-thirds of all government sector payrolls and includes the Minnesota State Community and Technical College-Moorhead. State government subsector payrolls account for one-third of all government sector payrolls and include two state universities: Minnesota State University-Moorhead (MSUM) and North Dakota State University (NDSU). During the 2015-through-2016 fiscal year, NDSU had an economic impact of $927.3 million in North Dakota and the 18 counties in the western part of Minnesota (Emsi). MSUM has an annual economic impact of $285.5 million in Minnesota (MSUM, 2018). From 2002 through 2018, the government sector added an average of 300 jobs, or 1.6 percent annually, after losing 200 jobs, or 1.4 percent in 2001. Job gains during the 2002-through-2018 period resulted from average annual increases of 100 and 200 jobs, or 1.1 and 2.1 percent, respectively, at the state and local levels. In July 2018, construction was completed on a new $14.8 million Clay County Sheriff’s Office and the Moorhead Police Department center. Jobs in the federal government subsector remained unchanged from 2002 through 2018. During the 12 months ending June 2019, government sector jobs increased by 100, or 0.5 percent, from the previous 12-month period. A 3.3-percent increase in the local government subsector, which was partly because in September 2018 a new $30 million jail in Clay County that can house 188 inmates was completed, led job growth. During the 12 months ending June 2019, the state government subsector declined 4.0 percent partly because enrollment at the public college and universities in the HMA declined by approximately 500 students from fall 2017 to fall 2018; the federal government subsector remained unchanged.
Commuting PatternsThe city of Fargo is the employment center of the HMA. Among employed residents in the city of Fargo, nearly 73 percent work in the city of Fargo, 8 percent work in the city of West Fargo, and approximately 6 percent work in the city of Moorhead; the remainder work in other places in and outside of the HMA. The city of West Fargo has generally developed as a bedroom community for the city of Fargo largely due to Interstate 94 connecting the two cities. Approximately 70 percent of employed West Fargo residents commute to Fargo for work. Only 14 percent of West Fargo residents work in West Fargo and 5 percent commute to Moorhead for work; the remainder commute to other places in and outside of the HMA. The proximity from Moorhead to Fargo has also impacted commuting patterns. Of the employed residents in the city of Moorhead, 52 percent commute to Fargo for work, 27 percent work in Moorhead, and 5 percent commute to West Fargo; the remainder of employed Moorhead residents work in other places in and outside of the HMA.
Employment ForecastDuring the 3-year forecast period, job growth is expected to continue in the HMA, increasing by an average of 600 jobs, or 0.4 percent, a year. Job growth is expected to be lower in the first year of the forecast period and increase through the third year. Steady growth is expected to continue in the education and health services and the manufacturing sectors. Aldevron LLC announced plans to construct three new buildings with nearly 500,000 square feet to expand capacity for biologic products manufacturing, hiring as many as 1,000 people by 2021. The government sector is also expected to add jobs because the Moorhead School Board approved plans to convert the former Sam’s Club building into a career and technical academy. The proposed center, which will cost an expected $13 million, is intended to help meet the demand for skilled workers.
Population and Households 8Fargo, North Dakota-Minnesota Comprehensive Housing Market Analysis as of July 1, 2019
Comprehensive Housing Market Analysis Fargo, North Dakota-Minnesota U.S. Department of Housing and Urban Development, Office of Policy Development and Research
Current population: 248,700
Population and Households
Population growth in the HMA since 2015 slowed to an average of 1.7 percent a year, compared with a 2.2-percent annual growth rate from 2011 to 2015.
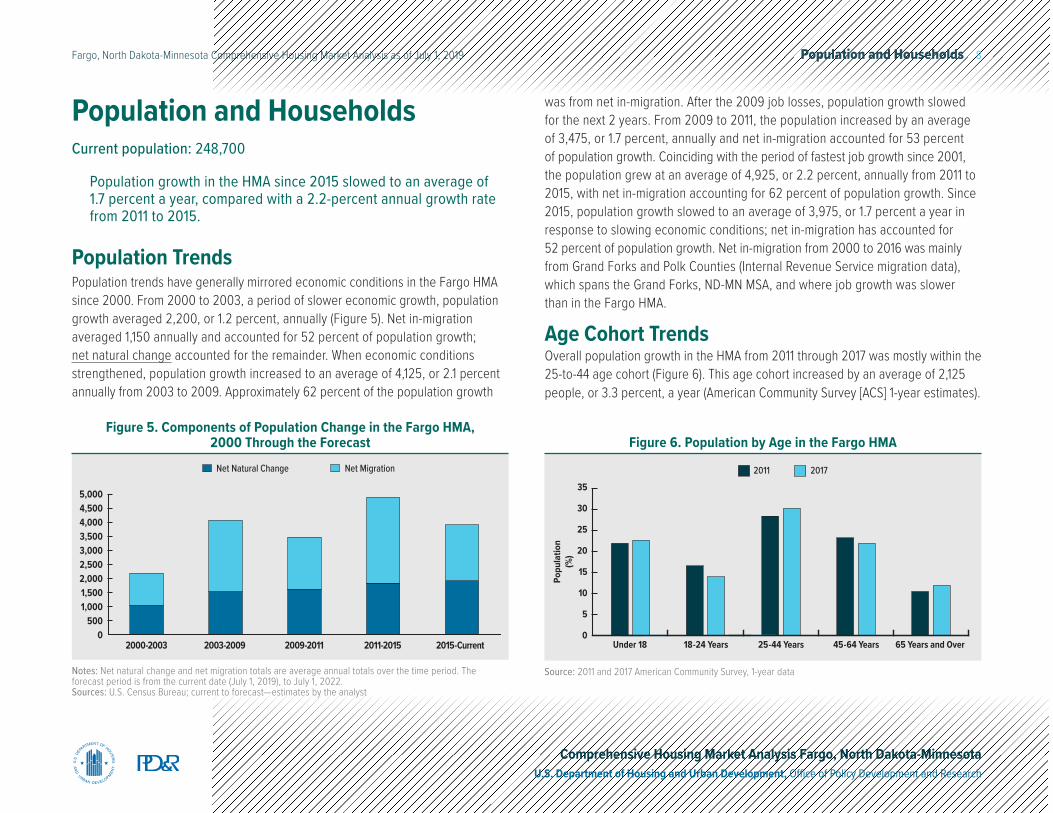
Population TrendsPopulation trends have generally mirrored economic conditions in the Fargo HMA since 2000. From 2000 to 2003, a period of slower economic growth, population growth averaged 2,200, or 1.2 percent, annually (Figure 5). Net in-migration averaged 1,150 annually and accounted for 52 percent of population growth; net natural change accounted for the remainder. When economic conditions strengthened, population growth increased to an average of 4,125, or 2.1 percent annually from 2003 to 2009. Approximately 62 percent of the population growth
5,0004,5004,0003,5003,0002,5002,0001,5001,000
5000
2000-2003 2003-2009 2009-2011 2011-2015 2015-Current
Net MigrationNet Natural Change
Notes: Net natural change and net migration totals are average annual totals over the time period. The forecast period is from the current date (July 1, 2019), to July 1, 2022.Sources: U.S. Census Bureau; current to forecast—estimates by the analyst
Figure 5. Components of Population Change in the Fargo HMA, 2000 Through the Forecast
was from net in-migration. After the 2009 job losses, population growth slowed for the next 2 years. From 2009 to 2011, the population increased by an average of 3,475, or 1.7 percent, annually and net in-migration accounted for 53 percent of population growth. Coinciding with the period of fastest job growth since 2001, the population grew at an average of 4,925, or 2.2 percent, annually from 2011 to 2015, with net in-migration accounting for 62 percent of population growth. Since 2015, population growth slowed to an average of 3,975, or 1.7 percent a year in response to slowing economic conditions; net in-migration has accounted for 52 percent of population growth. Net in-migration from 2000 to 2016 was mainly from Grand Forks and Polk Counties (Internal Revenue Service migration data), which spans the Grand Forks, ND-MN MSA, and where job growth was slower than in the Fargo HMA.
Age Cohort TrendsOverall population growth in the HMA from 2011 through 2017 was mostly within the 25-to-44 age cohort (Figure 6). This age cohort increased by an average of 2,125 people, or 3.3 percent, a year (American Community Survey [ACS] 1-year estimates).
35
30
25
20
15
10
5
0
20172011
Under 18 18-24 Years 25-44 Years 45-64 Years 65 Years and Over
Popu
latio
n(%
)
Source: 2011 and 2017 American Community Survey, 1-year data
Figure 6. Population by Age in the Fargo HMA
Population and Households 9Fargo, North Dakota-Minnesota Comprehensive Housing Market Analysis as of July 1, 2019
Comprehensive Housing Market Analysis Fargo, North Dakota-Minnesota U.S. Department of Housing and Urban Development, Office of Policy Development and Research
CassClay
NormanTraill
WilkinRichlandRansom
Steele
Otter Tail
CassClay
Average Annual Population Change By Census Tract 2012-2017
Population Change -1% or Below
Unchanged
+1% or Above
HMA
Population Change -1% or Below
Unchanged
+1% or Above
NO
RTH
DAK
OTA
MIN
NES
OTA
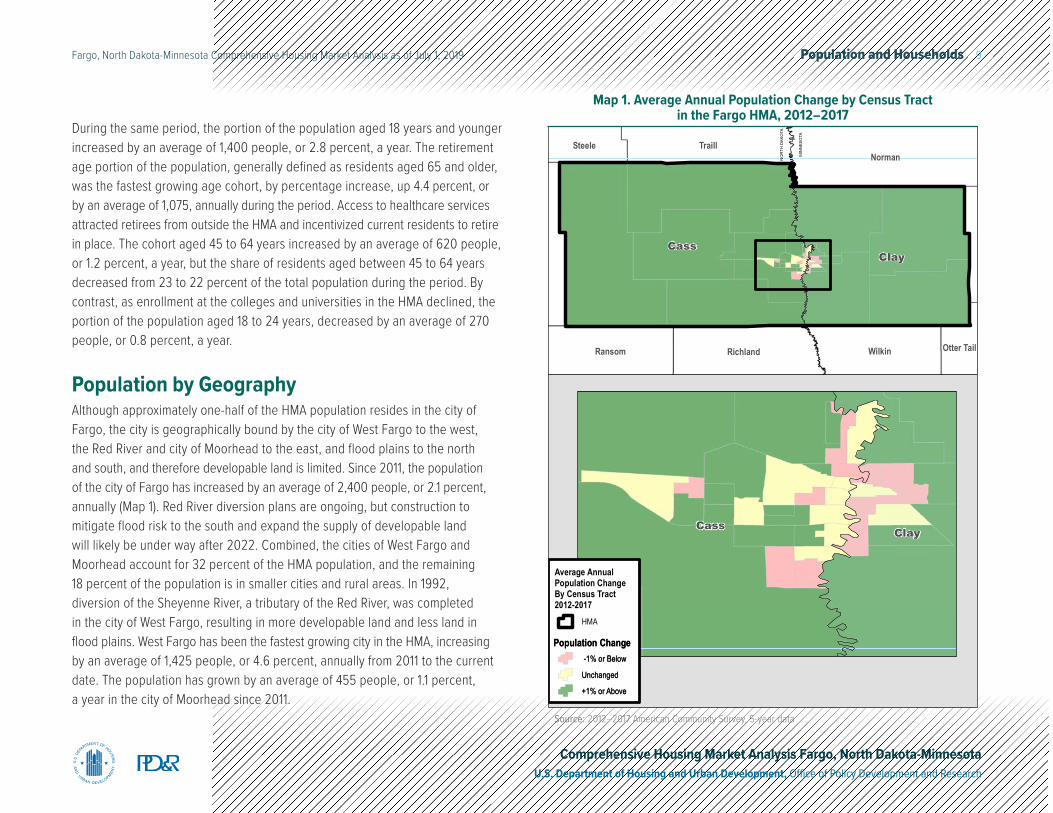
Map 1. Average Annual Population Change by Census Tract in the Fargo HMA, 2012–2017
During the same period, the portion of the population aged 18 years and younger increased by an average of 1,400 people, or 2.8 percent, a year. The retirement age portion of the population, generally defined as residents aged 65 and older, was the fastest growing age cohort, by percentage increase, up 4.4 percent, or by an average of 1,075, annually during the period. Access to healthcare services attracted retirees from outside the HMA and incentivized current residents to retire in place. The cohort aged 45 to 64 years increased by an average of 620 people, or 1.2 percent, a year, but the share of residents aged between 45 to 64 years decreased from 23 to 22 percent of the total population during the period. By contrast, as enrollment at the colleges and universities in the HMA declined, the portion of the population aged 18 to 24 years, decreased by an average of 270 people, or 0.8 percent, a year.
Population by GeographyAlthough approximately one-half of the HMA population resides in the city of Fargo, the city is geographically bound by the city of West Fargo to the west, the Red River and city of Moorhead to the east, and flood plains to the north and south, and therefore developable land is limited. Since 2011, the population of the city of Fargo has increased by an average of 2,400 people, or 2.1 percent, annually (Map 1). Red River diversion plans are ongoing, but construction to mitigate flood risk to the south and expand the supply of developable land will likely be under way after 2022. Combined, the cities of West Fargo and Moorhead account for 32 percent of the HMA population, and the remaining 18 percent of the population is in smaller cities and rural areas. In 1992, diversion of the Sheyenne River, a tributary of the Red River, was completed in the city of West Fargo, resulting in more developable land and less land in flood plains. West Fargo has been the fastest growing city in the HMA, increasing by an average of 1,425 people, or 4.6 percent, annually from 2011 to the current date. The population has grown by an average of 455 people, or 1.1 percent, a year in the city of Moorhead since 2011.
Source: 2012–2017 American Community Survey, 5-year data
Population and Households 10Fargo, North Dakota-Minnesota Comprehensive Housing Market Analysis as of July 1, 2019
Comprehensive Housing Market Analysis Fargo, North Dakota-Minnesota U.S. Department of Housing and Urban Development, Office of Policy Development and Research
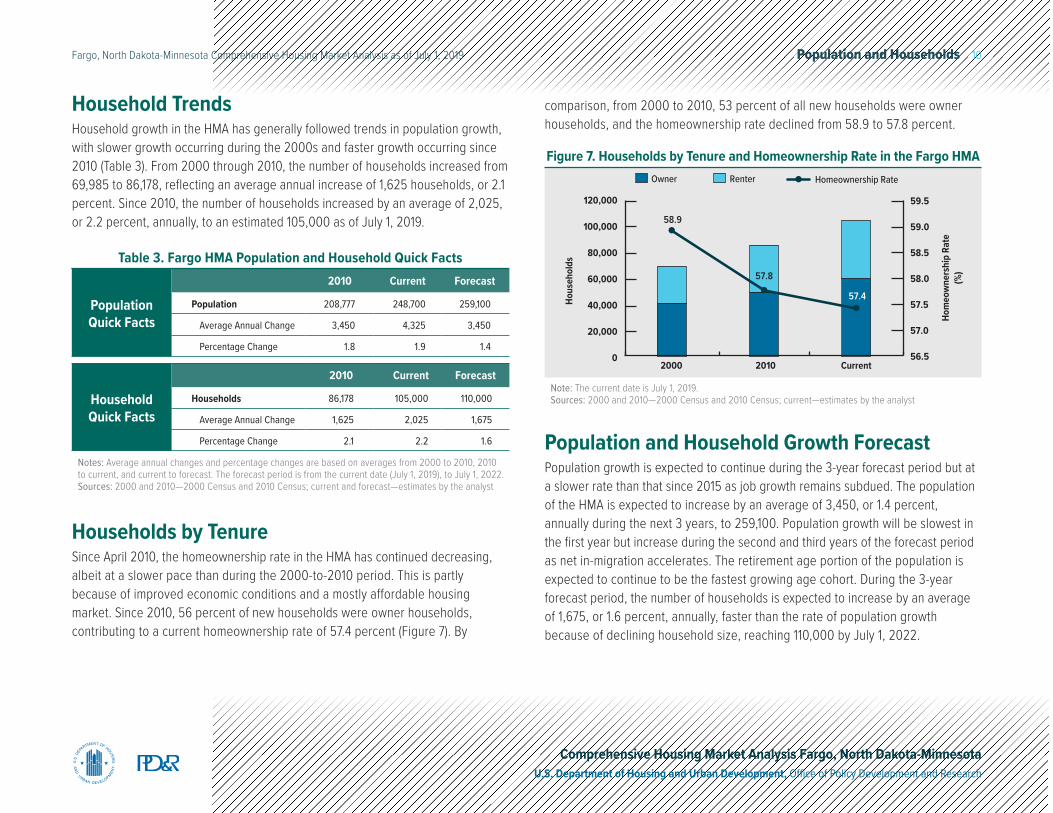
Household TrendsHousehold growth in the HMA has generally followed trends in population growth, with slower growth occurring during the 2000s and faster growth occurring since 2010 (Table 3). From 2000 through 2010, the number of households increased from 69,985 to 86,178, reflecting an average annual increase of 1,625 households, or 2.1 percent. Since 2010, the number of households increased by an average of 2,025, or 2.2 percent, annually, to an estimated 105,000 as of July 1, 2019.
Households by TenureSince April 2010, the homeownership rate in the HMA has continued decreasing, albeit at a slower pace than during the 2000-to-2010 period. This is partly because of improved economic conditions and a mostly affordable housing market. Since 2010, 56 percent of new households were owner households, contributing to a current homeownership rate of 57.4 percent (Figure 7). By
Population and Household Growth ForecastPopulation growth is expected to continue during the 3-year forecast period but at a slower rate than that since 2015 as job growth remains subdued. The population of the HMA is expected to increase by an average of 3,450, or 1.4 percent, annually during the next 3 years, to 259,100. Population growth will be slowest in the first year but increase during the second and third years of the forecast period as net in-migration accelerates. The retirement age portion of the population is expected to continue to be the fastest growing age cohort. During the 3-year forecast period, the number of households is expected to increase by an average of 1,675, or 1.6 percent, annually, faster than the rate of population growth because of declining household size, reaching 110,000 by July 1, 2022.
RenterOwner
Current20102000
Homeownership Rate
Hous
ehol
ds
Hom
eow
ners
hip
Rate
(%)
59.5
59.0
58.5
58.0
57.5
57.0
56.5
120,000
100,000
80,000
60,000
40,000
20,000
0
57.4
57.8
58.9
Figure 7. Households by Tenure and Homeownership Rate in the Fargo HMA
Note: The current date is July 1, 2019.Sources: 2000 and 2010—2000 Census and 2010 Census; current—estimates by the analyst
Population Quick Facts
2010 Current Forecast
Population 208,777 248,700 259,100
Average Annual Change 3,450 4,325 3,450
Percentage Change 1.8 1.9 1.4
Household Quick Facts
2010 Current Forecast
Households 86,178 105,000 110,000
Average Annual Change 1,625 2,025 1,675
Percentage Change 2.1 2.2 1.6
Notes: Average annual changes and percentage changes are based on averages from 2000 to 2010, 2010 to current, and current to forecast. The forecast period is from the current date (July 1, 2019), to July 1, 2022. Sources: 2000 and 2010—2000 Census and 2010 Census; current and forecast—estimates by the analyst
Table 3. Fargo HMA Population and Household Quick Facts
comparison, from 2000 to 2010, 53 percent of all new households were owner households, and the homeownership rate declined from 58.9 to 57.8 percent.
Home Sales Market Conditions 11Fargo, North Dakota-Minnesota Comprehensive Housing Market Analysis as of July 1, 2019
Comprehensive Housing Market Analysis Fargo, North Dakota-Minnesota U.S. Department of Housing and Urban Development, Office of Policy Development and Research
Home Sales Market ConditionsMarket Conditions: Balanced
Existing home sales in the Fargo HMA decreased 7 percent during the 12 months ending June 2019, but new home sales increased 5 percent.
Current ConditionsThe sales housing market in the Fargo HMA is currently balanced, with an estimated vacancy rate of 1.4 percent (Table 4), down from 1.9 percent in April 2010. The adverse effects of the national housing crisis were not as evident in the HMA as in the nation. Lower unemployment rates, relatively stable average home sales prices, and lower foreclosure rates compared with the nation contributed to a relatively stable home sales market.
Home Sales Quick Facts
Fargo HMA NationVacancy Rate 1.4% NATotal Home Sales 4,525 6,034,000
1-Year Change -6% -5%New Sale Price $324,400 $381,400
1-Year Change -2% 1%Existing Sale Price $216,300 $291,500
1-Year Change -4% 3%Mortgage Delinquency Rate 0.6% 1.4%
NA = data not available.Notes: The vacancy rate is as of the current date (July 1, 2019). Home sales and average prices are for the 12 months ending June 2019. Mortgage delinquency data are as of June 2019.Source: CoreLogic, Inc., with adjustments by the analyst
Table 4. Home Sales Quick Facts in the Fargo HMA
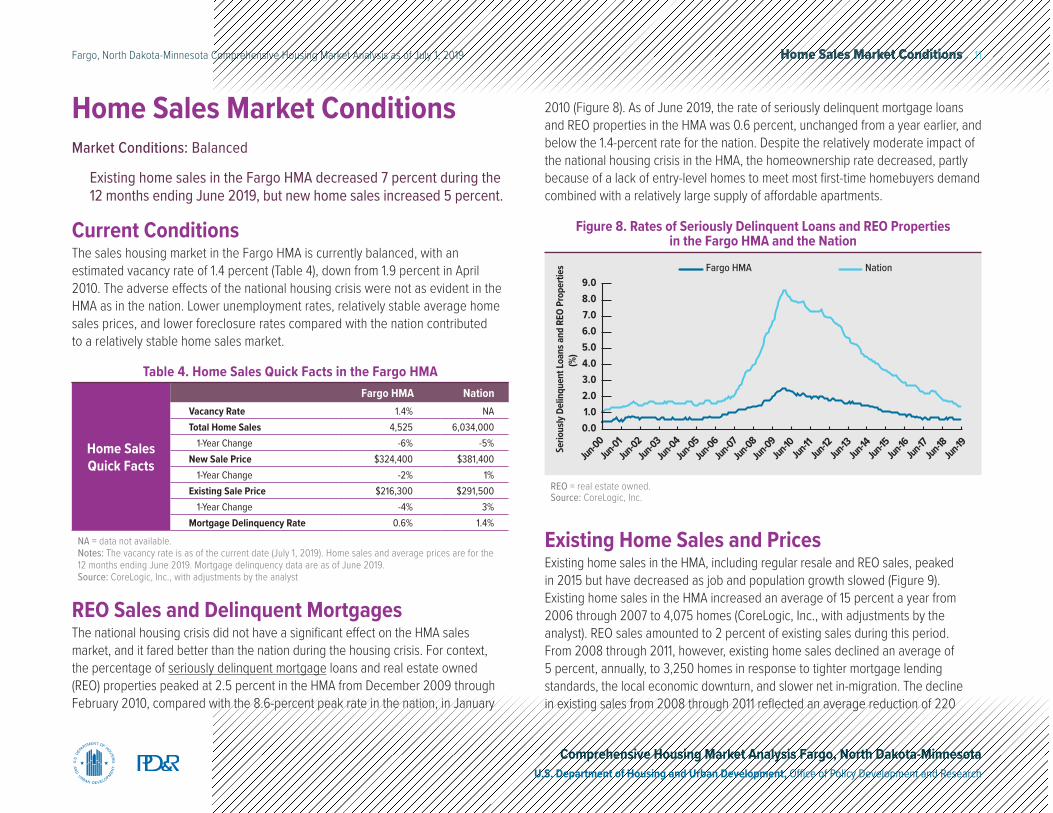
REO Sales and Delinquent MortgagesThe national housing crisis did not have a significant effect on the HMA sales market, and it fared better than the nation during the housing crisis. For context, the percentage of seriously delinquent mortgage loans and real estate owned (REO) properties peaked at 2.5 percent in the HMA from December 2009 through February 2010, compared with the 8.6-percent peak rate in the nation, in January
Existing Home Sales and PricesExisting home sales in the HMA, including regular resale and REO sales, peaked in 2015 but have decreased as job and population growth slowed (Figure 9). Existing home sales in the HMA increased an average of 15 percent a year from 2006 through 2007 to 4,075 homes (CoreLogic, Inc., with adjustments by the analyst). REO sales amounted to 2 percent of existing sales during this period. From 2008 through 2011, however, existing home sales declined an average of 5 percent, annually, to 3,250 homes in response to tighter mortgage lending standards, the local economic downturn, and slower net in-migration. The decline in existing sales from 2008 through 2011 reflected an average reduction of 220
2010 (Figure 8). As of June 2019, the rate of seriously delinquent mortgage loans and REO properties in the HMA was 0.6 percent, unchanged from a year earlier, and below the 1.4-percent rate for the nation. Despite the relatively moderate impact of the national housing crisis in the HMA, the homeownership rate decreased, partly because of a lack of entry-level homes to meet most first-time homebuyers demand combined with a relatively large supply of affordable apartments.
9.08.07.06.05.04.03.02.01.00.0
Ser
ious
ly De
linqu
ent L
oans
and
REO
Pro
perti
es(%
)
NationFargo HMA
Jun-00Jun-01
Jun-02Jun-03
Jun-04Jun-05
Jun-06Jun-07
Jun-08Jun-09
Jun-10Jun-11
Jun-12Jun-13
Jun-14Jun-15
Jun-16Jun-17
Jun-18Jun-19
Figure 8. Rates of Seriously Delinquent Loans and REO Properties in the Fargo HMA and the Nation
REO = real estate owned.Source: CoreLogic, Inc.
Home Sales Market Conditions 12Fargo, North Dakota-Minnesota Comprehensive Housing Market Analysis as of July 1, 2019
Comprehensive Housing Market Analysis Fargo, North Dakota-Minnesota U.S. Department of Housing and Urban Development, Office of Policy Development and Research
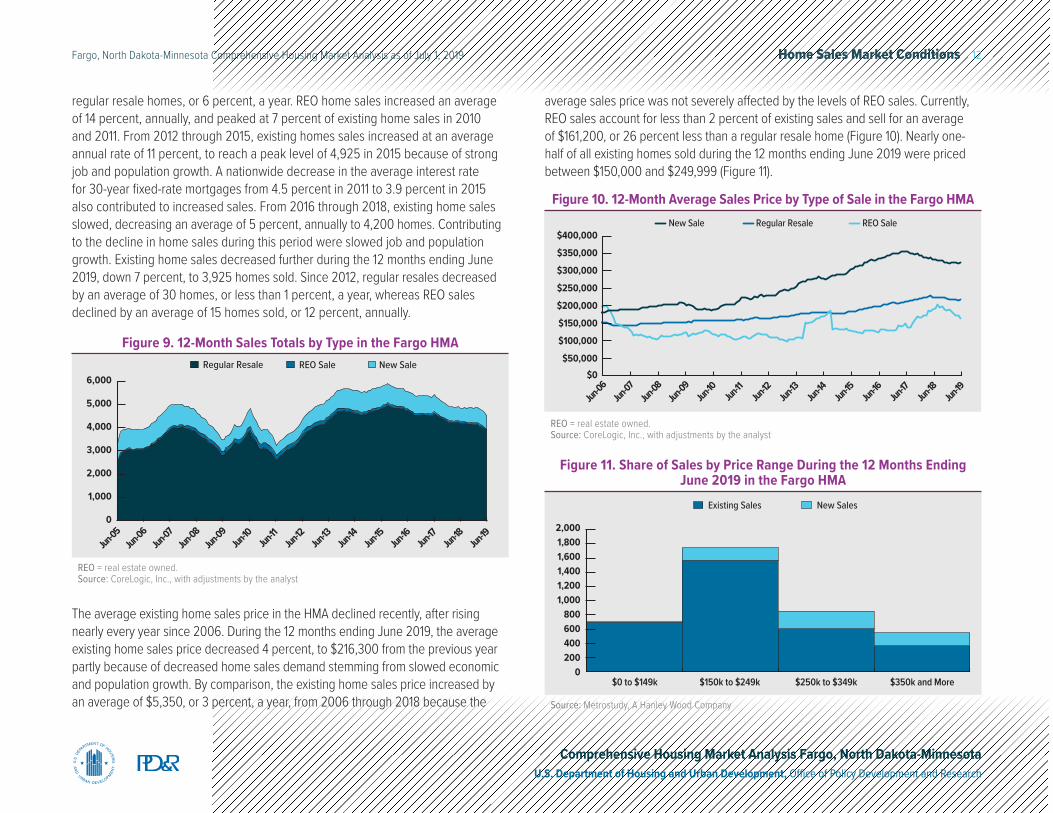
regular resale homes, or 6 percent, a year. REO home sales increased an average of 14 percent, annually, and peaked at 7 percent of existing home sales in 2010 and 2011. From 2012 through 2015, existing homes sales increased at an average annual rate of 11 percent, to reach a peak level of 4,925 in 2015 because of strong job and population growth. A nationwide decrease in the average interest rate for 30-year fixed-rate mortgages from 4.5 percent in 2011 to 3.9 percent in 2015 also contributed to increased sales. From 2016 through 2018, existing home sales slowed, decreasing an average of 5 percent, annually to 4,200 homes. Contributing to the decline in home sales during this period were slowed job and population growth. Existing home sales decreased further during the 12 months ending June 2019, down 7 percent, to 3,925 homes sold. Since 2012, regular resales decreased by an average of 30 homes, or less than 1 percent, a year, whereas REO sales declined by an average of 15 homes sold, or 12 percent, annually.
6,000
5,000
4,000
3,000
2,000
1,000
0
New SaleREO SaleRegular Resale
Jun-05
Jun-06
Jun-07
Jun-08
Jun-09
Jun-10
Jun-11
Jun-12
Jun-13
Jun-14
Jun-15
Jun-16
Jun-17
Jun-18
Jun-19
2,0001,8001,6001,4001,2001,000
800600400200
0
New SalesExisting Sales
$0 to $149k $150k to $249k $250k to $349k $350k and More
Figure 9. 12-Month Sales Totals by Type in the Fargo HMA
Figure 11. Share of Sales by Price Range During the 12 Months Ending June 2019 in the Fargo HMA
REO = real estate owned.Source: CoreLogic, Inc., with adjustments by the analyst
Source: Metrostudy, A Hanley Wood Company
The average existing home sales price in the HMA declined recently, after rising nearly every year since 2006. During the 12 months ending June 2019, the average existing home sales price decreased 4 percent, to $216,300 from the previous year partly because of decreased home sales demand stemming from slowed economic and population growth. By comparison, the existing home sales price increased by an average of $5,350, or 3 percent, a year, from 2006 through 2018 because the
$400,000
$350,000
$300,000
$250,000
$200,000
$150,000
$100,000
$50,000$0
Jun-06
Jun-07
Jun-08
Jun-09
Jun-10
Jun-11
Jun-12
Jun-13
Jun-14
Jun-15
Jun-16
Jun-17
Jun-18
Jun-19
New Sale Regular Resale REO Sale
Figure 10. 12-Month Average Sales Price by Type of Sale in the Fargo HMA
REO = real estate owned.Source: CoreLogic, Inc., with adjustments by the analyst
average sales price was not severely affected by the levels of REO sales. Currently, REO sales account for less than 2 percent of existing sales and sell for an average of $161,200, or 26 percent less than a regular resale home (Figure 10). Nearly one-half of all existing homes sold during the 12 months ending June 2019 were priced between $150,000 and $249,999 (Figure 11).
Home Sales Market Conditions 13Fargo, North Dakota-Minnesota Comprehensive Housing Market Analysis as of July 1, 2019
Comprehensive Housing Market Analysis Fargo, North Dakota-Minnesota U.S. Department of Housing and Urban Development, Office of Policy Development and Research
New Home Sales and PricesUnlike existing home sales, new home sales peaked at 900 homes sold in 2006. New home sales declined each of the 5 subsequent years, by an average of 85 homes, or 12 percent, to 470 homes sold in 2011, in response to tightened lending standards. New home sales rose by an average of approximately 130 homes, or 22 percent, a year from 2012 through 2014, to 865 homes sold before decreasing by an average of 55 homes, or 7 percent, a year from 2015 through 2018 when population growth decelerated. During the 12 months ending June 2019, 605 new homes sold, up 5 percent from the 570 new homes sold during the previous 12 months. The average new home sales price increased nearly every year from 2006 through 2017, averaging 6 percent annually, except in 2009, when the price declined 7 percent, partly because of decreased home sales demand. During the 12 months ending June 2019, the average sales price of a new home was $324,400, reflecting a decrease of $7,175, or 2 percent, lower than the 7-percent decline during the 12 months ending June 2018. The average sales price for a new home was $338,400 in Cass County and $260,000 in Clay County during the period. During the 12 months ending June 2019, approximately 40 percent of new home sales were priced between $250,000 and $349,999.
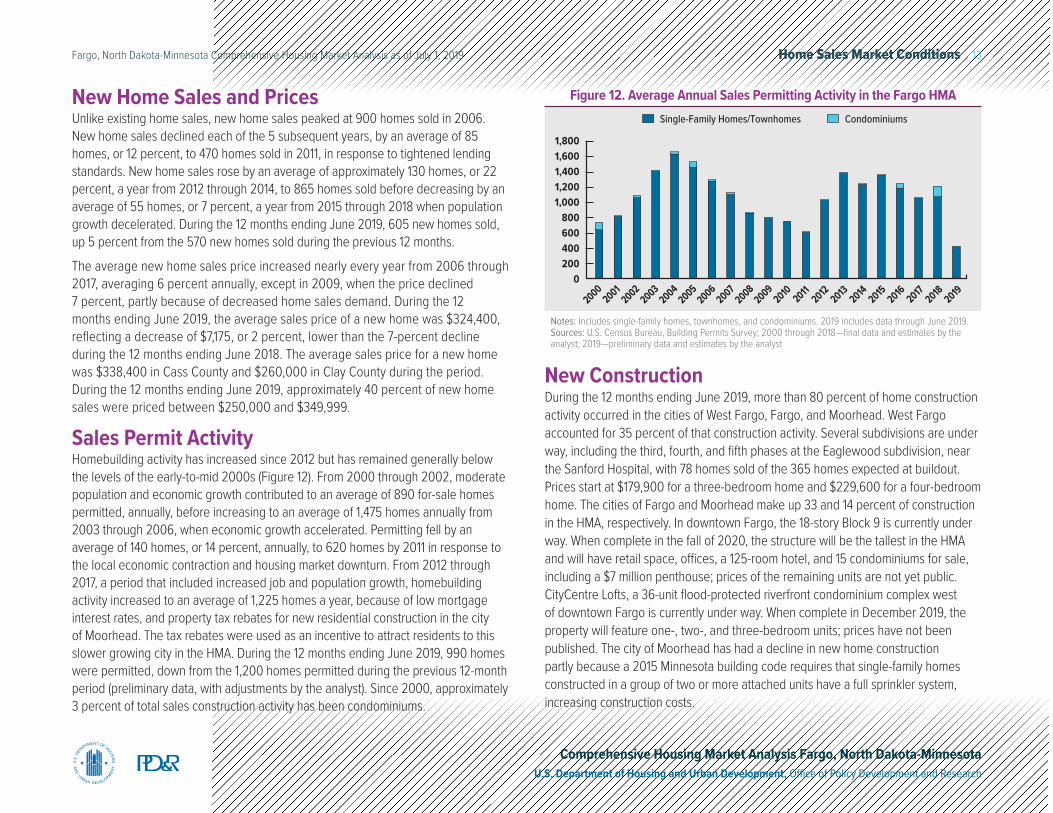
Sales Permit ActivityHomebuilding activity has increased since 2012 but has remained generally below the levels of the early-to-mid 2000s (Figure 12). From 2000 through 2002, moderate population and economic growth contributed to an average of 890 for-sale homes permitted, annually, before increasing to an average of 1,475 homes annually from 2003 through 2006, when economic growth accelerated. Permitting fell by an average of 140 homes, or 14 percent, annually, to 620 homes by 2011 in response to the local economic contraction and housing market downturn. From 2012 through 2017, a period that included increased job and population growth, homebuilding activity increased to an average of 1,225 homes a year, because of low mortgage interest rates, and property tax rebates for new residential construction in the city of Moorhead. The tax rebates were used as an incentive to attract residents to this slower growing city in the HMA. During the 12 months ending June 2019, 990 homes were permitted, down from the 1,200 homes permitted during the previous 12-month period (preliminary data, with adjustments by the analyst). Since 2000, approximately 3 percent of total sales construction activity has been condominiums.
Notes: Includes single-family homes, townhomes, and condominiums. 2019 includes data through June 2019.Sources: U.S. Census Bureau, Building Permits Survey; 2000 through 2018—final data and estimates by the analyst; 2019—preliminary data and estimates by the analyst
1,8001,6001,4001,2001,000
800600400200
0
20002001
20022003
20042005
20062007
20082009
2010 20112012 2013
20142015
2016 20172018 2019
CondominiumsSingle-Family Homes/Townhomes
Figure 12. Average Annual Sales Permitting Activity in the Fargo HMA
New ConstructionDuring the 12 months ending June 2019, more than 80 percent of home construction activity occurred in the cities of West Fargo, Fargo, and Moorhead. West Fargo accounted for 35 percent of that construction activity. Several subdivisions are under way, including the third, fourth, and fifth phases at the Eaglewood subdivision, near the Sanford Hospital, with 78 homes sold of the 365 homes expected at buildout. Prices start at $179,900 for a three-bedroom home and $229,600 for a four-bedroom home. The cities of Fargo and Moorhead make up 33 and 14 percent of construction in the HMA, respectively. In downtown Fargo, the 18-story Block 9 is currently under way. When complete in the fall of 2020, the structure will be the tallest in the HMA and will have retail space, offices, a 125-room hotel, and 15 condominiums for sale, including a $7 million penthouse; prices of the remaining units are not yet public. CityCentre Lofts, a 36-unit flood-protected riverfront condominium complex west of downtown Fargo is currently under way. When complete in December 2019, the property will feature one-, two-, and three-bedroom units; prices have not been published. The city of Moorhead has had a decline in new home construction partly because a 2015 Minnesota building code requires that single-family homes constructed in a group of two or more attached units have a full sprinkler system, increasing construction costs.
Home Sales Market Conditions 14Fargo, North Dakota-Minnesota Comprehensive Housing Market Analysis as of July 1, 2019
Comprehensive Housing Market Analysis Fargo, North Dakota-Minnesota U.S. Department of Housing and Urban Development, Office of Policy Development and Research
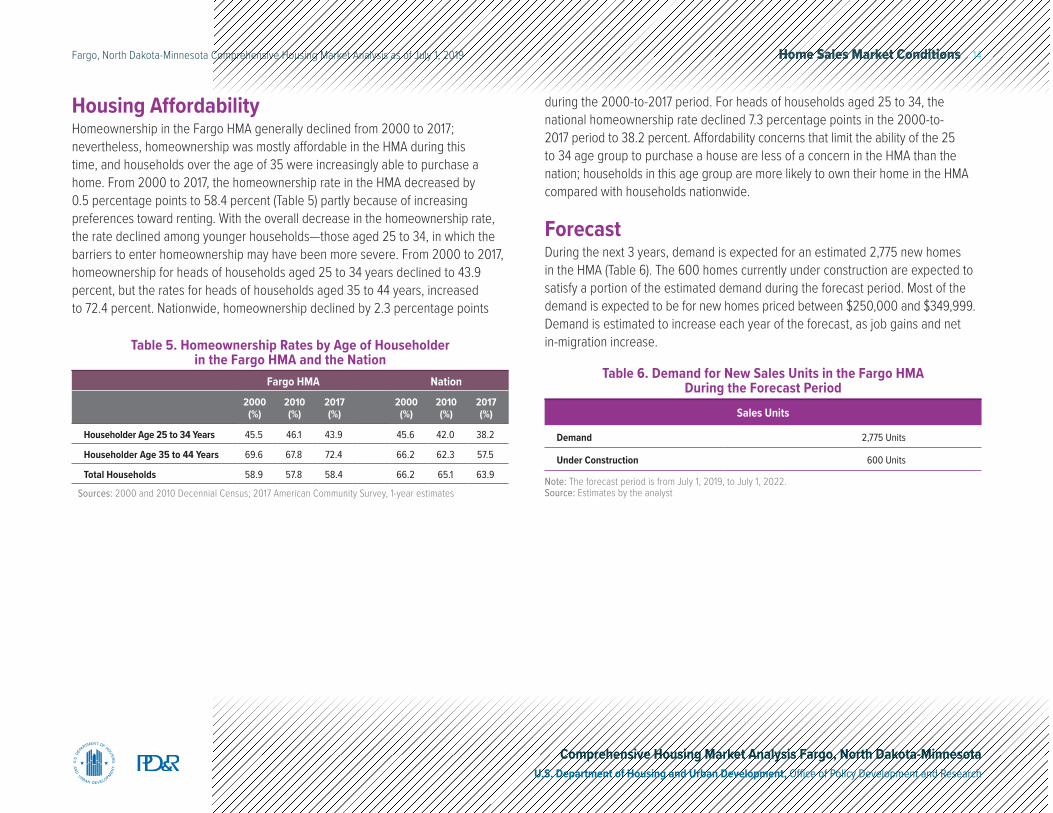
Housing AffordabilityHomeownership in the Fargo HMA generally declined from 2000 to 2017; nevertheless, homeownership was mostly affordable in the HMA during this time, and households over the age of 35 were increasingly able to purchase a home. From 2000 to 2017, the homeownership rate in the HMA decreased by 0.5 percentage points to 58.4 percent (Table 5) partly because of increasing preferences toward renting. With the overall decrease in the homeownership rate, the rate declined among younger households—those aged 25 to 34, in which the barriers to enter homeownership may have been more severe. From 2000 to 2017, homeownership for heads of households aged 25 to 34 years declined to 43.9 percent, but the rates for heads of households aged 35 to 44 years, increased to 72.4 percent. Nationwide, homeownership declined by 2.3 percentage points
Fargo HMA Nation
2000 (%)
2010 (%)
2017 (%)
2000 (%)
2010 (%)
2017 (%)
Householder Age 25 to 34 Years 45.5 46.1 43.9 45.6 42.0 38.2
Householder Age 35 to 44 Years 69.6 67.8 72.4 66.2 62.3 57.5
Total Households 58.9 57.8 58.4 66.2 65.1 63.9
Sources: 2000 and 2010 Decennial Census; 2017 American Community Survey, 1-year estimates
Table 5. Homeownership Rates by Age of Householder in the Fargo HMA and the Nation
during the 2000-to-2017 period. For heads of households aged 25 to 34, the national homeownership rate declined 7.3 percentage points in the 2000-to-2017 period to 38.2 percent. Affordability concerns that limit the ability of the 25 to 34 age group to purchase a house are less of a concern in the HMA than the nation; households in this age group are more likely to own their home in the HMA compared with households nationwide.
ForecastDuring the next 3 years, demand is expected for an estimated 2,775 new homes in the HMA (Table 6). The 600 homes currently under construction are expected to satisfy a portion of the estimated demand during the forecast period. Most of the demand is expected to be for new homes priced between $250,000 and $349,999. Demand is estimated to increase each year of the forecast, as job gains and net in-migration increase.
Table 6. Demand for New Sales Units in the Fargo HMA During the Forecast Period
Sales Units
Demand 2,775 Units
Under Construction 600 Units
Note: The forecast period is from July 1, 2019, to July 1, 2022.Source: Estimates by the analyst
Rental Market Conditions 15Fargo, North Dakota-Minnesota Comprehensive Housing Market Analysis as of July 1, 2019
Comprehensive Housing Market Analysis Fargo, North Dakota-Minnesota U.S. Department of Housing and Urban Development, Office of Policy Development and Research
Rental Market ConditionsMarket Conditions: Soft, but Improving
Increased rental permit activity from 2011 through 2017 and lower levels of economic and population growth since 2015 have maintained a high rental vacancy rate.
Current Conditions and Recent TrendsOverall rental market conditions are currently soft in the Fargo HMA. The vacancy rate for all rental units is estimated at 9.1 percent, up from 7.1 percent in April 2010 (Table 7) when conditions were also soft. Even though stricter lending standards and a lack of affordable entry-level homes to meet most first-time homebuyer
Rental Market Quick Facts
2010(%)
Current (%)
Rental Vacancy Rate 7.1 9.1
Occupied Rental Units by StructureSingle-Family Attached & Detached 17 14
Multifamily (2–4 Units) 8 9
Multifamily (5+ Units) 75 77
Other (Including Mobile Homes) 0 1
Apartment Market
Quick Facts
Current YoY Change
Apartment Vacancy Rate 7.9% -0.9
Average Rent $875 1%
Studio $635 2%
One-Bedroom $730 1%
Two-Bedroom $866 0%
Three-Bedroom $1,146 4%
YoY = year over year.Notes: The current date is July 1, 2019. Current data for “occupied rental units by structure” are from the 2017 American Community Survey, 1-year data, the most recent data available.Sources: American Community Survey, 1-year data; apartment data—Appraisal Services, Inc.; Reis, Inc.
Table 7. Rental and Apartment Market Quick Facts in the Fargo HMA
900
850
800
750
700
650
Aver
age
Mon
thly
Ren
t($
)
Vaca
ncy R
ate
(%)
10.0 9.0 8.0 7.0 6.0 5.0 4.0 3.0 2.0 1.0 0.0
Vacancy RateAverage Monthly Rent
5.6
$675
7.9
$738
$875
3.0
20082009
20102011
20122013
20142015
20162017
June 2018
June 2019
Figure 13. Apartment Rents and Vacancy Rates in the Fargo HMA
Sources: Appraisal Services, Inc.; Reis, Inc.
demand increased demand for rental units, rental market conditions have deteriorated in the HMA since 2010 because an excess supply of rental units was built from 2011 through 2017. Multifamily buildings with five or more units, typically apartments, accounted for 77 percent of all occupied rental units in the HMA in 2017, up from 75 percent in 2010.
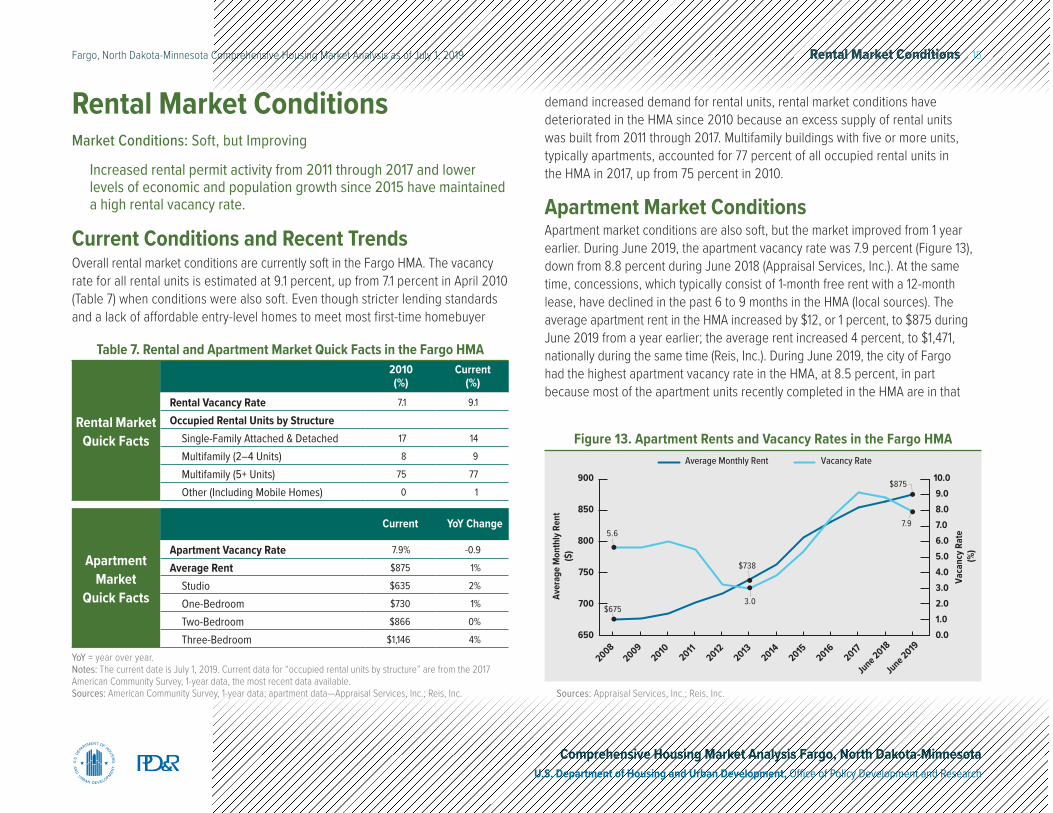
Apartment Market ConditionsApartment market conditions are also soft, but the market improved from 1 year earlier. During June 2019, the apartment vacancy rate was 7.9 percent (Figure 13), down from 8.8 percent during June 2018 (Appraisal Services, Inc.). At the same time, concessions, which typically consist of 1-month free rent with a 12-month lease, have declined in the past 6 to 9 months in the HMA (local sources). The average apartment rent in the HMA increased by $12, or 1 percent, to $875 during June 2019 from a year earlier; the average rent increased 4 percent, to $1,471, nationally during the same time (Reis, Inc.). During June 2019, the city of Fargo had the highest apartment vacancy rate in the HMA, at 8.5 percent, in part because most of the apartment units recently completed in the HMA are in that
Rental Market Conditions 16Fargo, North Dakota-Minnesota Comprehensive Housing Market Analysis as of July 1, 2019
Comprehensive Housing Market Analysis Fargo, North Dakota-Minnesota U.S. Department of Housing and Urban Development, Office of Policy Development and Research
city. Strong population growth allowed for units in the city of West Fargo to be absorbed, and the vacancy rate decreased from 7.0 percent in June 2018 to 5.2 percent in June 2019. In the city of Moorhead, lower population growth was matched with lower rental construction, and the apartment vacancy rate declined to 7.7 percent during June 2019, down from 8.5 percent during June 2018.
From 2008 through 2010, in response to the housing crisis, demand for apartments increased in the HMA, but apartment construction remained low, and the apartment vacancy rate ranged from 5.6 to 6.0 percent (Appraisal Services, Inc.). During the period, the average rent increased 1 percent a year, to $685 in 2010 (Reis, Inc.). Although apartment construction began increasing in 2011, the apartment market vacancy rate bottomed out at 3.0 percent in 2013 because of strong job and population growth. From 2014 through 2017, a period that included very high levels of apartment construction and weaker economic conditions in the HMA, the apartment vacancy rate increased to 9.1 percent by 2017. With an increase in the number of new units becoming available and the apartment vacancy rate increasing, many developments offered concessions during the lease-up period. Despite fluctuations in the apartment vacancy rate from 2011 through 2017, the average rent consistently increased, up an average of $24,or 3 percent, a year, to $854.
Student HousingThe three largest postsecondary education establishments have a noteworthy effect on the rental market in the HMA. Of the 22,000 students enrolled at the three schools during the fall 2018 semester, approximately 6,600 are housed in on-campus dormitories and university-affiliated apartments. The remaining 15,400 students who live off-campus account for approximately 6 percent of renter households in the HMA. Currently, Cater Hall is under construction at NDSU. When complete in the fall of 2019, approximately 460 students will be housed at the property. In addition, Apartment 1701, an NDSU student apartment property is also under way. When complete in fall 2019, the property will feature 86 units, with 130 beds. Both properties could reduce demand for market-rate apartment properties during the next 3 years.
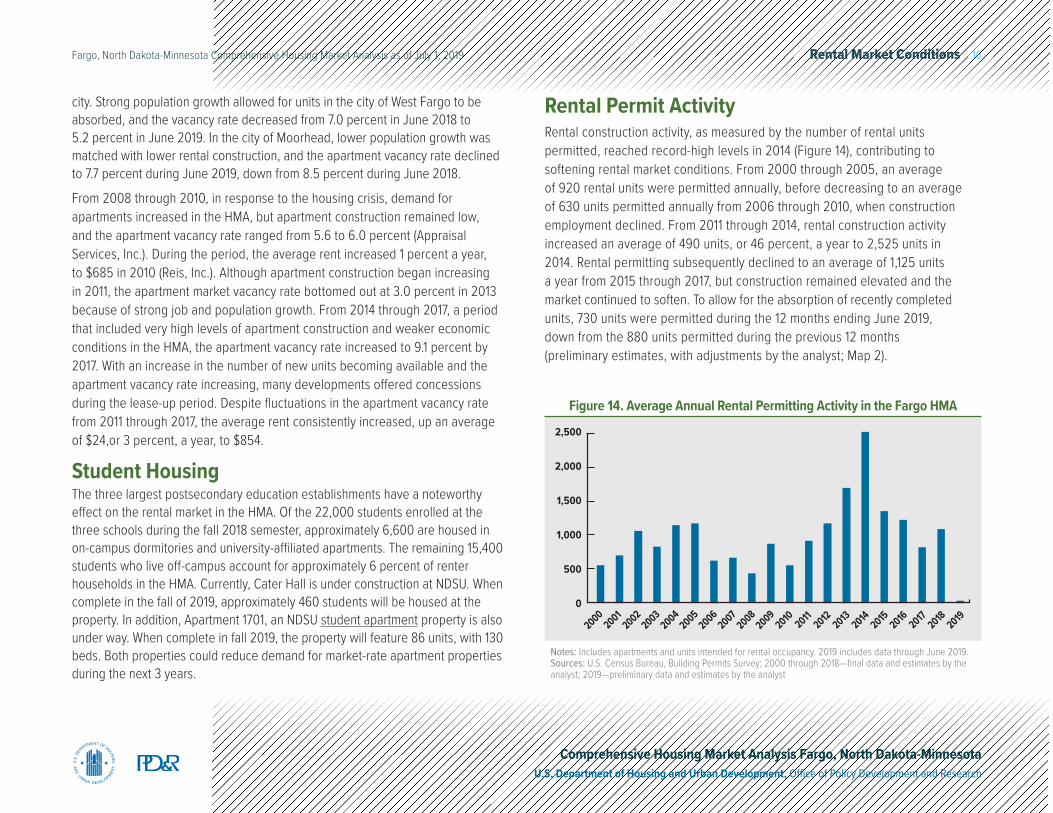
Rental Permit ActivityRental construction activity, as measured by the number of rental units permitted, reached record-high levels in 2014 (Figure 14), contributing to softening rental market conditions. From 2000 through 2005, an average of 920 rental units were permitted annually, before decreasing to an average of 630 units permitted annually from 2006 through 2010, when construction employment declined. From 2011 through 2014, rental construction activity increased an average of 490 units, or 46 percent, a year to 2,525 units in 2014. Rental permitting subsequently declined to an average of 1,125 units a year from 2015 through 2017, but construction remained elevated and the market continued to soften. To allow for the absorption of recently completed units, 730 units were permitted during the 12 months ending June 2019, down from the 880 units permitted during the previous 12 months (preliminary estimates, with adjustments by the analyst; Map 2).
2,500
2,000
1,500
1,000
500
0
20002001
20022003
20042005
20062007
20082009
2010 20112012 2013
20142015
2016 20172018
2019
Figure 14. Average Annual Rental Permitting Activity in the Fargo HMA
Notes: Includes apartments and units intended for rental occupancy. 2019 includes data through June 2019.Sources: U.S. Census Bureau, Building Permits Survey; 2000 through 2018—final data and estimates by the analyst; 2019—preliminary data and estimates by the analyst
Rental Market Conditions 17Fargo, North Dakota-Minnesota Comprehensive Housing Market Analysis as of July 1, 2019
Comprehensive Housing Market Analysis Fargo, North Dakota-Minnesota U.S. Department of Housing and Urban Development, Office of Policy Development and Research
Cass Clay
!(
!(
!(
!( !(!(!(!(
!(
!(!(!(!(!( !(!(
!(
!(
!(
!(!(!(
!(
!(!(
!(
!(!(
!(!(
!(!(
!(!(!(
!(
!(
!(!(
!(!(!(!(
!(
!(!(
!(
!(
!(!(!(!( !(
!(
!(!(
!(
!(!(!(
!(
!(
!(!(
!(
!(!(
!( !(!(
!(
!(
!(!(!(
!(
!(!(!(
!(
!(
!(
!(!( !(
!(
!(
!(!(
!(!(
!(!(
!(
!(
!(
!(!(!(
!(
!( !(
!(
!(
!(!(!(
!(
!(
!(
NormanTraill
Barnes
Ransom Wilkin
Steele
Richland
Becker
Otter Tail
CassClay
Project Size (Units)Less than 5050 - 149150 - 249
250 or more
Urbanized AreaFargo HMA
Phase!( Completed
!( Underway
Apartment Properties Built Since 2011
NO
RTH
DAK
OTA
MIN
NES
OTA
Fargo
MoorheadWest Fargo
§̈¦94
§̈¦29
§̈¦94
§̈¦29
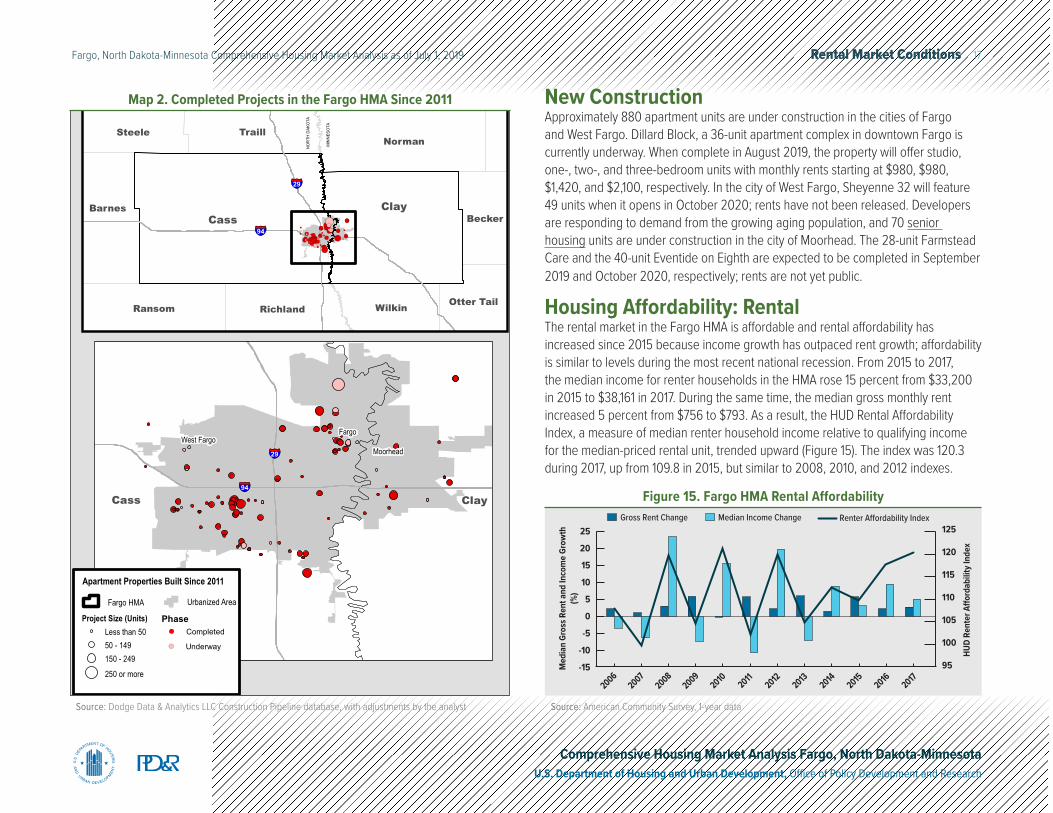
Map 2. Completed Projects in the Fargo HMA Since 2011 New ConstructionApproximately 880 apartment units are under construction in the cities of Fargo and West Fargo. Dillard Block, a 36-unit apartment complex in downtown Fargo is currently underway. When complete in August 2019, the property will offer studio, one-, two-, and three-bedroom units with monthly rents starting at $980, $980, $1,420, and $2,100, respectively. In the city of West Fargo, Sheyenne 32 will feature 49 units when it opens in October 2020; rents have not been released. Developers are responding to demand from the growing aging population, and 70 senior housing units are under construction in the city of Moorhead. The 28-unit Farmstead Care and the 40-unit Eventide on Eighth are expected to be completed in September 2019 and October 2020, respectively; rents are not yet public.
Housing Affordability: RentalThe rental market in the Fargo HMA is affordable and rental affordability has increased since 2015 because income growth has outpaced rent growth; affordability is similar to levels during the most recent national recession. From 2015 to 2017, the median income for renter households in the HMA rose 15 percent from $33,200 in 2015 to $38,161 in 2017. During the same time, the median gross monthly rent increased 5 percent from $756 to $793. As a result, the HUD Rental Affordability Index, a measure of median renter household income relative to qualifying income for the median-priced rental unit, trended upward (Figure 15). The index was 120.3 during 2017, up from 109.8 in 2015, but similar to 2008, 2010, and 2012 indexes.
Median Income ChangeGross Rent Change Renter Affordability Index
Med
ian
Gros
s Ren
t and
Inco
me
Grow
th(%
)
HUD
Rent
er A
fford
abili
ty In
dex
125
120
115
110
105
100
95
25
20
15
10
5
0
-5
-10
-15
20062007
20082009
2010 20112012 2013 2014
2015 2016 2017
Figure 15. Fargo HMA Rental Affordability
Source: American Community Survey, 1-year dataSource: Dodge Data & Analytics LLC Construction Pipeline database, with adjustments by the analyst
Rental Market Conditions 18Fargo, North Dakota-Minnesota Comprehensive Housing Market Analysis as of July 1, 2019
Comprehensive Housing Market Analysis Fargo, North Dakota-Minnesota U.S. Department of Housing and Urban Development, Office of Policy Development and Research
HomelessnessIn the Moorhead/West Central Minnesota area, approximately 250 people were homeless in 2018, of which 2 percent were unsheltered homeless (2018 Point-in-Time Count). The HMA rate is lower than the 15 percent share of unsheltered homeless in Minnesota. Approximately 3 percent of the state’s homeless population is in the Moorhead/West Central Minnesota area. Homelessness in the area has decreased since 2010 when 278 persons were homeless; the share of unsheltered homelessness was higher, at nearly 30 percent. The number of unsheltered homeless is expected to continue declining partly because in March 2018, Churches United opened Bright Sky, a 43-unit or 140-bed, apartment complex for people who have experienced long-term homelessness and have a disability. In North Dakota, approximately 800 persons were homeless in 2010, and the share of unsheltered homeless was 4 percent. Homelessness in the state decreased to approximately 540 people in 2018, of which 9 percent were unsheltered homeless. According to local sources, the city of Fargo is home to almost half the homeless population in North Dakota because, as the largest city in the state, most services and shelters to assist persons experiencing homelessness are in Fargo.
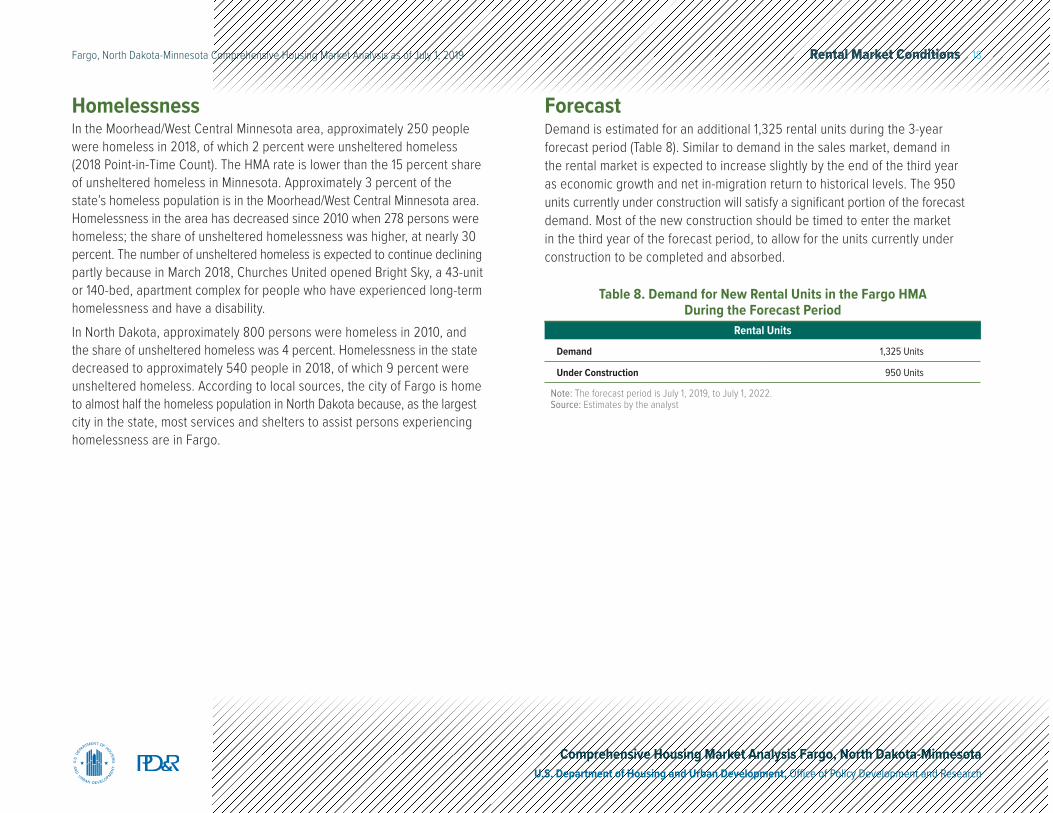
Note: The forecast period is July 1, 2019, to July 1, 2022.Source: Estimates by the analyst
Rental Units
Demand 1,325 Units
Under Construction 950 Units
Table 8. Demand for New Rental Units in the Fargo HMA During the Forecast Period
ForecastDemand is estimated for an additional 1,325 rental units during the 3-year forecast period (Table 8). Similar to demand in the sales market, demand in the rental market is expected to increase slightly by the end of the third year as economic growth and net in-migration return to historical levels. The 950 units currently under construction will satisfy a significant portion of the forecast demand. Most of the new construction should be timed to enter the market in the third year of the forecast period, to allow for the units currently under construction to be completed and absorbed.
Terminology Definitions and Notes 19Fargo, North Dakota-Minnesota Comprehensive Housing Market Analysis as of July 1, 2019
Comprehensive Housing Market Analysis Fargo, North Dakota-Minnesota U.S. Department of Housing and Urban Development, Office of Policy Development and Research
Terminology Definitions and Notes
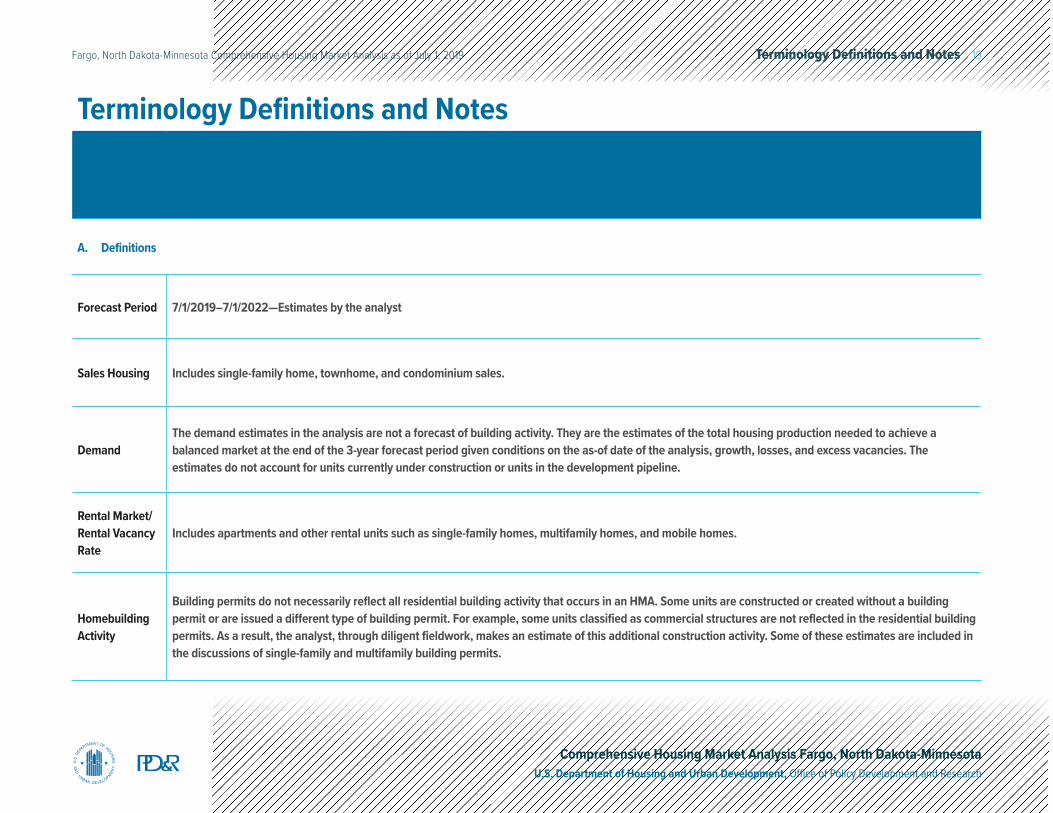
A. Definitions
Forecast Period 7/1/2019–7/1/2022—Estimates by the analyst
Sales Housing Includes single-family home, townhome, and condominium sales.
Demand
The demand estimates in the analysis are not a forecast of building activity. They are the estimates of the total housing production needed to achieve a balanced market at the end of the 3-year forecast period given conditions on the as-of date of the analysis, growth, losses, and excess vacancies. The estimates do not account for units currently under construction or units in the development pipeline.
Rental Market/Rental Vacancy Rate
Includes apartments and other rental units such as single-family homes, multifamily homes, and mobile homes.
Homebuilding Activity
Building permits do not necessarily reflect all residential building activity that occurs in an HMA. Some units are constructed or created without a building permit or are issued a different type of building permit. For example, some units classified as commercial structures are not reflected in the residential building permits. As a result, the analyst, through diligent fieldwork, makes an estimate of this additional construction activity. Some of these estimates are included in the discussions of single-family and multifamily building permits.
Terminology Definitions and Notes 20Fargo, North Dakota-Minnesota Comprehensive Housing Market Analysis as of July 1, 2019
Comprehensive Housing Market Analysis Fargo, North Dakota-Minnesota U.S. Department of Housing and Urban Development, Office of Policy Development and Research
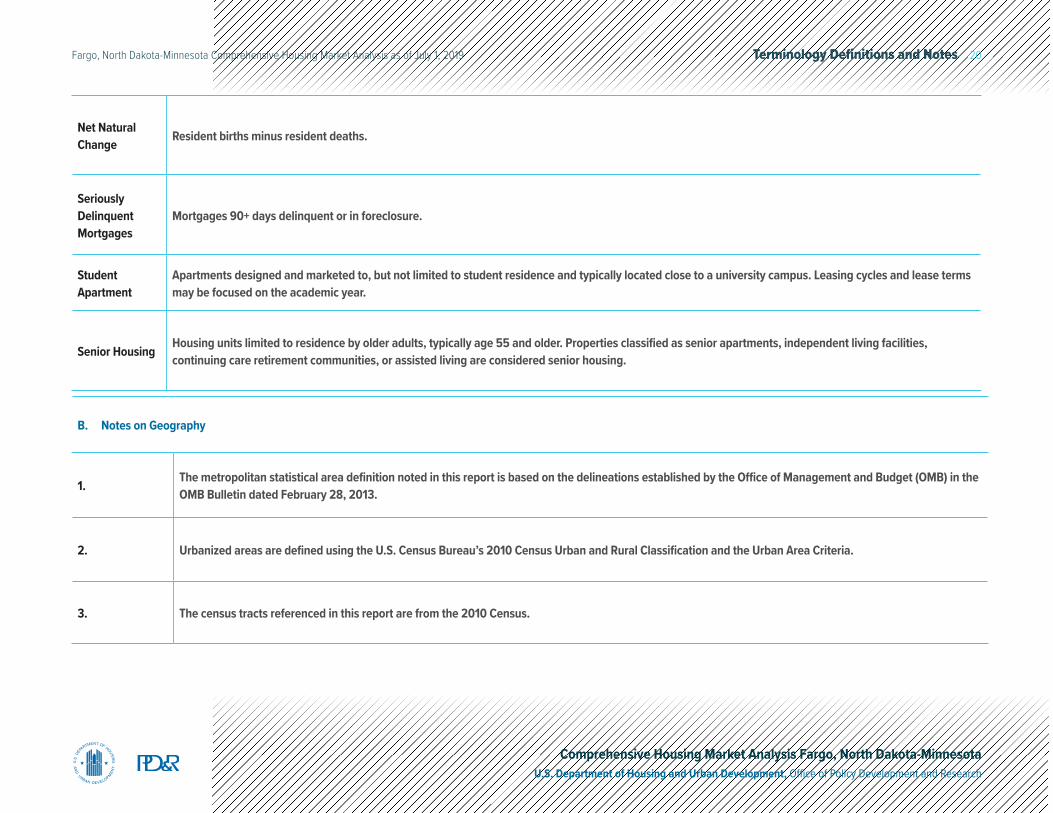
Net Natural Change Resident births minus resident deaths.
Seriously Delinquent Mortgages
Mortgages 90+ days delinquent or in foreclosure.
Student Apartment
Apartments designed and marketed to, but not limited to student residence and typically located close to a university campus. Leasing cycles and lease terms may be focused on the academic year.
Senior Housing Housing units limited to residence by older adults, typically age 55 and older. Properties classified as senior apartments, independent living facilities,
continuing care retirement communities, or assisted living are considered senior housing.
B. Notes on Geography
1. The metropolitan statistical area definition noted in this report is based on the delineations established by the Office of Management and Budget (OMB) in the OMB Bulletin dated February 28, 2013.
2. Urbanized areas are defined using the U.S. Census Bureau’s 2010 Census Urban and Rural Classification and the Urban Area Criteria.
3. The census tracts referenced in this report are from the 2010 Census.
Terminology Definitions and Notes 21Fargo, North Dakota-Minnesota Comprehensive Housing Market Analysis as of July 1, 2019
Comprehensive Housing Market Analysis Fargo, North Dakota-Minnesota U.S. Department of Housing and Urban Development, Office of Policy Development and Research
C. Additional Notes
1.This analysis has been prepared for the assistance and guidance of HUD in its operations. The factual information, findings, and conclusions may also be useful to builders, mortgagees, and others concerned with local housing market conditions and trends. The analysis does not purport to make determinations regarding the acceptability of any mortgage insurance proposals that may be under consideration by the Department.
2.
The factual framework for this analysis follows the guidelines and methods developed by the Economic and Market Analysis Division within HUD. The analysis and findings are as thorough and current as possible based on information available on the as-of date from local and national sources. As such, findings or conclusions may be modified by subsequent developments. HUD expresses its appreciation to those industry sources and state and local government officials who provided data and information on local economic and housing market conditions.
Cover Photo iStock
Contact InformationDiana Villavicencio, Economist Chicago HUD Regional Office312–913–[email protected]