comprehensive housing market analysis for milwaukee … … · comprehensive housing market...
TRANSCRIPT
C O M P R E H E N S I V E H O U S I N G M A R K E T A N A L Y S I S
Milwaukee-Waukesha-West Allis,Wisconsin
As of September 1, 2016U.S. Department of Housing and Urban Development Office of Policy Development and Research
Dodge
RacineWalworth
SheboyganFond du Lac
Jeff
erso
n
Waukesha
Washington Ozaukee
LakeMichigan
Milwaukee
Housing Market Area
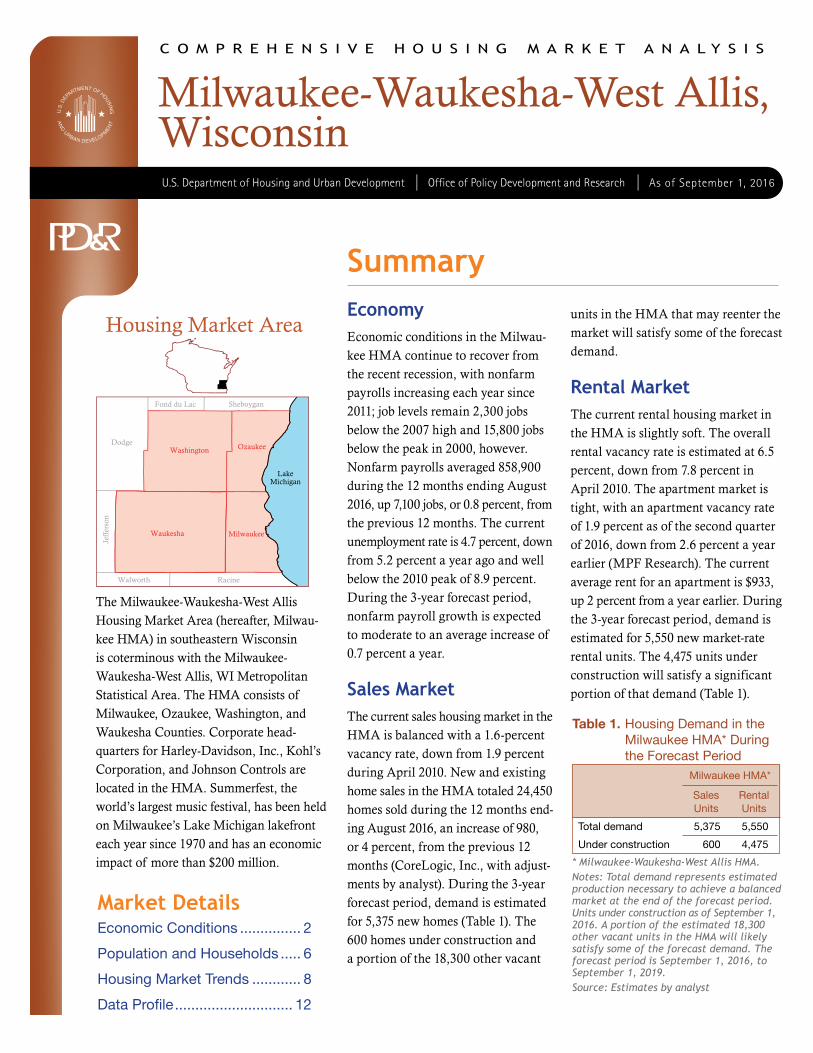
The Milwaukee-Waukesha-West Allis Housing Market Area (hereafter, Milwau-kee HMA) in southeastern Wisconsin is coterminous with the Milwaukee-Waukesha-West Allis, WI Metropolitan Statistical Area. The HMA consists of Milwaukee, Ozaukee, Washington, and Waukesha Counties. Corporate head-quarters for Harley-Davidson, Inc., Kohl’s Corporation, and Johnson Controls are located in the HMA. Summerfest, the world’s largest music festival, has been held on Milwaukee’s Lake Michigan lakefront each year since 1970 and has an economic impact of more than $200 million.
Market DetailsEconomic Conditions ............... 2
Population and Households ..... 6
Housing Market Trends ............ 8
Data Profile ............................. 12
SummaryEconomy Economic conditions in the Milwau-kee HMA continue to recover from the recent recession, with nonfarm payrolls increasing each year since 2011; job levels remain 2,300 jobs below the 2007 high and 15,800 jobs below the peak in 2000, however. Nonfarm payrolls averaged 858,900 during the 12 months ending August 2016, up 7,100 jobs, or 0.8 percent, from the previous 12 months. The current unemployment rate is 4.7 percent, down from 5.2 percent a year ago and well below the 2010 peak of 8.9 percent. During the 3-year forecast period, nonfarm payroll growth is expected to moderate to an average increase of 0.7 percent a year.
Sales MarketThe current sales housing market in the HMA is balanced with a 1.6- percent vacancy rate, down from 1.9 percent during April 2010. New and existing home sales in the HMA totaled 24,450 homes sold during the 12 months end-ing August 2016, an increase of 980, or 4 percent, from the previous 12 months (CoreLogic, Inc., with adjust-ments by analyst). During the 3-year forecast period, demand is estimated for 5,375 new homes (Table 1). The 600 homes under construction and a portion of the 18,300 other vacant
units in the HMA that may reenter the market will satisfy some of the forecast demand.
Rental MarketThe current rental housing market in the HMA is slightly soft. The overall rental vacancy rate is estimated at 6.5 percent, down from 7.8 percent in April 2010. The apartment market is tight, with an apartment vacancy rate of 1.9 percent as of the second quarter of 2016, down from 2.6 percent a year earlier (MPF Research). The current average rent for an apartment is $933, up 2 percent from a year earlier. During the 3-year forecast period, demand is estimated for 5,550 new market-rate rental units. The 4,475 units under construction will satisfy a significant portion of that demand (Table 1).
Table 1. Housing Demand in the Milwaukee HMA* During the Forecast Period
Milwaukee HMA*
SalesUnits
RentalUnits
Total demand 5,375 5,550
Under construction 600 4,475
* Milwaukee-Waukesha-West Allis HMA.Notes: Total demand represents estimated production necessary to achieve a balanced market at the end of the forecast period. Units under construction as of September 1, 2016. A portion of the estimated 18,300 other vacant units in the HMA will likely satisfy some of the forecast demand. The forecast period is September 1, 2016, to September 1, 2019.Source: Estimates by analyst
Mil
wa
uk
ee
-Wa
uk
es
ha
-We
st
All
is,
WI
• C
OM
PR
EH
EN
SIV
E H
OU
SIN
G M
AR
KE
T A
NA
LYS
IS
2Economic Conditions
In the early 1980s, the Milwaukee HMA was considered the beer
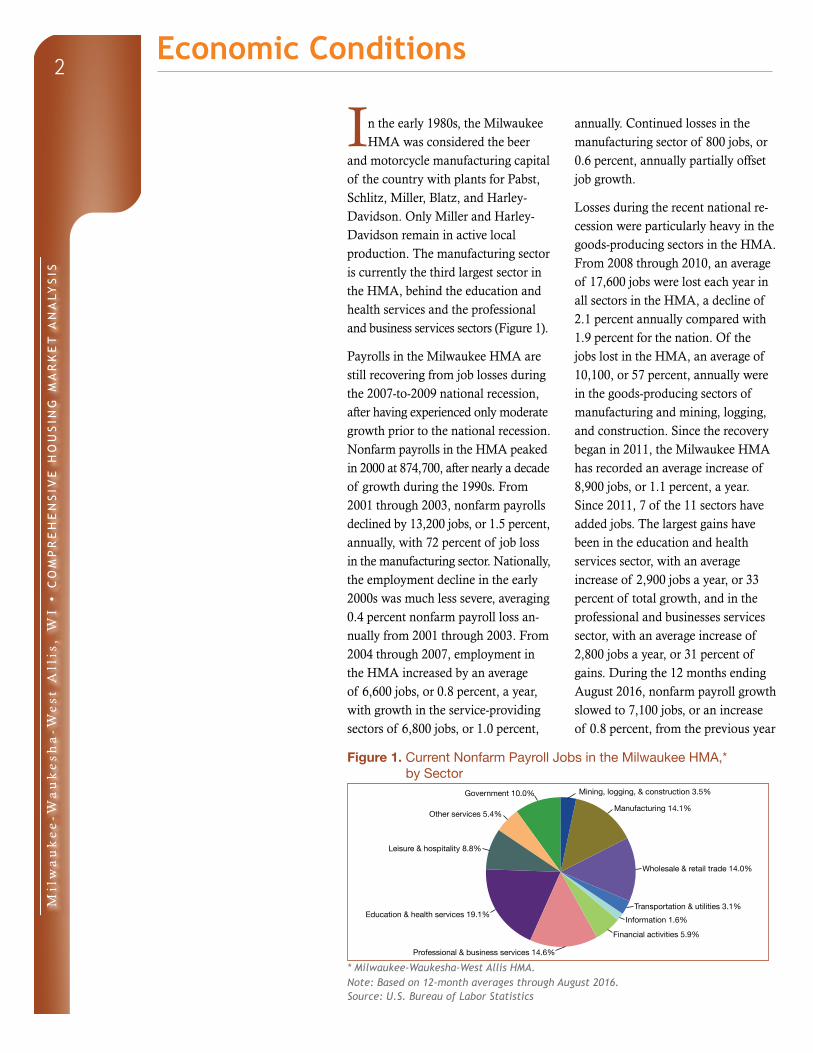
and motorcycle manufacturing capital of the country with plants for Pabst, Schlitz, Miller, Blatz, and Harley-Davidson. Only Miller and Harley-Davidson remain in active local pro duction. The manufacturing sector is currently the third largest sector in the HMA, behind the education and health services and the professional and business services sectors (Figure 1).
Payrolls in the Milwaukee HMA are still recovering from job losses during the 2007-to-2009 national recession, after having experienced only moderate growth prior to the national reces sion. Nonfarm payrolls in the HMA peaked in 2000 at 874,700, after nearly a decade of growth during the 1990s. From 2001 through 2003, nonfarm payrolls declined by 13,200 jobs, or 1.5 percent, annually, with 72 percent of job loss in the manufacturing sector. Nationally, the employment decline in the early 2000s was much less severe, averaging 0.4 percent nonfarm payroll loss an-nually from 2001 through 2003. From 2004 through 2007, employment in the HMA increased by an average of 6,600 jobs, or 0.8 percent, a year, with growth in the service-providing sectors of 6,800 jobs, or 1.0 percent,
annually. Continued losses in the manufacturing sector of 800 jobs, or 0.6 percent, annually partially offset job growth.
Losses during the recent national re-cession were particularly heavy in the goods-producing sectors in the HMA. From 2008 through 2010, an average of 17,600 jobs were lost each year in all sectors in the HMA, a decline of 2.1 percent annually compared with 1.9 percent for the nation. Of the jobs lost in the HMA, an average of 10,100, or 57 percent, annually were in the goods-producing sectors of manufacturing and mining, logging, and construction. Since the recovery began in 2011, the Milwaukee HMA has recorded an average increase of 8,900 jobs, or 1.1 percent, a year. Since 2011, 7 of the 11 sectors have added jobs. The largest gains have been in the education and health services sector, with an average increase of 2,900 jobs a year, or 33 percent of total growth, and in the professional and businesses services sector, with an average increase of 2,800 jobs a year, or 31 percent of gains. During the 12 months ending August 2016, nonfarm payroll growth slowed to 7,100 jobs, or an increase of 0.8 percent, from the previous year
Figure 1. Current Nonfarm Payroll Jobs in the Milwaukee HMA,* by Sector
Government 10.0%
Leisure & hospitality 8.8%
Other services 5.4%
Education & health services 19.1%
Professional & business services 14.6%
Wholesale & retail trade 14.0%
Manufacturing 14.1%
Mining, logging, & construction 3.5%
Information 1.6%Transportation & utilities 3.1%
Financial activities 5.9%
* Milwaukee-Waukesha-West Allis HMA.Note: Based on 12-month averages through August 2016.Source: U.S. Bureau of Labor Statistics
Mil
wa
uk
ee
-Wa
uk
es
ha
-We
st
All
is,
WI
• C
OM
PR
EH
EN
SIV
E H
OU
SIN
G M
AR
KE
T A
NA
LYS
IS
3
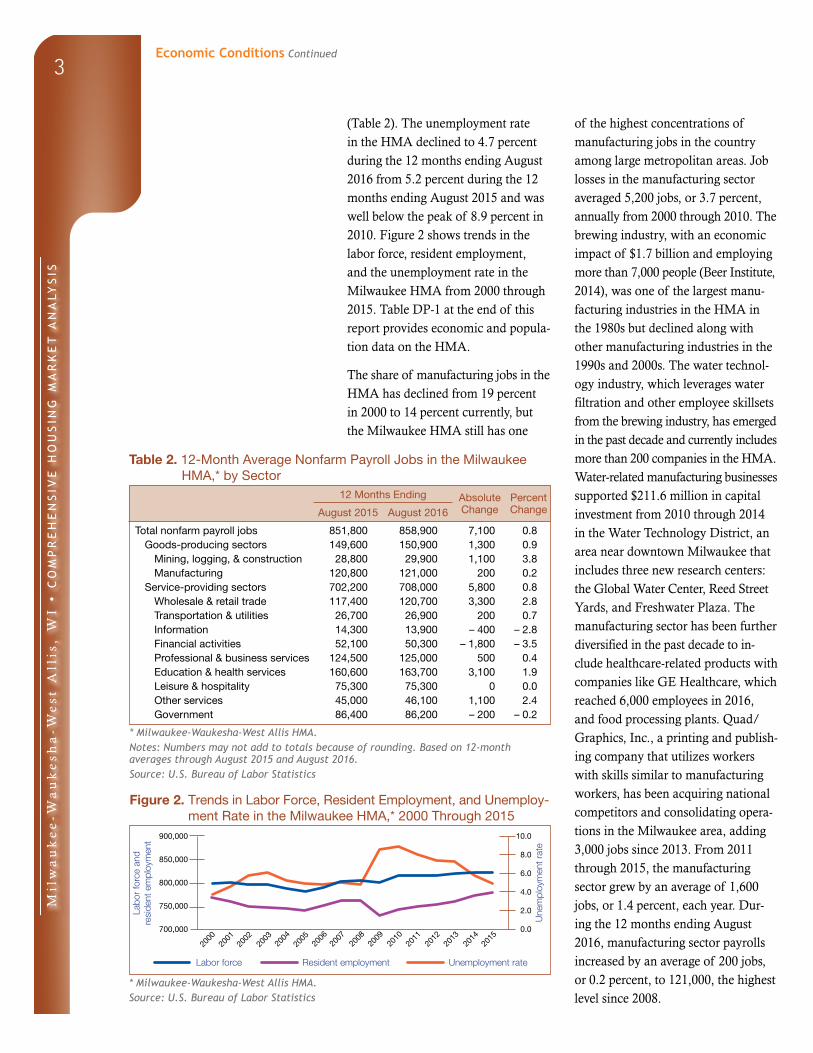
(Table 2). The unemployment rate in the HMA declined to 4.7 percent during the 12 months ending August 2016 from 5.2 percent during the 12 months ending August 2015 and was well below the peak of 8.9 percent in 2010. Figure 2 shows trends in the labor force, resident employment, and the unemployment rate in the Milwaukee HMA from 2000 through 2015. Table DP-1 at the end of this report provides economic and popula-tion data on the HMA.
The share of manufacturing jobs in the HMA has declined from 19 percent in 2000 to 14 percent currently, but the Milwaukee HMA still has one
of the highest concentrations of manufacturing jobs in the country among large metropolitan areas. Job losses in the manufacturing sector averaged 5,200 jobs, or 3.7 percent, annually from 2000 through 2010. The brewing industry, with an economic impact of $1.7 billion and employing more than 7,000 people (Beer Institute, 2014), was one of the largest manu-facturing industries in the HMA in the 1980s but declined along with other manufacturing industries in the 1990s and 2000s. The water technol-ogy industry, which leverages water filtration and other employee skillsets from the brewing industry, has emerged in the past decade and currently includes more than 200 companies in the HMA. Water-related manufacturing businesses supported $211.6 million in capital investment from 2010 through 2014 in the Water Technology District, an area near downtown Milwaukee that includes three new research centers: the Global Water Center, Reed Street Yards, and Freshwater Plaza. The manufacturing sector has been further diversified in the past decade to in-clude healthcare-related products with companies like GE Healthcare, which reached 6,000 employees in 2016, and food processing plants. Quad/Graphics, Inc., a printing and publish-ing company that utilizes workers with skills similar to manufacturing workers, has been acquiring national competitors and consolidating opera-tions in the Milwaukee area, adding 3,000 jobs since 2013. From 2011 through 2015, the manufacturing sector grew by an average of 1,600 jobs, or 1.4 percent, each year. Dur-ing the 12 months ending August 2016, manufacturing sector payrolls increased by an average of 200 jobs, or 0.2 percent, to 121,000, the highest level since 2008.
Table 2. 12-Month Average Nonfarm Payroll Jobs in the Milwaukee HMA,* by Sector
12 Months Ending Absolute Change
Percent ChangeAugust 2015 August 2016
Total nonfarm payroll jobs 851,800 858,900 7,100 0.8Goods-producing sectors 149,600 150,900 1,300 0.9
Mining, logging, & construction 28,800 29,900 1,100 3.8Manufacturing 120,800 121,000 200 0.2
Service-providing sectors 702,200 708,000 5,800 0.8Wholesale & retail trade 117,400 120,700 3,300 2.8Transportation & utilities 26,700 26,900 200 0.7Information 14,300 13,900 – 400 – 2.8Financial activities 52,100 50,300 – 1,800 – 3.5Professional & business services 124,500 125,000 500 0.4Education & health services 160,600 163,700 3,100 1.9Leisure & hospitality 75,300 75,300 0 0.0Other services 45,000 46,100 1,100 2.4Government 86,400 86,200 – 200 – 0.2
* Milwaukee-Waukesha-West Allis HMA.Notes: Numbers may not add to totals because of rounding. Based on 12-month averages through August 2015 and August 2016.Source: U.S. Bureau of Labor Statistics
Figure 2. Trends in Labor Force, Resident Employment, and Unemploy-ment Rate in the Milwaukee HMA,* 2000 Through 2015
Une
mpl
oym
ent r
ate
Labo
r fo
rce
and
resi
dent
em
ploy
men
t 900,000
850,000
800,000
750,000
700,000
2000
2002
2004
Labor force Resident employment Unemployment rate
10.0
8.0
6.0
4.0
2.0
0.0
2006
2001
2003
2005
2007
2009
2010
2008
2012
2013
2015
2014
2011
* Milwaukee-Waukesha-West Allis HMA.Source: U.S. Bureau of Labor Statistics
Economic Conditions Continued
Mil
wa
uk
ee
-Wa
uk
es
ha
-We
st
All
is,
WI
• C
OM
PR
EH
EN
SIV
E H
OU
SIN
G M
AR
KE
T A
NA
LYS
IS
4
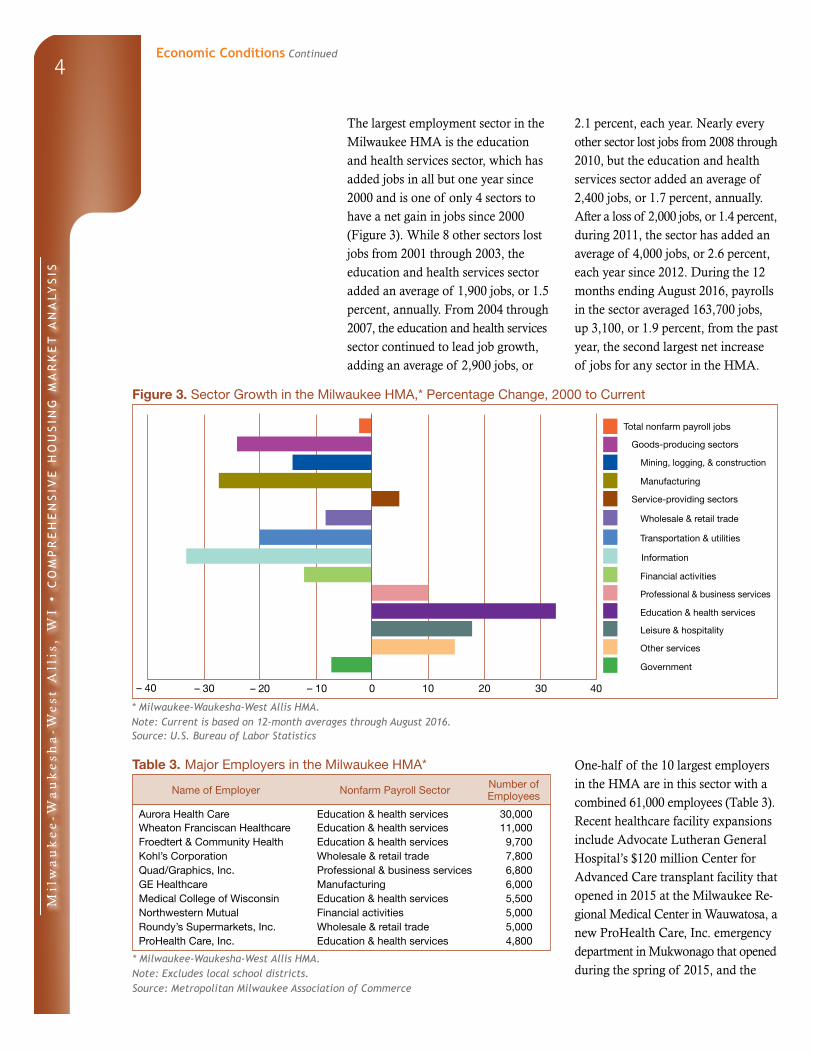
The largest employment sector in the Milwaukee HMA is the education and health services sector, which has added jobs in all but one year since 2000 and is one of only 4 sectors to have a net gain in jobs since 2000 (Figure 3). While 8 other sectors lost jobs from 2001 through 2003, the education and health services sector added an average of 1,900 jobs, or 1.5 percent, annually. From 2004 through 2007, the education and health services sector continued to lead job growth, adding an average of 2,900 jobs, or
2.1 percent, each year. Nearly every other sector lost jobs from 2008 through 2010, but the education and health services sector added an average of 2,400 jobs, or 1.7 percent, annually. After a loss of 2,000 jobs, or 1.4 percent, during 2011, the sector has added an average of 4,000 jobs, or 2.6 percent, each year since 2012. During the 12 months ending August 2016, payrolls in the sector averaged 163,700 jobs, up 3,100, or 1.9 percent, from the past year, the second largest net increase of jobs for any sector in the HMA.
Figure 3. Sector Growth in the Milwaukee HMA,* Percentage Change, 2000 to Current
Total nonfarm payroll jobs
Goods-producing sectors
Mining, logging, & construction
Manufacturing
Service-providing sectors
Information
Financial activities
Professional & business services
Education & health services
Government
Other services
Leisure & hospitality
Transportation & utilities
Wholesale & retail trade
– 20 – 10 200 10– 30– 40 30 40
* Milwaukee-Waukesha-West Allis HMA.Note: Current is based on 12-month averages through August 2016.Source: U.S. Bureau of Labor Statistics
Table 3. Major Employers in the Milwaukee HMA*
Name of Employer Nonfarm Payroll Sector Number of Employees
Aurora Health Care Education & health services 30,000Wheaton Franciscan Healthcare Education & health services 11,000Froedtert & Community Health Education & health services 9,700Kohl’s Corporation Wholesale & retail trade 7,800Quad/Graphics, Inc. Professional & business services 6,800GE Healthcare Manufacturing 6,000Medical College of Wisconsin Education & health services 5,500Northwestern Mutual Financial activities 5,000Roundy’s Supermarkets, Inc. Wholesale & retail trade 5,000ProHealth Care, Inc. Education & health services 4,800
* Milwaukee-Waukesha-West Allis HMA.Note: Excludes local school districts.Source: Metropolitan Milwaukee Association of Commerce
One-half of the 10 largest employers in the HMA are in this sector with a combined 61,000 employees (Table 3). Recent healthcare facility expansions include Advocate Lutheran General Hospital’s $120 million Center for Advanced Care transplant facility that opened in 2015 at the Milwaukee Re-gional Medical Center in Wauwatosa, a new ProHealth Care, Inc. emergency department in Mukwonago that opened during the spring of 2015, and the
Economic Conditions Continued
Mil
wa
uk
ee
-Wa
uk
es
ha
-We
st
All
is,
WI
• C
OM
PR
EH
EN
SIV
E H
OU
SIN
G M
AR
KE
T A
NA
LYS
IS
5
new Aurora Health Care Germantown North clinic that opened in August 2016. No job announcements were made with these facility expansions. Also, 12 private universities with more than 3,500 employees and 32,000 students are in the HMA, including the Medical College of Wisconsin, Marquette University, the Milwaukee School of Engineering, and the Mil-waukee Institute of Art & Design.
The mining, logging, and construc-tion sector had prolonged job losses during the recent recession but has the fastest growth rate of all employ-ment sectors in the HMA since it began adding jobs in 2013. Payrolls declined by an average of 2,400, or 7.7 percent, annually from 2008 through 2012 because of low levels of residential and commercial construc-tion activity. Since 2013, the sector has added an average of 1,600 jobs, or 6.1 percent, annually, including an increase of 1,100 jobs, or 3.8 percent, during the past 12 months. During 2015, 18 large construction projects were active, each with individual development costs in excess of $40 million, up from 11 projects of such size in 2014. The largest projects under way are a $450 million office building and corporate headquarters for Northwestern Mutual and a $350 million Wisconsin Entertainment and Sports Center that includes a new arena for the Milwaukee Bucks Na-tional Basketball Association team.
The wholesale and retail trade sector added the most jobs of any sector during the past 12 months, with an increase of 3,300, or 2.8 percent, up from an average increase of 800 jobs, or 0.7 percent, a year from 2011
through 2015. Approximately 75 per-cent of job growth in the sector since 2011 was in the retail trade sub sector. Store openings at two new lifestyle centers, The Mayfair Collection in Wauwatosa and the Drexel Town Square in Oak Creek, contributed to the recent job gains. No job counts were announced with the store open-ings.
The financial activities sector had the largest job loss of the 3 sectors that recorded losses in the HMA during the past 12 months with a decline of 1,800 jobs, or 3.5 percent. Layoffs during 2015 and 2016—including 135 employees at JPMorgan Chase & Company, 840 employees at Wells Fargo & Co., and 1,200 employees at Assurant Health—offset small gains elsewhere in the sector.
During the next 3 years, employment in the HMA is expected to grow, but more slowly than during the past year, averaging 6,000 jobs, or 0.7 percent, annually. Jobs in the manufacturing and the education and health services sectors are expected to lead employ ment gains. Milwaukee Tool Corpora tion, a tool manufacturing company, broke ground on a $35 million corporate headquarters expansion during April 2016 and is expected to add nearly 600 employees during the next 5 years. Zurn Industries is constructing its new corporate headquarters in Reed Street Yards, one of the water research parks, and is expected to move as many as 120 employees to the HMA from Pennsylvania later in 2016. Offsetting expected hiring are announced layoffs of 130 workers at Joy Global Inc. and expected layoffs at Harley-Davidson and Northwestern Mutual.
Economic Conditions Continued
Mil
wa
uk
ee
-Wa
uk
es
ha
-We
st
All
is,
WI
• C
OM
PR
EH
EN
SIV
E H
OU
SIN
G M
AR
KE
T A
NA
LYS
IS
6Population and Households
The Milwaukee HMA, the largest metropolitan area in Wisconsin,
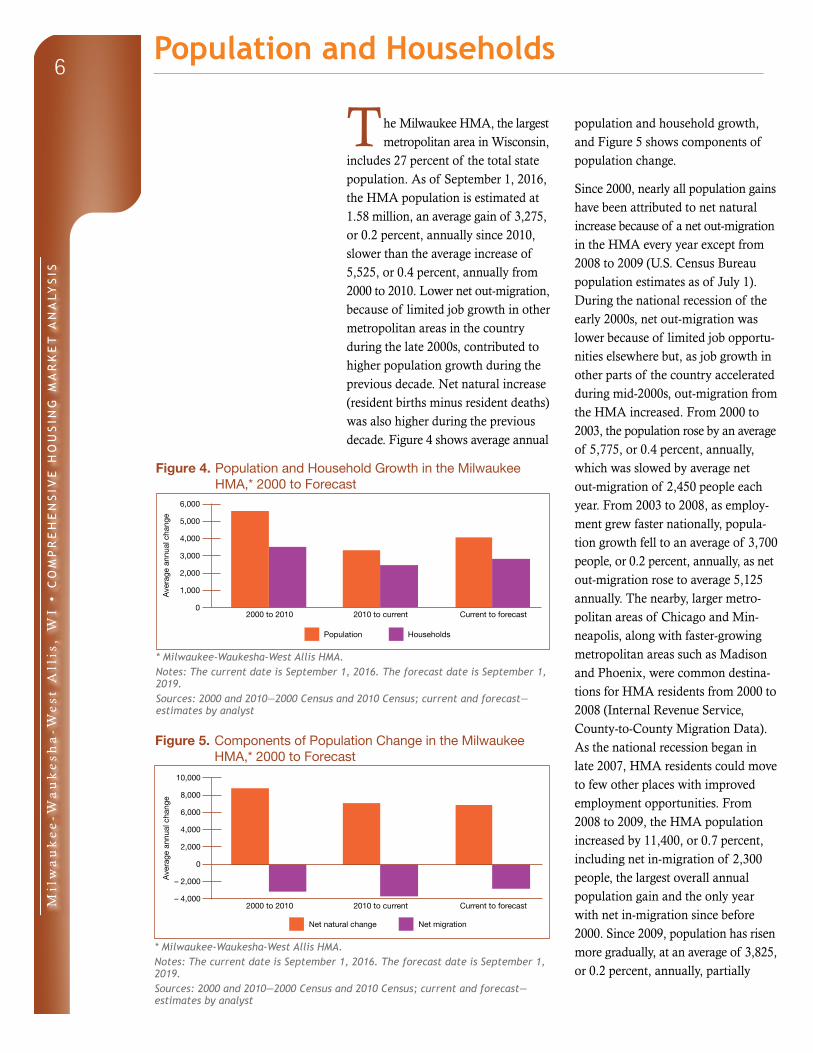
includes 27 percent of the total state population. As of September 1, 2016, the HMA population is estimated at 1.58 million, an average gain of 3,275, or 0.2 percent, annually since 2010, slower than the average increase of 5,525, or 0.4 percent, annually from 2000 to 2010. Lower net out-migration, because of limited job growth in other metropolitan areas in the country during the late 2000s, contributed to higher population growth during the previous decade. Net natural increase (resident births minus resident deaths) was also higher during the previous decade. Figure 4 shows average annual
population and household growth, and Figure 5 shows components of population change.
Since 2000, nearly all population gains have been attributed to net natural in crease because of a net out-migration in the HMA every year except from 2008 to 2009 (U.S. Census Bureau population estimates as of July 1). During the national recession of the early 2000s, net out-migration was lower because of limited job opportu-nities elsewhere but, as job growth in other parts of the country accelerated during mid-2000s, out-migration from the HMA increased. From 2000 to 2003, the population rose by an aver age of 5,775, or 0.4 percent, annually, which was slowed by average net out-migration of 2,450 people each year. From 2003 to 2008, as employ-ment grew faster nationally, popula-tion growth fell to an average of 3,700 people, or 0.2 percent, annually, as net out-migration rose to average 5,125 annually. The nearby, larger metro-politan areas of Chicago and Min-neapolis, along with faster-growing metropolitan areas such as Madison and Phoenix, were common destina-tions for HMA residents from 2000 to 2008 (Internal Revenue Service, County- to-County Migration Data). As the national recession began in late 2007, HMA residents could move to few other places with improved employment opportunities. From 2008 to 2009, the HMA population increased by 11,400, or 0.7 percent, including net in-migration of 2,300 people, the largest overall annual population gain and the only year with net in-migration since before 2000. Since 2009, population has risen more gradually, at an average of 3,825, or 0.2 percent, annually, partially
Figure 4. Population and Household Growth in the Milwaukee HMA,* 2000 to Forecast
Population Households
6,000
5,000
4,000
3,000
2,000
1,000
02000 to 2010 2010 to current Current to forecast
Ave
rage
ann
ual c
hang
e
* Milwaukee-Waukesha-West Allis HMA.Notes: The current date is September 1, 2016. The forecast date is September 1, 2019.Sources: 2000 and 2010—2000 Census and 2010 Census; current and forecast—estimates by analyst
Figure 5. Components of Population Change in the Milwaukee HMA,* 2000 to Forecast
10,000
8,000
6,000
4,000
2,000
0
– 2,000
– 4,0002000 to 2010 2010 to current Current to forecast
Ave
rage
ann
ual c
hang
e
Net natural change Net migration
* Milwaukee-Waukesha-West Allis HMA.Notes: The current date is September 1, 2016. The forecast date is September 1, 2019.Sources: 2000 and 2010—2000 Census and 2010 Census; current and forecast—estimates by analyst
Mil
wa
uk
ee
-Wa
uk
es
ha
-We
st
All
is,
WI
• C
OM
PR
EH
EN
SIV
E H
OU
SIN
G M
AR
KE
T A
NA
LYS
IS
7
because of faster payroll growth in many places outside the HMA. Net out-migration averaged 3,350 people annually, increasing in more recent years because recovery and job growth have been faster in other metropolitan areas around the country. The Chicago, Minneapolis, and Madison metropol-itan areas continue to be common destinations for people leaving the HMA but, since 2009, the Dallas, Austin, and Houston, Texas metropoli-tan areas have increased in popularity for residents moving from the HMA.
Within the HMA, population growth in downtown Milwaukee is outpacing growth for the area as a whole. From 2010 to 2014, downtown Milwaukee added an estimated 770 residents a year, or growth of approximately 2.5 percent, annually (analyst estimates). Since 2010, a surge in downtown housing construction and the reloca-tion of more than 46 companies into downtown from suburbia and areas outside the HMA contributed to a rising downtown population. Compa-nies relocating to the downtown area include a satellite office for Kohler Co., Jones Lang LaSalle, and Aecom/URS from suburban parts of the HMA and Lohmann & Rauscher, a medical
device manufacturing company, from Topeka, Kansas. No job counts were announced with the moves.
During the next 3 years, population is expected to increase by an average of 4,000, or 0.3 percent, annually as expected job growth slows out-migration.
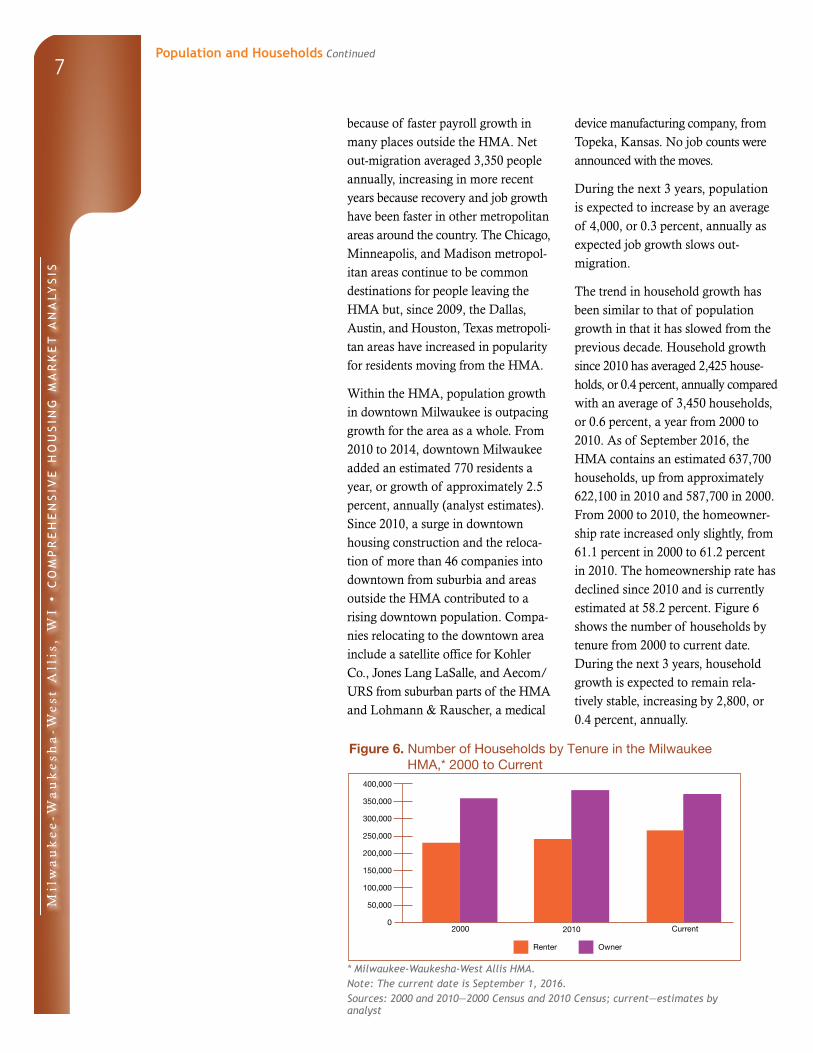
The trend in household growth has been similar to that of population growth in that it has slowed from the previous decade. Household growth since 2010 has averaged 2,425 house-holds, or 0.4 percent, annually compared with an average of 3,450 households, or 0.6 percent, a year from 2000 to 2010. As of September 2016, the HMA contains an estimated 637,700 households, up from approximately 622,100 in 2010 and 587,700 in 2000. From 2000 to 2010, the homeowner-ship rate increased only slightly, from 61.1 percent in 2000 to 61.2 percent in 2010. The homeownership rate has declined since 2010 and is currently estimated at 58.2 percent. Figure 6 shows the number of households by tenure from 2000 to current date. During the next 3 years, household growth is expected to remain rela-tively stable, increasing by 2,800, or 0.4 percent, annually.
Figure 6. Number of Households by Tenure in the Milwaukee HMA,* 2000 to Current
2000 2010 Current
Renter Owner
400,000
350,000
300,000
250,000
200,000
150,000
100,000
50,000
0
* Milwaukee-Waukesha-West Allis HMA.Note: The current date is September 1, 2016.Sources: 2000 and 2010—2000 Census and 2010 Census; current—estimates by analyst
Population and Households Continued
Mil
wa
uk
ee
-Wa
uk
es
ha
-We
st
All
is,
WI
• C
OM
PR
EH
EN
SIV
E H
OU
SIN
G M
AR
KE
T A
NA
LYS
IS
8Housing Market Trends
Sales Market
The sales housing market in the Mil waukee HMA is currently balanced, with an estimated vacancy rate of 1.6 percent, down from 1.9 percent in April 2010. Existing home sales (including single-family homes, townhomes, and condominiums) in the HMA totaled 23,700 during the 12 months ending August 2016, up 1,025, or 5 percent, from the previous year, continuing a trend of increasing or stable sales that began during 2012 (CoreLogic, Inc., with adjustments by the analyst). Limited growth in sales is partially because of limited inventory. During August 2016, the 5.8 months of inven tory was down from 7.0 months dur ing August 2015 and 8.3 months during August 2014 (Greater Milwau-kee Association of Realtors®). Despite recent gains, existing sales are still below levels from 2003 through 2006, when an average of 31,550 homes sold each year, but above the average of 17,200 sales a year from 2007 through 2011. Sales increased 42 percent from 2011 to 2012 and then stabilized, averaging 21,450 annually from 2012 through 2015. Average sales prices for existing homes are increasing, up 2 percent to $199,100 during the 12 months ending August 2016, continu-ing a trend of increasing prices that began in 2014. The average sales price for an existing home is up 16 percent, or $27,700, from the low of $171,500 in 2009 but is 3 percent, or $6,200, below the 2007 peak of $206,700. Distressed sales—including real estate owned (REO) and short sales—comprised 13 percent of all existing sales during the past 12 months, down from a high of 24 percent during 2011. In August 2016, 2.5 percent of all mortgage loans in the HMA were 90 or more
days delinquent, were in foreclosure, or had transitioned into REO status, down from the 3.1-percent rate in August 2015 and well below the peak of 6.2 percent in early 2010.
New home sales remained stable during the past 12 months, at 740, but were down 20 percent compared with new home sales during 2012 and 2013. Recent housing construction has shifted more to apartments and to development in or near downtown Milwaukee, following business reloca-tions and increased development of new retail and entertainment venues. The average sales price for a new home during the 12 months ending August 2016 was $266,100, down 2 percent from a year earlier, and 5 percent, or $12,900, below the prerecessionary peak in 2007 of $279,000. New home sales prices declined at an average of 4 percent a year from 2008 through 2012. Despite the decline during the past 12 months, average sales prices were still up 17 percent, or $44,200 from the low of $221,900 in 2012. During 2014 and 2015, new home prices rose an average of 10 percent a year, nearly three times faster than existing home prices, widening the gap between new and existing home sales prices from less than 15 percent during 2012 to more than 20 percent during 2015.
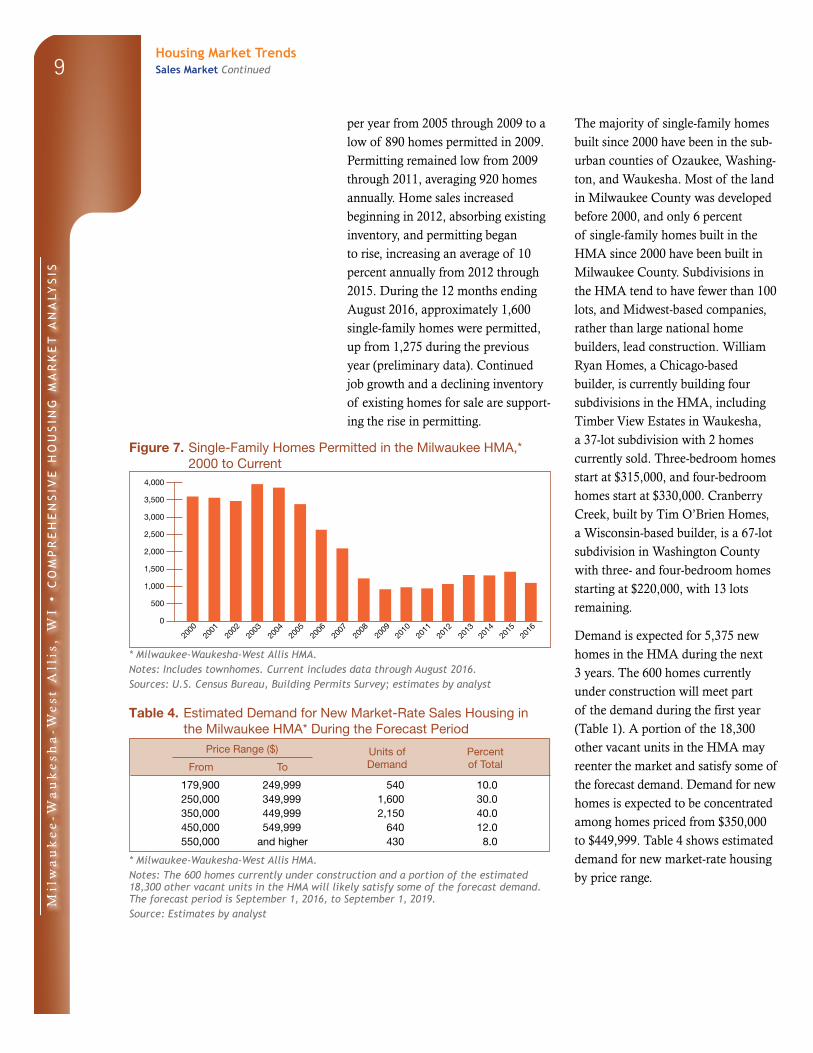
Single-family home construction, as measured by the number of homes permitted, was relatively strong from 2000 through 2005, averaging 3,625 homes annually (Figure 7). Coincid-ing with slower population growth in the mid-2000s, followed by the reces-sion in the late 2000s, homebuilding declined by an average of 620 homes
Mil
wa
uk
ee
-Wa
uk
es
ha
-We
st
All
is,
WI
• C
OM
PR
EH
EN
SIV
E H
OU
SIN
G M
AR
KE
T A
NA
LYS
IS
9
per year from 2005 through 2009 to a low of 890 homes permitted in 2009. Permitting remained low from 2009 through 2011, averaging 920 homes annually. Home sales increased beginning in 2012, absorbing existing inventory, and permitting began to rise, increasing an average of 10 percent annually from 2012 through 2015. During the 12 months ending August 2016, approximately 1,600 single-family homes were permitted, up from 1,275 during the previous year (preliminary data). Continued job growth and a declining inventory of existing homes for sale are support-ing the rise in permitting.
The majority of single-family homes built since 2000 have been in the sub-urban counties of Ozaukee, Washing-ton, and Waukesha. Most of the land in Milwaukee County was developed before 2000, and only 6 percent of single-family homes built in the HMA since 2000 have been built in Milwaukee County. Subdivisions in the HMA tend to have fewer than 100 lots, and Midwest-based companies, rather than large national home builders, lead construction. William Ryan Homes, a Chicago-based builder, is currently building four subdivisions in the HMA, including Timber View Estates in Waukesha, a 37-lot subdivision with 2 homes currently sold. Three-bedroom homes start at $315,000, and four-bedroom homes start at $330,000. Cranberry Creek, built by Tim O’Brien Homes, a Wisconsin-based builder, is a 67-lot subdivision in Washington County with three- and four-bedroom homes starting at $220,000, with 13 lots remaining.
Demand is expected for 5,375 new homes in the HMA during the next 3 years. The 600 homes currently under construction will meet part of the demand during the first year (Table 1). A portion of the 18,300 other vacant units in the HMA may reenter the market and satisfy some of the forecast demand. Demand for new homes is expected to be concentrated among homes priced from $350,000 to $449,999. Table 4 shows estimated demand for new market-rate housing by price range.
Figure 7. Single-Family Homes Permitted in the Milwaukee HMA,* 2000 to Current
2000
2001
2002
2003
2004
2005
2006
4,000
3,500
3,000
2,500
2,000
1,500
1,000
500
0
2008
2009
2010
2011
2013
2016
2015
2014
2012
2007
* Milwaukee-Waukesha-West Allis HMA.Notes: Includes townhomes. Current includes data through August 2016.Sources: U.S. Census Bureau, Building Permits Survey; estimates by analyst
Table 4. Estimated Demand for New Market-Rate Sales Housing in the Milwaukee HMA* During the Forecast Period
Price Range ($) Units of PercentFrom To Demand of Total
179,900 249,999 540 10.0250,000 349,999 1,600 30.0350,000 449,999 2,150 40.0450,000 549,999 640 12.0550,000 and higher 430 8.0
* Milwaukee-Waukesha-West Allis HMA.Notes: The 600 homes currently under construction and a portion of the estimated 18,300 other vacant units in the HMA will likely satisfy some of the forecast demand. The forecast period is September 1, 2016, to September 1, 2019.Source: Estimates by analyst
Housing Market TrendsSales Market Continued
Mil
wa
uk
ee
-Wa
uk
es
ha
-We
st
All
is,
WI
• C
OM
PR
EH
EN
SIV
E H
OU
SIN
G M
AR
KE
T A
NA
LYS
IS
10
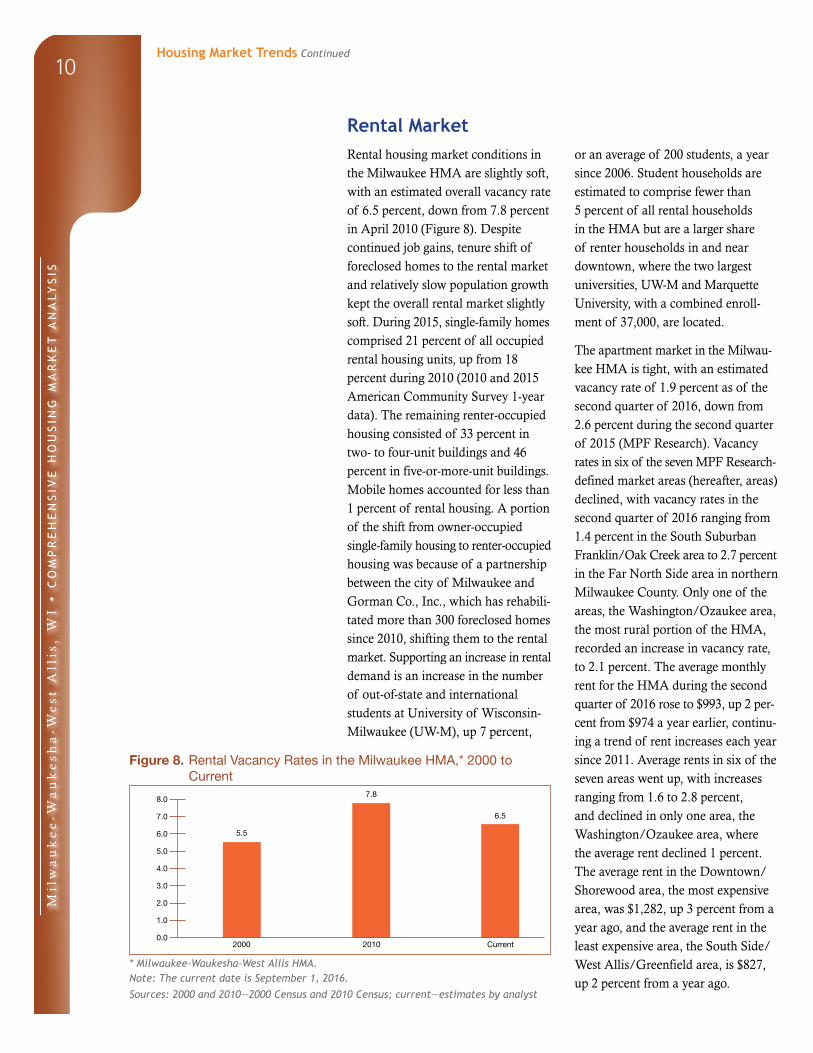
Rental MarketRental housing market conditions in the Milwaukee HMA are slightly soft, with an estimated overall vacancy rate of 6.5 percent, down from 7.8 percent in April 2010 (Figure 8). Despite continued job gains, tenure shift of foreclosed homes to the rental market and relatively slow population growth kept the overall rental market slightly soft. During 2015, single-family homes comprised 21 percent of all occupied rental housing units, up from 18 percent during 2010 (2010 and 2015 American Community Survey 1-year data). The remaining renter-occupied housing consisted of 33 percent in two- to four-unit buildings and 46 percent in five-or-more-unit buildings. Mobile homes accounted for less than 1 percent of rental housing. A portion of the shift from owner-occupied single-family housing to renter-occupied housing was because of a partnership between the city of Milwaukee and Gorman Co., Inc., which has rehabili-tated more than 300 foreclosed homes since 2010, shifting them to the rental market. Supporting an increase in rental demand is an increase in the number of out-of-state and international students at University of Wisconsin-Milwaukee (UW-M), up 7 percent,
or an average of 200 students, a year since 2006. Student households are estimated to comprise fewer than 5 percent of all rental households in the HMA but are a larger share of renter households in and near downtown, where the two largest universities, UW-M and Marquette University, with a combined enroll-ment of 37,000, are located.
The apartment market in the Milwau-kee HMA is tight, with an estimated vacancy rate of 1.9 percent as of the second quarter of 2016, down from 2.6 percent during the second quarter of 2015 (MPF Research). Vacancy rates in six of the seven MPF Research-defined market areas (hereafter, areas) declined, with vacancy rates in the second quarter of 2016 ranging from 1.4 percent in the South Suburban Franklin/Oak Creek area to 2.7 percent in the Far North Side area in northern Milwaukee County. Only one of the areas, the Washington/Ozaukee area, the most rural portion of the HMA, recorded an increase in vacancy rate, to 2.1 percent. The average monthly rent for the HMA during the second quarter of 2016 rose to $993, up 2 per-cent from $974 a year earlier, continu-ing a trend of rent increases each year since 2011. Average rents in six of the seven areas went up, with increases ranging from 1.6 to 2.8 percent, and declined in only one area, the Washington/Ozaukee area, where the average rent declined 1 percent. The average rent in the Downtown/Shorewood area, the most expensive area, was $1,282, up 3 percent from a year ago, and the average rent in the least expensive area, the South Side/West Allis/Greenfield area, is $827, up 2 percent from a year ago.
Figure 8. Rental Vacancy Rates in the Milwaukee HMA,* 2000 to Current
2000 Current2010
5.5
6.5
7.88.0
7.0
6.0
5.0
4.0
3.0
2.0
1.0
0.0
* Milwaukee-Waukesha-West Allis HMA.Note: The current date is September 1, 2016.
Sources: 2000 and 2010—2000 Census and 2010 Census; current—estimates by analyst
Housing Market Trends Continued
Mil
wa
uk
ee
-Wa
uk
es
ha
-We
st
All
is,
WI
• C
OM
PR
EH
EN
SIV
E H
OU
SIN
G M
AR
KE
T A
NA
LYS
IS
11
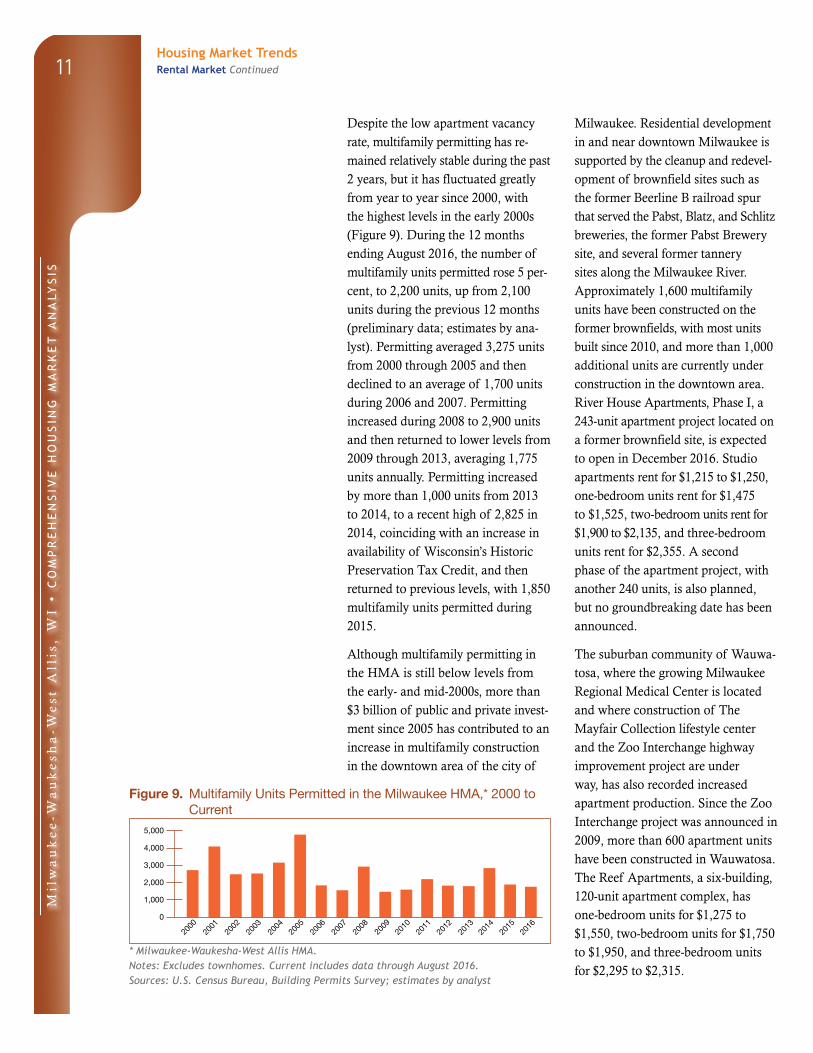
Despite the low apartment vacancy rate, multifamily permitting has re-mained relatively stable during the past 2 years, but it has fluctuated greatly from year to year since 2000, with the highest levels in the early 2000s (Figure 9). During the 12 months ending August 2016, the number of multifamily units permitted rose 5 per - cent, to 2,200 units, up from 2,100 units during the previous 12 months (preliminary data; estimates by ana-lyst). Permitting averaged 3,275 units from 2000 through 2005 and then declined to an average of 1,700 units during 2006 and 2007. Permitting increased during 2008 to 2,900 units and then returned to lower levels from 2009 through 2013, averaging 1,775 units annually. Permitting increased by more than 1,000 units from 2013 to 2014, to a recent high of 2,825 in 2014, coinciding with an increase in availability of Wisconsin’s Historic Preservation Tax Credit, and then returned to previous levels, with 1,850 multifamily units permitted during 2015.
Although multifamily permitting in the HMA is still below levels from the early- and mid-2000s, more than $3 bil lion of public and private invest-ment since 2005 has contributed to an increase in multifamily construction in the downtown area of the city of
Milwaukee. Residential development in and near downtown Milwaukee is supported by the cleanup and redevel-opment of brownfield sites such as the former Beerline B railroad spur that served the Pabst, Blatz, and Schlitz breweries, the former Pabst Brewery site, and several former tannery sites along the Milwaukee River. Approxi mately 1,600 multifamily units have been constructed on the former brownfields, with most units built since 2010, and more than 1,000 additional units are currently under construction in the downtown area. River House Apartments, Phase I, a 243-unit apartment project located on a former brownfield site, is expected to open in December 2016. Studio apartments rent for $1,215 to $1,250, one-bedroom units rent for $1,475 to $1,525, two-bedroom units rent for $1,900 to $2,135, and three-bedroom units rent for $2,355. A second phase of the apartment project, with another 240 units, is also planned, but no groundbreaking date has been announced.
The suburban community of Wauwa-tosa, where the growing Milwaukee Regional Medical Center is located and where construction of The Mayfair Collection lifestyle center and the Zoo Interchange highway improvement project are under way, has also recorded increased apartment production. Since the Zoo Interchange project was announced in 2009, more than 600 apartment units have been constructed in Wauwatosa. The Reef Apartments, a six-building, 120-unit apartment complex, has one-bedroom units for $1,275 to $1,550, two-bedroom units for $1,750 to $1,950, and three-bedroom units for $2,295 to $2,315.
Figure 9. Multifamily Units Permitted in the Milwaukee HMA,* 2000 to Current
2000
2001
2002
2003
2004
2005
2006
5,000
4,000
3,000
2,000
1,000
0
2008
2009
2010
2011
2013
2016
2015
2014
2012
2007
* Milwaukee-Waukesha-West Allis HMA.Notes: Excludes townhomes. Current includes data through August 2016.Sources: U.S. Census Bureau, Building Permits Survey; estimates by analyst
Housing Market TrendsRental Market Continued
Mil
wa
uk
ee
-Wa
uk
es
ha
-We
st
All
is,
WI
• C
OM
PR
EH
EN
SIV
E H
OU
SIN
G M
AR
KE
T A
NA
LYS
IS
12
During the 3-year forecast period, de-mand is expected for 5,550 additional rental units. The 4,475 units currently under construction are expected to meet approximately 80 percent of the forecast demand, including all
demand during the first two years of the forecast period (Table 1). Table 5 shows the estimated demand by rent level and number of bedrooms for new market-rate rental housing in HMA during the forecast period.
Table 5. Estimated Demand for New Market-Rate Rental Housing in the Milwaukee HMA* During the Forecast Period
Zero Bedrooms One Bedroom Two Bedrooms Three or More Bedrooms
Monthly Gross Rent ($)
Units of Demand
Monthly Gross Rent ($)
Units of Demand
Monthly Gross Rent ($)
Units of Demand
Monthly Gross Rent ($)
Units of Demand
875 to 1,074 220 1,000 to 1,199 500 1,300 to 1,499 660 1,800 or more 2801,075 or more 330 1,200 to 1,399 1,125 1,500 to 1,699 440
1,400 or more 870 1,700 to 1,899 4401,900 or more 660
Total 550 Total 2,500 Total 2,225 Total 280
* Milwaukee-Waukesha-West Allis HMA.Notes: Numbers may not add to totals because of rounding. Monthly rent does not include utilities or concessions. The 4,475 units currently under construction will likely satisfy some of the estimated demand. The forecast period is September 1, 2016, to September 1, 2019.Source: Estimates by analyst
Data Profile
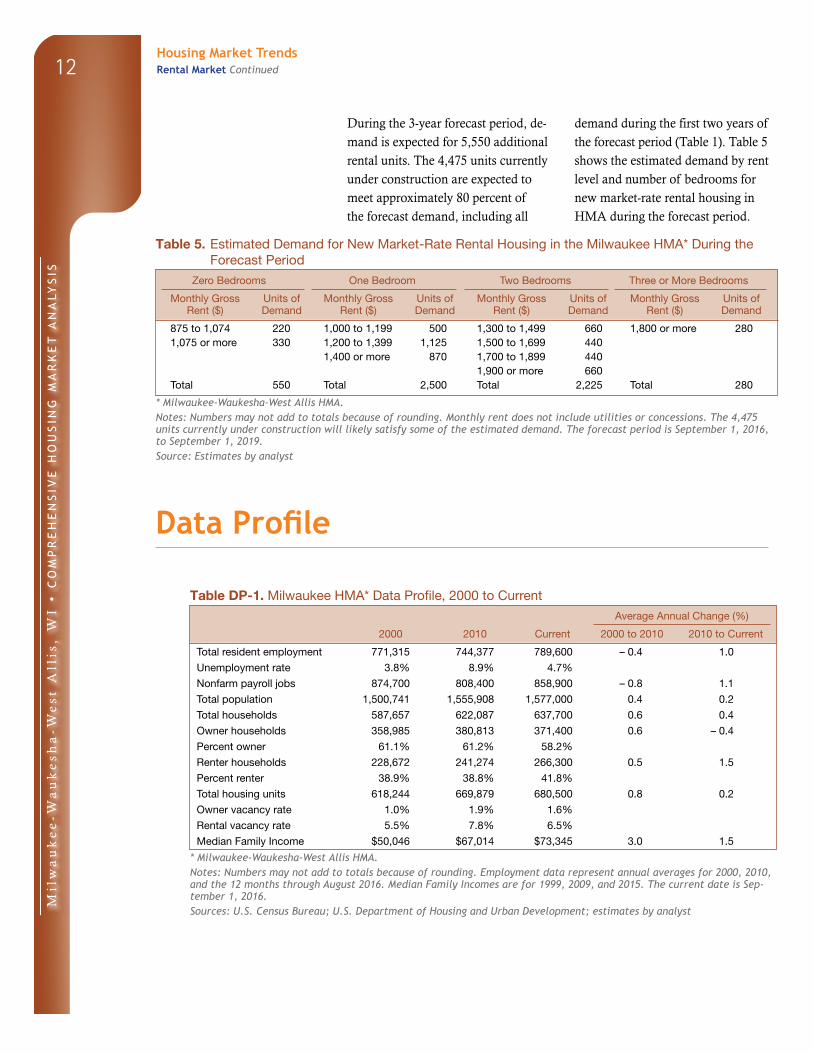
Table DP-1. Milwaukee HMA* Data Profile, 2000 to Current
Average Annual Change (%)
2000 2010 Current 2000 to 2010 2010 to Current
Total resident employment 771,315 744,377 789,600 – 0.4 1.0
Unemployment rate 3.8% 8.9% 4.7%
Nonfarm payroll jobs 874,700 808,400 858,900 – 0.8 1.1
Total population 1,500,741 1,555,908 1,577,000 0.4 0.2
Total households 587,657 622,087 637,700 0.6 0.4
Owner households 358,985 380,813 371,400 0.6 – 0.4
Percent owner 61.1% 61.2% 58.2%
Renter households 228,672 241,274 266,300 0.5 1.5
Percent renter 38.9% 38.8% 41.8%
Total housing units 618,244 669,879 680,500 0.8 0.2
Owner vacancy rate 1.0% 1.9% 1.6%
Rental vacancy rate 5.5% 7.8% 6.5%
Median Family Income $50,046 $67,014 $73,345 3.0 1.5
* Milwaukee-Waukesha-West Allis HMA.Notes: Numbers may not add to totals because of rounding. Employment data represent annual averages for 2000, 2010, and the 12 months through August 2016. Median Family Incomes are for 1999, 2009, and 2015. The current date is Sep-tember 1, 2016.Sources: U.S. Census Bureau; U.S. Department of Housing and Urban Development; estimates by analyst
Housing Market TrendsRental Market Continued
Mil
wa
uk
ee
-Wa
uk
es
ha
-We
st
All
is,
WI
• C
OM
PR
EH
EN
SIV
E H
OU
SIN
G M
AR
KE
T A
NA
LYS
IS
13
Data Definitions and Sources
2000: 4/1/2000—U.S. Decennial Census
2010: 4/1/2010—U.S. Decennial Census
Current date: 9/1/2016—Analyst’s estimates
Forecast period: 9/1/2016–9/1/2019—Analyst’s
estimates
The metropolitan statistical area definition in this
report is based on the delineations established by
the Office of Management and Budget (OMB) in
the OMB Bulletin dated February 28, 2013.
Demand: The demand estimates in the analysis
are not a forecast of building activity. They are
the estimates of the total housing production
needed to achieve a balanced market at the end
of the 3-year forecast period given conditions on
the as-of date of the analysis, growth, losses, and
excess vacancies. The estimates do not account
for units currently under construction or units in
the development pipeline.
Other Vacant Units: In the U.S. Department of
Housing and Urban Development’s (HUD’s)
analysis, other vacant units include all vacant
units that are not available for sale or for rent.
The term therefore includes units rented or sold
but not occupied; held for seasonal, recreational,
or occasional use; used by migrant workers; and
the category specified as “other” vacant by the
Census Bureau.
Building Permits: Building permits do not neces-
sarily reflect all residential building activity that
occurs in an HMA. Some units are constructed
or created without a building permit or are issued
a different type of building permit. For example,
some units classified as commercial structures are
not reflected in the residential building permits.
As a result, the analyst, through diligent fieldwork, makes
an estimate of this additional construction activity. Some
of these estimates are included in the discussions of
single-family and multifamily building permits.
For additional data pertaining to the housing market
for this HMA, go to huduser.gov/publications/pdf/
CMARtables_Milwaukee_Waukesha_WestAllisWI_17.
pdf.
Contact Information
Marissa Dolin, Economist
Chicago HUD Regional Office
312–913–8893
This analysis has been prepared for the assistance and
guidance of HUD in its operations. The factual informa-
tion, findings, and conclusions may also be useful to
builders, mortgagees, and others concerned with local
housing market conditions and trends. The analysis
does not purport to make determinations regarding the
acceptability of any mortgage insurance proposals that
may be under consideration by the Department.
The factual framework for this analysis follows the
guidelines and methods developed by HUD’s Economic
and Market Analysis Division. The analysis and find-
ings are as thorough and current as possible based on
information available on the as-of date from local and
national sources. As such, findings or conclusions may be
modified by subsequent developments. HUD expresses its
appreciation to those industry sources and state and local
government officials who provided data and information
on local economic and housing market conditions.
For additional reports on other market areas, please go to huduser.gov/portal/ushmc/chma_archive.html.