computational chemistry workshops west ridge research...
TRANSCRIPT
Computational Chemistry WorkshopsWest Ridge Research Building-UAF Campus
9:00am-4:00pm, Room 009Electronic Structure - July 19-21, 2016Molecular Dynamics - July 26-28, 2016
UV-Visible Spectra of Aquavanadium Complexes
1
Ligand Field Theory
Ligand Field Theory (Reference 5) has been a central theme of inorganic chemistry for manyyears. Interpretation of d → d transitions in transition metal complexes is discussed inadvanced inorganic chemistry textbooks, with the emphasis frequently placed on extractionof values for the ligand field splitting, ∆0 and the Racah B parameter, the electron repulsionenergy between electronic states, from experimental spectra (References 1 and 2). Thecolors of transition metal complexes result from absorption of a small portion of the visiblespectrum with transmission of the unabsorbed frequencies.
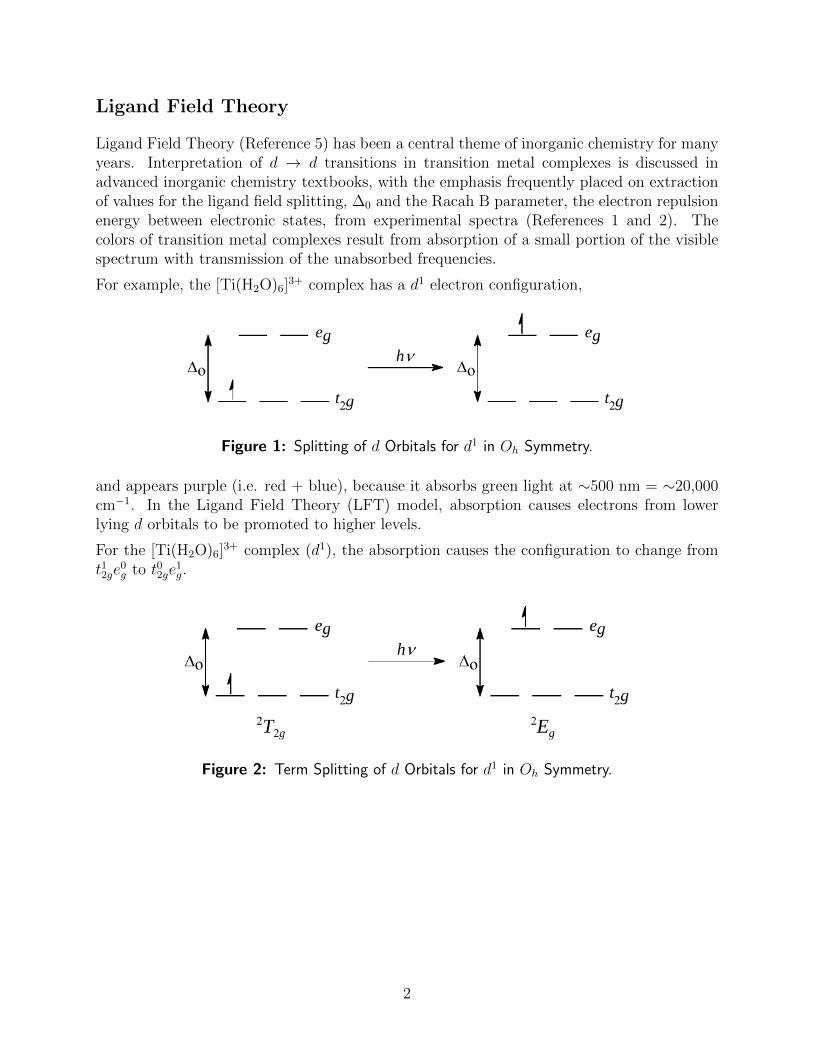
For example, the [Ti(H2O)6]3+ complex has a d1 electron configuration,
Figure 1: Splitting of d Orbitals for d1 in Oh Symmetry.
and appears purple (i.e. red + blue), because it absorbs green light at ∼500 nm = ∼20,000cm−1. In the Ligand Field Theory (LFT) model, absorption causes electrons from lowerlying d orbitals to be promoted to higher levels.
For the [Ti(H2O)6]3+ complex (d1), the absorption causes the configuration to change from
t12ge0g to t02ge
1g.
Figure 2: Term Splitting of d Orbitals for d1 in Oh Symmetry.
2
Vanadium Oxidation States
Vanadium displays variable oxidation states of varying colours including the blue oxovana-dium(IV) ion, usually written more simply as VO2+ but will have water molecules attachedto it as well - [VO(H2O)5]
2+, the green hexaaquavanadium(III) ion - [V(H2O)6]3+, and the
purple-violet hexaaquavanadium(II) ion - [V(H2O)6]2+.
Excited-State Calculations and Electron Density Shifts
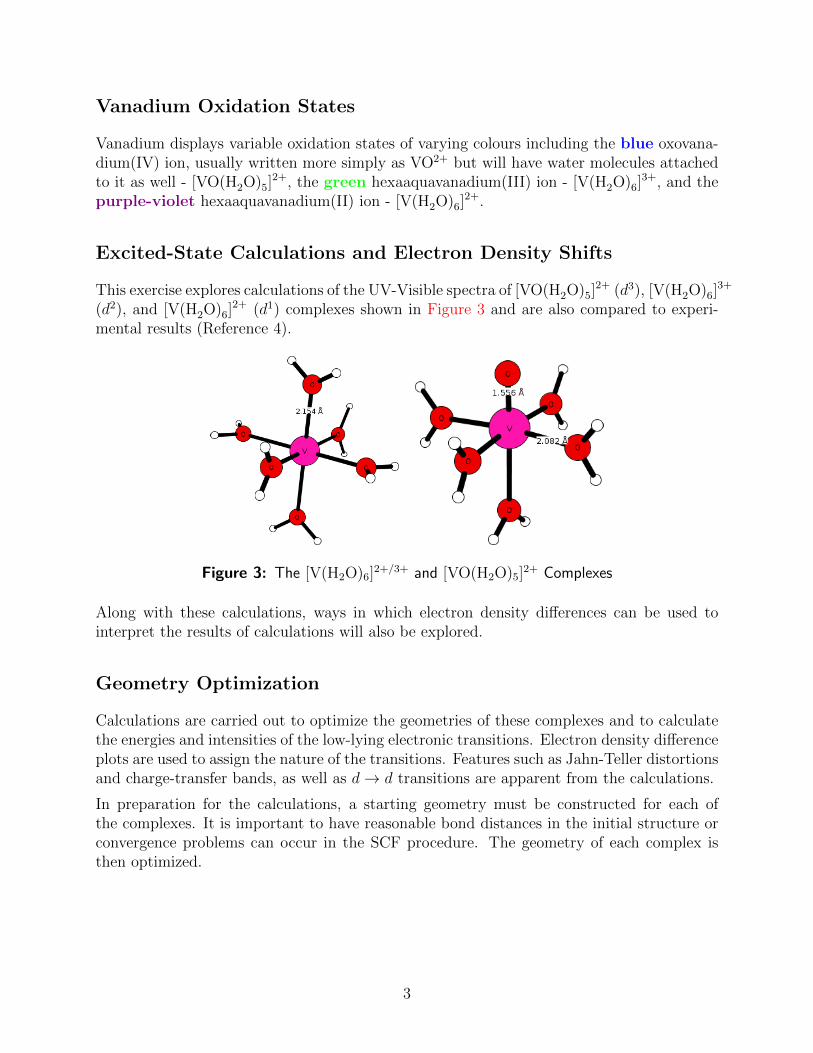
This exercise explores calculations of the UV-Visible spectra of [VO(H2O)5]2+ (d3), [V(H2O)6]
3+
(d2), and [V(H2O)6]2+ (d1) complexes shown in Figure 3 and are also compared to experi-
mental results (Reference 4).
Figure 3: The [V(H2O)6]2+/3+ and [VO(H2O)5]
2+ Complexes
Along with these calculations, ways in which electron density differences can be used tointerpret the results of calculations will also be explored.
Geometry Optimization
Calculations are carried out to optimize the geometries of these complexes and to calculatethe energies and intensities of the low-lying electronic transitions. Electron density differenceplots are used to assign the nature of the transitions. Features such as Jahn-Teller distortionsand charge-transfer bands, as well as d→ d transitions are apparent from the calculations.
In preparation for the calculations, a starting geometry must be constructed for each ofthe complexes. It is important to have reasonable bond distances in the initial structure orconvergence problems can occur in the SCF procedure. The geometry of each complex isthen optimized.
3
Calculations of Excited States
Following the calculation of optimized structures, time-dependent perturbation theory (TDDFT)is used to calculate the energies and intensities of the first 20 excited states of each complexat the optimized geometry of the ground state.
In addition, charges on each atom are computed for the ground state and each excited state.
Calculations of Electron Density
Finally, cube files of the electron density are calculated for the ground state and excitedstates. A cube file of the electron density difference between each excited state and theground state is then computed. Visualization of the electron density differences is carriedout with GaussView.
Results
[V(H2O)6]3+ - d2 Configuration
Jahn-Teller Distortions
Because of the presence of two electrons in the t2g orbitals of this pseudo-octahedral complex,the calculated VO6 local geometry is expected to show a Jahn-Teller distortion. All thecalculated V-O bond distances may not be equal. As expected, the bond distances in theV(III) system are somewhat shorter than for the corresponding V(II) complex. Thus, thecalculated charge on the metal is slightly more positive than for [V(H2O)6]
2+
Although constraints can be applied, such that the V-O bond distances are all equal, theJahn-Teller effect is still reflected in the calculated electronic spectrum.
Excited States
The Tanabe-Sugano splitting diagram for the d2 configuration, shown in Figure 4, indicatesthat a d2 octahedral complex should exhibit three d → d excitations: 3T1g(F)→3 T2g,3T1g(F)→3 T1g(P), and 3T1g(F)→3 A2g.
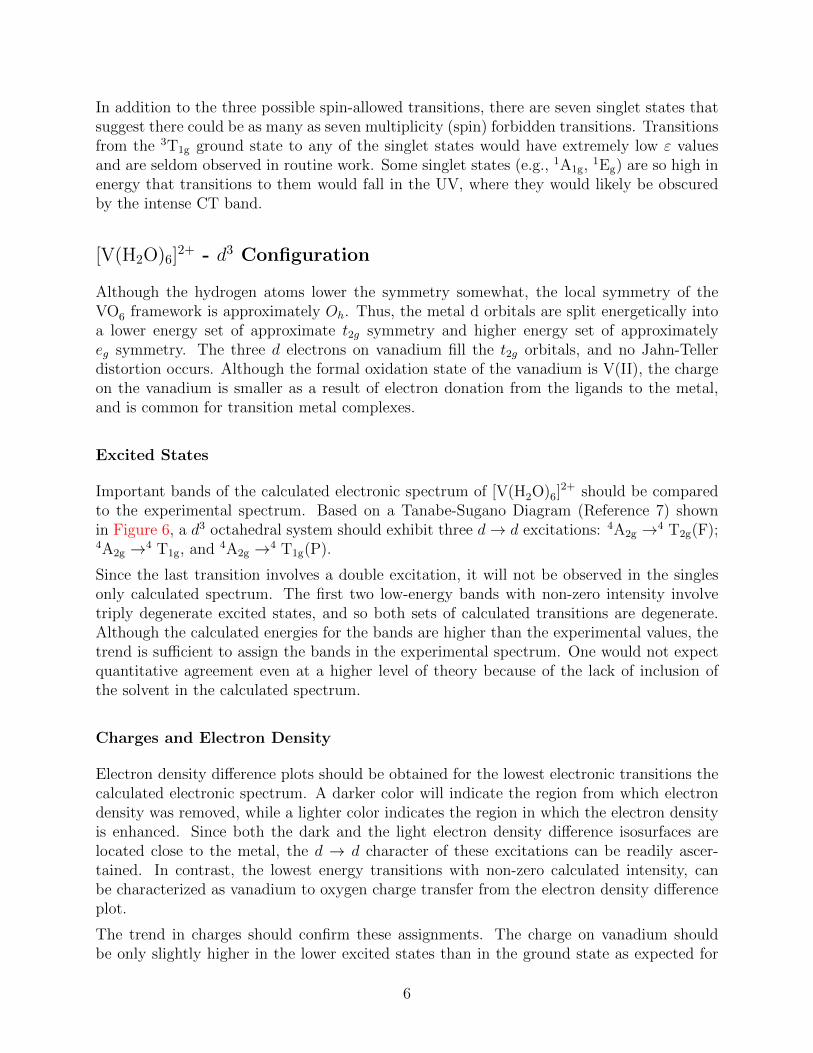
The visible/ultraviolet spectrum for [V(H2O)6]3+ is shown in Figure 5
The 3T1g(F)→3 A2g transition, which simultaneously promotes two electrons, is unlikely,and its band is often weak or unobserved. ν1 (3T1g(F)→3 T2g) at 17,200 cm1 and ν2(3T1g(F)→3 T1g(P)) at 25,000 cm1 are shown, but the ν3 (3T1g(F)→3 A2g) at 38,000 cm1
falls in the UV, and is not shown. Calculated lower-energy transitions most likely occurunder the experimental band envelope at about 17,000 cm−1, while an allowed ligand molec-ular orbital (localized on O atoms of H2O) → Vanadium charge transfer (CT) transition iscalculated at approximately 35,000 cm−1.
4
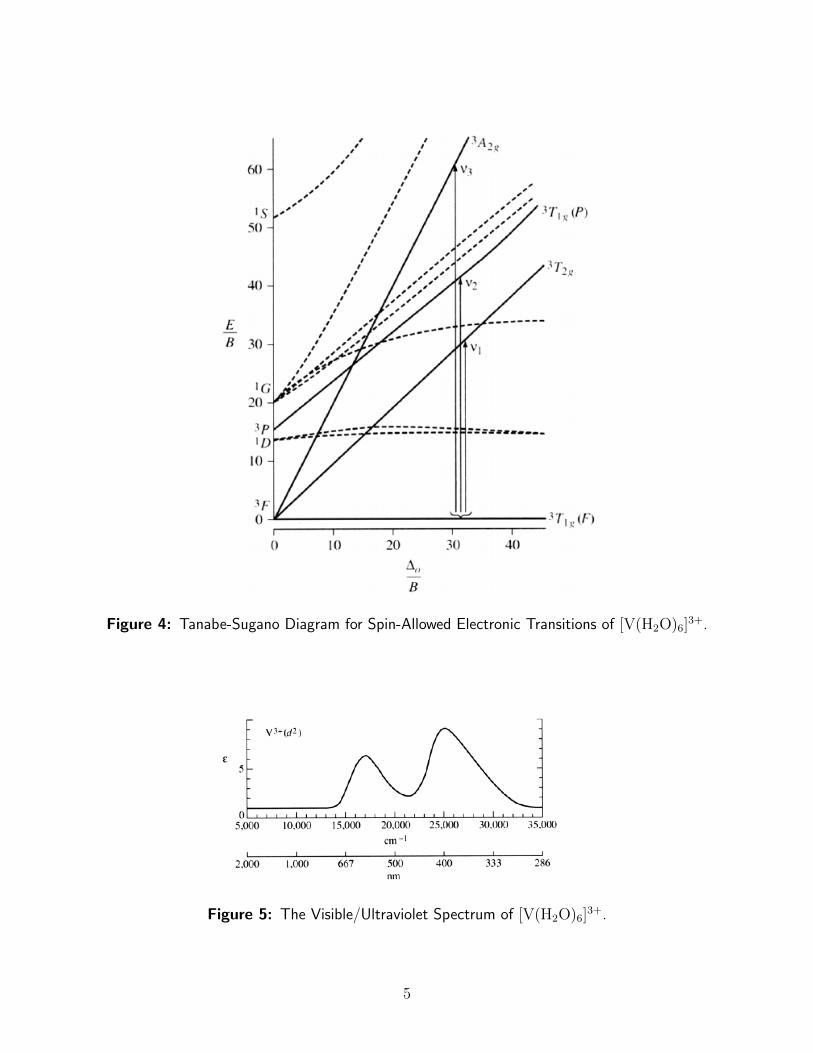
Figure 4: Tanabe-Sugano Diagram for Spin-Allowed Electronic Transitions of [V(H2O)6]3+.
Figure 5: The Visible/Ultraviolet Spectrum of [V(H2O)6]3+.
5
In addition to the three possible spin-allowed transitions, there are seven singlet states thatsuggest there could be as many as seven multiplicity (spin) forbidden transitions. Transitionsfrom the 3T1g ground state to any of the singlet states would have extremely low ε valuesand are seldom observed in routine work. Some singlet states (e.g., 1A1g,
1Eg) are so high inenergy that transitions to them would fall in the UV, where they would likely be obscuredby the intense CT band.
[V(H2O)6]2+ - d3 Configuration
Although the hydrogen atoms lower the symmetry somewhat, the local symmetry of theVO6 framework is approximately Oh. Thus, the metal d orbitals are split energetically intoa lower energy set of approximate t2g symmetry and higher energy set of approximatelyeg symmetry. The three d electrons on vanadium fill the t2g orbitals, and no Jahn-Tellerdistortion occurs. Although the formal oxidation state of the vanadium is V(II), the chargeon the vanadium is smaller as a result of electron donation from the ligands to the metal,and is common for transition metal complexes.
Excited States
Important bands of the calculated electronic spectrum of [V(H2O)6]2+ should be compared
to the experimental spectrum. Based on a Tanabe-Sugano Diagram (Reference 7) shownin Figure 6, a d3 octahedral system should exhibit three d→ d excitations: 4A2g →4 T2g(F);4A2g →4 T1g, and 4A2g →4 T1g(P).
Since the last transition involves a double excitation, it will not be observed in the singlesonly calculated spectrum. The first two low-energy bands with non-zero intensity involvetriply degenerate excited states, and so both sets of calculated transitions are degenerate.Although the calculated energies for the bands are higher than the experimental values, thetrend is sufficient to assign the bands in the experimental spectrum. One would not expectquantitative agreement even at a higher level of theory because of the lack of inclusion ofthe solvent in the calculated spectrum.
Charges and Electron Density
Electron density difference plots should be obtained for the lowest electronic transitions thecalculated electronic spectrum. A darker color will indicate the region from which electrondensity was removed, while a lighter color indicates the region in which the electron densityis enhanced. Since both the dark and the light electron density difference isosurfaces arelocated close to the metal, the d → d character of these excitations can be readily ascer-tained. In contrast, the lowest energy transitions with non-zero calculated intensity, canbe characterized as vanadium to oxygen charge transfer from the electron density differenceplot.
The trend in charges should confirm these assignments. The charge on vanadium shouldbe only slightly higher in the lower excited states than in the ground state as expected for
6
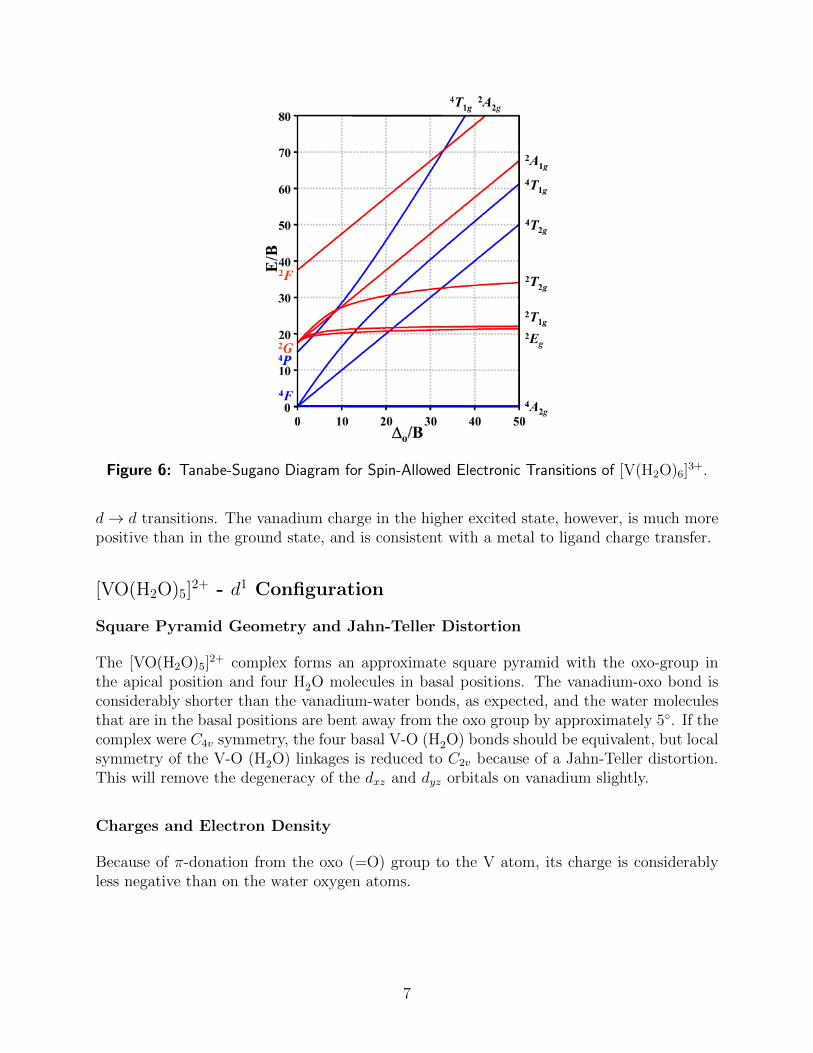
Figure 6: Tanabe-Sugano Diagram for Spin-Allowed Electronic Transitions of [V(H2O)6]3+.
d→ d transitions. The vanadium charge in the higher excited state, however, is much morepositive than in the ground state, and is consistent with a metal to ligand charge transfer.
[VO(H2O)5]2+ - d1 Configuration
Square Pyramid Geometry and Jahn-Teller Distortion
The [VO(H2O)5]2+ complex forms an approximate square pyramid with the oxo-group in
the apical position and four H2O molecules in basal positions. The vanadium-oxo bond isconsiderably shorter than the vanadium-water bonds, as expected, and the water moleculesthat are in the basal positions are bent away from the oxo group by approximately 5◦. If thecomplex were C4v symmetry, the four basal V-O (H2O) bonds should be equivalent, but localsymmetry of the V-O (H2O) linkages is reduced to C2v because of a Jahn-Teller distortion.This will remove the degeneracy of the dxz and dyz orbitals on vanadium slightly.
Charges and Electron Density
Because of π-donation from the oxo (=O) group to the V atom, its charge is considerablyless negative than on the water oxygen atoms.
7
Excited States
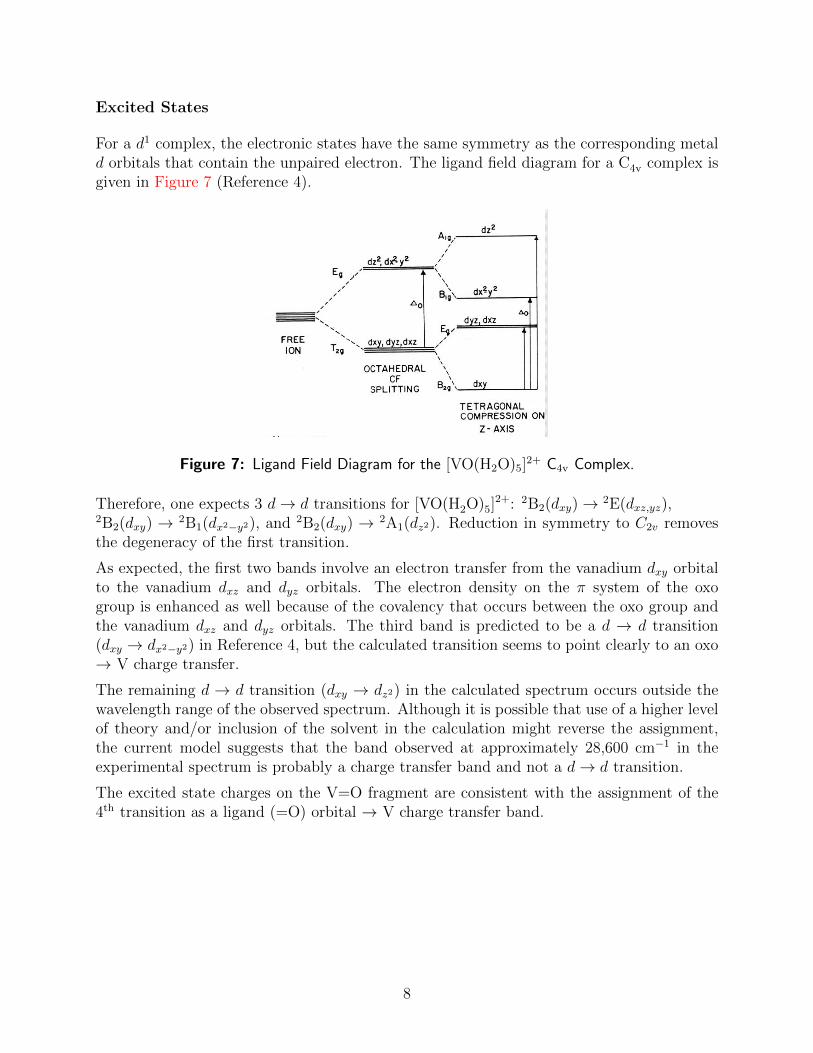
For a d1 complex, the electronic states have the same symmetry as the corresponding metald orbitals that contain the unpaired electron. The ligand field diagram for a C4v complex isgiven in Figure 7 (Reference 4).
Figure 7: Ligand Field Diagram for the [VO(H2O)5]2+ C4v Complex.
Therefore, one expects 3 d→ d transitions for [VO(H2O)5]2+: 2B2(dxy)→ 2E(dxz,yz),
2B2(dxy) → 2B1(dx2−y2), and 2B2(dxy) → 2A1(dz2). Reduction in symmetry to C2v removesthe degeneracy of the first transition.
As expected, the first two bands involve an electron transfer from the vanadium dxy orbitalto the vanadium dxz and dyz orbitals. The electron density on the π system of the oxogroup is enhanced as well because of the covalency that occurs between the oxo group andthe vanadium dxz and dyz orbitals. The third band is predicted to be a d → d transition(dxy → dx2−y2) in Reference 4, but the calculated transition seems to point clearly to an oxo→ V charge transfer.
The remaining d → d transition (dxy → dz2) in the calculated spectrum occurs outside thewavelength range of the observed spectrum. Although it is possible that use of a higher levelof theory and/or inclusion of the solvent in the calculation might reverse the assignment,the current model suggests that the band observed at approximately 28,600 cm−1 in theexperimental spectrum is probably a charge transfer band and not a d→ d transition.
The excited state charges on the V=O fragment are consistent with the assignment of the4th transition as a ligand (=O) orbital → V charge transfer band.
8
References
1. Miessler, Gary L.; Tarr, Donald A. Inorganic Chemistry, 2nd Ed.,Upper Saddle River,NJ: Prentice Hall, 1998, pp. 366-378.
2. Wulfsberg, Gary. Inorganic Chemistry, Sausalito: University Science Books, 2000,889-898.
3. Stefan Portmann and Hans Peter Luthi. Chimia, 2000, 54,766.
4. Ophardt, C. E.; Stupgia, S. J. Chem. Ed., 1984, 61, 1102.
5. Figgis, B. N.; Hitchman, M. A. Ligand Field Theory and Its Applications: New York,Wiley-VCH, 2000, pp. 204-207.
6. Lever, A. B. P. Inorganic Electronic Spectroscopy: New York, Elsevier, 1968, pp. 256-274.
7. Tanabe, Y.; Sugano, S., Journal of the Physical Society of Japan, 1954, 9 (5): 753-766;and 1954, 9 (5): 766-779; and 1956, 11 (8): 864-877.
9
Exercises
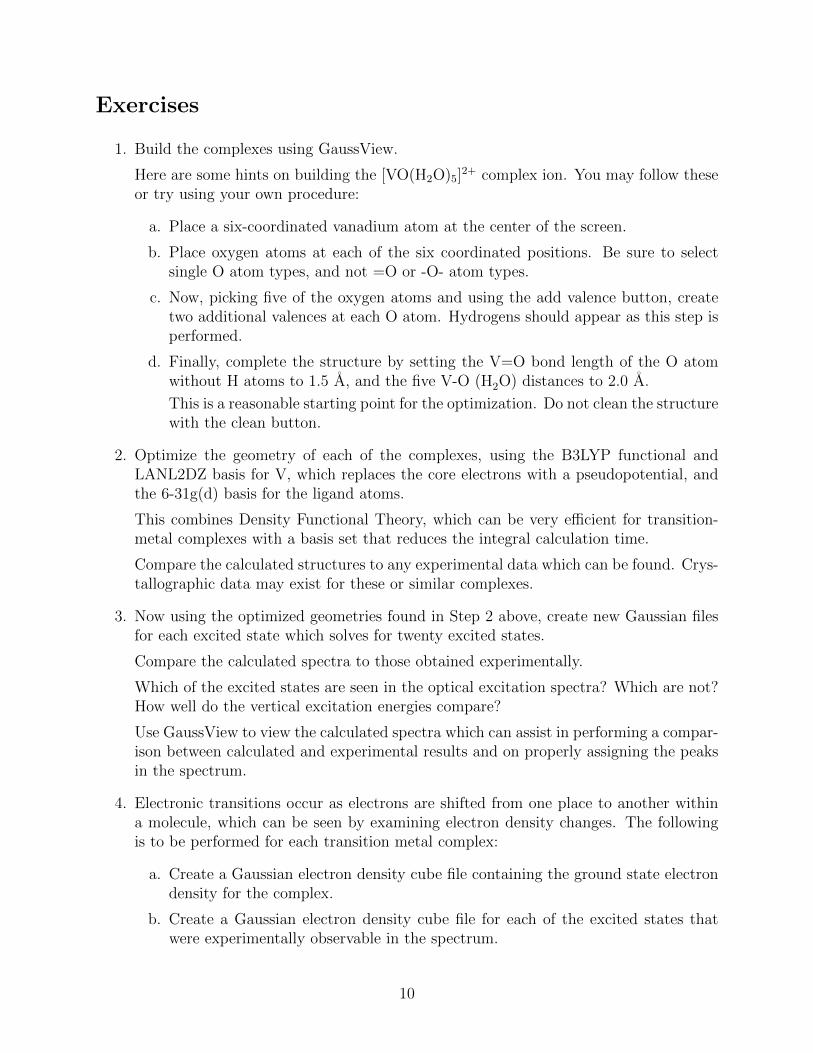
1. Build the complexes using GaussView.
Here are some hints on building the [VO(H2O)5]2+ complex ion. You may follow these
or try using your own procedure:
a. Place a six-coordinated vanadium atom at the center of the screen.
b. Place oxygen atoms at each of the six coordinated positions. Be sure to selectsingle O atom types, and not =O or -O- atom types.
c. Now, picking five of the oxygen atoms and using the add valence button, createtwo additional valences at each O atom. Hydrogens should appear as this step isperformed.
d. Finally, complete the structure by setting the V=O bond length of the O atomwithout H atoms to 1.5 A, and the five V-O (H2O) distances to 2.0 A.
This is a reasonable starting point for the optimization. Do not clean the structurewith the clean button.
2. Optimize the geometry of each of the complexes, using the B3LYP functional andLANL2DZ basis for V, which replaces the core electrons with a pseudopotential, andthe 6-31g(d) basis for the ligand atoms.
This combines Density Functional Theory, which can be very efficient for transition-metal complexes with a basis set that reduces the integral calculation time.
Compare the calculated structures to any experimental data which can be found. Crys-tallographic data may exist for these or similar complexes.
3. Now using the optimized geometries found in Step 2 above, create new Gaussian filesfor each excited state which solves for twenty excited states.
Compare the calculated spectra to those obtained experimentally.
Which of the excited states are seen in the optical excitation spectra? Which are not?How well do the vertical excitation energies compare?
Use GaussView to view the calculated spectra which can assist in performing a compar-ison between calculated and experimental results and on properly assigning the peaksin the spectrum.
4. Electronic transitions occur as electrons are shifted from one place to another withina molecule, which can be seen by examining electron density changes. The followingis to be performed for each transition metal complex:
a. Create a Gaussian electron density cube file containing the ground state electrondensity for the complex.
b. Create a Gaussian electron density cube file for each of the excited states thatwere experimentally observable in the spectrum.
10
c. Create a Gaussian electron density difference cube file for each of the excitedstates that were experimentally observable in the spectrum.
5. Now, visualize the difference densities (ground to excited state) to discover the nature ofthe transitions by reading the electron-density difference cube file into GaussView.
Which color corresponds to areas where electrons are leaving? Which color correspondsto areas where electrons are going?
To answer this, recall the dipole moment changes. How would you describe the tran-sitions qualitatively?
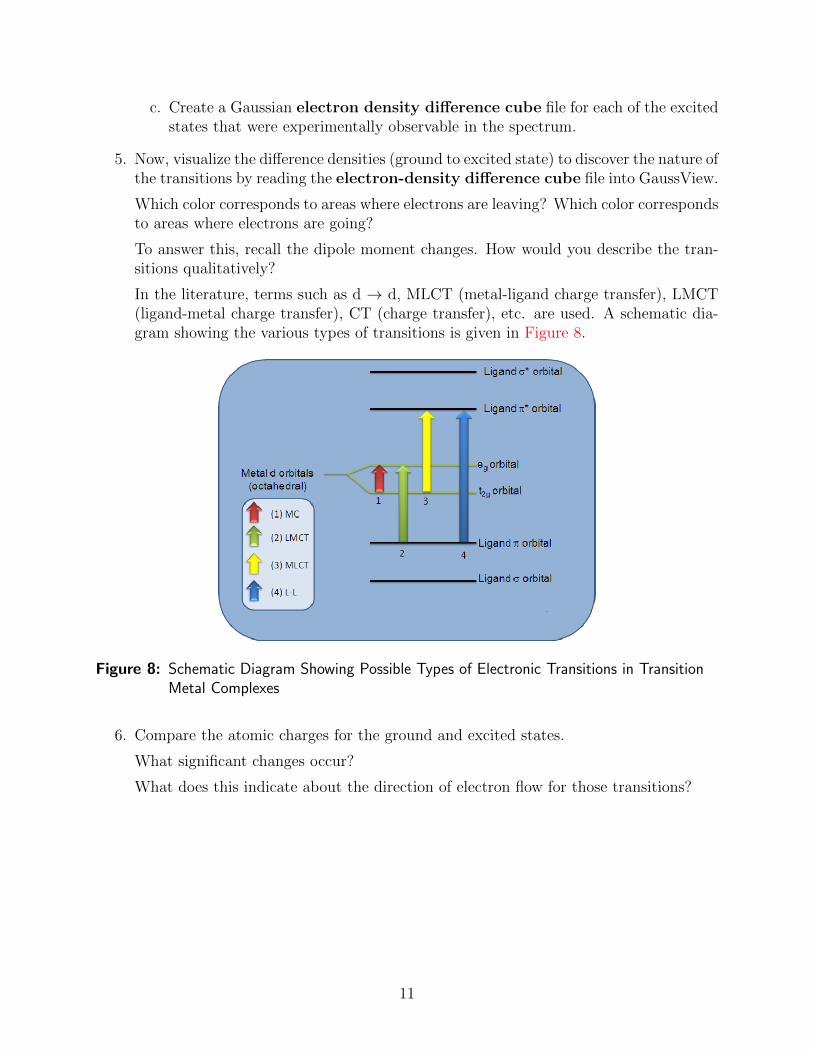
In the literature, terms such as d → d, MLCT (metal-ligand charge transfer), LMCT(ligand-metal charge transfer), CT (charge transfer), etc. are used. A schematic dia-gram showing the various types of transitions is given in Figure 8.
Figure 8: Schematic Diagram Showing Possible Types of Electronic Transitions in TransitionMetal Complexes
6. Compare the atomic charges for the ground and excited states.
What significant changes occur?
What does this indicate about the direction of electron flow for those transitions?
11

Appendix
Generating Cube Files
• The first step is to create a formatted checkpoint file from an unformatted checkpointfile, resulting from a Gaussian calculation. A formatted checkpoint file will be neededfor the ground state and each excited state.
Use the Gaussian formchk utility:
formchk ground.chk (This will create a formatted checkpoint file, ground.fck, for theground state.)
formchk excited1.chk (This will create a formatted checkpoint file, excited1.fck, forthe first excited state.)
• Next, use the cubegen utility to extract cube files from the formatted checkpoint filesof interest:
cubegen 0 density=SCF ground.fck ground.cube 0 h (For the ground state)
cubegen 0 density=CI excited1.fck excited1.cube 0 h (First excited state, the sameas specified as root=N in the TD section of the Gaussian input file)
Creating Difference Density Cube Files with Gaussian Utilities
Use the Gaussian cubman utility:
• cubman
• Enter su for subtract at the initial prompt
This operation subtracts two cube files to produce a new cube file.
• For the first input file type the name of the excited state cube file (example: ex-cited1.cube)
Is the file formatted? Answer y for yes.
• For the second input file type the name of the ground state cube file (example:ground.cube)
Is the file formatted? Answer y for yes.
For the output file type in the name desired for the difference density output file(example: excited-ground.cube)
Should it be formatted? Answer y for yes.
• Follow the above procedure for each of the excited-state difference densities to bevisualized in GaussView.
12

Visualizing Difference Densities in GaussView
GaussView can be used to read an electron density cube file, and create an isosurface ren-dering of the result.
• Select File → Open, and select the formatted checkpoint file for the excited statethat you want to visualize the difference density for in GaussView. Select OK.
• Select Results → Surfaces, and a Surfaces and Cubes window will appear.
• Select the Cube Actions drop down menu. Select Load Cube.
Find the cube file that represents the difference density calculated with cubman.Select OK.
A line of data will appear in the Cubes Available box.
Select an appropriate isosurface value, such as 0.004.
Adjust the isosurface value until you obtain a visualization of the difference densitiesthat is acceptable.
This will generate a graphical window with the molecule and difference density for theselected excited state.
The blue represents where the electrons are coming from, and the purple representswhere the electrons are going.
• If the visualization is not ideal: Select the Surface Actions drop down menu; SelectRemove Surface; Change the isosurface value.
Select the Surface Actions drop down menu; Select New Surface.
Repeat these steps until the visualization for the difference density is acceptable.
13
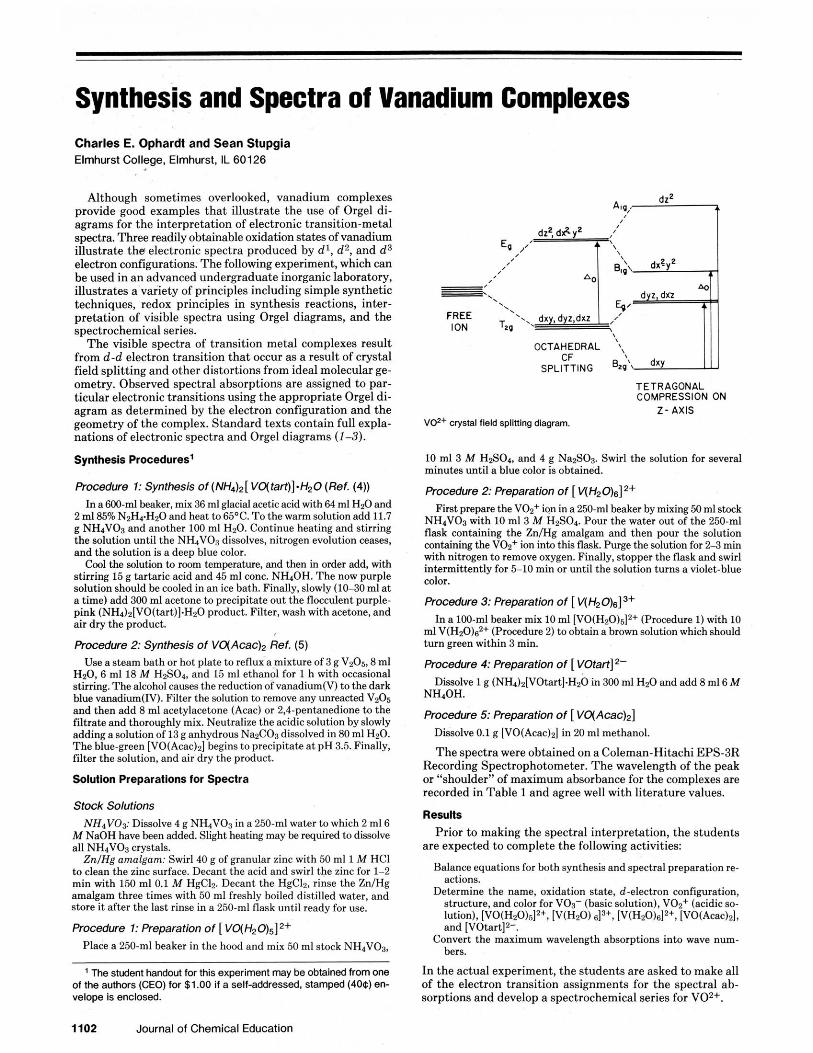
Synthesis and Spectra of Vanadium Complexes Char les E. Ophardt a n d Sean Stupgia Elmhurst College, Elmhurst. IL 60126
Although sometimes overlooked, vanadium complexes provide good examples tha t illustrate the use of Orgel di- agrams for the interpretation of electronic transition-metal spectra. Three readily obtainable oxidation states of vanadium illustrate t h e electronic spectra produced by d l , d2, and d3 electron confimrations. The followine ex~eriment. which can ~ ~~~ ~ ~~ " . be used in an advanced undergraduate inorganic lahoratory, illustrates a ve i e tv of ~r iuc in les includine s i m ~ l e svnthetic . . - . - techniques, redox principles in synthesis reactions, inter- pretation of visible spectra using Orgel diagrams, and the spectrochemical series.
The visihle soectra of transition metal complexes result from d - d electron transition that occur as a result of crystal field solittine and other distortions from ideal molecular ae- ornet&. 0bserved spectral absorptions are assigned to p b - ticular electronic transitions using the appropriate Orgel di- agram as determined by the electron configuration and the eeometw of the complex. Standard texts contain full expla- nations of electronicspectra and Orgel diagrams ( 1 3 )
Synthesis Procedures1
Procedure 1: Synthesis of (NH&[VO(tar?)]-H20 (Ref. (4))
In a 600-ml beaker, mix 36 ml glacial acetic acid with 64 ml Hz0 and 2 ml85% N2HrH20 and heat to 65T. To the warm solution add 11.7 g NHdVOB and another 100 ml Hz0. Continue heating and stirring the solution until the NHlVO8 dissolves, nitrogen evolution ceases, and the solution is a deep blue color.
Cool the solution to room temperature, and then in order add, with stirring 15 g tartaric acid and 45 ml cone. NH4OH. The now purple solution should he cooled in an ice bath. Finally, slowly (10-30ml at a time) add 300 ml acetone to precipitate out the flocculent purple- pink (NH,)a[VO(tart)].HnO product. Filter, wash with acetone, and air dry the product.
Procedure 2: Synthesis of VaAcac), Ref. (5) Use a steam bath or hot plate to reflux a mixture of 3 g V205, 8 ml
HzO, 6 ml 18 M HZSO~, and 15 ml ethanol for 1 h with occasional stirring. The alcohol causes the reduction of vanadium(V) to the dark blue vanadium(1V). Filter the solution to remove any weacted V205 and then add 8 ml acetylacetane (Acac) or 2,4-pentanedione to the filtrate and thoroughly mix. Neutralize the acidic solution by slowly addingasolution of 13 ganbydrous NazCO~dissolved in 80 ml H20. The blue-green [VO(Aeac)n] begins to precipitate at pH 3.5. Finally, filter the solution, and air dry the product.
Solution Preparations for Spectra
Stock Solutions
NH.VO>: Dissolve 4 e NHAVOX in a 250-ml water to which 2 m16 M N ~ O H have been add&. slight heating may be required to dissolve all NHIVOB crystals.
ZnfHg amalgam: Swirl 40 g of granular zinc with 50 ml1 M HCI to clean the zinc surface. Decant the acid and swirl the zinc for 1-2 min with 150 mlO.l M HgCI2. Decant the HgCL, rinse the Zn/Hg amaleam three times with 50 ml freshly boiled distilled water. and store;t after the last rinse in a 250-ml flask until ready for use:
Procedure 1: Preparation of [ VO(H20)5]2+
Place a 250-ml beaker in the hood and mix 50 ml stock NH4V03,
' The student handout for this experiment may be obtained from one of the authors (CEO) for $1.00 if a self-addressed, stamped (40Q) en- velope is enclosed.
1102 Journal of Chemical Education
OCTAHEDRAL ' dxy 1 1 I CF SPLITTING BW'
TETRAGONAL COMPRESSION ON
2- AXIS V02+ Ctystal field splitting diagram.
10 ml 3 M HzSOd, and 4 g NanSOs. Swirl the solution for several minutes until a blue color is obtained.
Procedure 2: Preparation of [ V(H20)6]2+
First prepare the VOz+ ion in a 250-ml beaker by mixing 50ml stoek NHIVOI with 10 m13 M HnSOa. Pour the water out of the 250-ml . - - . flask containing [he ZniHg amalgam and then pour the aolurion amtaining the VOzl ion intu this flak. Purge the wlution for 2-3 rnin with nitrogen toremove oxygen. Finally, stopper the flask and swirl intermittently far &I0 min or until the solution turns a violet-blue
Procedure 3: Preparation of [V(H20)$+
In a 100-ml beaker mix 10 ml [VO(H20)5]Z+ (Procedure 1) with 10 ml V(H20)62+ (Procedure 2) to obtain a brown solution which should turn green within 3 min.
Procedure 4: Preparation of [ VOtar?l2-
Dissolve 1 g (NHr)n[VOtart].HzO in 300 ml HzO and add 8 m16 M NHIOH.
Procedure 5: Preparation of [ v O ( A ~ a c ) ~ ]
Dissolve 0.1 g [VO(Aeae)n] in 20 ml methanol.
The spectra were obtained on a Coleman-Hitachi EPS-3R Recording Spectrophotometer. The wavelength of the peak or "shoulder" of maximum absorbance for the complexes are recorded in Table 1 and agree well with literature values.
Results
Prior to making the spectral interpretation, the students are expected t o complete the following activities:
Balance equations for both synthesis and spectral preparation re- actions.
Determine the name, oxidation state, d-electron configuration, structure, and color for VOs- (basic solution), VOzf (acidic so- lution), [VO(HSO)~I~+, [V(HsO) s13+, [V(H20)6I2+, [VO(Acac)z], and [VOtartIz-.
Convert the maximum wavelength absorptions into wave num- bers.
In the actual experiment, the students are asked to make all of the electron transition assignments for the spectral ab- sorptions and develop a spectrochemical series for V02+.
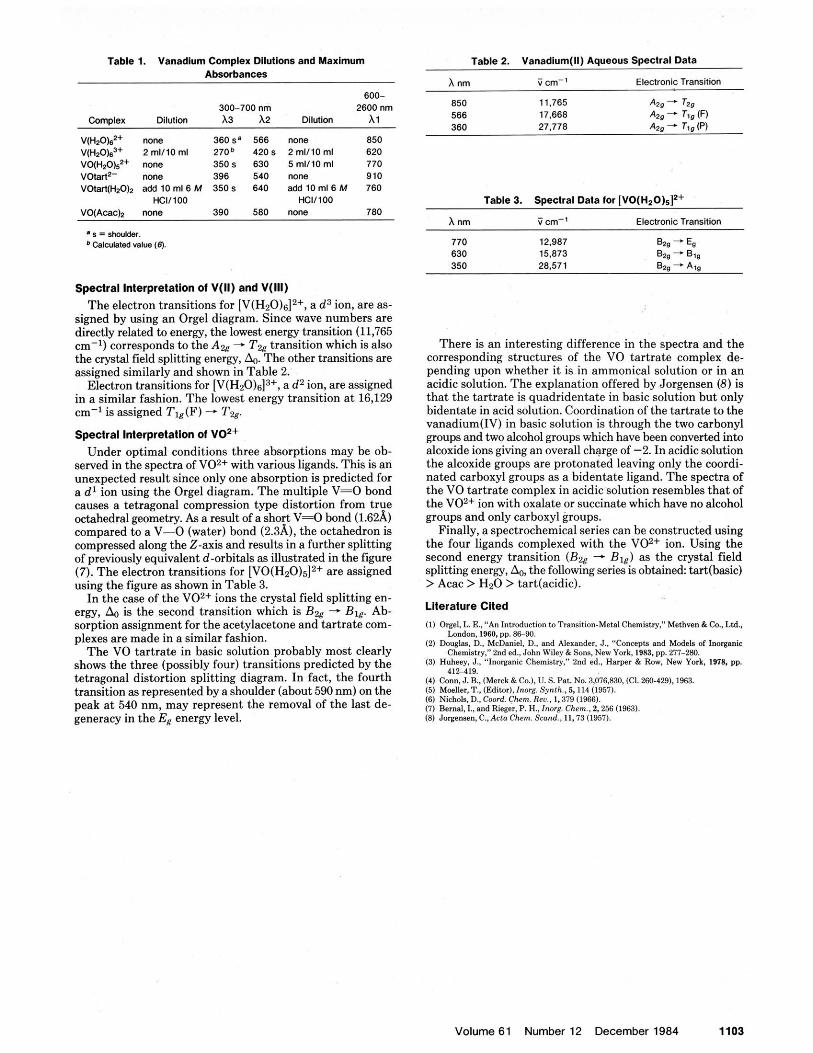
Table 1. Vanadium Complex Dilutions and Maximum Absorbances
600- 300-700 nm 2600 nm
Complex Dilution A3 A2 Dilutlon A1
V(H20k2+ none 3605. 566 none 850 v (~ ,o ) ,~+ 2 m1/10 ml 270b 420 s 2 m1/10 ml 620 v q ~ . o ) . ~ + none 350s 630 5 m ~ 1 0 ml 770 VOtartz- none 396 540 none 910 VOtart(H~0)~ am 10 ml6 M 350 s 640 add 10 m16 M 760
HC11100 HCi/lOO VqAcac)~ nme 390 580 none 780
- 8 = YaUldet. a Calwiated value I@.
Spectral Interpretation of V(II) and V(III) The electron transitions for [V(H20)6I2+, a d3 ion, are as-
signed hy using an Orgel diagram. Since wave numbers are directly related to energy, the lowest energy transition (11,765 cm-1) corresponds to the A% - T% transition which is also the crystal field splitting energy, &.The other transitions are assigned similarly and shown in Table 2.
Electron transitions for [V(H20)6]3+, a d2 ion, are assigned in a similar fashion. The lowest energy transition a t 16,129 cm-1 is assigned Tlg(F) - Tw
Spectral lnterprelatlon of V02+ Under optimal conditions three absorptions may be ob-
served in the spectra of V02+ with various ligands. This is an unexpected result since only one absorption is predicted for a d l ion using the Orgel diagram. The multiple V=O hond causes a tetragonal compression type distortion from true odahedral geometry. As a result of a short V=O bond (1.62A) cornoared to a V-0 (water) bond (2.321). the octahedron is compressed dong the Z-axis and results in a further spl~tting of orcviouslv eauivalent d-orbitals as illustrated in the figure (7j. The ele&on transitions for [VO(HzO)#+ are assigned using the figure as shown in Table 3.
In the case of the V02+ ions the crystal field splitting en- ergy, A0 is the second transition which is B% - Big Ab- sorption assignment for the acetylacetone and tartrate com- plexes are made in a similar fashion.
The VO tartrate in hasic solution probably most clearly shows the three (possibly four) transitions predicted by the tetragonal distortion splitting diagram. In fact, the fourth transition as represented by a shoulder (about 590 nm) on the peak at 540 nm, may represent the removal of the last de- generacy in the E, energy level.
Table 2. Vanadlum(l1) Aqueous Spectral Data
A nm V cm-' Elechonic Transition
850 11.765 420 + b 566 17.668 Apg - Tw IF1 360 27.778 Azg - Tf9 (PI
Table 3. Spectral Data for [VO(H.O)#+
h nm V cm-' Electronic Transition
770 12.987 Br. - E.. ~~~ -- - 630 15.873 B., + Big 350 28.571 62, - A?,
There is an interesting difference in the spectra and the corresponding structures of the VO tartrate complex de- en dine uoon whether it is in ammonical solution or in an aridir s"luiion. The explanation offered by Jorgensen (8) is thut the tartrate is quadridentate in hasic soluuon hut only hidcntnte in acid solution. C(mrdination of the tartrate to the vanadiumtlv) in basic solution is through the two carhonyl groups and two alcohol groups whirh have been convened into alcoxidc ions givinn un overilll charge of -2. In acidic solution . . the alcoxide groups are protonated leaving only the coordi- nated carboxyl groups as a bidentate ligand. The spectra of the VO tartrate complex in acidicsolution resembles that of the V02+ ion with oxalate or succinate which have no alcohol groups and only carboxyl groups.
Finally, a spectrochemical series canbe constructed using the four ligands complexed with the V02+ ion. Using the second energy transition (Bzg - Big) as the crystal field splitting energy, Ao. the following series is obtained: tart(basic) > Acac > H20 > tart(acidic).
Literature Cned (1) Oreal. L. E.. "An lntrodvctian to Transition-Metal Chcmiatrv." Msthven & Ca..Ltd..
412419. (4) Corn, J. B..(Merck&Co.l.U.S. Pat. No. 3,076,830, (Ci.260-429).1963. (51 Maeller, T., (Editor).Inorg. Synlh, 5,114 (1957). (6) Nichols,D.,Coord. Cham.Rau., l,379(19661. (7) Bomal, I., and Riegcr, P. H., Inorg. Chem., 2,256 (19631. (8) Jargeneen. C..Aclo Chem Scond., 11.73 (19571.
Volume 61 Number 12 December 1984 1103