computational phenotyping of potential plant growth ... · impact on human health diverse bacteria...
TRANSCRIPT
Computational phenotyping of potential plant growth promoters (Klebsiella) isolates
from INCAUCA fields
Luz Karime Medina Cordoba02/08/18
1
Outline
2
1. Introduction
Biologist vs Bioinformatics 2. General idea about microbes and the need of computational tools
3. What is Computational phenotyping?
Historical context of computational phenotyping
4. Computational phenotyping methods
Gene panels
Blast
Microbial Identification and Characterization (MICRA)
Traitar, the Microbial Trait Analyzer
Machine learning5. Example of computational phenotyping (My project)
6. Computational Phenotyping methodology that I use for my project
7. Conclusion

Biologist
1. ExperimentsPlanning and carrying out experiments (Lab work)
3. Scientific articles“Relevant” results are published in
scientific journals
2. ResultsProcessing and interpretation
of obtained results
3
Bioinformatics
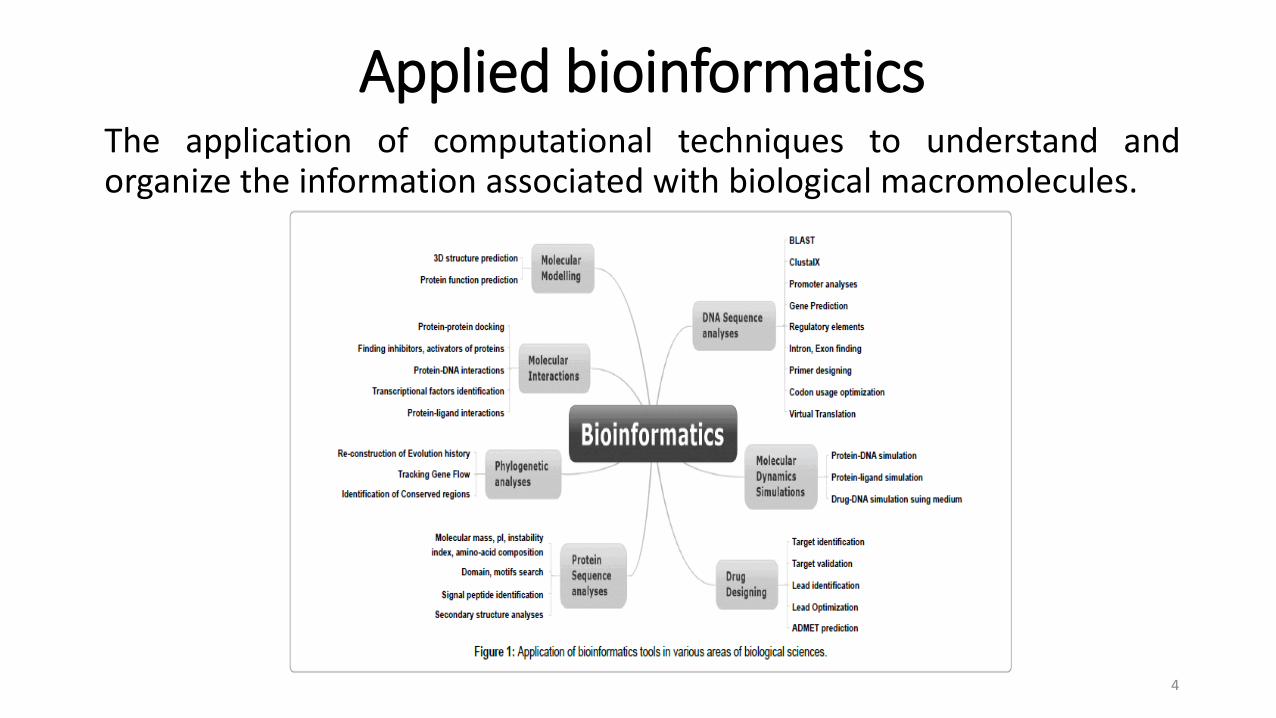
Applied bioinformaticsThe application of computational techniques to understand andorganize the information associated with biological macromolecules.
4
Microbes and the need of computational tools
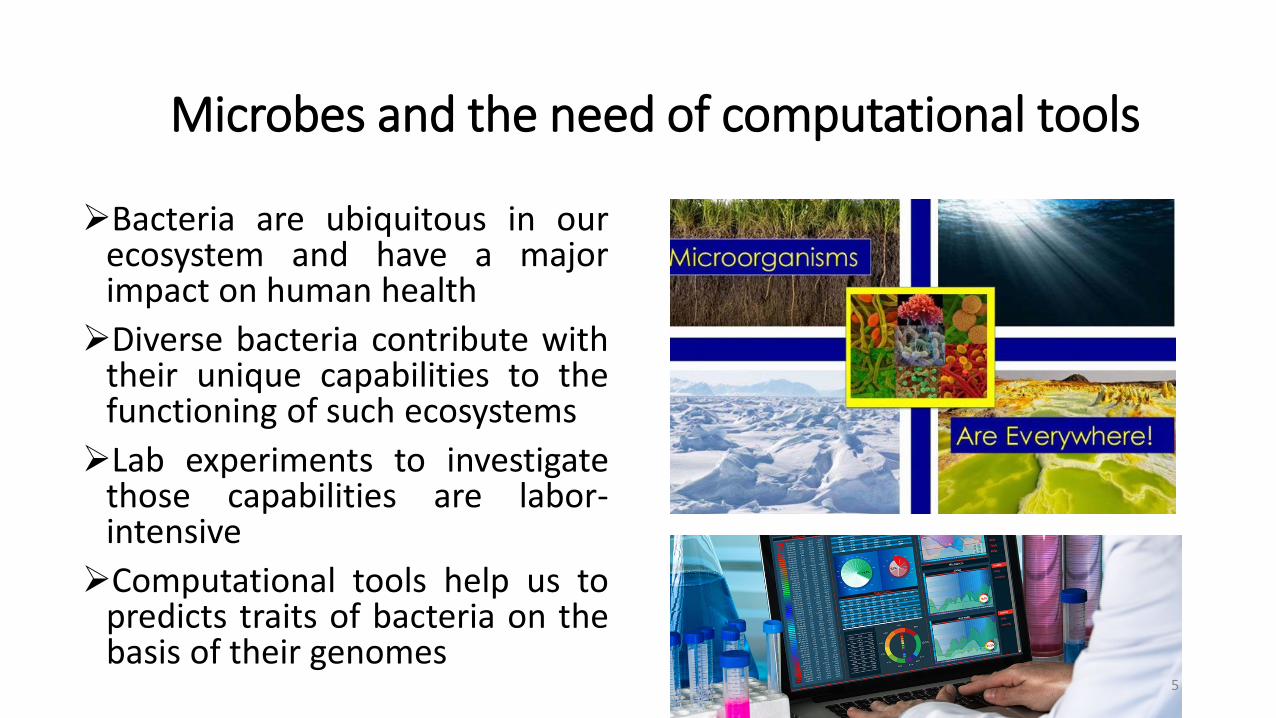
Bacteria are ubiquitous in ourecosystem and have a majorimpact on human healthDiverse bacteria contribute with
their unique capabilities to thefunctioning of such ecosystemsLab experiments to investigate
those capabilities are labor-intensiveComputational tools help us to
predicts traits of bacteria on thebasis of their genomes
5
What is Computational phenotyping?
Computational phenotyping is the use of software toolsto describe the phenotypes of organisms using thegenome sequencingGood example of computational phenotyping is
developing a software model to predicts minimuminhibitory concentrations for Klebsiella pneumonieantibiotics
6
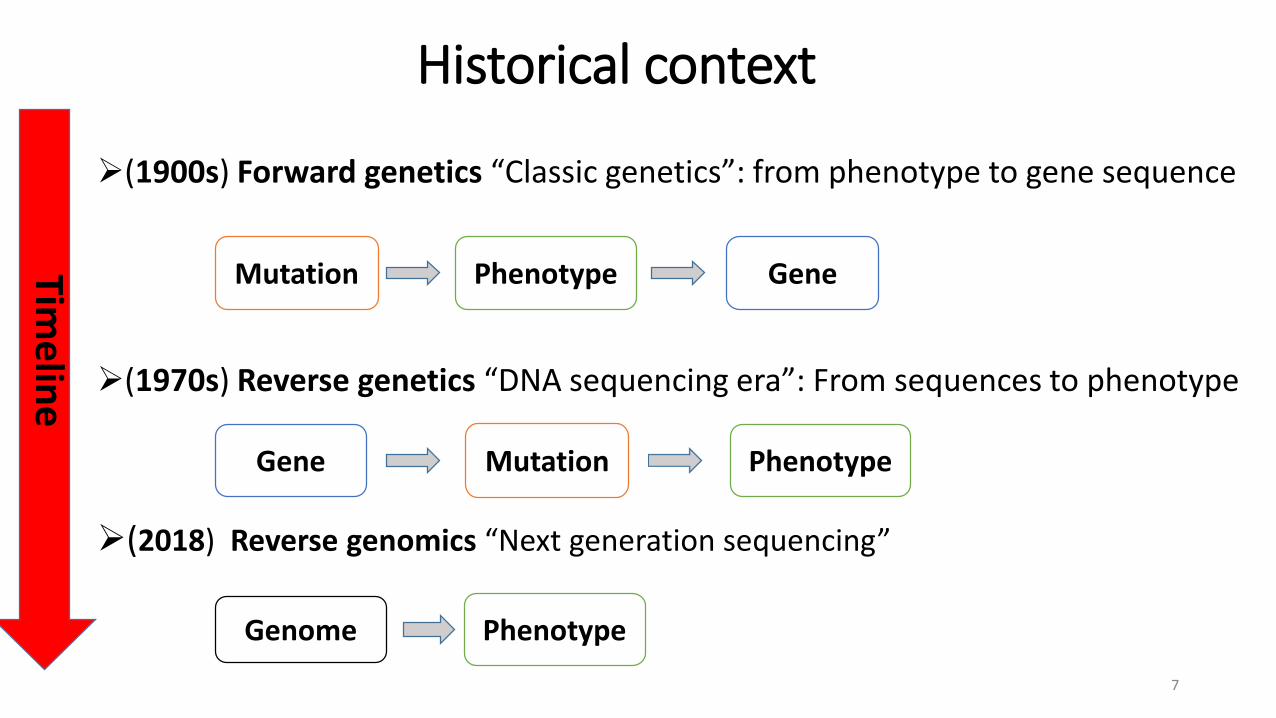
Historical context
(1900s) Forward genetics “Classic genetics”: from phenotype to gene sequence
(1970s) Reverse genetics “DNA sequencing era”: From sequences to phenotype
(2018) Reverse genomics “Next generation sequencing”
Timeline
7
Mutation Phenotype Gene
Gene Mutation Phenotype
Genome Phenotype
Computational phenotyping methods
Gene panels Blast Microbial Identification and Characterization (MICRA) Traitar, the Microbial Trait AnalyzerMachine learning
8

Gene panels Contain a select set of genes or gene regions that
have known or suspected associations with the phenotype under studyAdvantages i. Facilitates the analysis of a group of genes of
interest allowing identification of rare variantsii. Great approach when the database is not
available iii. Easy to interpret results Disadvantagesi. Requires literature survey, which is time
consuming ii. Some gene panels are not publically available
9
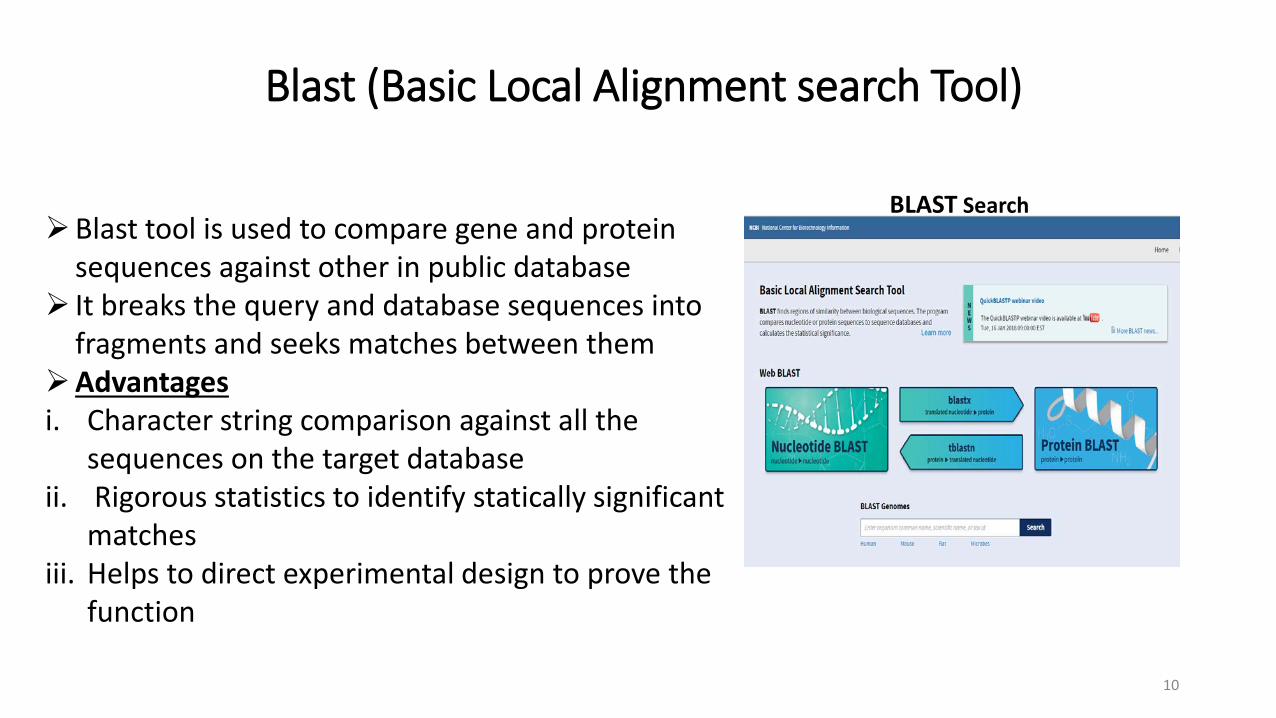
Blast (Basic Local Alignment search Tool)
Blast tool is used to compare gene and protein sequences against other in public database
It breaks the query and database sequences into fragments and seeks matches between them
Advantages i. Character string comparison against all the
sequences on the target databaseii. Rigorous statistics to identify statically significant
matchesiii. Helps to direct experimental design to prove the
function
BLAST Search
10
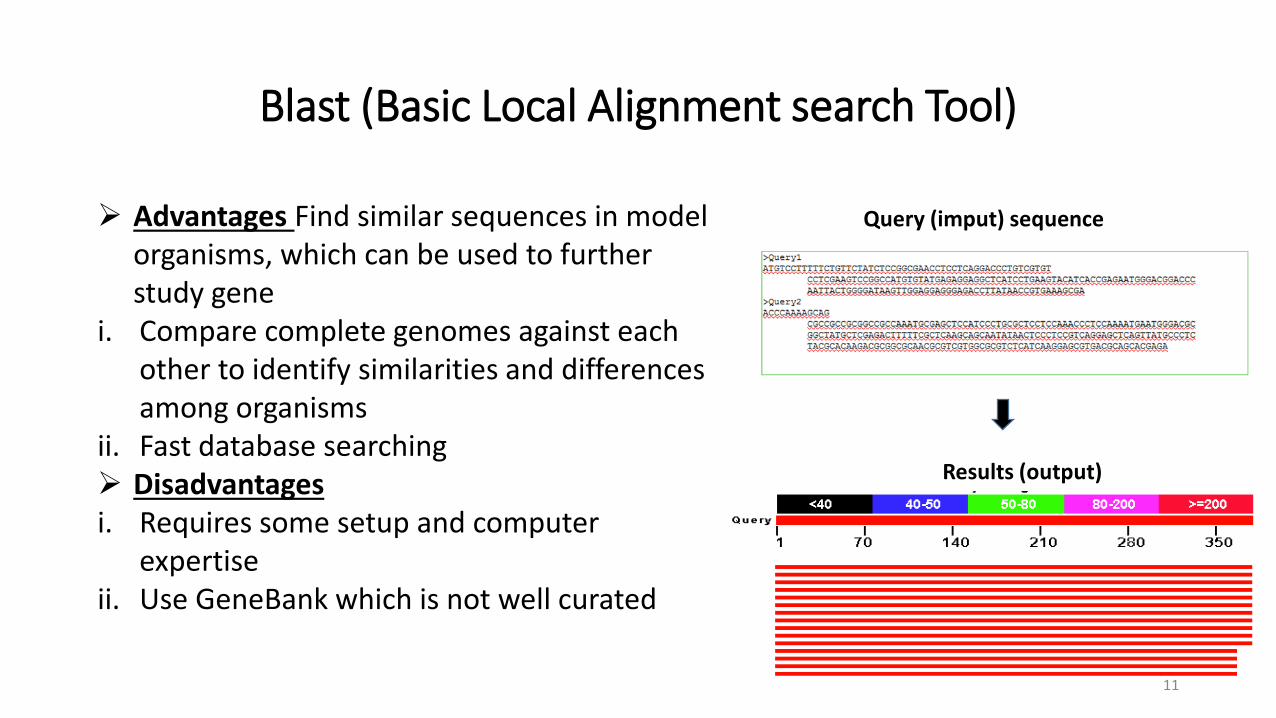
Blast (Basic Local Alignment search Tool)
Advantages Find similar sequences in model organisms, which can be used to further study gene
i. Compare complete genomes against each other to identify similarities and differences among organisms
ii. Fast database searching Disadvantagesi. Requires some setup and computer
expertise ii. Use GeneBank which is not well curated
Query (imput) sequence
Results (output)
11
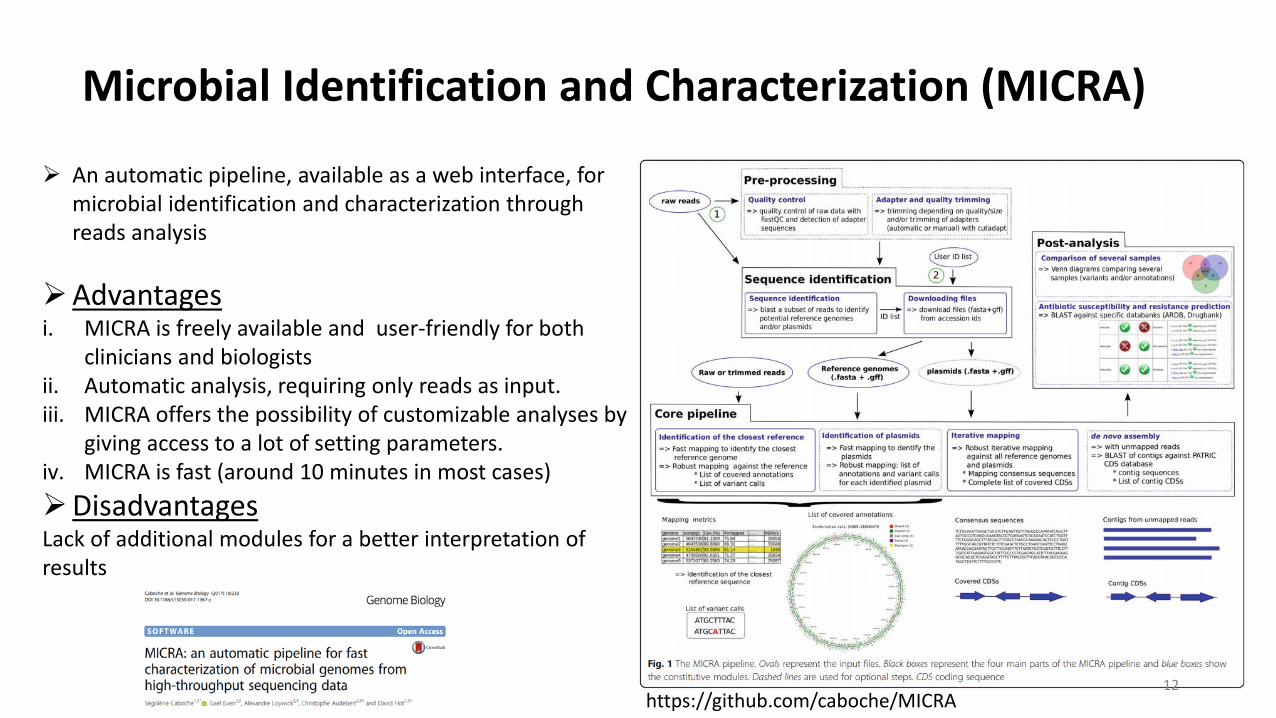
Microbial Identification and Characterization (MICRA)
An automatic pipeline, available as a web interface, for microbial identification and characterization through reads analysis
Advantagesi. MICRA is freely available and user-friendly for both
clinicians and biologistsii. Automatic analysis, requiring only reads as input.iii. MICRA offers the possibility of customizable analyses by
giving access to a lot of setting parameters.iv. MICRA is fast (around 10 minutes in most cases)DisadvantagesLack of additional modules for a better interpretation of results
12https://github.com/caboche/MICRA
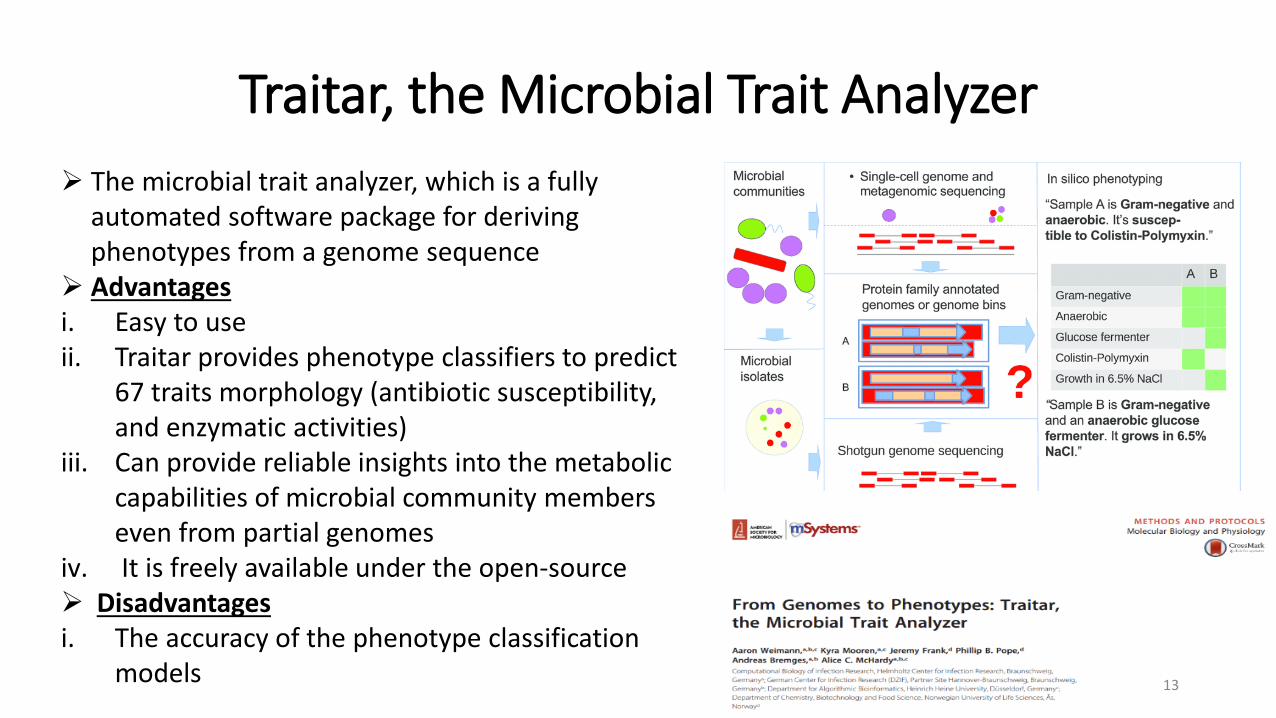
Traitar, the Microbial Trait Analyzer The microbial trait analyzer, which is a fully
automated software package for deriving phenotypes from a genome sequence
Advantages i. Easy to use ii. Traitar provides phenotype classifiers to predict
67 traits morphology (antibiotic susceptibility, and enzymatic activities)
iii. Can provide reliable insights into the metabolic capabilities of microbial community members even from partial genomes
iv. It is freely available under the open-source Disadvantages i. The accuracy of the phenotype classification
models 13
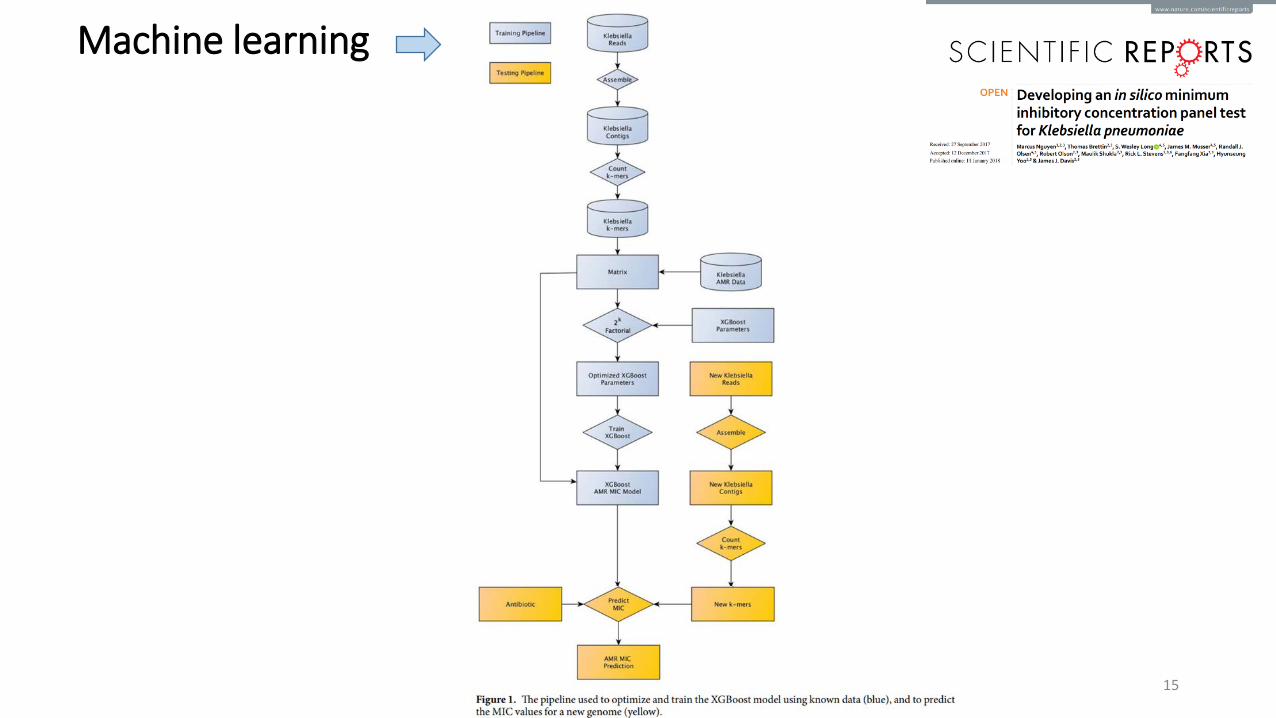
Machine learning
Involves developing and deploying algorithms to provide a computer, a software program, or a process with the ability to learn without being explicitly programmed.
Advantages i. Supplementing data miningii. Continuous improvementsiii. Automation of tasksDisadvantages i. Error diagnosis and correctionii. Problems with verificationiii. Limitations of predictions
14
15
Machine learning
Example of Computational phenotyping
“Genomic characterization and prioritization of nitrogen-fixing bacteria biofertilizers isolated from Colombian
sugarcane fields”
16
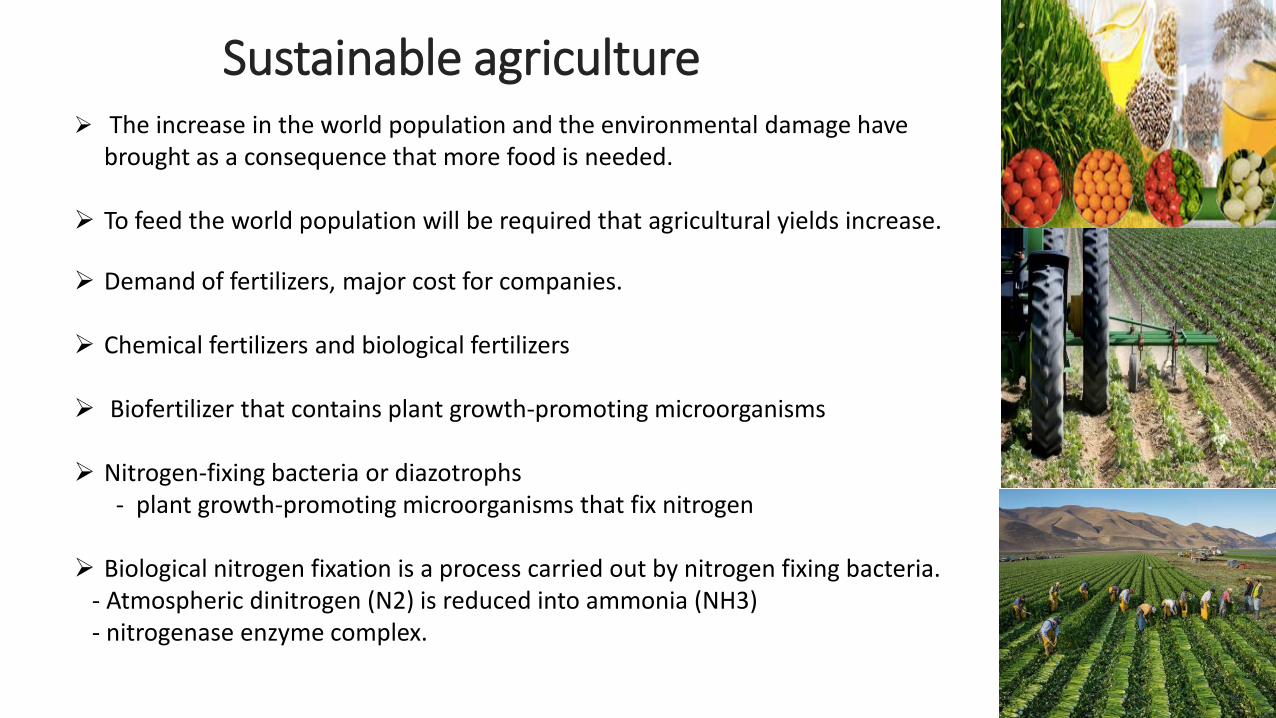
Sustainable agriculture The increase in the world population and the environmental damage have
brought as a consequence that more food is needed.
To feed the world population will be required that agricultural yields increase.
Demand of fertilizers, major cost for companies.
Chemical fertilizers and biological fertilizers
Biofertilizer that contains plant growth-promoting microorganisms
Nitrogen-fixing bacteria or diazotrophs- plant growth-promoting microorganisms that fix nitrogen
Biological nitrogen fixation is a process carried out by nitrogen fixing bacteria.- Atmospheric dinitrogen (N2) is reduced into ammonia (NH3)- nitrogenase enzyme complex.
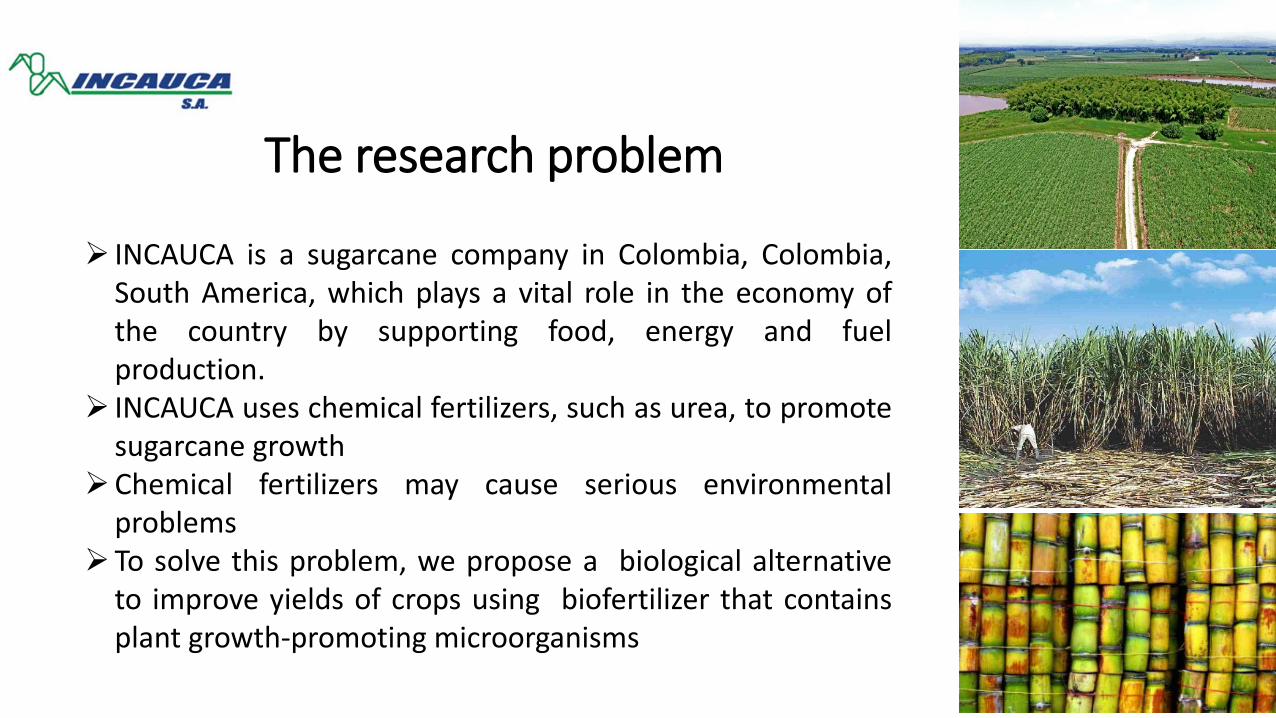
The research problem
INCAUCA is a sugarcane company in Colombia, Colombia,South America, which plays a vital role in the economy ofthe country by supporting food, energy and fuelproduction.
INCAUCA uses chemical fertilizers, such as urea, to promotesugarcane growth
Chemical fertilizers may cause serious environmentalproblems
To solve this problem, we propose a biological alternativeto improve yields of crops using biofertilizer that containsplant growth-promoting microorganisms
18
Overall significance and goals of the study
Previous studies have shown that sugarcane from INCAUCA fields harbors diverseplant growth promoting microorganisms (nitrogen-fixing bacteria), which havethe potential to serve as biofertilizers.
The success of biofertilizers depends on the capacity of the microorganism toadapt to the environmental conditions of the place where it is applied
Endemic bacteria (natives of INCAUCA fields)
Characterizing endemic nitrogen-fixing bacteria from INCAUCA field, we will beable to know their potential as a biological fertilizer that promotes sugarcanegrowth in term of biomass
19
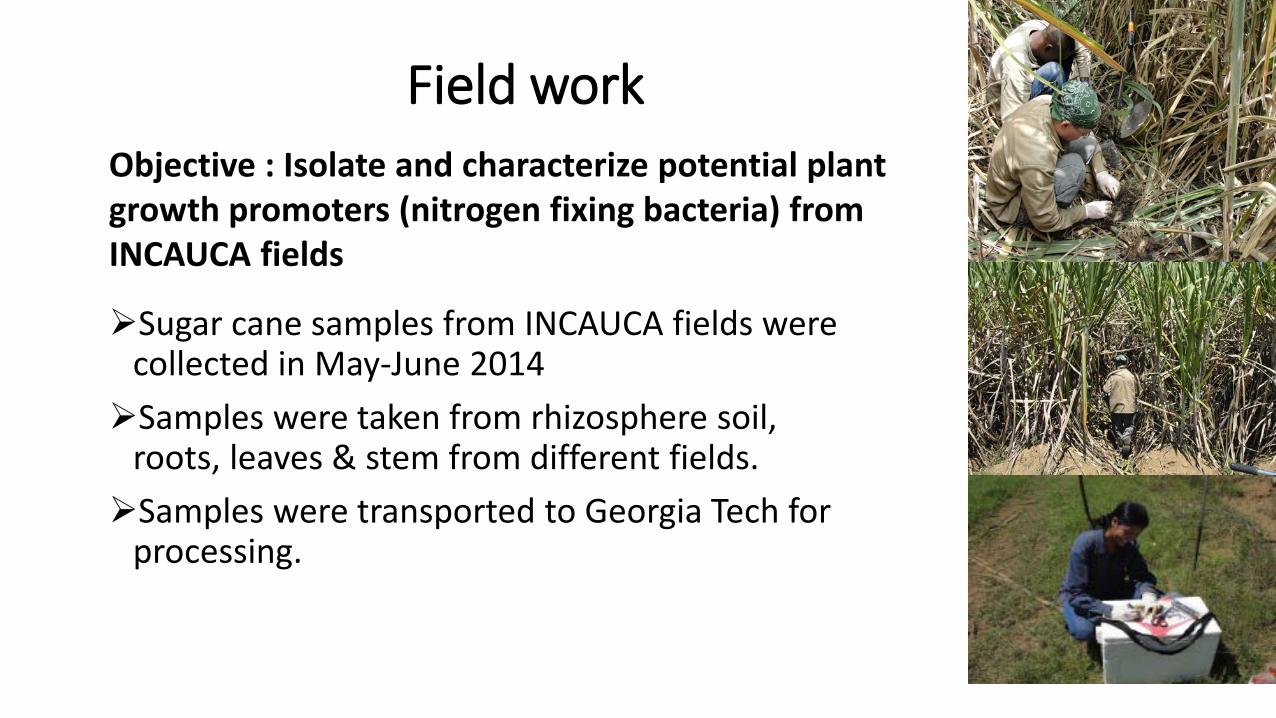
Field work
Sugar cane samples from INCAUCA fields were collected in May-June 2014Samples were taken from rhizosphere soil,
roots, leaves & stem from different fields. Samples were transported to Georgia Tech for
processing.
Objective : Isolate and characterize potential plant growth promoters (nitrogen fixing bacteria) from INCAUCA fields
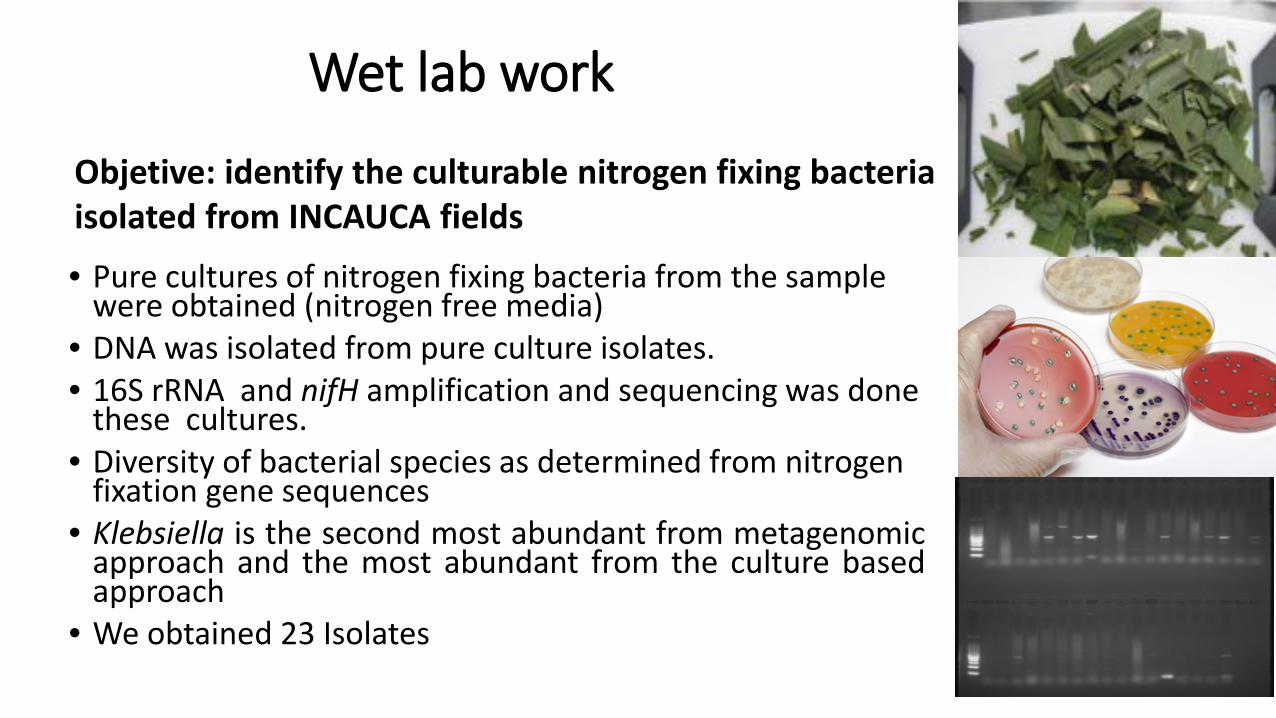
Wet lab work
• Pure cultures of nitrogen fixing bacteria from the sample were obtained (nitrogen free media)
• DNA was isolated from pure culture isolates.• 16S rRNA and nifH amplification and sequencing was done
these cultures.• Diversity of bacterial species as determined from nitrogen
fixation gene sequences• Klebsiella is the second most abundant from metagenomic
approach and the most abundant from the culture basedapproach
• We obtained 23 Isolates
Objetive: identify the culturable nitrogen fixing bacteria isolated from INCAUCA fields
Genomics & Bioinformatics
• Objective: Analyze whole genome sequence from 23 isolatesin order to classify and prioritize potential plant growthpromoting bacteria. We want strains that are predicted tohave maximum benefit to the plants while presentingminimum risk to the environment, including local humanpopulations.
22
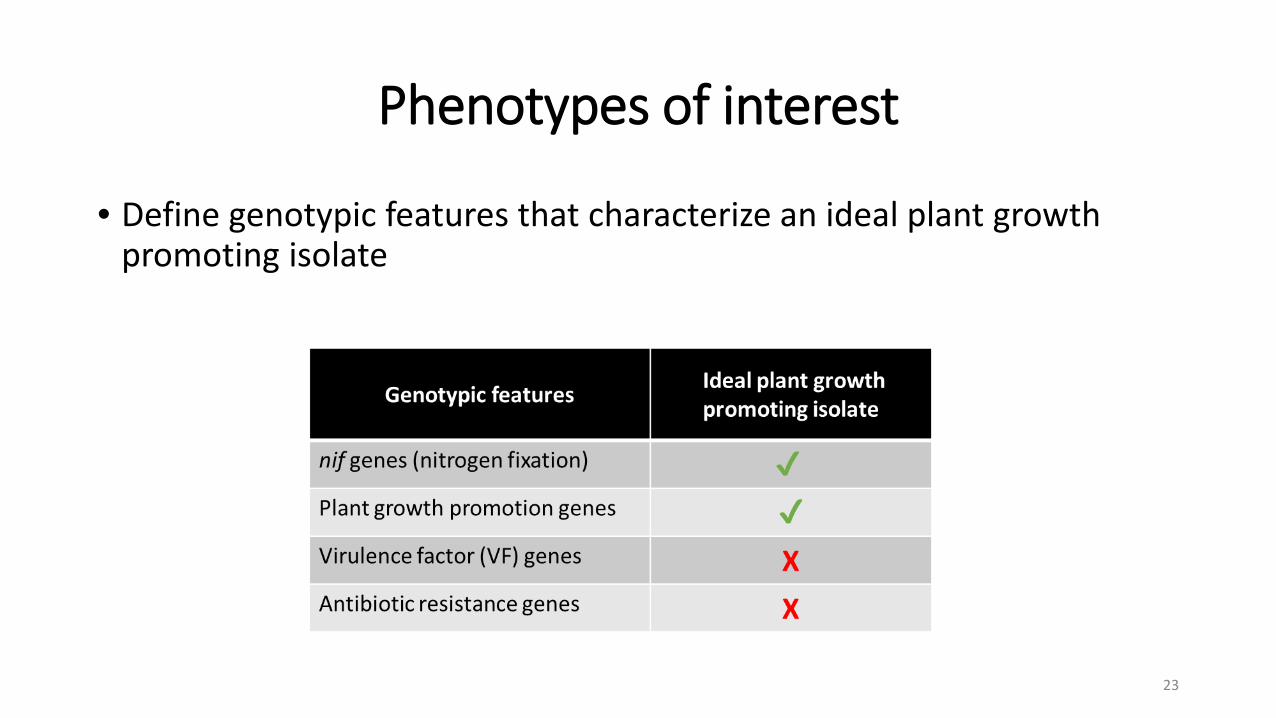
Phenotypes of interest
• Define genotypic features that characterize an ideal plant growth promoting isolate
23
24
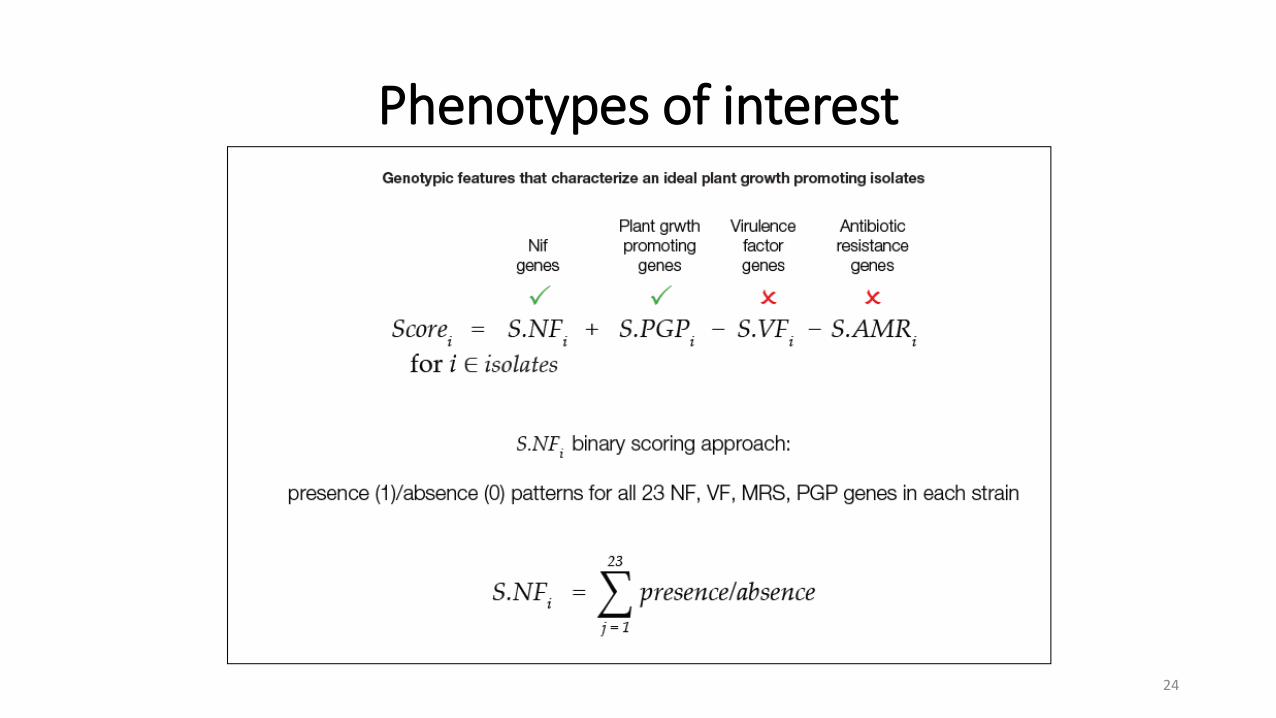
Phenotypes of interest
Computational Phenotyping methodology
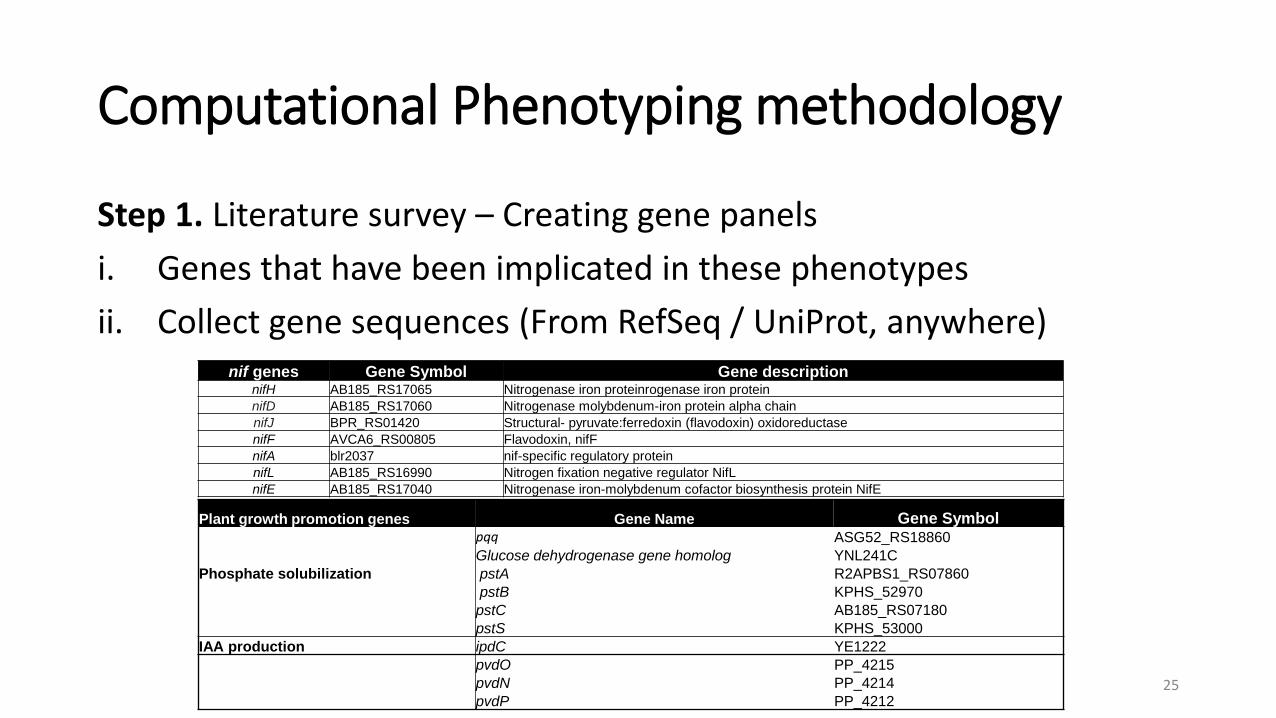
Step 1. Literature survey – Creating gene panelsi. Genes that have been implicated in these phenotypesii. Collect gene sequences (From RefSeq / UniProt, anywhere)
nif genes Gene Symbol Gene description nifH AB185_RS17065 Nitrogenase iron proteinrogenase iron proteinnifD AB185_RS17060 Nitrogenase molybdenum-iron protein alpha chainnifJ BPR_RS01420 Structural- pyruvate:ferredoxin (flavodoxin) oxidoreductase nifF AVCA6_RS00805 Flavodoxin, nifFnifA blr2037 nif-specific regulatory proteinnifL AB185_RS16990 Nitrogen fixation negative regulator NifLnifE AB185_RS17040 Nitrogenase iron-molybdenum cofactor biosynthesis protein NifE
Plant growth promotion genes Gene Name Gene Symbolpqq ASG52_RS18860Glucose dehydrogenase gene homolog YNL241C
Phosphate solubilization pstA R2APBS1_RS07860pstB KPHS_52970pstC AB185_RS07180pstS KPHS_53000
IAA production ipdC YE1222pvdO PP_4215pvdN PP_4214pvdP PP_4212
25
Computational Phenotyping methodology
26
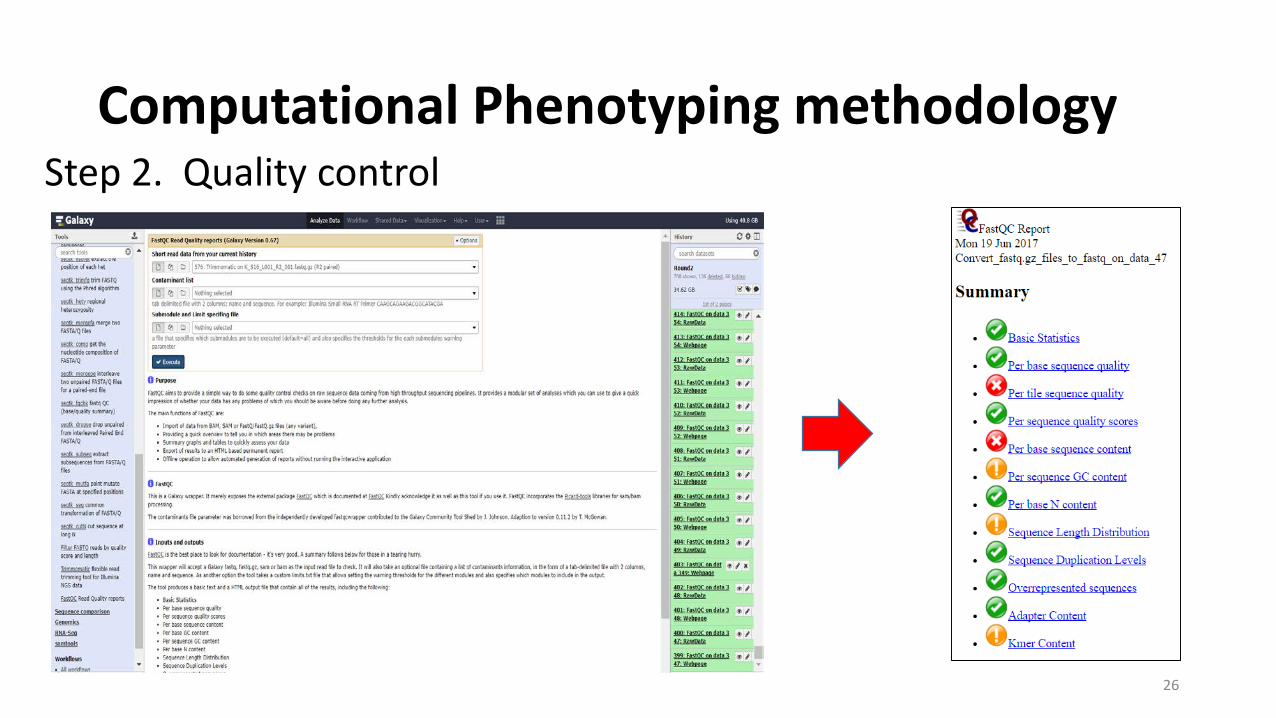
Step 2. Quality control
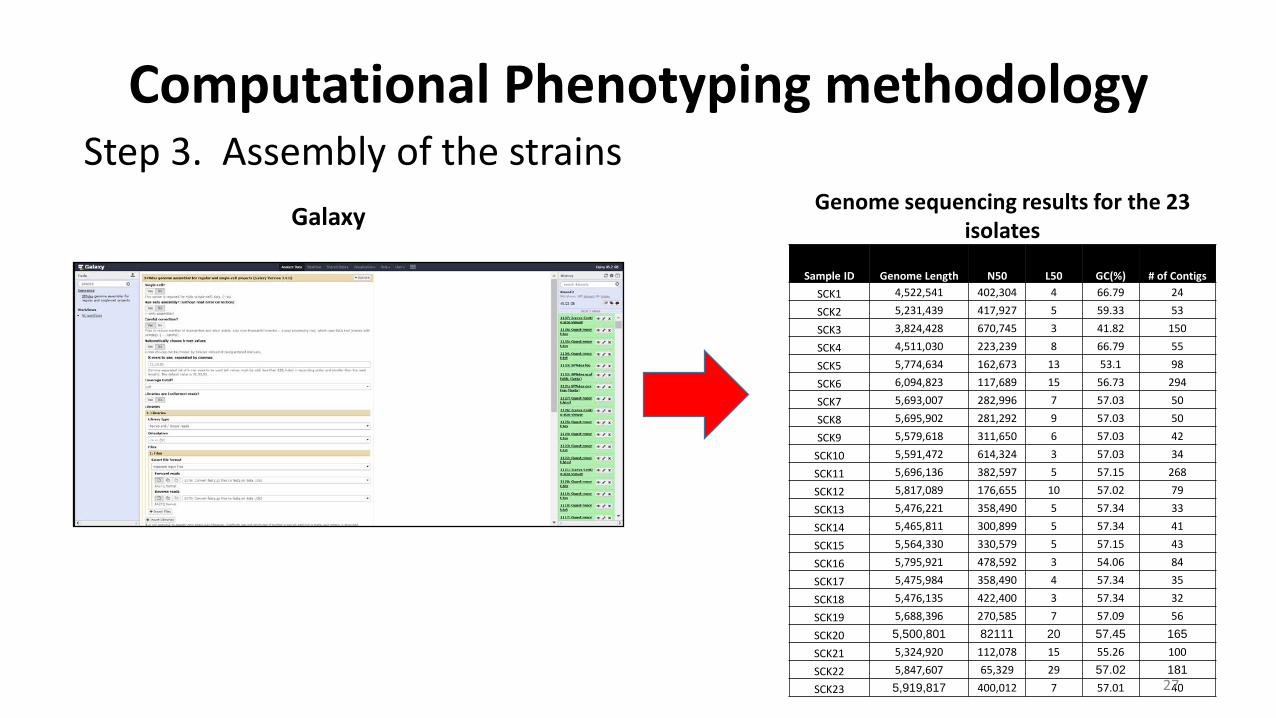
Computational Phenotyping methodology Step 3. Assembly of the strains
Galaxy
Sample ID Genome Length N50 L50 GC(%) # of Contigs SCK1 4,522,541 402,304 4 66.79 24
SCK2 5,231,439 417,927 5 59.33 53
SCK3 3,824,428 670,745 3 41.82 150
SCK4 4,511,030 223,239 8 66.79 55
SCK5 5,774,634 162,673 13 53.1 98
SCK6 6,094,823 117,689 15 56.73 294
SCK7 5,693,007 282,996 7 57.03 50
SCK8 5,695,902 281,292 9 57.03 50
SCK9 5,579,618 311,650 6 57.03 42
SCK10 5,591,472 614,324 3 57.03 34
SCK11 5,696,136 382,597 5 57.15 268
SCK12 5,817,089 176,655 10 57.02 79
SCK13 5,476,221 358,490 5 57.34 33
SCK14 5,465,811 300,899 5 57.34 41
SCK15 5,564,330 330,579 5 57.15 43
SCK16 5,795,921 478,592 3 54.06 84
SCK17 5,475,984 358,490 4 57.34 35
SCK18 5,476,135 422,400 3 57.34 32
SCK19 5,688,396 270,585 7 57.09 56
SCK20 5,500,801 82111 20 57.45 165SCK21 5,324,920 112,078 15 55.26 100
SCK22 5,847,607 65,329 29 57.02 181SCK23 5,919,817 400,012 7 57.01 40
Genome sequencing results for the 23 isolates
27
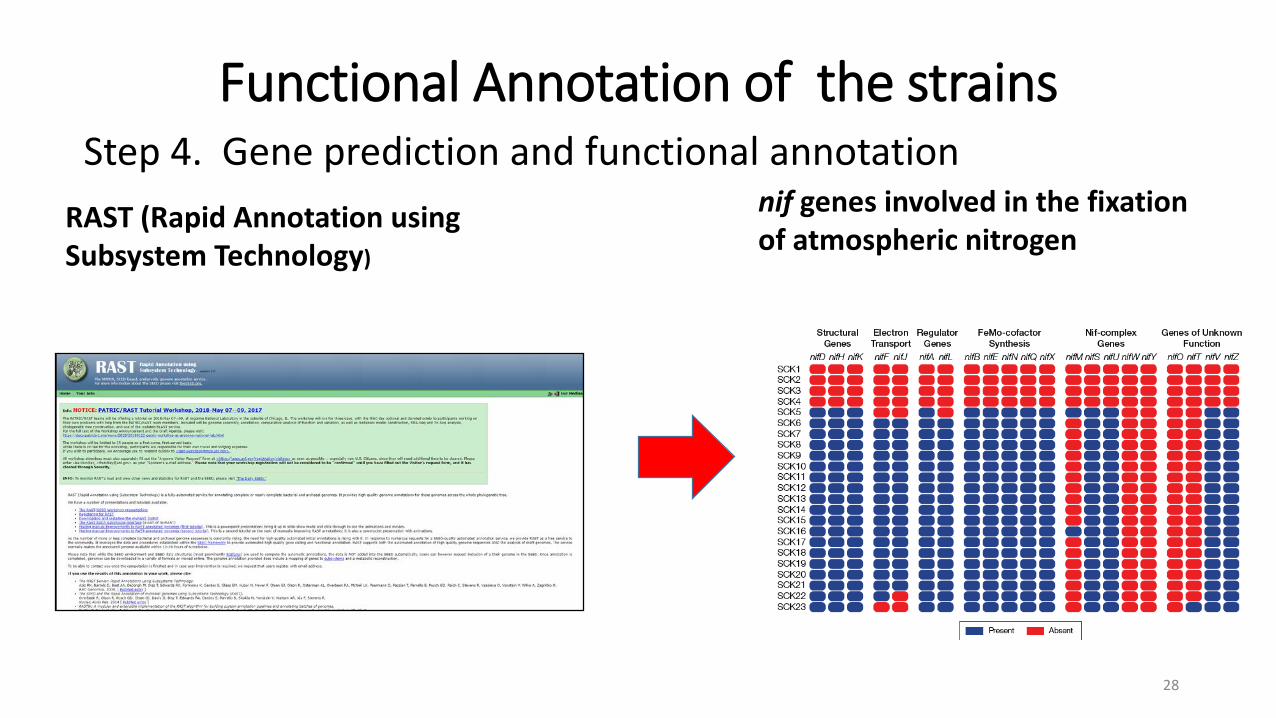
Functional Annotation of the strains
RAST (Rapid Annotation using Subsystem Technology)
nif genes involved in the fixation of atmospheric nitrogen
28
Step 4. Gene prediction and functional annotation
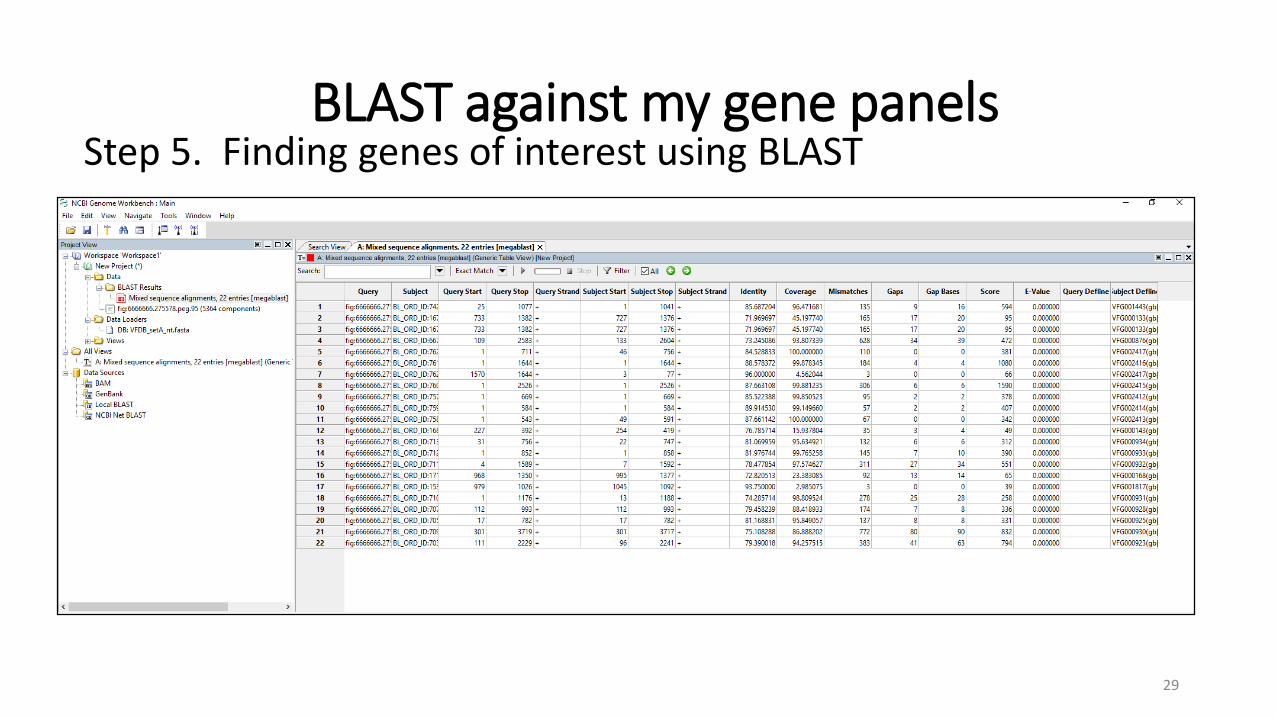
BLAST against my gene panels
29
Step 5. Finding genes of interest using BLAST

Computational Phenotyping methodology
Identity Coverage Gaps Score E-Value Genes 81.7204 8.61111 0 42 7.27E-16 gb|AJ011502 Klebsiella pneumoniae OmpK37 Klebsiella pneumoniae99.6516 100 0 852 0 gb|AM850914| Klebsiella pneumoniae99.5354 100 0 849 0 gb|AM850909| Klebsiella pneumoniae99.5354 100 0 849 0 gb|AY743416| Klebsiella pneumoniae99.4193 100 0 846 0 gb|AM850912|Klebsiella pneumoniae99.4193 100 0 846 0 gb|AY037780|Klebsiella pneumoniae94.2149 100 0 898 0 gb|AJ318073.1|Klebsiella pneumoniae acrA Klebsiella pneumoniae77.2586 29.3447 7 96 6.79E-46 gb|AJ011502|Klebsiella pneumoniae OmpK37 Klebsiella pneumoniae97.2603 56.5891 0 67 9.76E-31 gb|AJ011502|Klebsiella pneumoniae OmpK37 Klebsiella pneumoniae95.7333 100 0 981 0 gb|AJ011502|Klebsiella pneumoniae OmpK37 Klebsiella pneumoniae
What makes a gene “present” in the genome?
Empirical cutoffs (e.g. ≥ 75% identity over ≥ 75% of the length)
What is the minimum set of genes needed for the phenotype
30
Step 6. Interpreting my results
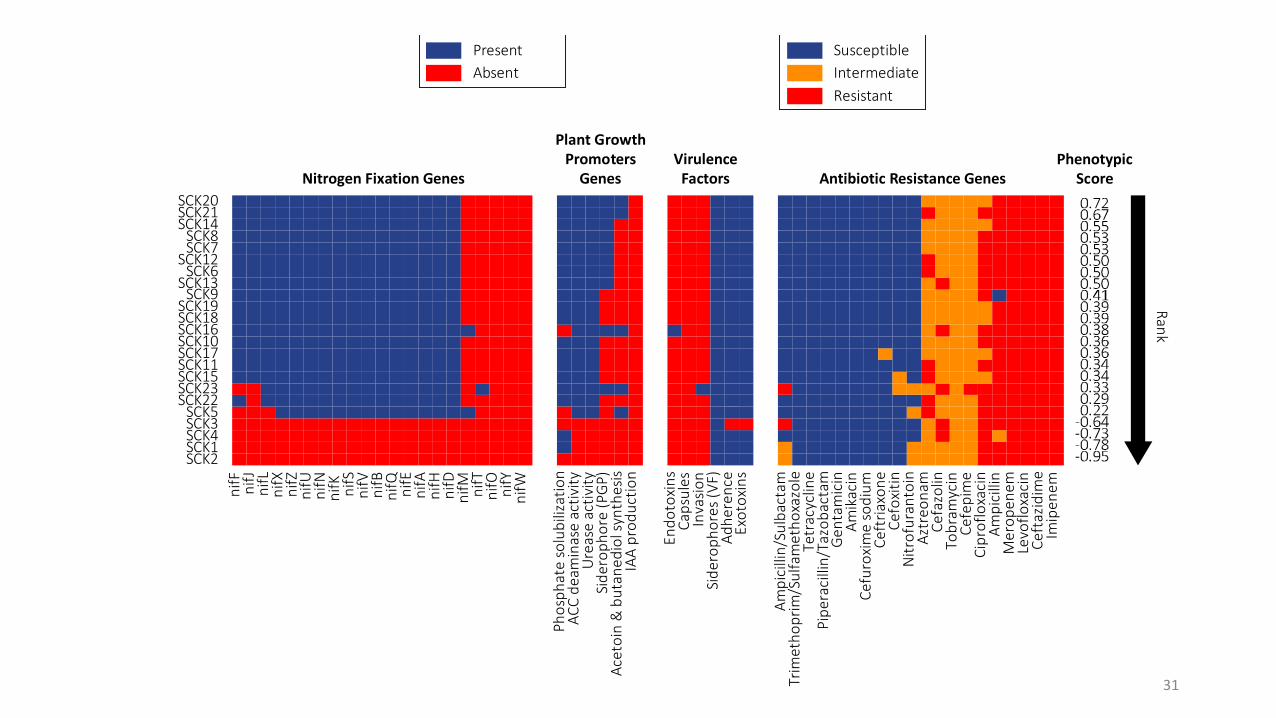
Nitrogen Fixation Genes Antibiotic Resistance Genes
Plant GrowthPromoters
GenesVirulence
Factors
SusceptibleIntermediateResistant
PresentAbsent
Phos
phat
e so
lubi
lizat
ion
ACC
deam
inas
e ac
tivity
Ure
ase
activ
itySi
dero
phor
e (P
GP)
Acet
oin
& b
utan
edio
l syn
thes
isIA
A pr
oduc
tion
Endo
toxi
nsCa
psul
esIn
vasio
nSi
dero
phor
es (V
F)Ad
here
nce
Exot
oxin
s
Ampi
cilli
n/Su
lbac
tam
Trim
etho
prim
/Sul
fam
etho
xazo
leTe
trac
yclin
ePi
pera
cilli
n/Ta
zoba
ctam
Gen
tam
icin
Amik
acin
Cefu
roxi
me
sodi
umCe
ftria
xone
Cefo
xitin
Nitr
ofur
anto
inAz
treo
nam
Cefa
zolin
Tobr
amyc
inCe
fepi
me
Cipr
oflo
xaci
nAm
pici
llin
Mer
open
emLe
voflo
xaci
nCe
ftaz
idim
eIm
ipen
emnifF nifJ
nifL
nifX
nifZ
nifU
nifN
nifK nifS
nifV
nifB
nifQ nifE
nifA
nifH
nifD
nifM nifT
nifO nifY
nifW
SCK2SCK1SCK4SCK3SCK5
SCK22SCK23SCK15SCK11SCK17SCK10SCK16SCK18SCK19
SCK9SCK13
SCK6SCK12
SCK7SCK8
SCK14SCK21SCK20
Rank
PhenotypicScore
31
Conclusions
Computational phenotyping software helps predict thephenotypes of organisms using only their genome sequencesComputational phenotyping tools are more useful if they
scale from few to many genomesComputational phenotyping can guide wetlab research by
highlighting traits of interest, reducing the amount of wet labwork required
32