computer-aided detection in dbt (digital breast...
TRANSCRIPT
Computer-aided detection
in DBT (digital breast tomosynthesis)
2015 Summer
Prof. Yong Man Ro
Image and Video Systems (IVY) Lab.,
Department of Electrical Engineering, KAIST
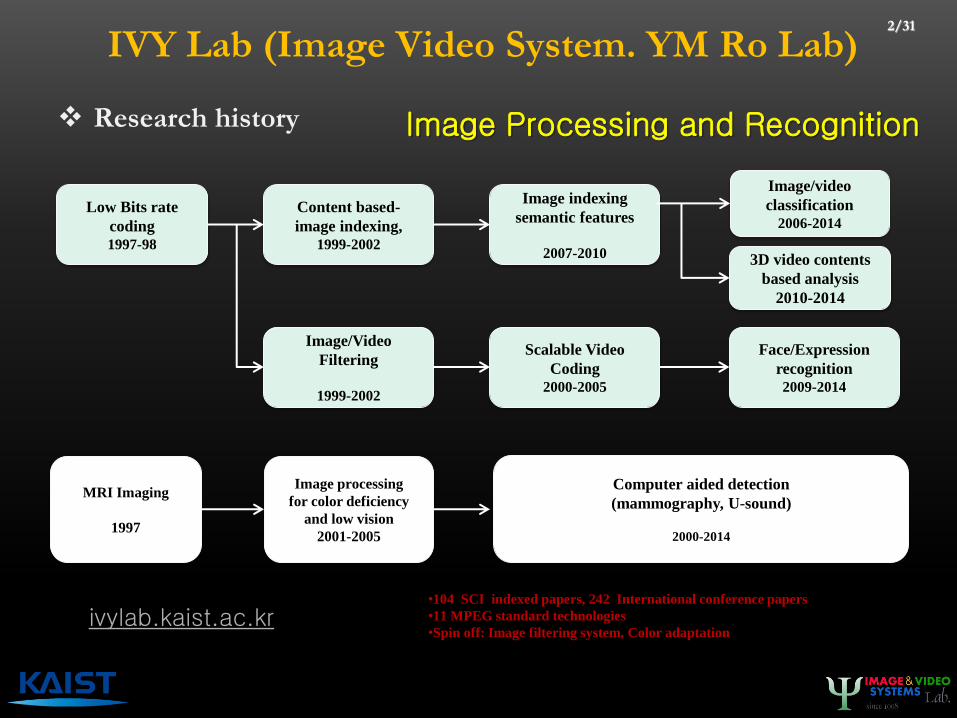
IVY Lab (Image Video System. YM Ro Lab)
Research history
2/31
MRI Imaging
1997
Low Bits rate
coding
1997-98
Content based-
image indexing,
1999-2002
Scalable Video
Coding
2000-2005
Image/video
classification
2006-2014
Computer aided detection
(mammography, U-sound)
2000-2014
Image indexing
semantic features
2007-2010
Face/Expression
recognition
2009-2014
3D video contents
based analysis
2010-2014
Image/Video
Filtering
1999-2002
•104 SCI indexed papers, 242 International conference papers
•11 MPEG standard technologies
•Spin off: Image filtering system, Color adaptation
Image Processing and Recognition
Image processing
for color deficiency
and low vision
2001-2005
ivylab.kaist.ac.kr
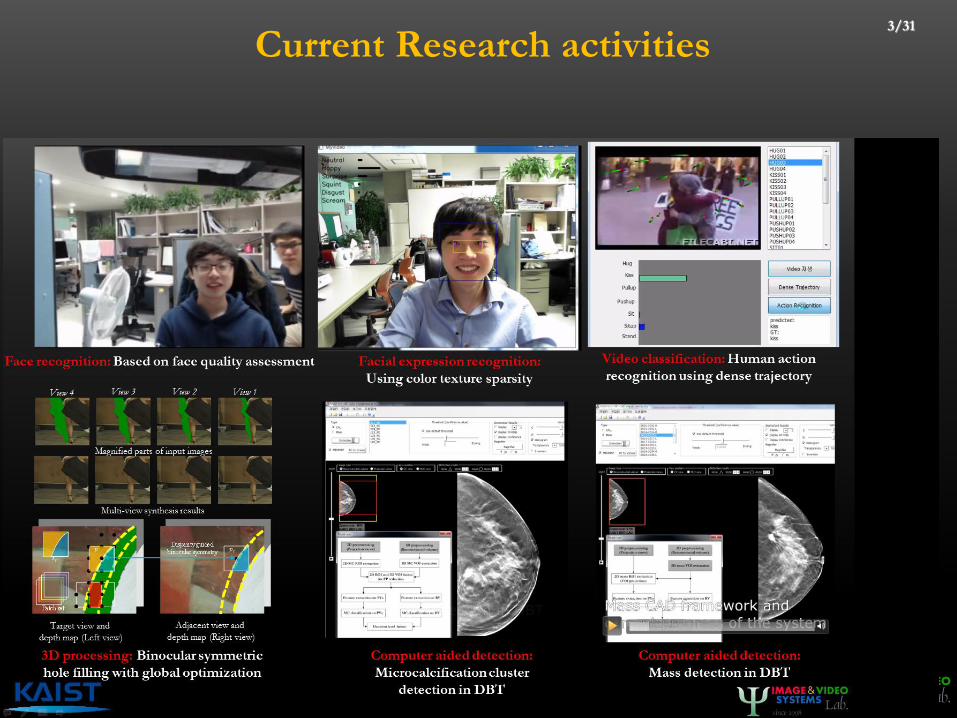
Current Research activities 3/31
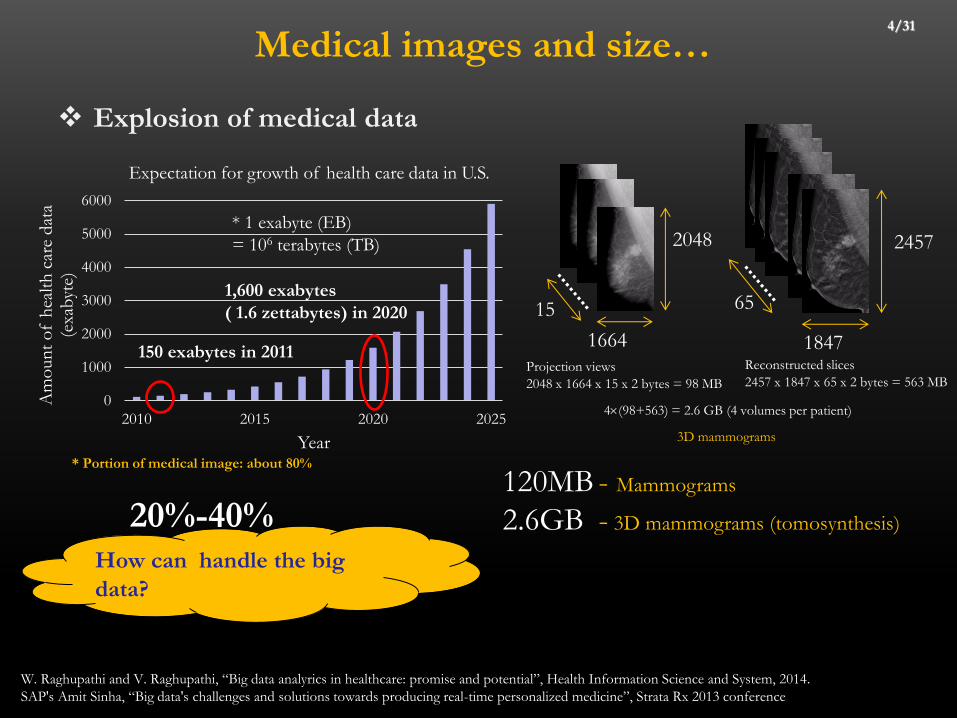
Medical images and size…
Explosion of medical data
4/31
20%-40% Annual increase in
medical image archives
120MB - Mammograms
2.6GB - 3D mammograms (tomosynthesis)
W. Raghupathi and V. Raghupathi, “Big data analyrics in healthcare: promise and potential”, Health Information Science and System, 2014.
SAP's Amit Sinha, “Big data's challenges and solutions towards producing real-time personalized medicine”, Strata Rx 2013 conference
How can handle the big
data?
0
1000
2000
3000
4000
5000
6000
2010 2015 2020 2025
Am
oun
t o
f h
ealt
h c
are
dat
a (e
xab
yte)
Year
Expectation for growth of health care data in U.S.
150 exabytes in 2011
1,600 exabytes
( 1.6 zettabytes) in 2020
* 1 exabyte (EB)
= 106 terabytes (TB)
3D mammograms
2457
1847
65
* Portion of medical image: about 80%
4(98+563) = 2.6 GB (4 volumes per patient)
2048
1664
15
Projection views
2048 x 1664 x 15 x 2 bytes = 98 MB
Reconstructed slices
2457 x 1847 x 65 x 2 bytes = 563 MB
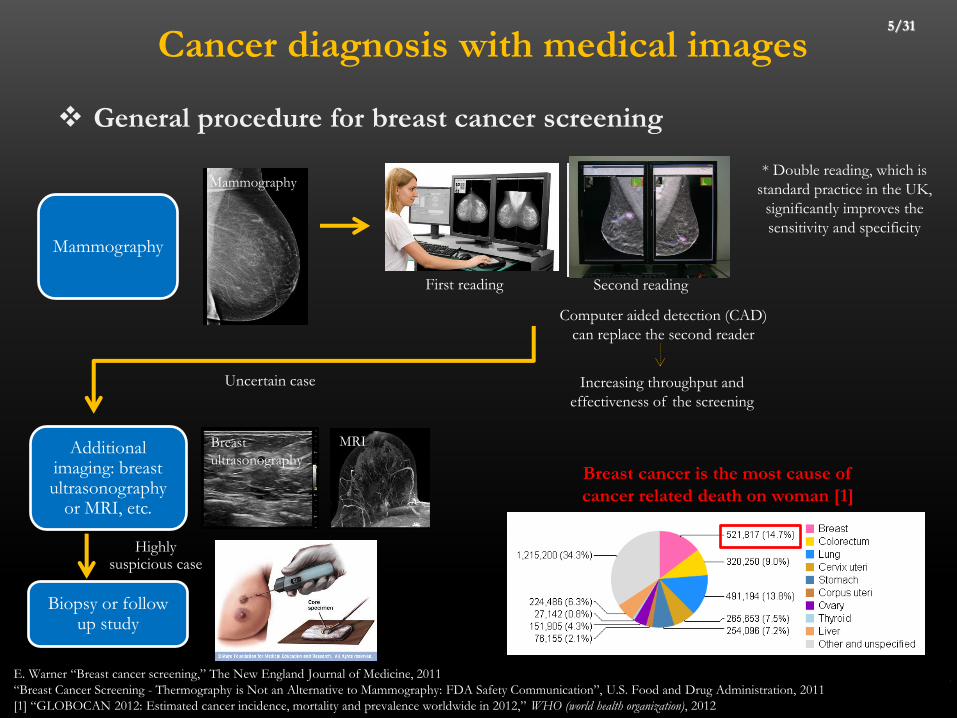
Cancer diagnosis with medical images
General procedure for breast cancer screening
Mammography
Additional imaging: breast ultrasonography
or MRI, etc.
Uncertain case
Biopsy or follow up study
E. Warner “Breast cancer screening,” The New England Journal of Medicine, 2011
“Breast Cancer Screening - Thermography is Not an Alternative to Mammography: FDA Safety Communication”, U.S. Food and Drug Administration, 2011
[1] “GLOBOCAN 2012: Estimated cancer incidence, mortality and prevalence worldwide in 2012,” WHO (world health organization), 2012
MRI Breast
ultrasonography
Mammography
5/31
Breast cancer is the most cause of
cancer related death on woman [1]
Highly suspicious case
Second reading First reading
Computer aided detection (CAD)
can replace the second reader
Increasing throughput and
effectiveness of the screening
* Double reading, which is
standard practice in the UK,
significantly improves the
sensitivity and specificity
Computer-aided detection via visual recognition 6/31
Feature space
Maximum
margin
Mass
Normal
Support
vectors
Example of SVM classification
Positive class Negative class
Sp
ars
e
co
eff
icie
nt
Example of sparse representation based classification
A test mass image
Sparse representation
Apparent spiculated patterns Subtle spiculated patterns
ClassificationInput image
Preprocessing ROI detectionFeature
extraction
(a) Input mammogram (b) Preprocessed
mammogram
(c) Detected ROI
candidates
(d) Final result
to be displayed
Detected ROI
candidates
ROI classified
as a mass
Decision
Normal tissue
(negative class)
Mass
(positive class)
A general framework of CAD
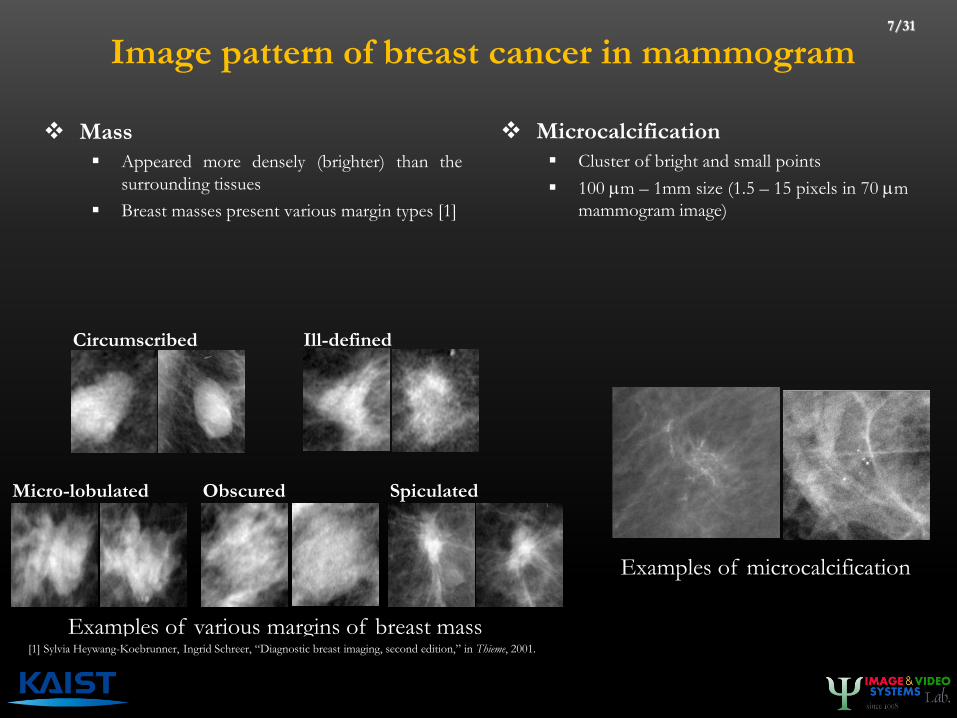
Image pattern of breast cancer in mammogram
Mass
Appeared more densely (brighter) than the
surrounding tissues
Breast masses present various margin types [1]
Microcalcification
Cluster of bright and small points
100 mm – 1mm size (1.5 – 15 pixels in 70 mm
mammogram image)
Circumscribed Ill-defined
Spiculated Obscured Micro-lobulated
Examples of various margins of breast mass [1] Sylvia Heywang-Koebrunner, Ingrid Schreer, “Diagnostic breast imaging, second edition,” in Thieme, 2001.
Examples of microcalcification
7/31
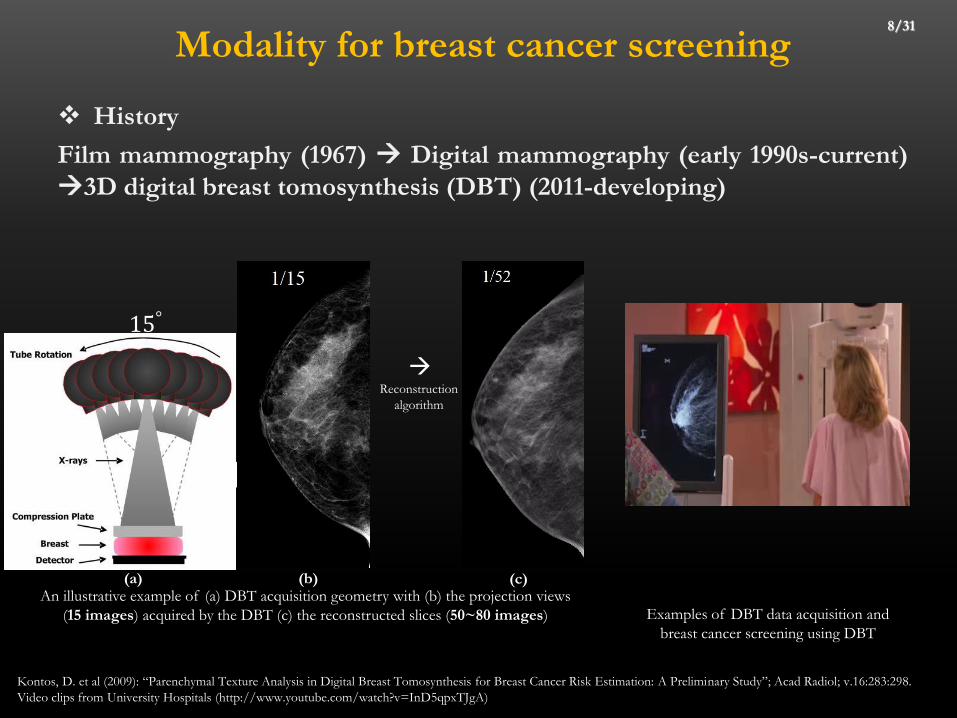
Modality for breast cancer screening
History
Film mammography (1967) Digital mammography (early 1990s-current)
3D digital breast tomosynthesis (DBT) (2011-developing)
8/31
Kontos, D. et al (2009): “Parenchymal Texture Analysis in Digital Breast Tomosynthesis for Breast Cancer Risk Estimation: A Preliminary Study”; Acad Radiol; v.16:283:298.
Video clips from University Hospitals (http://www.youtube.com/watch?v=InD5qpxTJgA)
Examples of DBT data acquisition and
breast cancer screening using DBT
15°
Reconstruction
algorithm
An illustrative example of (a) DBT acquisition geometry with (b) the projection views
(15 images) acquired by the DBT (c) the reconstructed slices (50~80 images)
(b) (c) (a)
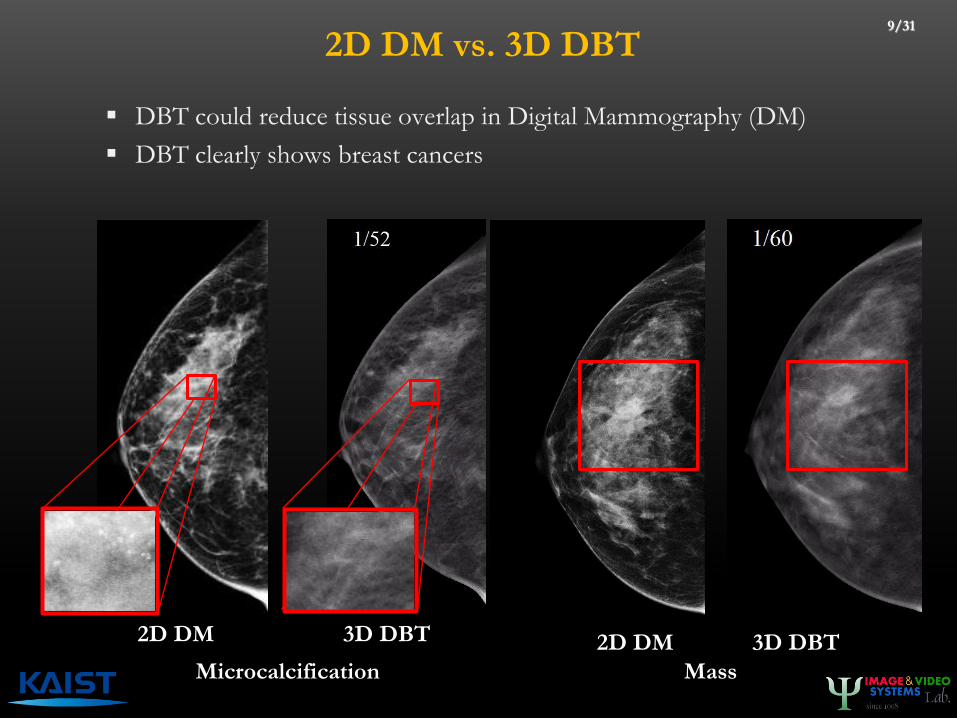
2D DM vs. 3D DBT
DBT could reduce tissue overlap in Digital Mammography (DM)
DBT clearly shows breast cancers
9/31
2D DM 3D DBT 2D DM 3D DBT
Microcalcification Mass
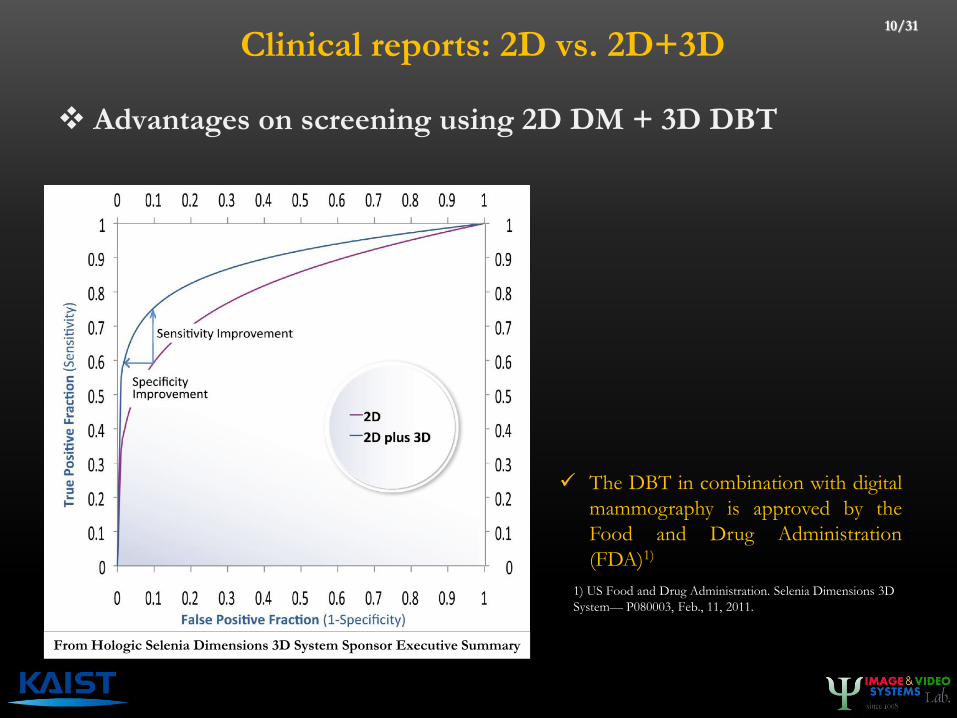
Clinical reports: 2D vs. 2D+3D
Advantages on screening using 2D DM + 3D DBT
From Hologic Selenia Dimensions 3D System Sponsor Executive Summary
10/31
1) US Food and Drug Administration. Selenia Dimensions 3D
System— P080003, Feb., 11, 2011.
The DBT in combination with digital
mammography is approved by the
Food and Drug Administration
(FDA)1)
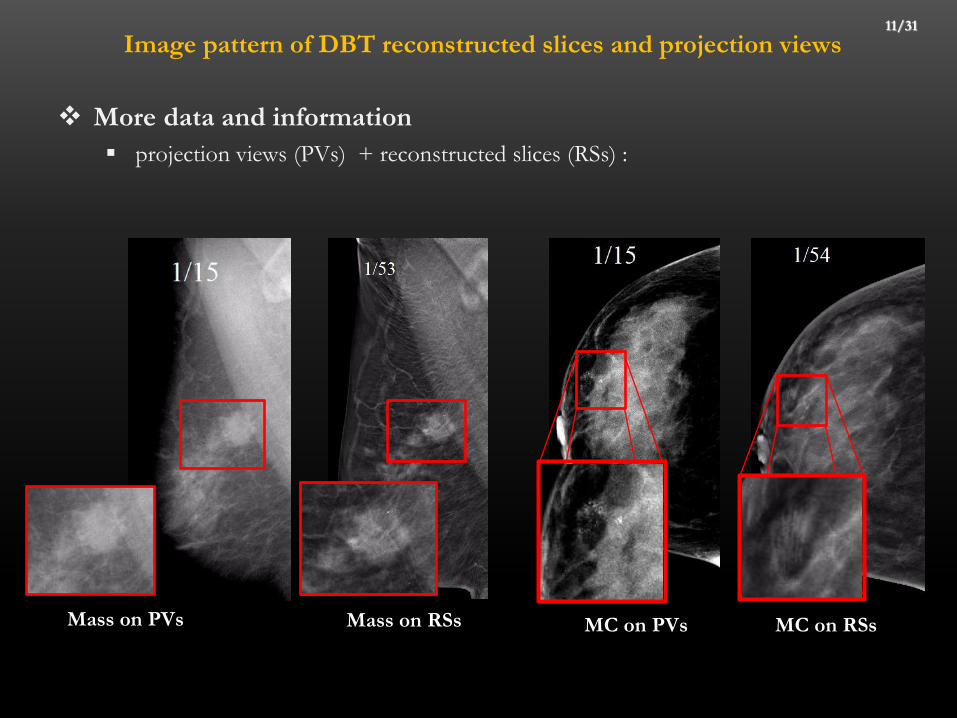
Image pattern of DBT reconstructed slices and projection views
More data and information
projection views (PVs) + reconstructed slices (RSs) :
11/31
Mass on RSs Mass on PVs MC on RSs MC on PVs
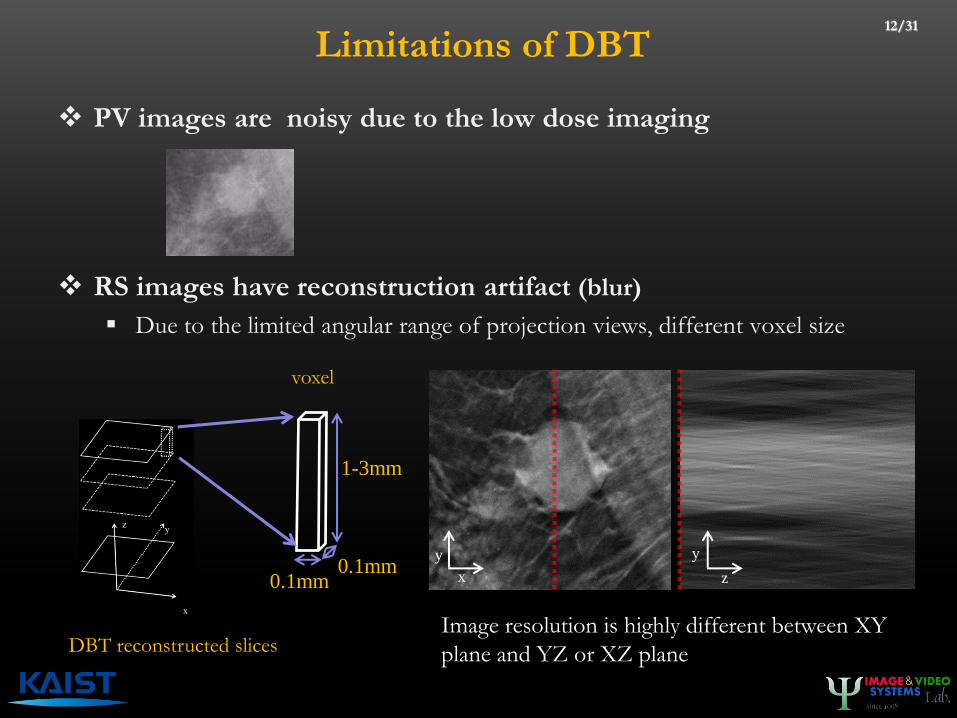
Limitations of DBT
PV images are noisy due to the low dose imaging
RS images have reconstruction artifact (blur)
Due to the limited angular range of projection views, different voxel size
12/31
voxel
0.1mm 0.1mm
1-3mm
DBT reconstructed slices Image resolution is highly different between XY
plane and YZ or XZ plane
x
y
z
y
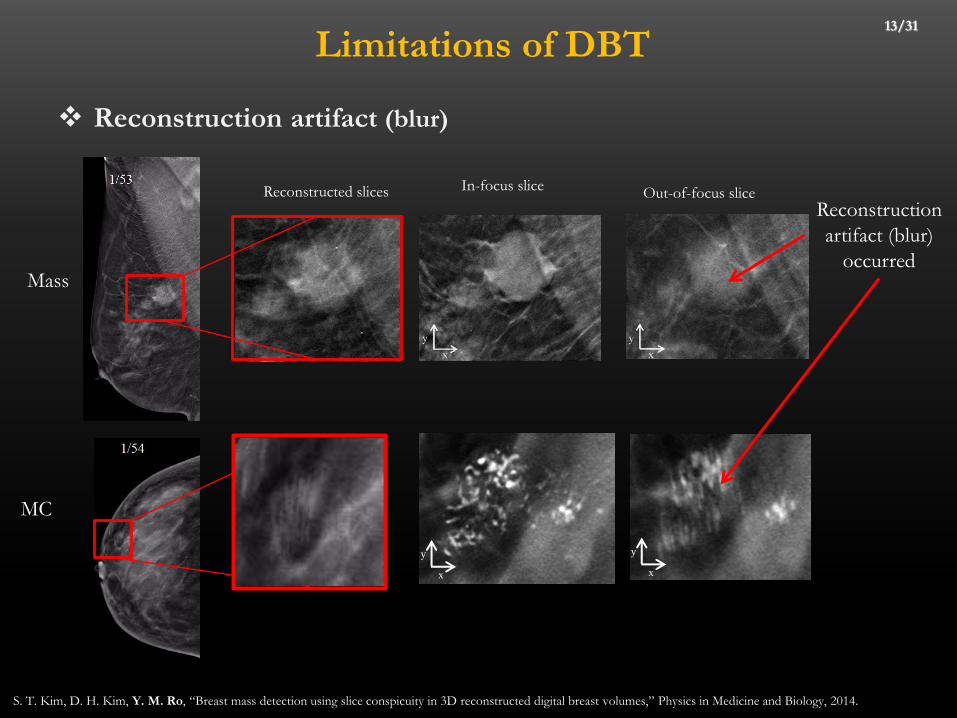
Limitations of DBT
Reconstruction artifact (blur)
13/31
Mass
MC
In-focus slice Out-of-focus slice Reconstructed slices
S. T. Kim, D. H. Kim, Y. M. Ro, “Breast mass detection using slice conspicuity in 3D reconstructed digital breast volumes,” Physics in Medicine and Biology, 2014.
Reconstruction
artifact (blur)
occurred
x
y
x
y

Novelty : limitations reduction and maximum use of information from both PV and RS
15 projection views 50~80 reconstructed slices
CAD system Utilizing both projection
and reconstruction data
High performance DBT CAD developed by IVY lab 14/31
CAD system
Detection breast cancers on
projection views
Detection breast cancers on
reconstructed slices
Low-dose and noisy condition
Need for enhancement technique
Correlation between projection views
Developing a new feature
Raw PVs Enhanced PVs
W.J. Baddar, D. H. Kim, E.J. Kim, Y. M. Ro, “Utilizing digital breast
tomosynthesis projection views correlation for microcalcification
enhancement for detection purposes,” to be presented at SPIE MI, 2015
Reconstruction artifact due to the
limited number of view
Need for extracting features by
mitigrating the blur effect
How to effectively combining the results?
Developing a ensemble classifier-based combination
Input image
Preprocessing
ROI detection
Feature extraction
Classification
Decision
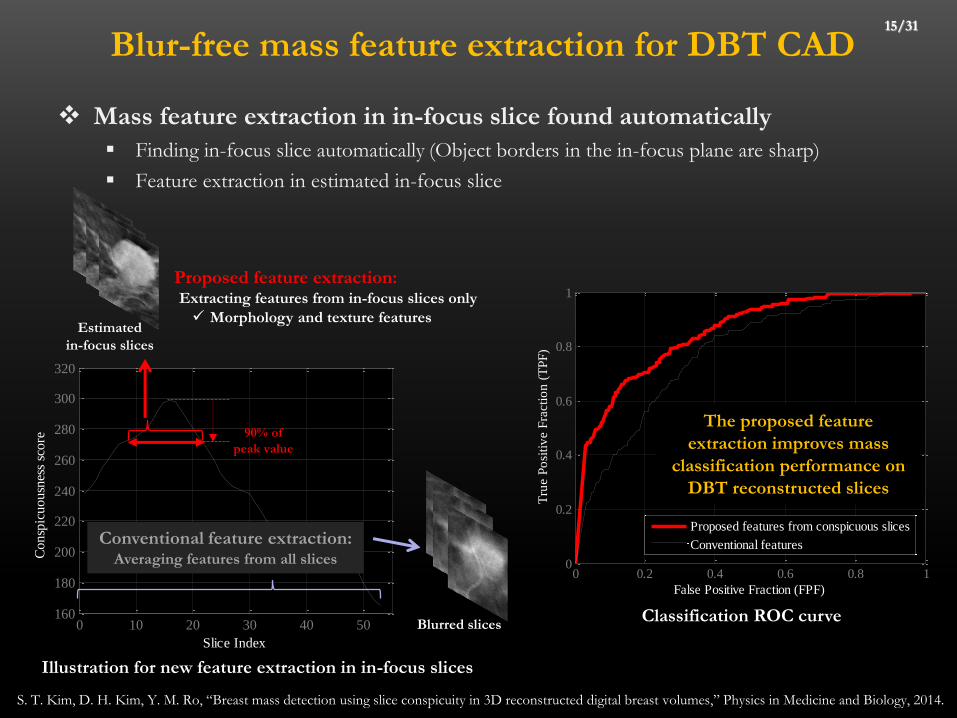
Blur-free mass feature extraction for DBT CAD
Mass feature extraction in in-focus slice found automatically
Finding in-focus slice automatically (Object borders in the in-focus plane are sharp)
Feature extraction in estimated in-focus slice
15/31
S. T. Kim, D. H. Kim, Y. M. Ro, “Breast mass detection using slice conspicuity in 3D reconstructed digital breast volumes,” Physics in Medicine and Biology, 2014.
Classification ROC curve
0 0.2 0.4 0.6 0.8 10
0.2
0.4
0.6
0.8
1
False Positive Fraction (FPF)
Tru
e P
osi
tiv
e F
racti
on
(T
PF
)
Proposed features from conspicuous slices
Conventional features
The proposed feature
extraction improves mass
classification performance on
DBT reconstructed slices
0 10 20 30 40 50160
180
200
220
240
260
280
300
320
Slice Index
Consp
icuousn
ess
score
Illustration for new feature extraction in in-focus slices
Estimated
in-focus slices
Proposed feature extraction: Extracting features from in-focus slices only
Morphology and texture features
Blurred slices
90% of
peak value
Conventional feature extraction: Averaging features from all slices
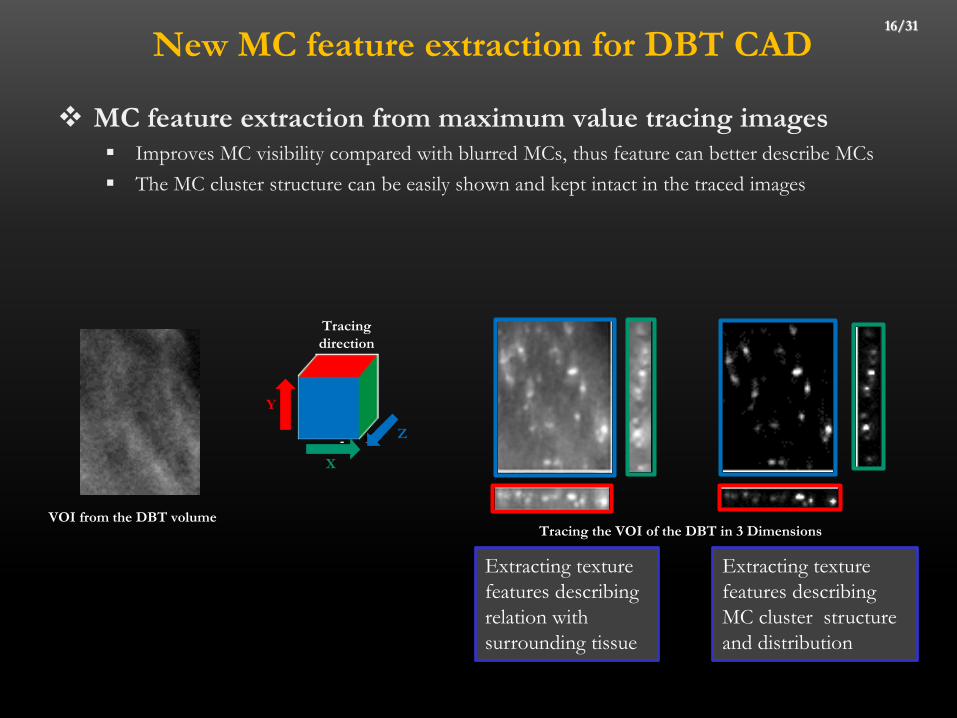
New MC feature extraction for DBT CAD
MC feature extraction from maximum value tracing images Improves MC visibility compared with blurred MCs, thus feature can better describe MCs
The MC cluster structure can be easily shown and kept intact in the traced images
16/31
Tracing the VOI of the DBT in 3 Dimensions
Z
X
Y
VOI from the DBT volume
Tracing
direction
Extracting texture
features describing
relation with
surrounding tissue
Extracting texture
features describing
MC cluster structure
and distribution

New MC feature extraction for DBT CAD 17/31
E.J. Kim, D.H. Kim, E.S. Cha, and Y.M. Ro. "Improvement of subtle microcalcifications detection in DBT slices." In
Biomedical and Health Informatics (BHI), 2014 IEEE-EMBS International Conference on, pp. 322-325. IEEE, 2014.
The proposed feature extraction improves MC classification performance
on DBT reconstructed slices
Classification FROC curve
0 0.5 1 1.5 2 2.5 30.2
0.3
0.4
0.5
0.6
0.7
0.8
0.9
1
Average number of false positive per volume
Sen
siti
vit
y
3 directional maximum ray-tracing features
Conventional 3D features
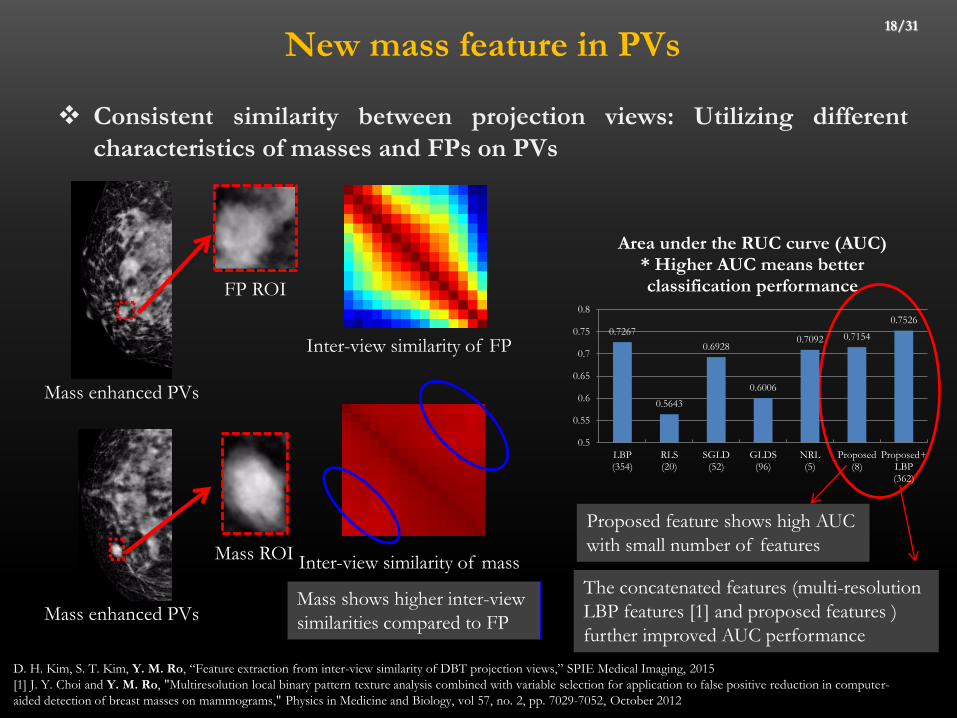
New mass feature in PVs
Consistent similarity between projection views: Utilizing different
characteristics of masses and FPs on PVs
18/31
Mass shows higher inter-view
similarities compared to FP
D. H. Kim, S. T. Kim, Y. M. Ro, “Feature extraction from inter-view similarity of DBT projection views,” SPIE Medical Imaging, 2015
[1] J. Y. Choi and Y. M. Ro, "Multiresolution local binary pattern texture analysis combined with variable selection for application to false positive reduction in computer-
aided detection of breast masses on mammograms," Physics in Medicine and Biology, vol 57, no. 2, pp. 7029-7052, October 2012
The concatenated features (multi-resolution
LBP features [1] and proposed features )
further improved AUC performance
Proposed feature shows high AUC
with small number of features
Inter-view similarity of FP
Mass enhanced PVs
FP ROI
Inter-view similarity of mass
Mass enhanced PVs
Mass ROI
0.7267
0.5643
0.6928
0.6006
0.7092 0.7154
0.7526
0.5
0.55
0.6
0.65
0.7
0.75
0.8
LBP(354)
RLS(20)
SGLD(52)
GLDS(96)
NRL(5)
Proposed(8)
Proposed+LBP(362)
Area under the RUC curve (AUC)* Higher AUC means better classification performance
Maximum use of information from both PV and RS
for High performance DBT CAD lab
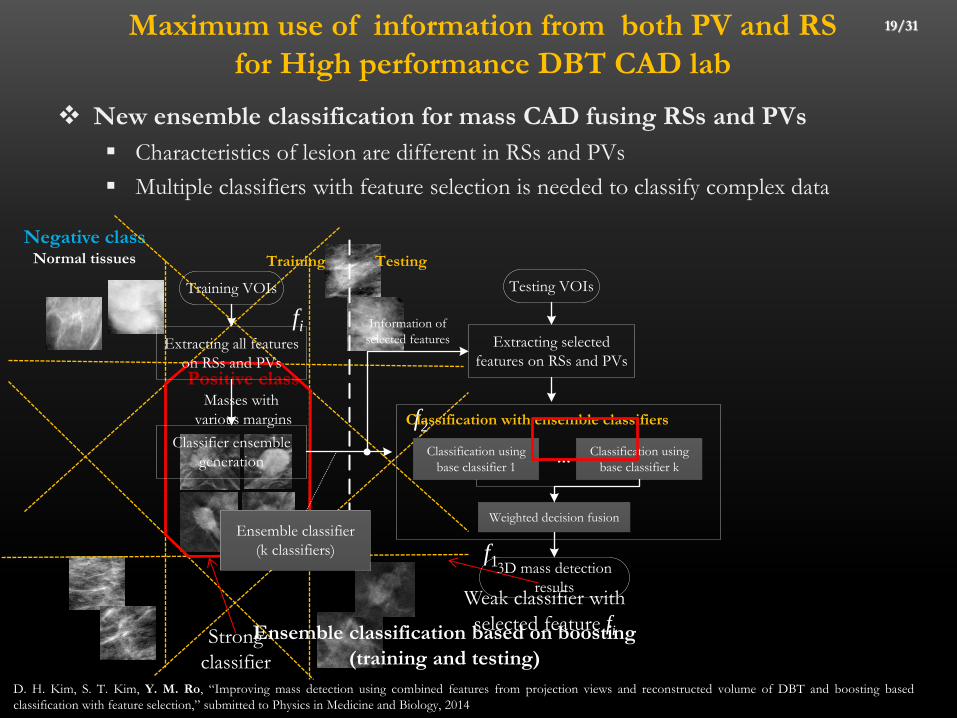
New ensemble classification for mass CAD fusing RSs and PVs
Characteristics of lesion are different in RSs and PVs
Multiple classifiers with feature selection is needed to classify complex data
19/31
D. H. Kim, S. T. Kim, Y. M. Ro, “Improving mass detection using combined features from projection views and reconstructed volume of DBT and boosting based
classification with feature selection,” submitted to Physics in Medicine and Biology, 2014
Positive class Masses with
various margins
Negative class Normal tissues
Weak classifier with
selected feature fi
f1
f2
fi
Strong
classifier
Ensemble classification based on boosting
(training and testing)
Training
Training VOIs
Classification using
base classifier 1
Classification using
base classifier k
Weighted decision fusion
3D mass detection
results
Classification with ensemble classifiers
…Classifier ensemble
generation
Ensemble classifier
(k classifiers)
Extracting all features
on RSs and PVs
Testing VOIs
Extracting selected
features on RSs and PVs
Information of
selected features
Testing
Maximum use of information from both PV and RS
for High performance DBT CAD lab
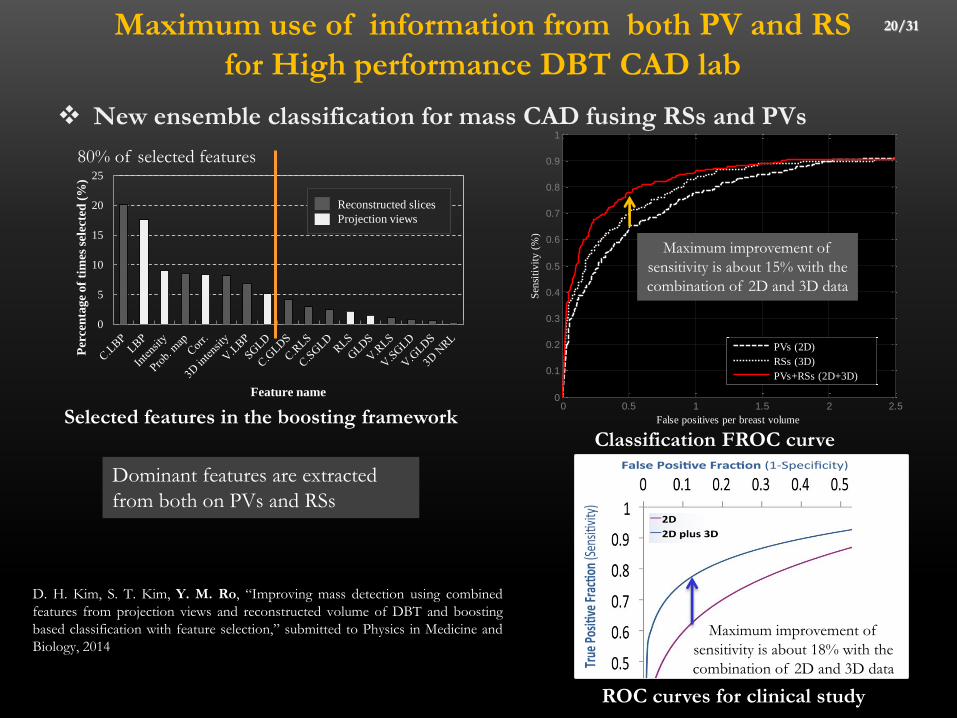
New ensemble classification for mass CAD fusing RSs and PVs
20/31
80% of selected features
Dominant features are extracted
from both on PVs and RSs
Selected features in the boosting framework
D. H. Kim, S. T. Kim, Y. M. Ro, “Improving mass detection using combined
features from projection views and reconstructed volume of DBT and boosting
based classification with feature selection,” submitted to Physics in Medicine and
Biology, 2014
0
5
10
15
20
25
Per
cen
tage o
f ti
mes
sele
cted
(%
)
Feature name
Reconstructed slices
Projection views
0 0.5 1 1.5 2 2.50
0.1
0.2
0.3
0.4
0.5
0.6
0.7
0.8
0.9
1
False positives per breast volume
Sen
siti
vit
y (
%)
PVs (2D)
RSs (3D)
PVs+RSs (2D+3D)
Classification FROC curve
Maximum improvement of
sensitivity is about 15% with the
combination of 2D and 3D data
ROC curves for clinical study
Maximum improvement of
sensitivity is about 18% with the
combination of 2D and 3D data

Multiview analysis
Clinical practice
Radiologists analyze the ipsilateral views to detect cancers and to reduce FPs
Matching corresponding regions in the ipsilateral DBT views is important
21/31
Mass have similar features
in CC and MLO view
Right CC view RSs Right MLO view RSs Ipsilateral views
CC view

Multiview analysis: Region matching in ipsilateral DBT views 22/31
Accuracy of the proposed region matching method and
breast compression model-based region matching method
Geometry-based
matching
Feature (Local structure)-
based search
S. T. Kim, D. H. Kim, D. J. Ji, and Y. M. Ro, “Region Matching based on local structure information in ipsilateral digital breast tomosynthesis views,” to be presented at IEEE
ICIP, 2015
[2] G. Van Schie, C. Tanner, P. Snoeren, M. Samulski, K. Leifland, M. G. Wallis, et al., "Correlating locations in ipsilateral breast tomosynthesis views using an analytical
hemispherical compression model," Physics in Medicine and Biology, vol. 56, p. 4715, 2011.
MLO view
compressed breast Uncompressed breast
Detector
CC view
compressed breast
Decompress
in MLO direction
Compress
in CC direction
Compression plate
Geometry-based matching
0 5 10 15 20 25 30 35 40 450
0.1
0.2
0.3
0.4
0.5
0.6
0.7
0.8
0.9
1
3D Euclidian distance between actual location of region and estimated location
Matc
hed
sen
siti
vit
y
Proposed region matching method
Geometry-based region matching method [2]
Left CC view RSs Left MLO view RSs
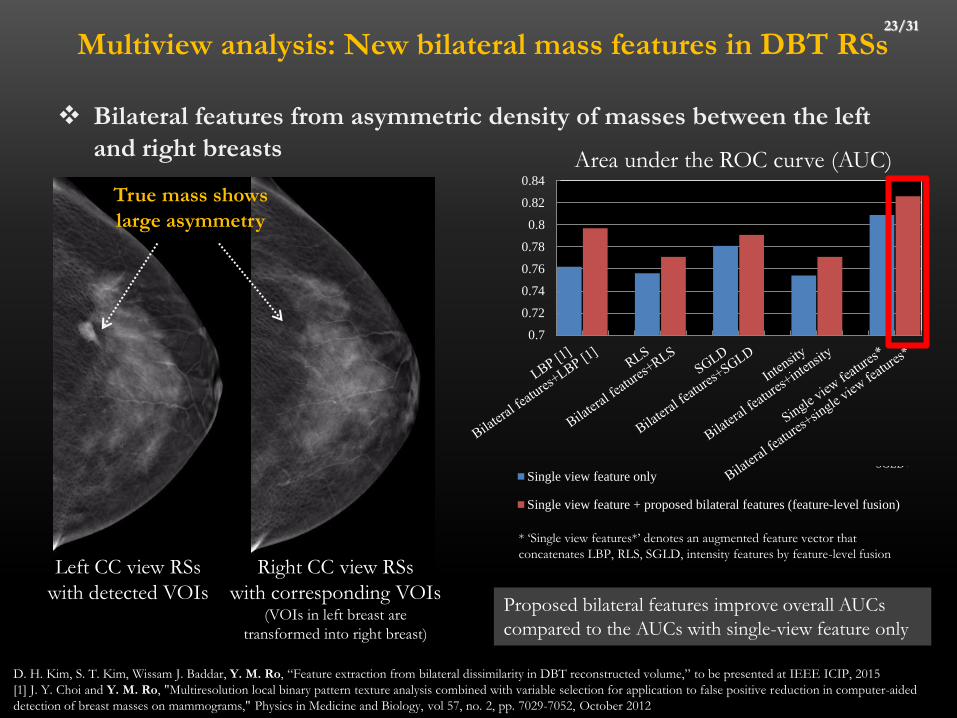
Multiview analysis: New bilateral mass features in DBT RSs
Bilateral features from asymmetric density of masses between the left
and right breasts
23/31
Left CC view RSs
with detected VOIs
True mass shows
large asymmetry
Right CC view RSs
with corresponding VOIs (VOIs in left breast are
transformed into right breast)
Area under the ROC curve (AUC)
Proposed bilateral features improve overall AUCs
compared to the AUCs with single-view feature only
D. H. Kim, S. T. Kim, Wissam J. Baddar, Y. M. Ro, “Feature extraction from bilateral dissimilarity in DBT reconstructed volume,” to be presented at IEEE ICIP, 2015
[1] J. Y. Choi and Y. M. Ro, "Multiresolution local binary pattern texture analysis combined with variable selection for application to false positive reduction in computer-aided
detection of breast masses on mammograms," Physics in Medicine and Biology, vol 57, no. 2, pp. 7029-7052, October 2012
0.7
0.72
0.74
0.76
0.78
0.8
0.82
0.84
* ‘Single view features*’ denotes an augmented feature vector that
concatenates LBP, RLS, SGLD, intensity features by feature-level fusion
0.7
0.72
0.74
0.76
0.78
0.8
0.82
0.84
LBP [1] RLS SGLD Intensity LBP+RLS+
SGLD+Intensity
Single view feature only
Single view feature + proposed bilateral features (feature-level fusion)
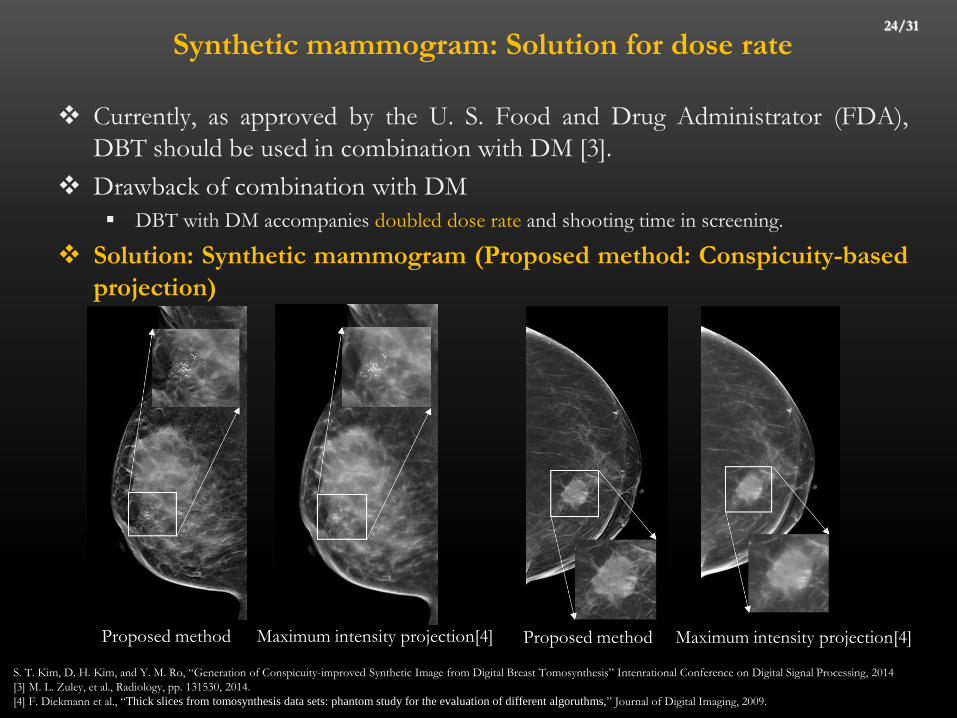
Synthetic mammogram: Solution for dose rate
Currently, as approved by the U. S. Food and Drug Administrator (FDA),
DBT should be used in combination with DM [3].
Drawback of combination with DM
DBT with DM accompanies doubled dose rate and shooting time in screening.
Solution: Synthetic mammogram (Proposed method: Conspicuity-based
projection)
24/31
S. T. Kim, D. H. Kim, and Y. M. Ro, “Generation of Conspicuity-improved Synthetic Image from Digital Breast Tomosynthesis” Intenrational Conference on Digital Signal Processing, 2014
[3] M. L. Zuley, et al., Radiology, pp. 131530, 2014.
[4] F. Diekmann et al., “Thick slices from tomosynthesis data sets: phantom study for the evaluation of different algoruthms,” Journal of Digital Imaging, 2009.
Proposed method Maximum intensity projection[4] Proposed method Maximum intensity projection[4]
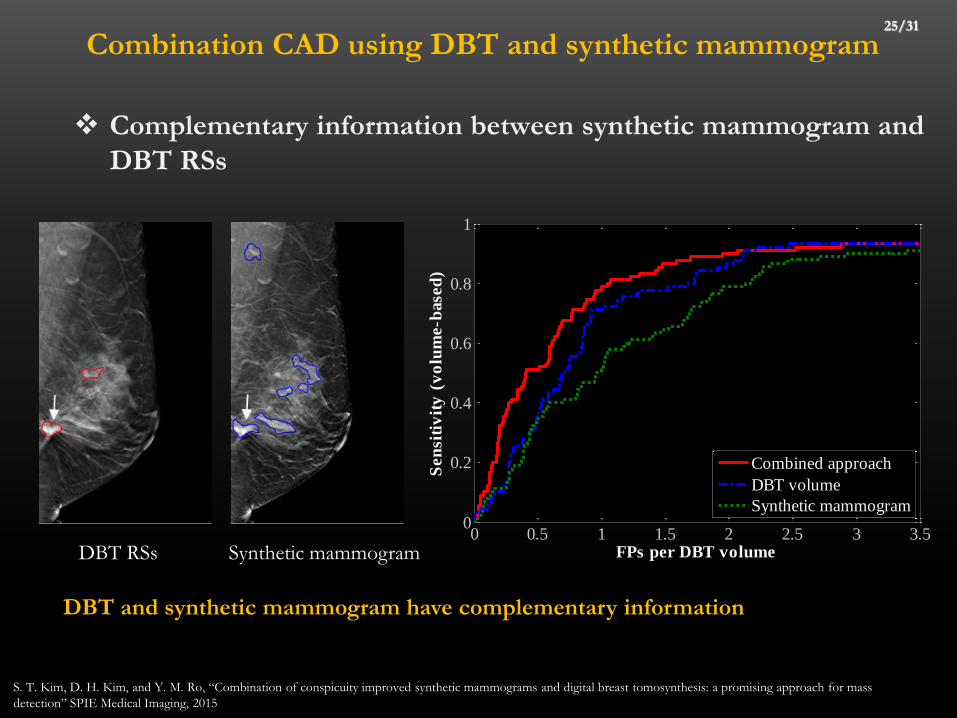
Combination CAD using DBT and synthetic mammogram
Complementary information between synthetic mammogram and
DBT RSs
25/31
0 0.5 1 1.5 2 2.5 3 3.50
0.2
0.4
0.6
0.8
1
FPs per DBT volume
Sen
siti
vit
y (
vo
lum
e-b
ase
d)
Combined approach
DBT volume
Synthetic mammogram
DBT and synthetic mammogram have complementary information
DBT RSs Synthetic mammogram
S. T. Kim, D. H. Kim, and Y. M. Ro, “Combination of conspicuity improved synthetic mammograms and digital breast tomosynthesis: a promising approach for mass
detection” SPIE Medical Imaging, 2015
KAIST DBT CAD System Video
ivylab.kaist.ac.kr
26/31
Publications (CAD)
1. Dae Hoe Kim, Seong Tae Kim, Wissam J. Baddarm, and Yong Man Ro, “Feature extraction from
bilateral dissimilarity in DBT reconstructed volume,” IEEE International Conference on Image
Processing (accepted), 2015.
2. Seong Tae Kim, Dae Hoe Kim, Dong Jin Ji, and Yong Man Ro, “Region matching based on local
structure information in ipsilateral digital breast tomosynthesis views,” IEEE International Conference
on Image Processing (accepted), 2015.
3. Seong Tae Kim, Dae Hoe Kim, and Yong Man Ro, “Combination of conspicuity improved synthetic
mammograms and digital breast tomosynthesis: A promising approach for mass detection,” SPIE Medical Imaging, 2015
4. Dae Hoe Kim, Seong Tae Kim, and Yong Man Ro, “Feature extraction from inter-view similarity of
DBT projection views,” SPIE Medical Imaging, 2015
5. Wissam J. Baddar, Eun Joon Kim, Dae Hoe Kim and Yong Man Ro, “Utilizing digital breast
tomosynthesis projection views correlation for microcalcification enhancement for detection
purposes,” SPIE Medical Imaging, 2015
6. Seong Tae Kim, Dae Hoe Kim, and Yong Man Ro, “Breast mass detection using slice conspicuity in
3D reconstructed digital breast volumes,” Physics in Medicine and Biology, vol. 59, pp. 5003-5023,
2014.
7. Dae Hoe Kim, Jae Young Choi, Yong Man Ro, “Region based stellate features combined with variable
selection using AdaBoost learning in mammographic computer-aided detection,” Computers in Biology and Medicine (in press), Available online 27 September 2014.
8. Jae Young Choi, Dae Hoe Kim, Konstantinos N. Plataniotis, and Young Man Ro, “Computer-aided
detection (CAD) of breast masses in mammography: Combined detection and ensemble
classification,” Physics in Medicine and Biology, vol. 59, pp. 3697-3719, Jun 2014.
27/31
10. Seong Tae Kim, Dae Hoe Kim, and Yong Man Ro, “Generation of conspicuity-improved synthetic
image from digital breast tomosynthesis,” International Conference on Digital Signal Processing, 2014
11. Seong Tae Kim, Dae Hoe Kim, Eun Suk Cha, and Yong Man Ro, “Mass detection based on pooled
mass probability map of 3D reconstructed slices in digital breast tomosynthesis,” IEEE-EMBS BHI,
2014
12. Eun Joon Kim, Dae Hoe Kim, Eun Suk Cha, and Yong Man Ro, “Improvement of subtle
microcalcifications detection in DBT slices,” IEEE-EMBS BHI, 2014
13. Wissam J. Baddar, Dae Hoe Kim, and Yong Man Ro, “Breast tissue removal for enhancing
microcalcification cluster detection in mammograms,” IEEE-EMBS BHI, 2014
14. Dae Hoe Kim, Seung Hyun Lee, and Yong Man Ro, “Mass type-specific sparse representation for
mass classification in computer-aided detection on mammography,” Biomedical Engineering Online, 12(Suppl 1):S3, 2013.
15. Seung Hyun Lee, Dae Hoe Kim, and Yong Man Ro, “Mass type-specific sparse representation for
mass classification in computer-aided detection on mammograms,” IEEE EMBC Workshop, 2013
16. Seung Hyun Lee, Dae Hoe Kim, Jae Young Choi, and Yong Man Ro, “Improving positive predictive
value in Computer-aided Diagnosis using mammographic mass and microcalcification confidence
score fusion based on co-location information,” SPIE Medical Imaging, 2013
17. Dae Hoe Kim, Jae Young Choi, and Yong Man Ro, “Boosting framework for mammographic mass
classification with combination of CC and MLO view information,” SPIE Medical Imaging, 2013
18. Jae Young Choi, and Yong Man Ro, “Multiresolution local binary pattern texture analysis combined
with variable selection for application to false positive reduction in computer-aided detection of breast
masses on mammograms,” Physics in Medicine and Biology, vol 57, no. 2, pp. 7029-7052, Oct. 2012.
28/31

20. Seung Hyun Lee, Dae Hoe Kim, Won Yong Eom, and Yong Man Ro, “Investigating the sparse
representation of breast mass features in digital mammography,” IFMIA, 2012
21. Wonyong Eom, Wesley De Neve, and Yong Man Ro, “Sparse feature analysis for detection of clustered
microcalcifications in mammogram images,” IFMIA, 2012
22. Dae Hoe Kim, Jae Young Choi, and Yong Man Ro, “Region Based Stellate Features for Classification
of Mammographic Spiculated Lesions in Computer-Aided Detection,” IEEE ICIP, 2012
23. Dae Hoe Kim, Jae Young Choi, and Yong Man Ro, “A Novel Mammographic Mass Detection
Approach to Combining Supervised and Unsupervised Detection Algorithms,” IEEE ICIP, 2012
24. Jae Young Choi, Dae Hoe Kim, Konstantinos N. Plataniotis, and Yong Man Ro, “Combining Multiple
Feature Representations and AdaBo.ost Ensemble Learning for Reducing False-positive Detections in
Computer-Aided Detection of Masses on Mammograms,” IEEE EMBC, 2012
25. Jae Young Choi, Dae Hoe Kim, Seon Hyeong Choi, and Yong Man Ro, “Multiresolution Local Binary
Pattern Texture Analysis for False Positive Reduction in Computerized Detection of Breast Masses on
Mammograms,” SPIE Medical Imaging, 2012
26. Dae Hoe Kim, Jae Young Choi, Seon Hyeong Choi, Yong Man Ro, “Mammographic Enhancement
with Combining Local Statistical Measures and Sliding Band Filter for Improved Mass Segmentation
in Mammograms,” SPIE Medical Imaging, 2012
27. Jae Young Choi, Dae Hoe Kim, and Yong Man Ro, “Combining Multiresolution Local Binary Pattern
Texture Analysis and Variable Selection Strategy Applied to Computer-Aided Detection of Breast
Masses on Mammograms,” IEEE-EMBS BHI, 2012
28. Jae Young Choi, Dae Hoe Kim, Yong Man Ro, “Computer-Aided Detection of Breast Masses on
Mammograms Using Region-Based Feature Analysis,” MITA, 2011
29. Sunil Cho, Sung Ho Jin, Yong Man Ro, Sung Min Kim, “Microcalcification Detection System in
Digital Mammogram using Two-Layer SVM,” SPIE Medical Imaging, 2008
29/31
30. Ju Won Kwon, Yong Man Ro, Sung Min Kin, “Improvement of SVM based Microcalcification
Detection,” Asian Forum on Medical Imaging, 2007
31. Hokyung Kang, Yong Man Ro, Sung Min Kim, “A microcalcification detection using adaptive contrast
enhancement on wavelet transform and neural network,” IEICE Trans. on Information & Systems,Vol.E89-D, pp.1280-1287 March, 2006
32. Ju Won Kwon, Hokyoung Kang, Yong Man Ro, Sung Min Kim, “A Microcalcification Detection Using
Multi-Layer Support Vector Machine in Korean Digital Mammogram” World Congress on Medical Physics and Biomedical Engineering (WC 2006)
33. Ho-Kyung Kang, Nguyen N. Thanh, Sung-Min Kim, and Yong Man Ro, “Robust contrast
enhancement for microcalcification in mammography,” LNCS 3045, pp. 602-610, July 2004
34. Ho-Kyung Kang, Sung-Min Kim, Nguyen N. Thanh,Yong Man Ro, and Won-Ha Kim, “Adaptive
microcalcification detection in computer aided diagnosis,” LNCS 3039, pp. 1110-1117, June 2004
35. Jeong Hyun Yoon, Yong Man Ro, “Enhancement of the contrast in mammographic imges using the
homomorphic filter method,” IEICE Trans. on Information & Systems,Vol.E85-D, pp.298-333, January
2002
36. Jeong Hyun Yoon, Yong Man Ro, “Contrast Enhancement of Mammography Image using
Homomorphic Filter in Wavelet Domain,” International Workshop on Digital Mammography (IWDM), 2000
30/31