computer-assisted reading and discovery for student-generated
TRANSCRIPT

(2015). Computer‐Assisted Reading and Discovery for Student‐Generated Text in Massive Open Online Courses. Journal of Learning Analytics,
2(1), 156–184.
ISSN 1929‐7750 (online). The Journal of Learning Analytics works under a Creative Commons License, Attribution ‐ NonCommercial‐NoDerivs 3.0 Unported (CC BY‐NC‐ND 3.0) 156
Computer-Assisted Reading and Discovery for Student-Generated
Text in Massive Open Online Courses
Justin Reich, Dustin Tingley, Jetson Leder‐Luis, Margaret E. Roberts, Brandon M. Stewart
Harvard University, USA
ABSTRACT: Dealing with the vast quantities of text that students generate in Massive Open
Online Courses (MOOCs) and other large‐scale online learning environments is a daunting
challenge. Computational tools are needed to help instructional teams uncover themes and
patterns as students write in forums, assignments, and surveys. This paper introduces to the
learning analytics community the Structural Topic Model, an approach to language processing
that can 1) find syntactic patterns with semantic meaning in unstructured text, 2) identify
variation in those patterns across covariates, and 3) uncover archetypal texts that exemplify the
documents within a topical pattern. We show examples of computationally aided discovery and
reading in three MOOC settings: mapping students’ self‐reported motivations, identifying themes
in discussion forums, and uncovering patterns of feedback in course evaluations.
KEYWORDS: Massive Open Online Courses, topic modelling, text analysis, computer‐assisted
reading
1 OVERVIEW
Educators are constantly asking their students to write. They articulate needs and motivations in pre‐
course surveys, communicate and collaborate in forums, demonstrate their understanding in
assignments, and offer feedback about instructional approaches in course evaluations. In classes with
low student–instructor ratios, instructional teams of faculty and teaching assistants can read, process,
and provide feedback on the entire corpus of text produced by students. In large‐scale learning
environments, such as Massive Open Online Courses (MOOCs), there is far too much for instructors to
read and process in a timely fashion. Consider two sources of student text: surveys and discussion
forums. In the first year of operation, hundreds of thousands of students signed up for HarvardX courses
on the edX platform, and they submitted over 240,000 answers to the open‐response survey question:
“Please share your reasons for signing up for edX.” In the inaugural MITx class, the discussion forums
included over 12,000 threads and nearly 100,000 individual posts (Breslow, Pritchard, DeBoer, Stump, &
Ho, 2013). These corpora represent two troves of important data. Understanding what motivates
students to sign up for courses can help course developers tailor instruction to their students. Discussion
forums are central sites for advancing student learning in many MOOCs, especially in the professions
(Fisher, 2014; Reich et al., 2014a) and humanities (Reich et al., 2014b), but these spaces can rapidly
become overwhelming to follow or analyze, especially for faculty discovering the arduous demands of
teaching a MOOC (Grainger, 2013; Kolowich, 2014).
(2015). Computer‐Assisted Reading and Discovery for Student‐Generated Text in Massive Open Online Courses. Journal of Learning Analytics,
2(1), 156–184.
ISSN 1929‐7750 (online). The Journal of Learning Analytics works under a Creative Commons License, Attribution ‐ NonCommercial‐NoDerivs 3.0 Unported (CC BY‐NC‐ND 3.0) 157
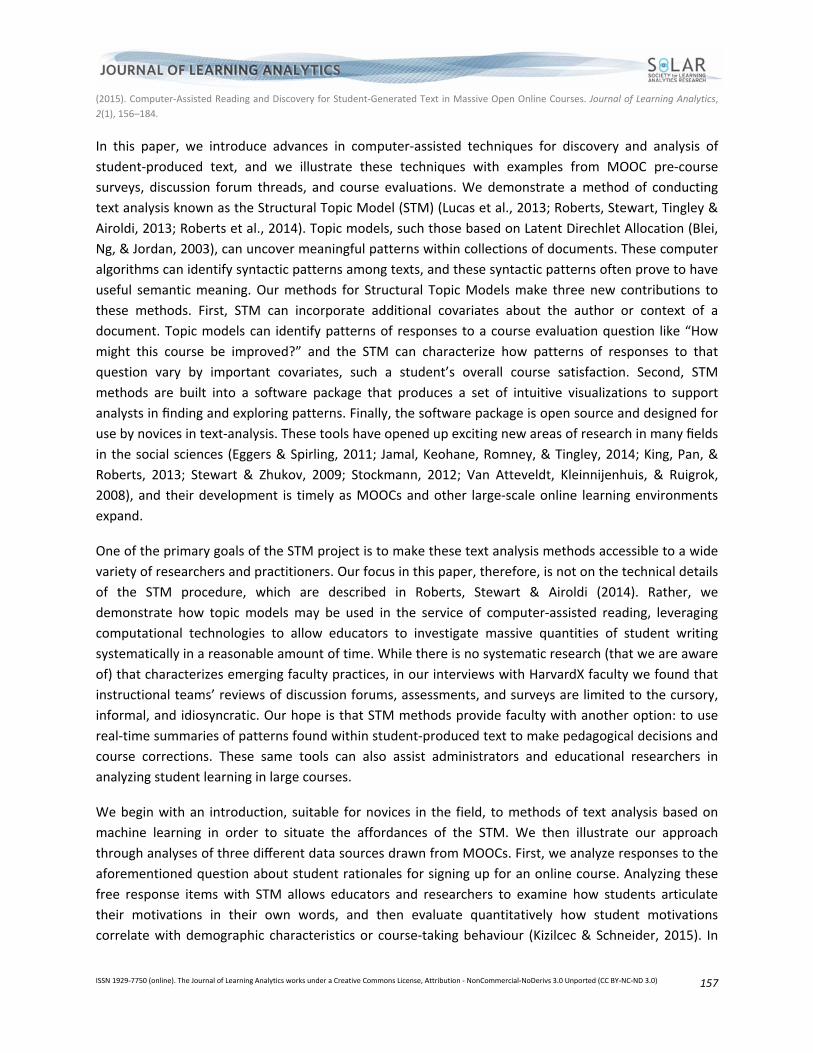
In this paper, we introduce advances in computer‐assisted techniques for discovery and analysis of
student‐produced text, and we illustrate these techniques with examples from MOOC pre‐course
surveys, discussion forum threads, and course evaluations. We demonstrate a method of conducting
text analysis known as the Structural Topic Model (STM) (Lucas et al., 2013; Roberts, Stewart, Tingley &
Airoldi, 2013; Roberts et al., 2014). Topic models, such those based on Latent Direchlet Allocation (Blei,
Ng, & Jordan, 2003), can uncover meaningful patterns within collections of documents. These computer
algorithms can identify syntactic patterns among texts, and these syntactic patterns often prove to have
useful semantic meaning. Our methods for Structural Topic Models make three new contributions to
these methods. First, STM can incorporate additional covariates about the author or context of a
document. Topic models can identify patterns of responses to a course evaluation question like “How
might this course be improved?” and the STM can characterize how patterns of responses to that
question vary by important covariates, such a student’s overall course satisfaction. Second, STM
methods are built into a software package that produces a set of intuitive visualizations to support
analysts in finding and exploring patterns. Finally, the software package is open source and designed for
use by novices in text‐analysis. These tools have opened up exciting new areas of research in many fields
in the social sciences (Eggers & Spirling, 2011; Jamal, Keohane, Romney, & Tingley, 2014; King, Pan, &
Roberts, 2013; Stewart & Zhukov, 2009; Stockmann, 2012; Van Atteveldt, Kleinnijenhuis, & Ruigrok,
2008), and their development is timely as MOOCs and other large‐scale online learning environments
expand.
One of the primary goals of the STM project is to make these text analysis methods accessible to a wide
variety of researchers and practitioners. Our focus in this paper, therefore, is not on the technical details
of the STM procedure, which are described in Roberts, Stewart & Airoldi (2014). Rather, we
demonstrate how topic models may be used in the service of computer‐assisted reading, leveraging
computational technologies to allow educators to investigate massive quantities of student writing
systematically in a reasonable amount of time. While there is no systematic research (that we are aware
of) that characterizes emerging faculty practices, in our interviews with HarvardX faculty we found that
instructional teams’ reviews of discussion forums, assessments, and surveys are limited to the cursory,
informal, and idiosyncratic. Our hope is that STM methods provide faculty with another option: to use
real‐time summaries of patterns found within student‐produced text to make pedagogical decisions and
course corrections. These same tools can also assist administrators and educational researchers in
analyzing student learning in large courses.
We begin with an introduction, suitable for novices in the field, to methods of text analysis based on
machine learning in order to situate the affordances of the STM. We then illustrate our approach
through analyses of three different data sources drawn from MOOCs. First, we analyze responses to the
aforementioned question about student rationales for signing up for an online course. Analyzing these
free response items with STM allows educators and researchers to examine how students articulate
their motivations in their own words, and then evaluate quantitatively how student motivations
correlate with demographic characteristics or course‐taking behaviour (Kizilcec & Schneider, 2015). In

(2015). Computer‐Assisted Reading and Discovery for Student‐Generated Text in Massive Open Online Courses. Journal of Learning Analytics,
2(1), 156–184.
ISSN 1929‐7750 (online). The Journal of Learning Analytics works under a Creative Commons License, Attribution ‐ NonCommercial‐NoDerivs 3.0 Unported (CC BY‐NC‐ND 3.0) 158
this first example, we provide a detailed walkthrough of the workflow for using the STM package and
analyzing the resulting output.
Next, we examine a second case study: the discussion forums in a humanities course from HarvardX,
ChinaX Part 1.1 In many courses, especially in the humanities where large‐scale, valid, reliable
assessment methods are considered lacking (Ho et al., 2014), discussion forums are considered essential
sites of student learning central to the objectives of the course (Reich et al., 2014a; Reich et al., 2014c).
Recent research in evaluating text in these forums points to drawing small analytic samples for human
coding (Stump, DeBoer, Whittinghill, & Breslow, 2013) or using supervised learning methods to classify
threads into topics (Brinton et al., 2013). We demonstrate the application of the Structural Topic Model
to help instructional teams understand the range and distribution of themes in student posts, and we
show how the distribution of these topics varies by important features of each document’s context, such
as whether or not it was “up‐voted” by a peer. As a third case study, we analyze course evaluation
responses from the same ChinaX course, where students were asked to write about strengths and
weaknesses of the course. We demonstrate using the STM to reveal how themes in open‐ended
feedback can vary by other student characteristics, such as overall student satisfaction. Since these
methods extend beyond MOOCs to other large‐scale learning environments, we conclude with
suggestions for additional applications of computer‐assisted reading in other contexts.
2 INTRODUCTION TO TEXT ANALYSIS
The analysis of text by hand is standard practice in the social sciences, where researchers read and
hand‐code documents and then analyze the results. The variety of benefits to computer‐assisted text
analysis over hand coding include the natural improvements in speed, the ability to process high
volumes of text, and the consistency of treatment of all parts of the corpus (Grimmer & King, 2011;
Hillard, Purpura, & Wilkerson, 2008; Lowe & Benoit, 2013). Humans often struggle with the
development of complicated coding schemes (Quinn, Monroe, Colaresi, Crespin, & Radev, 2010), and
there is some experimental evidence to suggest that humans judge clusters produced by automated
methods to be more semantically coherent than even an taxonomy created by the documents’ authors
(Grimmer & King, 2011; Grimmer & Stewart, 2013). The large amount of text produced in online
educational environments motivates using computation to identify patterns in student‐generated text.
These patterns can then be presented to educators, researchers, and even students for more in‐depth
analysis. In this sense, the tools we discuss can be thought of as aides for “computer‐assisted reading.”
Automated text analysis is a form of machine learning and comes in two flavors: unsupervised and
supervised. In supervised learning, the user manually labels some subset of the data, which guides the
computational analysis to derive parameters for classifying the remainder of the data. Humans code a
subset of documents, and computers then predict how humans would have coded the rest of the full set
1 https://www.edx.org/course/harvardx/harvardx‐sw12x‐china‐920

(2015). Computer‐Assisted Reading and Discovery for Student‐Generated Text in Massive Open Online Courses. Journal of Learning Analytics,
2(1), 156–184.
ISSN 1929‐7750 (online). The Journal of Learning Analytics works under a Creative Commons License, Attribution ‐ NonCommercial‐NoDerivs 3.0 Unported (CC BY‐NC‐ND 3.0) 159
of documents. In unsupervised learning, there is no user input besides the raw data, from which
parameters of interest are derived. Computers find patterns in documents based on syntactic features
(like the co‐occurrence of certain words in the document), and humans then examine the substantive
meaning of those patterns. Note that in either case, algorithms need no semantic understanding; the
computer does not need to be able to understand what humans are communicating or to associate
meaning with any of the words. Instead, the content and structure of corpora are sufficient to surface
syntactic variations and patterns that often prove to have semantically meaningful correlates. In other
words, computers can treat words as strings of arbitrary letters and find patterns in how those arbitrary
strings co‐occur in documents. Humans can later look at those (syntactically derived) patterns and find
that they are useful and (semantically) meaningful. In our analysis, we focus on a class of unsupervised
analysis called topic modelling.
2.1 Unsupervised Topic Modelling
Topic modelling is a particular unsupervised method that provides an approach for estimating general
semantic themes within a corpus of documents (Blei, 2012). Crucially, we need not specify these themes
in advance or manually annotate the input documents; the only analytic preparation required is
inputting the raw textual data into a software package. Topic models use the patterns of word co‐
occurrences to infer semantic relationships. Loosely speaking, if two words frequently co‐occur across
many of the documents, we infer that they reference a similar concept or theme. The topics themselves
are distributions over words. For example, consider an assignment where students write a paragraph
about what they do in a typical day. One topic might be about learning, and give high probability to
words such as “learning,” “homework,” “class,” but low probability to words such as “cooking” or
“eating.” Each document exhibits a mixture over the topics, which encode the proportion of words
within the document that the software estimates to have come from each topic. The semantic themes
uncovered by the model provide a useful structure for summarizing large sets of documents. These
methods complement human reading by organizing the unstructured corpus. Topic models have been
widely applied throughout the social sciences and digital humanities (see Blei, 2012, and references
therein).
Our focus here differs both in method and purpose with many existing applications of unsupervised
learning in educational research (see Romero & Ventura, 2007). Previous work has focused on
applications towards clustering students into different learning types using their attributes, grades, and
system‐use statistics. When unsupervised quantitative techniques have been applied in educational
contexts to text, the focus of this work has primarily been extracting data about the generation of text,
engagement statistics, rather than analyzing properties of the text itself (Anaya & Boticario, 2011;
Dringus & Ellis, 2005). Some new work in this field has moved towards models that include text features
along with engagement statistics; for instance, in the MOOC context, Yang, Wen, Kumar, Xing, and Rosé
(2014) use a topic model analysis of discussion forums and social network features to predict student
attrition among distinct student sub‐communities. We build on this this line of work with accessible

(2015). Computer‐Assisted Reading and Discovery for Student‐Generated Text in Massive Open Online Courses. Journal of Learning Analytics,
2(1), 156–184.
ISSN 1929‐7750 (online). The Journal of Learning Analytics works under a Creative Commons License, Attribution ‐ NonCommercial‐NoDerivs 3.0 Unported (CC BY‐NC‐ND 3.0) 160
software and methods that facilitate the substantive interpretation of topics and themes within a corpus
of student writing.
2.1.1 Comparisons to Supervised Methods
One way to understand the uses, affordances, and limitations of unsupervised topic models is to
compare them to supervised methods of text analysis. Whereas unsupervised methods uncover the
most prevalent and overarching themes of the text, supervised methods can uncover 1) a category
scheme dictated in advance or 2) a particular facet of the text defined in advance, such as whether the
text has an introduction and conclusion or whether it should be held for review. The most common form
of supervised learning is classification. In this setting, the researcher carefully reads a random sample of
documents from the corpus and assigns each one to a category according to a pre‐specified coding
scheme. Supervised learning algorithms learn from this “training set” about how to classify the
documents. They can then be used to categorize the larger set of unread documents in the corpus. Thus,
the algorithm is taught how to classify through the examples in the training set, and it then extends the
process to more documents than the analyst would be able to read alone. Pros and cons of these
approaches have been thoughtfully enumerated in other fields of the social sciences (Bishop, 2006;
Hastie, Tibshirani, & Friedman 2009; Murphy, 2012; Grimmer & Stewart, 2013).
One of the most well‐known examples of supervised learning methods in education is automated essay
scoring, which works by classifying documents along a rubric of essay quality. Then a training set of
essays is scored and each essay assigned to a category by one or (ideally) multiple raters. Once these
essays are scored, the algorithm classifies the remaining set of essays, perhaps flagging anomalous
essays that do not appear to fit well in any category. The classifier’s effectiveness can be tested by
measuring the prediction accuracy within a second “testing set” of human‐graded essays. Evidence from
recent studies of automated essay score prediction suggests that the reliability between human graders
and machine learning‐based graders is similar to the reliability among human graders, at least in
contexts with highly structured writing assignments that may be graded quickly (Shermis & Hammer,
2012; Duwairi, 2006). In large‐scale online environments like MOOCs, it is infeasible for faculty to
evaluate the individual submissions from thousands of students, and therefore faculty who wish to
assign a grade to unstructured text assignments in MOOCs need to choose among self‐assessment,
peer‐assessment, and this kind of supervised machine learning evaluation. Even in circumstances where
faculty can use supervised learning methods to assign scores to individual essays, unsupervised learning
methods can uncover the themes in student writing.
Supervised algorithms are useful when researchers are interested in a particular organization of
documents. These algorithms require that categories be comprehensively enumerated. In the examples
that follow, we show three cases where we had no a priori expectations for categories of student
writing, and we were particularly interested in topics that we and other researchers might not have
considered.
(2015). Computer‐Assisted Reading and Discovery for Student‐Generated Text in Massive Open Online Courses. Journal of Learning Analytics,
2(1), 156–184.
ISSN 1929‐7750 (online). The Journal of Learning Analytics works under a Creative Commons License, Attribution ‐ NonCommercial‐NoDerivs 3.0 Unported (CC BY‐NC‐ND 3.0) 161
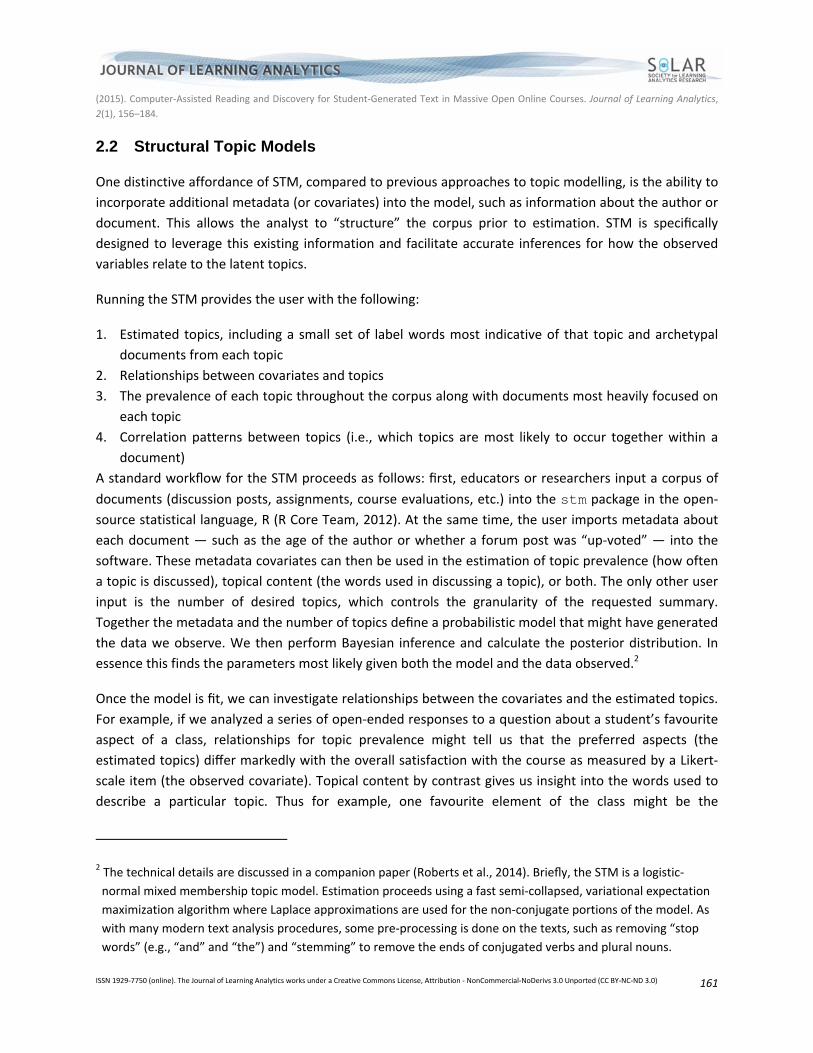
2.2 Structural Topic Models
One distinctive affordance of STM, compared to previous approaches to topic modelling, is the ability to
incorporate additional metadata (or covariates) into the model, such as information about the author or
document. This allows the analyst to “structure” the corpus prior to estimation. STM is specifically
designed to leverage this existing information and facilitate accurate inferences for how the observed
variables relate to the latent topics.
Running the STM provides the user with the following:
1. Estimated topics, including a small set of label words most indicative of that topic and archetypal
documents from each topic
2. Relationships between covariates and topics
3. The prevalence of each topic throughout the corpus along with documents most heavily focused on
each topic
4. Correlation patterns between topics (i.e., which topics are most likely to occur together within a
document)
A standard workflow for the STM proceeds as follows: first, educators or researchers input a corpus of
documents (discussion posts, assignments, course evaluations, etc.) into the stm package in the open‐source statistical language, R (R Core Team, 2012). At the same time, the user imports metadata about
each document — such as the age of the author or whether a forum post was “up‐voted” — into the
software. These metadata covariates can then be used in the estimation of topic prevalence (how often
a topic is discussed), topical content (the words used in discussing a topic), or both. The only other user
input is the number of desired topics, which controls the granularity of the requested summary.
Together the metadata and the number of topics define a probabilistic model that might have generated
the data we observe. We then perform Bayesian inference and calculate the posterior distribution. In
essence this finds the parameters most likely given both the model and the data observed.2
Once the model is fit, we can investigate relationships between the covariates and the estimated topics.
For example, if we analyzed a series of open‐ended responses to a question about a student’s favourite
aspect of a class, relationships for topic prevalence might tell us that the preferred aspects (the
estimated topics) differ markedly with the overall satisfaction with the course as measured by a Likert‐
scale item (the observed covariate). Topical content by contrast gives us insight into the words used to
describe a particular topic. Thus for example, one favourite element of the class might be the
2 The technical details are discussed in a companion paper (Roberts et al., 2014). Briefly, the STM is a logistic‐
normal mixed membership topic model. Estimation proceeds using a fast semi‐collapsed, variational expectation
maximization algorithm where Laplace approximations are used for the non‐conjugate portions of the model. As
with many modern text analysis procedures, some pre‐processing is done on the texts, such as removing “stop
words” (e.g., “and” and “the”) and “stemming” to remove the ends of conjugated verbs and plural nouns.

(2015). Computer‐Assisted Reading and Discovery for Student‐Generated Text in Massive Open Online Courses. Journal of Learning Analytics,
2(1), 156–184.
ISSN 1929‐7750 (online). The Journal of Learning Analytics works under a Creative Commons License, Attribution ‐ NonCommercial‐NoDerivs 3.0 Unported (CC BY‐NC‐ND 3.0) 162
professor’s lecture style (the estimated topic), but the words used to describe that style might differ by
gender (the observed covariate).
Using covariates in the STM differs from the predictive models discussed later, such as supervised
learning in that covariates might influence a topic, but the model does not force them to be connected.
This helps to alleviate concerns that relationships are “baked in” to a conclusion by incorporating
metadata. Rather covariates are best thought of as a way of defining subsets of the data (by age,
gender, location, etc.) that may have similar patterns of topic use. In a separate work we discuss the
details of the STM as well as provide simulation evidence showing its ability to uncover topic/covariate
relationships (Roberts et al., 2014).
STM offers several improvements over simply performing LDA and then regressing the results on
metadata of interest. First, the STM explicitly models topic correlation whereas LDA does not. Second,
the STM allows for topic vocabulary — not just topic prevalence — to vary by covariates. Third, Roberts
and colleagues (2014) have shown through simulations that LDA can miss important covariate
relationships in the data. Finally, by explicitly including the covariate relationships in the model, we are
able to include measurement uncertainty from the estimation of the latent topics into our regression
analyses. In theory, as the number of documents grows extremely large, LDA will correctly recover the
covariate relationships. In practice, there is evidence that even with extremely large document sets,
STM yields better results both in terms of predictive power and qualitative interpretability (Roberts et
al., 2014; Roberts, Stewart, & Airoldi, 2014.)
In what follows, we provide three case studies of the use of STM for computer‐assisted reading in
surveys, forums, and course evaluations. The three case studies have several features in common that
make them well suited for analysis with the STM. First, they all involve large corpora of texts that cannot
be read in a reasonable timeframe by educators, motivating the use of computation to organize the
texts. Second, they all involve domains where useful classifications of the text are not known a priori,
and we can use unsupervised learning models to uncover undiscovered patterns. Finally, the three
corpora have documents associated with useful metadata about the author or the document, and the
inclusion of these metadata in the STM can improve the estimation of the model and reveal how themes
in student writing vary across substantively interesting subgroups.
3 COMPUTER-ASSISTED READING OF QUALITATIVE PRE-COURSE SURVEY RESPONSES WITH THE STRUCTURAL TOPIC MODEL
We now illustrate the STM workflow and results by analyzing data about rationales for signing up for a
MOOC platform. One of the largest providers of MOOCs is edX, and when students register on the edX
site (a prerequisite for registering for any individual edX course) they are given a short survey including
the free‐response question: “Please share with us your reasons for registering with edX.” While other
MOOC platforms and specific courses ask students about their motivations using a variety of fixed

(2015). Computer‐Assisted Reading and Discovery for Student‐Generated Text in Massive Open Online Courses. Journal of Learning Analytics,
2(1), 156–184.
ISSN 1929‐7750 (online). The Journal of Learning Analytics works under a Creative Commons License, Attribution ‐ NonCommercial‐NoDerivs 3.0 Unported (CC BY‐NC‐ND 3.0) 163
response items (Breslow et al., 2013; Koller, Ng, Do, & Chen, 2013; Wang & Baker, 2014), this is, to our
knowledge, one of the largest data sets of unstructured text where students describe their motivations
for participating in online learning experiences in their own words. These data speak directly to
questions about student motivation that have come to the fore as open online learning opportunities
have grown dramatically (Computing Research Association, 2013). The STM allows researchers to
analyze how registrants describe their motivations in their own words.
3.1 Analytic Workflow with Structural Topic Models
In this and the following examples, we follow five analytical steps in using the Structural Topic Model.
First, we prepare the data by including the corpus of documents and relevant metadata/covariates into
the software package. Second, we run the software package and produce a standard set of results and
visualizations, including the list of topics in descending order of prevalence, the key words for each
topic, and highly associated “archetypal” documents for each topic. Human analysis then guides the
third step: we assign descriptive labels to each of the computer‐generated topics by evaluating key
words from each topic and archetypal documents within each topic. Fourth, we examine how topic
distributions vary according to covariates of interest, to understand how important subgroups differ in
their written responses. Finally, when appropriate, we propose a call to action based on the findings
from the STM, which might be a pedagogical intervention or an experimental study.
In this first example, we estimate a Structural Topic Model with twelve topics examining student
rationales for signing up for the edX MOOC platform.
We examine the universe of all responses from edX
users who by 4 August 2013 had registered for one of the first six HarvardX courses: Intro to Computer
Science, Justice, The Ancient Greek Hero, Health in Numbers, Human Health and Global Environmental
Change, and Copyright (Ho et al., 2014). This totals nearly a quarter million responses (240,208),
highlighting the need for computer‐assisted reading. In the model we include several covariates:
indicator variables for each course, the respondent’s education level, an indicator variable for whether
male, and a continuous age variable. After a small amount of automatic pre‐processing, estimation of
this model is done with a single line of code:
storage<-stm(docs,vocab,K=12, prevalence=~course+educlevel+male+s(age),data=meta)
Notice the simplicity of the code syntax; one design principle of the software package is that the level of
programming sophistication for conducting these analyses should be approximately equivalent to
running a regression model in a typical statistical package such as R, SAS, or SPSS. In this example, we
estimate 12 topics (K) and the prevalence of each topic is modelled as a function of the course a person
signed up for, their education level (treated as a factor variable), gender, and age (allowed to have a
non‐linear effect via a spline (s() function). The results are stored in an object we label “storage.” A
complete vignette describing all features of the stm package (Roberts, Stewart, & Tingley, 2014), and
how to use all of these features, is available at http://structuraltopicmodel.com.
(2015). Computer‐Assisted Reading and Discovery for Student‐Generated Text in Massive Open Online Courses. Journal of Learning Analytics,
2(1), 156–184.
ISSN 1929‐7750 (online). The Journal of Learning Analytics works under a Creative Commons License, Attribution ‐ NonCommercial‐NoDerivs 3.0 Unported (CC BY‐NC‐ND 3.0) 164
In parametric topic models such this one, it is necessary to set the number of topics. In the computer
science literature it is common to set the number of topics by maximizing the predictive power of the
model on a heldout sample (Wallach, Murray, Salakhutdinov, & Mimno, 2009). However, the most
predictive model may not always be the most qualitatively interpretable or substantively useful model
(Chang, Gerrish, Wang, Boyd‐Graber, & Blei, 2009). Instead we see the choice of the number of topics as
a decision to be made on substantive grounds that reflect the desired granularity of the summary of the
corpus (Grimmer and Stewart 2013). When analyzing corpora covering a very broad array of material,
higher numbers of topics may be more appropriate. We selected a K of 12 in this example, though we
also estimated this model with other values of K for comparison, and the topics of highest interest
appear in our alternate models. For those who want to use a data‐driven approach, the stm package
includes tools for calculating heldout likelihood as well as several other popular automated metrics
(Mimno, Wallach, Talley, Leenders, & McCallum, 2011).
3.2 Findings from STM Analysis of Student Motivation Registrations
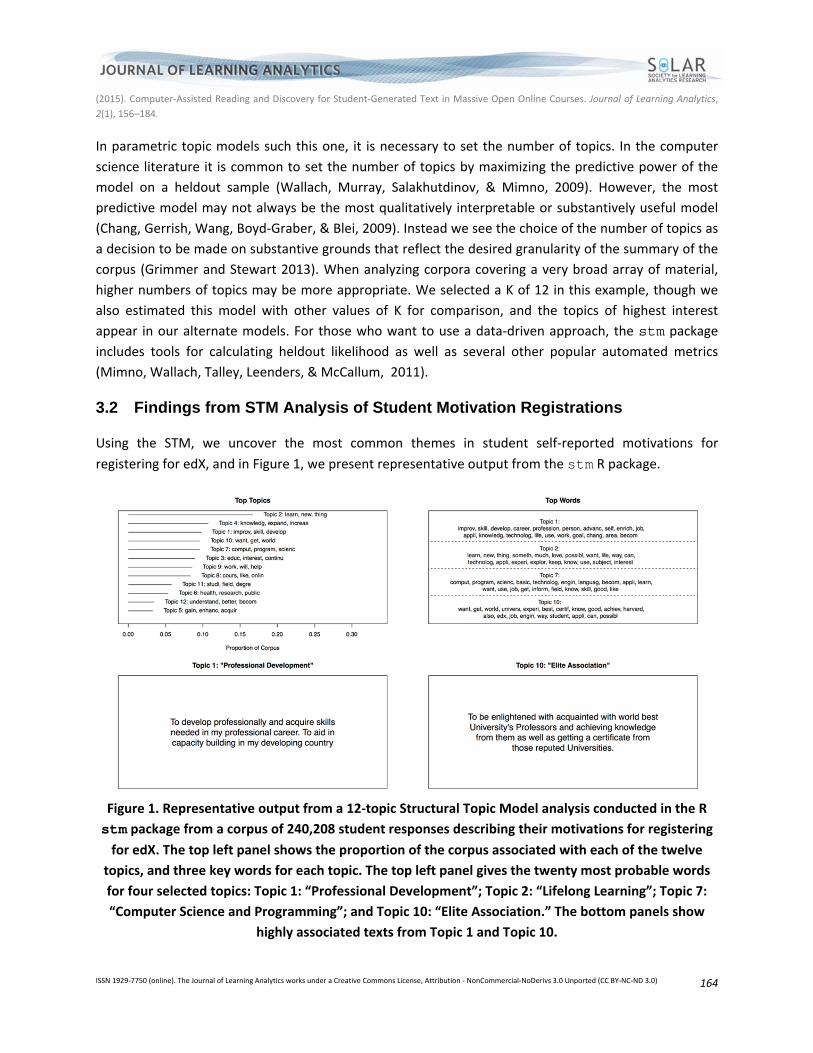
Using the STM, we uncover the most common themes in student self‐reported motivations for
registering for edX, and in Figure 1, we present representative output from the stm R package.
Figure 1. Representative output from a 12‐topic Structural Topic Model analysis conducted in the R
stm package from a corpus of 240,208 student responses describing their motivations for registering
for edX. The top left panel shows the proportion of the corpus associated with each of the twelve
topics, and three key words for each topic. The top left panel gives the twenty most probable words
for four selected topics: Topic 1: “Professional Development”; Topic 2: “Lifelong Learning”; Topic 7:
“Computer Science and Programming”; and Topic 10: “Elite Association.” The bottom panels show
highly associated texts from Topic 1 and Topic 10.
(2015). Computer‐Assisted Reading and Discovery for Student‐Generated Text in Massive Open Online Courses. Journal of Learning Analytics,
2(1), 156–184.
ISSN 1929‐7750 (online). The Journal of Learning Analytics works under a Creative Commons License, Attribution ‐ NonCommercial‐NoDerivs 3.0 Unported (CC BY‐NC‐ND 3.0) 165
We use two sources of data to parse the semantic meaning of these topics: 1) the word tokens mostly
highly associated with each topic and 2) exemplar texts. In the top left of Figure 1, we display the 20
word stems mostly highly associated with several sample topics in their order of prevalence within the
topic. In the top right panel, we show the distribution of all 12 topics across all documents. On the x‐
axis, we show the proportion of topic prevalence across all documents. For example, Topic 2 is the most
prevalent in the corpus; it concerns learning new things and lifelong learning. Topic 12, which includes
developing specific skills for job environments, is least prevalent. The system automatically produces the
topic number and the three word tokens that most distinctly represent the topic. In the bottom left and
right of Figure 1 we show for Topic 1 and Topic 10 the documents with the highest estimated proportion
of topic‐related words and constructs. Using these word frequency tables and exemplar texts, we then
attach semantically meaningful descriptive labels for several topics: Topic 1: “Professional
Development”; Topic 9: “Lifelong Learning”; Topic 7: “Computer Science and Programming”; and Topic
10: “Elite Association.” The appendix provides a complete depiction of all topics (in Figure 11).
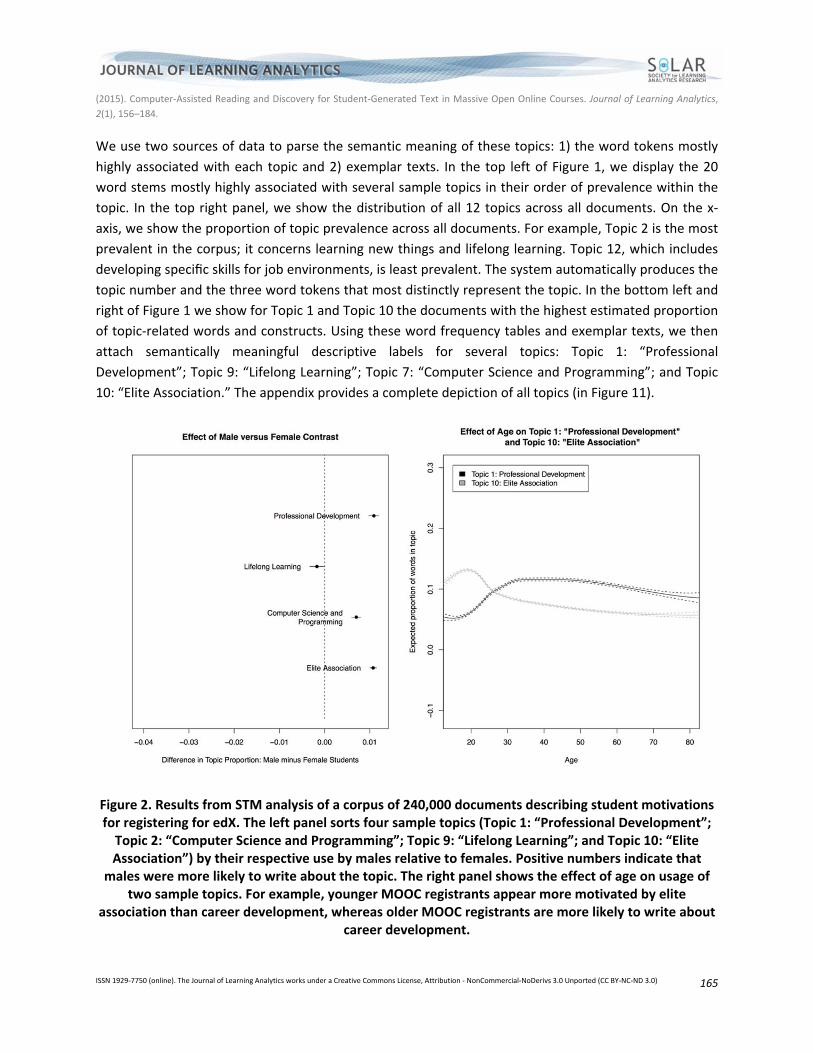
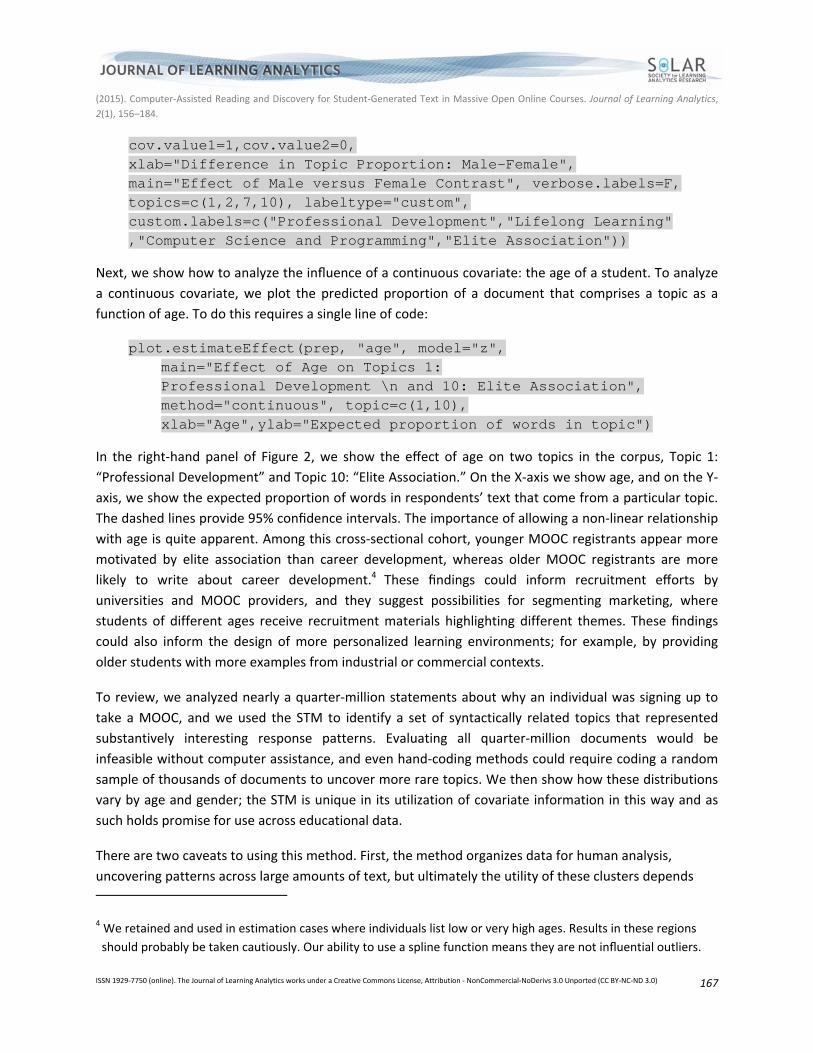
Figure 2. Results from STM analysis of a corpus of 240,000 documents describing student motivations for registering for edX. The left panel sorts four sample topics (Topic 1: “Professional Development”; Topic 2: “Computer Science and Programming”; Topic 9: “Lifelong Learning”; and Topic 10: “Elite Association”) by their respective use by males relative to females. Positive numbers indicate that
males were more likely to write about the topic. The right panel shows the effect of age on usage of two sample topics. For example, younger MOOC registrants appear more motivated by elite
association than career development, whereas older MOOC registrants are more likely to write about career development.
(2015). Computer‐Assisted Reading and Discovery for Student‐Generated Text in Massive Open Online Courses. Journal of Learning Analytics,
2(1), 156–184.
ISSN 1929‐7750 (online). The Journal of Learning Analytics works under a Creative Commons License, Attribution ‐ NonCommercial‐NoDerivs 3.0 Unported (CC BY‐NC‐ND 3.0) 166
The topic model reveals both predictable and surprising student motivations. Topic 1, for instance,
uncovers students who describe their motivations as instrumental and professional in nature; they
register for MOOCs to advance their careers. Given the practical nature of several of the early HarvardX
courses, like Health in Numbers (biostatistics and epidemiology) and Computer Science, this topic is to
be expected. Topic 10 shows the importance of associating with a leading university. This is one of the
most commonly expressed reasons for wanting to sign up for a MOOC, and echoes the edX marketing
language that the platform offers “the best courses, from the best professors, from the best
universities.” This suggests that this element of elite branding is front‐of‐mind for many participants
when signing up for edX. While in retrospect the importance of this topic makes sense, this dimension of
elite affinity does not always appear in other surveys of student motivations in the MOOC literature. The
topic model here uncovers an important dimension of student motivation that is presently under‐
researched. These findings informed the design of the 2013–2014 HarvardX and MITx pre‐course
surveys, which now ask students about the importance of career advancement and elite affiliation in
their registration decisions.
After examining the topics themselves, we go on to examine how these motivations differ across
substantively interesting sub‐populations, which we can do with both dichotomous and continuous
measures. In Figure 2, we show how the prevalence of topics differs by gender and age. In the left panel,
we plot the difference in the expected proportion of words within the topic for men minus the expected
proportion of words within the topic for women. When calculating effect, the values of all other
variables are set at their sample median values.3 The lines give 95% confidence intervals on the
difference including measurement uncertainty. Positive numbers indicate that males were more likely to
write about the topic. For instance, Topic 10 describes the desire to acquire computer science
knowledge, and it was the topic most heavily correlated with the respondent being male. We would
predict that documents produced by men would have more words and constructs related to computer
science than documents produced by women; on average, the proportion of words in a document from
this topic will be .006 more for men. While small, given our large sample size, this is statistically
significant. Computer science MOOCs disproportionately enrol men — the student body of the fall 2012
HarvardX Introduction to Computer Science course was 79% men — and this unsurprising result gives us
greater confidence in the performance of the model. The left‐hand plots can be produced with two lines
of code, the first to calculate the necessary quantities, and the second to produce a plot:
prep <-estimateEffect(c(1,2,7,10) ~ course+educlevel+male+s(age), storage, meta=meta)
plot.estimateEffect(prep, "male", model="z", method="difference",
3 We note that the STM model supports a broad array of specifications, including interactions between variables
and allowing for non‐linear effects through the use of splines. Here we do not include interactions but we do
allow the effect of age to be non‐linear.
(2015). Computer‐Assisted Reading and Discovery for Student‐Generated Text in Massive Open Online Courses. Journal of Learning Analytics,
2(1), 156–184.
ISSN 1929‐7750 (online). The Journal of Learning Analytics works under a Creative Commons License, Attribution ‐ NonCommercial‐NoDerivs 3.0 Unported (CC BY‐NC‐ND 3.0) 167
cov.value1=1,cov.value2=0, xlab="Difference in Topic Proportion: Male-Female", main="Effect of Male versus Female Contrast", verbose.labels=F, topics=c(1,2,7,10), labeltype="custom", custom.labels=c("Professional Development","Lifelong Learning" ,"Computer Science and Programming","Elite Association"))
Next, we show how to analyze the influence of a continuous covariate: the age of a student. To analyze
a continuous covariate, we plot the predicted proportion of a document that comprises a topic as a
function of age. To do this requires a single line of code:
plot.estimateEffect(prep, "age", model="z", main="Effect of Age on Topics 1: Professional Development \n and 10: Elite Association", method="continuous", topic=c(1,10), xlab="Age",ylab="Expected proportion of words in topic")
In the right‐hand panel of Figure 2, we show the effect of age on two topics in the corpus, Topic 1:
“Professional Development” and Topic 10: “Elite Association.” On the X‐axis we show age, and on the Y‐
axis, we show the expected proportion of words in respondents’ text that come from a particular topic.
The dashed lines provide 95% confidence intervals. The importance of allowing a non‐linear relationship
with age is quite apparent. Among this cross‐sectional cohort, younger MOOC registrants appear more
motivated by elite association than career development, whereas older MOOC registrants are more
likely to write about career development.4
These findings could inform recruitment efforts by
universities and MOOC providers, and they suggest possibilities for segmenting marketing, where
students of different ages receive recruitment materials highlighting different themes. These findings
could also inform the design of more personalized learning environments; for example, by providing
older students with more examples from industrial or commercial contexts.
To review, we analyzed nearly a quarter‐million statements about why an individual was signing up to
take a MOOC, and we used the STM to identify a set of syntactically related topics that represented
substantively interesting response patterns. Evaluating all quarter‐million documents would be
infeasible without computer assistance, and even hand‐coding methods could require coding a random
sample of thousands of documents to uncover more rare topics. We then show how these distributions
vary by age and gender; the STM is unique in its utilization of covariate information in this way and as
such holds promise for use across educational data.
There are two caveats to using this method. First, the method organizes data for human analysis,
uncovering patterns across large amounts of text, but ultimately the utility of these clusters depends
4 We retained and used in estimation cases where individuals list low or very high ages. Results in these regions
should probably be taken cautiously. Our ability to use a spline function means they are not influential outliers.
(2015). Computer‐Assisted Reading and Discovery for Student‐Generated Text in Massive Open Online Courses. Journal of Learning Analytics,
2(1), 156–184.
ISSN 1929‐7750 (online). The Journal of Learning Analytics works under a Creative Commons License, Attribution ‐ NonCommercial‐NoDerivs 3.0 Unported (CC BY‐NC‐ND 3.0) 168
upon thoughtful and necessarily subjective assignment of meaning to these clusters. Second,
unsupervised topic modelling can uncover clusters of interest, but it cannot assign documents to a pre‐
defined taxonomy or assess how the distribution of documents fits into an ideal distribution. Supervised
methods are more appropriate for these purposes.
4 ADDITIONAL EXAMPLES OF STRUCTURAL TOPIC MODELLING IN MASSIVE OPEN ONLINE COURSES
In this section, we examine the application of the STM to student discussion forums posts and course
evaluations. Both examples come from a HarvardX course, ChinaX,5 conducted on the edX platform in
the fall of 2013. When finished, ChinaX will span nearly 15 months of course content offered in ten
parts, with separate final grades and certificates for each part. The course was taught by Professors
Peter Bol and William Kirby, and Part I explored the political and intellectual foundations of China. Part I
launched on 31 October 2013 and finished on 23 December 2013 with 33,479 students registering for
the course and over 2,000 students earning a certificate of completion. As with many online courses in
the humanities, contributions to the forums are required to earn a certificate. Students are also asked to
complete course evaluations and to provide open‐ended feedback that can help the instructional team
to make improvements in the course. We demonstrate how the STM helped the ChinaX instructional
team see the broad themes in discussion forums and survey feedback and begin to use that feedback to
iteratively improve subsequent sections of the course.
In each example, we continue to provide graphs of various key quantities from the STM model. To
review: topic words give information about the top words used in each topic, listed in order of their
weight in that topic, to understand the general language of a topic. Highly associated texts are specific
examples of documents characteristic of a particular topic. In combination with the top words in each
topic, they allow researchers to understand specific instances of topic usage, supplementing the overall
analysis with example documents. Covariate relationships describe the relationship between topic usage
and covariates values. Topic prevalence gives the relative usage of the topic across the corpus. This
allows the user to find the overall themes of the corpus with relative weight of the different themes in
the discussion. All analysis is done using the free, open‐source R package stm that features a rich set of
functions requiring very minimal programming knowledge of the user, equivalent to an understand of
basic data entry and statistical testing in SPSS, SAS, or Stata.
4.1 Discussion Forums
Discussion forums in MOOCS provide an opportunity for students to develop and demonstrate their
understanding, to ask questions, and to interact with each other and with course teaching staff.
Literature on the use of forum‐based learning in online education indicates that online forums can be
5 https://www.edx.org/course/harvardx/harvardx‐sw12x‐china‐920

(2015). Computer‐Assisted Reading and Discovery for Student‐Generated Text in Massive Open Online Courses. Journal of Learning Analytics,
2(1), 156–184.
ISSN 1929‐7750 (online). The Journal of Learning Analytics works under a Creative Commons License, Attribution ‐ NonCommercial‐NoDerivs 3.0 Unported (CC BY‐NC‐ND 3.0) 169
important for their ability to facilitate debate, networking, and interaction with instructional staff (Mak,
Williams, & Mackness, 2010). Furthermore, online discussion forums can increase individual
participation and in the best instances promote a collaborative learning environment that allows for
high‐level critical thinking (Thomas, 2002). The best online discussion forums are facilitated by
instructional staff, but in MOOCs and other large‐scale learning environments, students can generate
text at a pace that far exceeds an instructional team’s capacity to read.
One solution to these problems has been the use of voting to promote comments of importance to the
attention of students and the instructor. By design, these comments promote a biased representation of
the course, where popular comments become more visible. These comments can present a skewed
version of the course to the instructors, often times drawing their attention to the writings of first
posters or most enthusiastic contributors rather than the writings of more typical students. In these
circumstances, the use of computer‐assisted reading can enable the teaching staff of a MOOC or other
online‐discussion‐intensive course to review the forums and gain an overall understanding of the
discussion topics and specific, representative points (Dringus & Ellis, 2005). The STM provides exactly
this functionality. The inclusion of covariates within a topic model allows data such as up‐votes to factor
into a model. The STM model allows the instructor to observe general trends in discussion topics, view
particular posts that capture the essence of the topics, and understand the correlation between topic
usage and votes within the forum. This lets the instructor observe what kinds of conversations are
provoked by the instructional content of a lesson or unit.
Figure 3. Results from an 8‐topic STM analysis of a corpus of discussion forum posts from ChinaX examining the Zhou and Shang dynasties in China. The left panel shows key words associated with the
eight topics, and the right panel shows the distribution of topics.

(2015). Computer‐Assisted Reading and Discovery for Student‐Generated Text in Massive Open Online Courses. Journal of Learning Analytics,
2(1), 156–184.
ISSN 1929‐7750 (online). The Journal of Learning Analytics works under a Creative Commons License, Attribution ‐ NonCommercial‐NoDerivs 3.0 Unported (CC BY‐NC‐ND 3.0) 170
In the following analysis, we explore text data from a pair of discussion threads, each with more than
1,600 posts, from Part I of ChinaX. The course explores multiple dimensions of ancient Chinese history
and culture, but the reader need not have a deep background in Chinese history to begin to understand
our analyses. The STM provides semantically coherent topics with example posts related to each topic,
which allows a non‐specialist to begin understand the discussion themes. In modelling these two
corpora of texts, we also include as a covariate whether or not each post was up‐voted. Figure 3 is the
general result of the STM modelling forum posts where students were asked to compare the Zhou and
Shang dynasties for governing style: “Although both Shang and Zhou are at the beginning of China’s
history, later dynasties would look to Zhou as the model of civilization, rather than Shang. What did
Zhou offer that Shang did not? What did Shang have that later people might have objected to?” As in
the previous example, in Figure 3, the top left panel presents the top words in each topic, while the top
right shows their respective prevalence throughout the corpus.
Figure 4. Example forum posts on Shang and Zhou for Topic 1: “Mandate of Heaven”; Topic 2: “Innovations in Statecraft”; Topic 5: “Populist Governance”; and Topic 8: “Religious Power.”
Appropriately, the most prevalent topics in the corpus have to do with issues of religious and popular
legitimacy. One of the main ideological innovations of the Zhou dynasty was the notion of the “Mandate
of Heaven”: that rulers maintain their position by the grace of the gods, and dishonorable rulers can
have their mandate revoked (as “occurred” when the Zhou violently overthrew the Shang). Virtuous
(2015). Computer‐Assisted Reading and Discovery for Student‐Generated Text in Massive Open Online Courses. Journal of Learning Analytics,
2(1), 156–184.
ISSN 1929‐7750 (online). The Journal of Learning Analytics works under a Creative Commons License, Attribution ‐ NonCommercial‐NoDerivs 3.0 Unported (CC BY‐NC‐ND 3.0) 171
rulers maintain the support of their people and earn the favour of the gods. These ideas are critical to
the art and writing of the Zhou period, and Topics 1, 6, 5, and 8 are clearly related to these key issues.
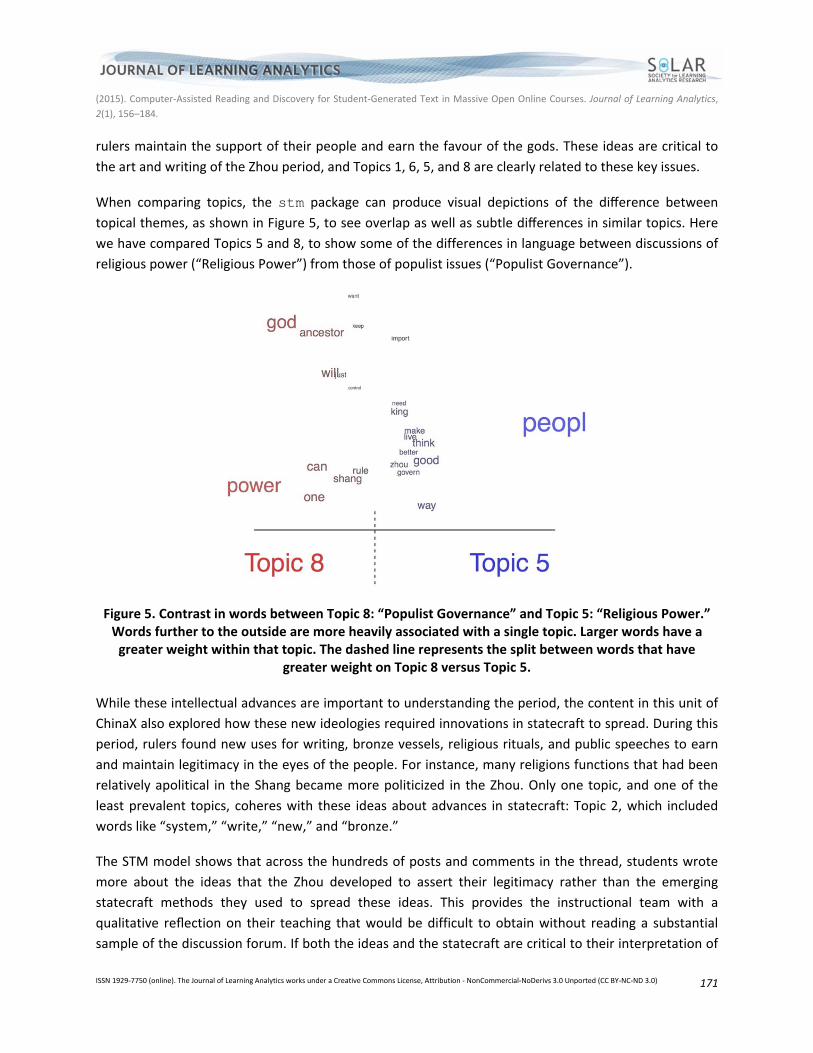
When comparing topics, the stm package can produce visual depictions of the difference between topical themes, as shown in Figure 5, to see overlap as well as subtle differences in similar topics. Here
we have compared Topics 5 and 8, to show some of the differences in language between discussions of
religious power (“Religious Power”) from those of populist issues (“Populist Governance”).
Figure 5. Contrast in words between Topic 8: “Populist Governance” and Topic 5: “Religious Power.” Words further to the outside are more heavily associated with a single topic. Larger words have a greater weight within that topic. The dashed line represents the split between words that have
greater weight on Topic 8 versus Topic 5.
While these intellectual advances are important to understanding the period, the content in this unit of
ChinaX also explored how these new ideologies required innovations in statecraft to spread. During this
period, rulers found new uses for writing, bronze vessels, religious rituals, and public speeches to earn
and maintain legitimacy in the eyes of the people. For instance, many religions functions that had been
relatively apolitical in the Shang became more politicized in the Zhou. Only one topic, and one of the
least prevalent topics, coheres with these ideas about advances in statecraft: Topic 2, which included
words like “system,” “write,” “new,” and “bronze.”
The STM model shows that across the hundreds of posts and comments in the thread, students wrote
more about the ideas that the Zhou developed to assert their legitimacy rather than the emerging
statecraft methods they used to spread these ideas. This provides the instructional team with a
qualitative reflection on their teaching that would be difficult to obtain without reading a substantial
sample of the discussion forum. If both the ideas and the statecraft are critical to their interpretation of
(2015). Computer‐Assisted Reading and Discovery for Student‐Generated Text in Massive Open Online Courses. Journal of Learning Analytics,
2(1), 156–184.
ISSN 1929‐7750 (online). The Journal of Learning Analytics works under a Creative Commons License, Attribution ‐ NonCommercial‐NoDerivs 3.0 Unported (CC BY‐NC‐ND 3.0) 172
this period of history, then these analyses suggest that in a revision of the course content, the
instructional team might consider revising the unit to place more emphasis on these ideas that students
wrote less about. In this MOOC context, the STM gives faculty rapid feedback on how students are
reacting and responding to instructional materials.
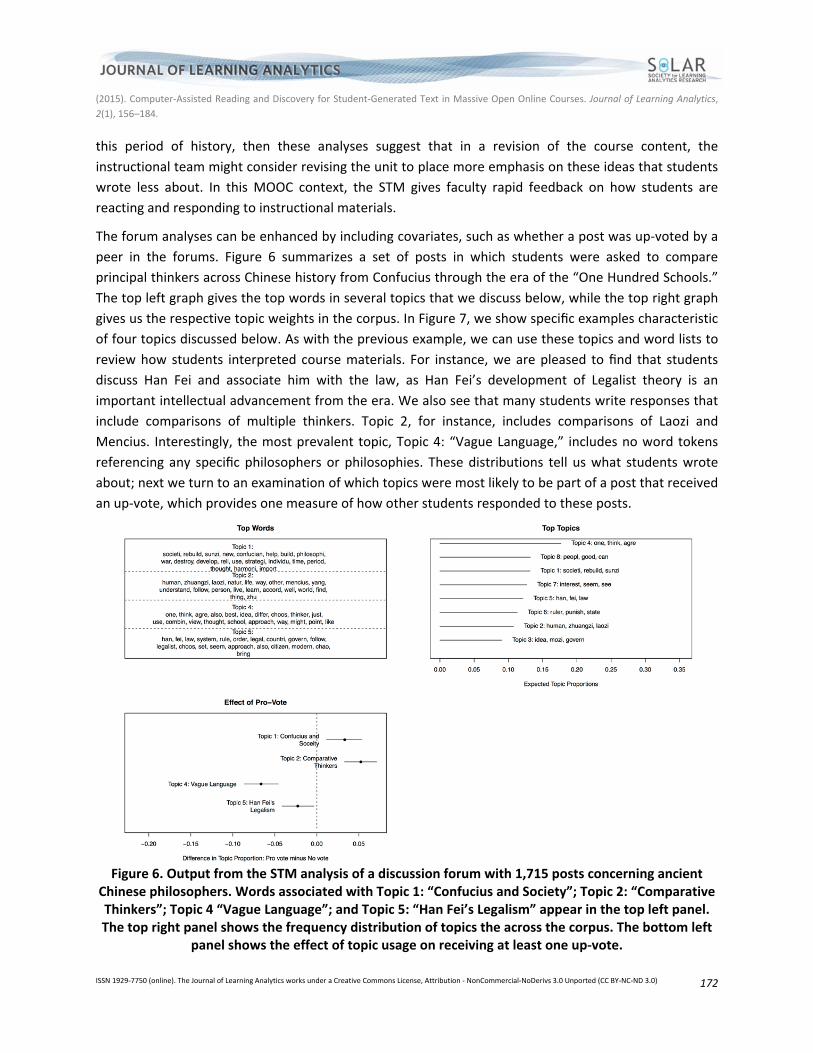
The forum analyses can be enhanced by including covariates, such as whether a post was up‐voted by a
peer in the forums. Figure 6 summarizes a set of posts in which students were asked to compare
principal thinkers across Chinese history from Confucius through the era of the “One Hundred Schools.”
The top left graph gives the top words in several topics that we discuss below, while the top right graph
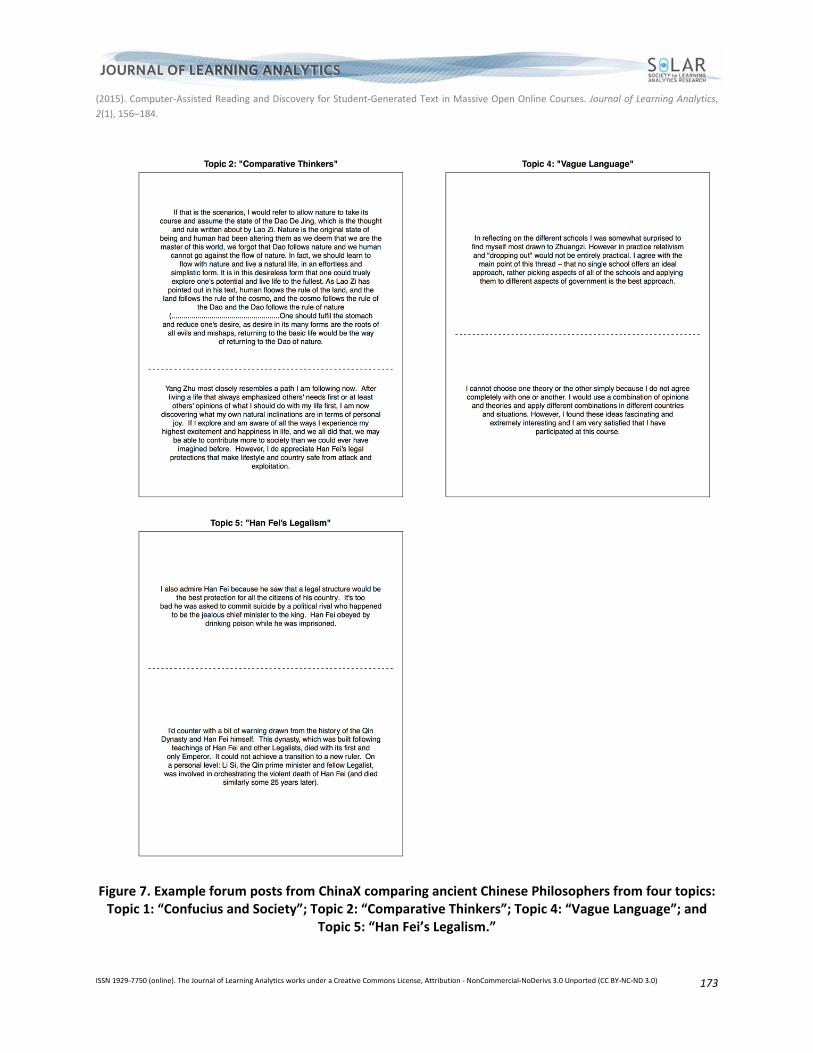
gives us the respective topic weights in the corpus. In Figure 7, we show specific examples characteristic
of four topics discussed below. As with the previous example, we can use these topics and word lists to
review how students interpreted course materials. For instance, we are pleased to find that students
discuss Han Fei and associate him with the law, as Han Fei’s development of Legalist theory is an
important intellectual advancement from the era. We also see that many students write responses that
include comparisons of multiple thinkers. Topic 2, for instance, includes comparisons of Laozi and
Mencius. Interestingly, the most prevalent topic, Topic 4: “Vague Language,” includes no word tokens
referencing any specific philosophers or philosophies. These distributions tell us what students wrote
about; next we turn to an examination of which topics were most likely to be part of a post that received
an up‐vote, which provides one measure of how other students responded to these posts.
Figure 6. Output from the STM analysis of a discussion forum with 1,715 posts concerning ancient
Chinese philosophers. Words associated with Topic 1: “Confucius and Society”; Topic 2: “Comparative Thinkers”; Topic 4 “Vague Language”; and Topic 5: “Han Fei’s Legalism” appear in the top left panel. The top right panel shows the frequency distribution of topics the across the corpus. The bottom left
panel shows the effect of topic usage on receiving at least one up‐vote.
(2015). Computer‐Assisted Reading and Discovery for Student‐Generated Text in Massive Open Online Courses. Journal of Learning Analytics,
2(1), 156–184.
ISSN 1929‐7750 (online). The Journal of Learning Analytics works under a Creative Commons License, Attribution ‐ NonCommercial‐NoDerivs 3.0 Unported (CC BY‐NC‐ND 3.0) 173
Figure 7. Example forum posts from ChinaX comparing ancient Chinese Philosophers from four topics: Topic 1: “Confucius and Society”; Topic 2: “Comparative Thinkers”; Topic 4: “Vague Language”; and
Topic 5: “Han Fei’s Legalism.”

(2015). Computer‐Assisted Reading and Discovery for Student‐Generated Text in Massive Open Online Courses. Journal of Learning Analytics,
2(1), 156–184.
ISSN 1929‐7750 (online). The Journal of Learning Analytics works under a Creative Commons License, Attribution ‐ NonCommercial‐NoDerivs 3.0 Unported (CC BY‐NC‐ND 3.0) 174
The bottom left panel of Figure 6 shows us the relationship between topic usage and receiving at least
one up‐vote in the forums. Notice that Topic 2 (“Comparative Thinkers”) is most associated with having
at least one up‐vote, and in contrast, Topic 4 (“Vague Language”) was most negatively associated with
having an up‐vote; students did not up‐vote comments that reflected indecisiveness or a lack of specific
evidence. Interestingly Topic 5 (“Han Fei and Legalism”) was also less likely to be up‐voted. In a deeper
analysis of these posts, it would be worth exploring whether these posts were less likely to be up‐voted
because they were poorly written or had some problem in argumentation, or if Han Fei’s Legalism
simply proved unpopular with a modern audience.
This analysis motivates several kinds of experiments in sharing these findings directly with students as a
way of offering feedback on participation in the discussion forums with concrete examples. For instance,
instructors could show students the evidence that vague responses received few up‐votes while
responses with specific ideas and evidence received more, and then show exemplars of each. This kind
of feedback on the specific characteristics of high‐quality responses in a forum would hopefully help
students write better responses. Ideally, faculty would test these ideas by showing the feedback to a
random subsample of students to determine if this kind of feedback helped some improve their writing.
We could also show students the evidence of their own leanings and biases, for instance by
demonstrating the community’s low regard for Han Fei. We believe this kind of computer‐assisted
reading and real‐time display of textual data could play an important role in providing students feedback
on discussion forums too large for rapid human analysis.
In just a few graphs, the STM offers a thematic overview of the student responses from two entire
forums worth of data. We have the ability to see the topics by frequency and word choice and to dive
into those topics by looking at archetypal posts. This allows us to monitor student understanding of
topics to prevent gaps in knowledge or misunderstanding while also understanding the discussion in
terms of broad themes. These results can easily be incorporated into later coursework or when
retrospectively evaluating the success of a course. At present, one of the most challenging aspects of
incorporating forums in MOOCs is that they rapidly become far too extensive for any student or faculty
member to follow, and the STM offers a toolset for finding patterns amid these wide‐ranging
conversations.
4.2 Class Feedback
Research suggests that faculty who reflectively incorporate feedback from student evaluations improve
their teaching, as measured by subsequent evaluations (Winchester & Winchester, 2014). In small‐scale
teaching environments, it is possible to read and analyze an entire set of student evaluations that
include qualitative feedback. But as class sizes grow, especially in large‐scale online learning
environments, reading thousands of open‐ended student responses becomes logistically infeasible. We
present a strategy that allows faculty to ask for rich qualitative feedback from many thousands of
students and then use computer‐assisted reading methods to find patterns of feedback and to uncover
typical suggestions or concerns.
(2015). Computer‐Assisted Reading and Discovery for Student‐Generated Text in Massive Open Online Courses. Journal of Learning Analytics,
2(1), 156–184.
ISSN 1929‐7750 (online). The Journal of Learning Analytics works under a Creative Commons License, Attribution ‐ NonCommercial‐NoDerivs 3.0 Unported (CC BY‐NC‐ND 3.0) 175
At the close of the first eight‐week mini‐course of ChinaX, participants were invited to complete a course
evaluation, which combined both open‐ and fixed‐response answers. We have responses from 1,057
students for which we have complete covariate information. This represents approximately 2.8% of all
registrants of the course and 42.3% of all who explored over half of the units of the course. Students
who completed the survey were overwhelmingly those who persisted throughout the entire course;
79.9% of survey respondents earned a certificate in the course compared to 5.4% of all registrants. Our
findings here describe how a subset of successful students evaluated the course.
Students were asked to articulate their feedback on the course in two open response questions:
What were your favourite aspects of this mini‐course so far?
What could the ChinaX team do to improve your learning experience?
Students were asked additional fixed responses questions such as “Overall, how satisfied were you with
this mini‐course?” with response anchors ranging from “Very Dissatisfied” to “Very Satisfied.” In
analyzing and triangulating responses from these questions, we can provide a nuanced picture of how
substantively interesting subgroups evaluate the course.
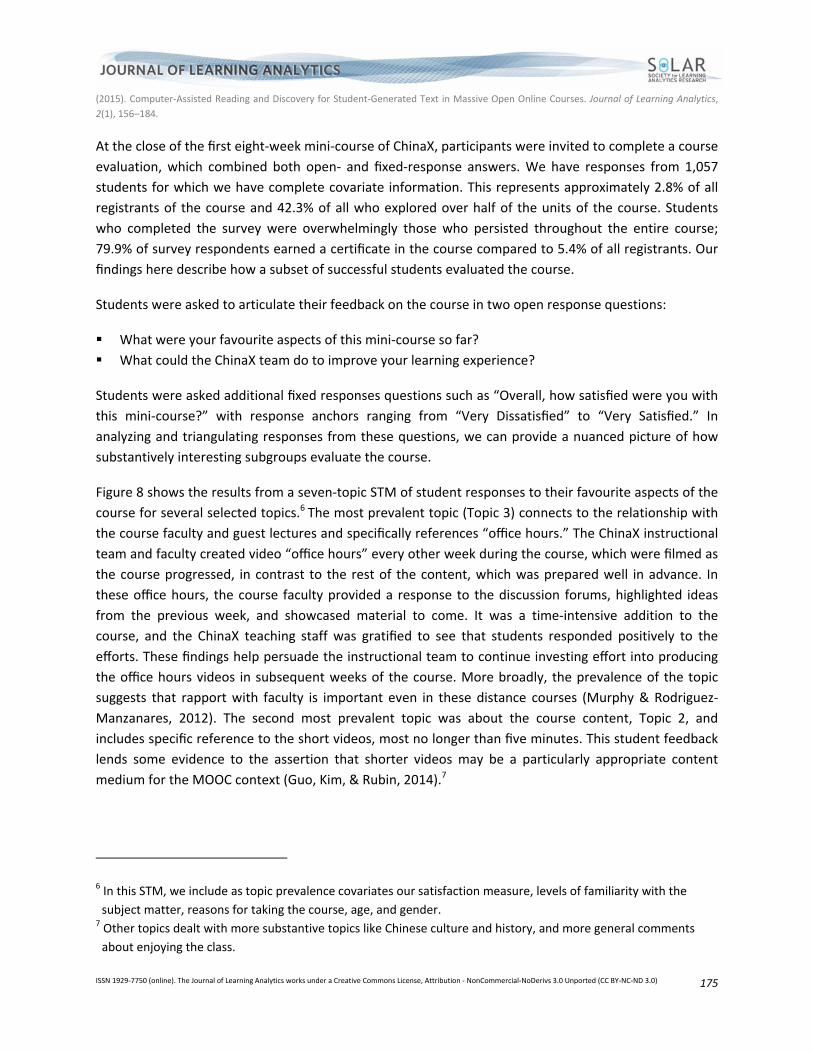
Figure 8 shows the results from a seven‐topic STM of student responses to their favourite aspects of the
course for several selected topics.6
The most prevalent topic (Topic 3) connects to the relationship with
the course faculty and guest lectures and specifically references “office hours.” The ChinaX instructional
team and faculty created video “office hours” every other week during the course, which were filmed as
the course progressed, in contrast to the rest of the content, which was prepared well in advance. In
these office hours, the course faculty provided a response to the discussion forums, highlighted ideas
from the previous week, and showcased material to come. It was a time‐intensive addition to the
course, and the ChinaX teaching staff was gratified to see that students responded positively to the
efforts. These findings help persuade the instructional team to continue investing effort into producing
the office hours videos in subsequent weeks of the course. More broadly, the prevalence of the topic
suggests that rapport with faculty is important even in these distance courses (Murphy & Rodriguez‐
Manzanares, 2012). The second most prevalent topic was about the course content, Topic 2, and
includes specific reference to the short videos, most no longer than five minutes. This student feedback
lends some evidence to the assertion that shorter videos may be a particularly appropriate content
medium for the MOOC context (Guo, Kim, & Rubin, 2014).7
6 In this STM, we include as topic prevalence covariates our satisfaction measure, levels of familiarity with the
subject matter, reasons for taking the course, age, and gender. 7 Other topics dealt with more substantive topics like Chinese culture and history, and more general comments
about enjoying the class.

(2015). Computer‐Assisted Reading and Discovery for Student‐Generated Text in Massive Open Online Courses. Journal of Learning Analytics,
2(1), 156–184.
ISSN 1929‐7750 (online). The Journal of Learning Analytics works under a Creative Commons License, Attribution ‐ NonCommercial‐NoDerivs 3.0 Unported (CC BY‐NC‐ND 3.0) 176
Figure 8. Output from 7 topic STM analysis of 1,057 responses to ChinaX course evaluation. The top left panel includes top words from four topics, Topic 2: “Video Material”; Topic 3: “Professors and
Lectures”; Topic 5: “Course Materials”; and Topic 6: “Chinese History in Context.” The top right panel includes the proportion of all seven topics across the corpus. The bottom panels have highly
associated texts from Topics 2 and 3.
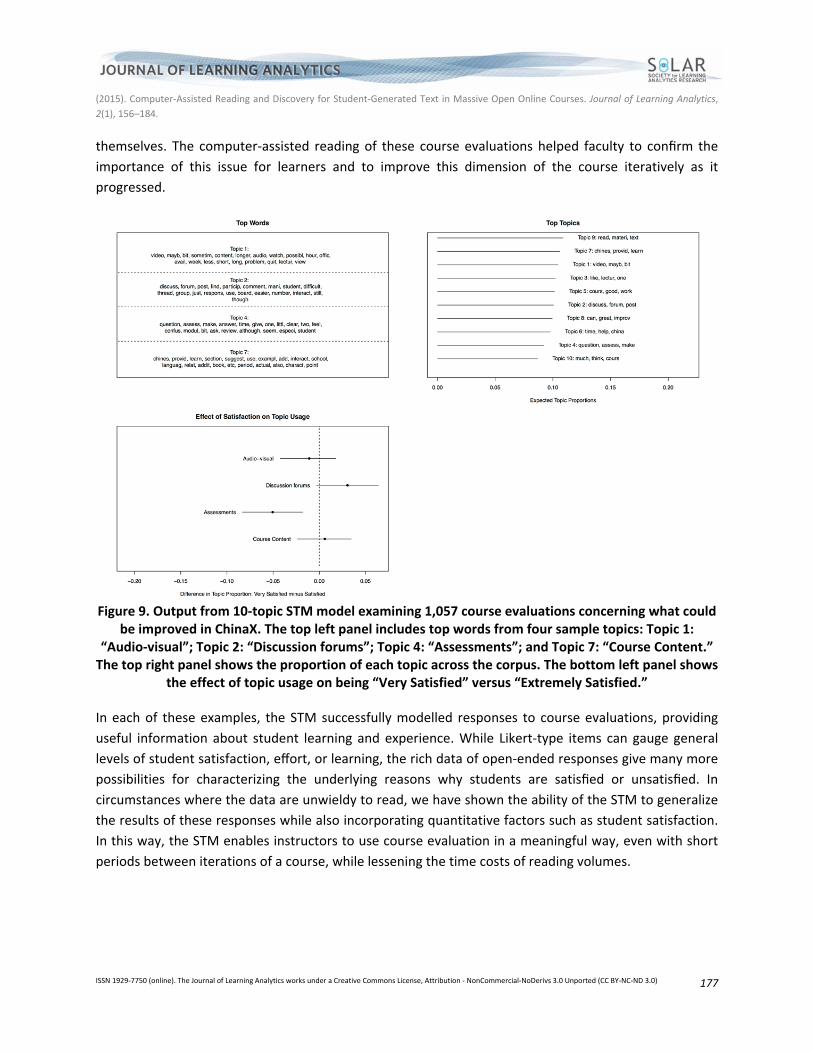
Figures 9 and 10 show the results of a ten‐topic STM on the responses regarding what elements of the
course could be improved. Here we focus our analysis on the influence of different levels of student
satisfaction. Nearly all students who take the survey were either “Very” or “Extremely” satisfied with the
course, so we are examining a narrow range of happy, successful students. Nonetheless, the differences
in topic prevalence by student satisfaction are revealing. We see that Topic 4 (“Assessments”) was
associated with less satisfied students, and from the listing of the top words associated with this we
recognize that these students took issue with the assessment and question format of the course. Our
text samples indicate that these students felt that the questions were ambiguous or needlessly tricky. By
contrast, more satisfied students raised issues with the discussion forum platform used by edX, Topic 2.
These students complained about technical issues that prevented them from easily engaging with other
students; they wanted to be able to participate even more fully!
Topic 7 includes references to Chinese characters, and it was the second most prevalent topic. While the
course was ongoing, the ChinaX course team received several emails asking that more Chinese and
English characters be displayed in the videos. The emails indicated that students were using the course
to learn English or Chinese. These emails were sporadic and idiosyncratic, so the team debated whether
to devote additional resources to adding Chinese characters to the videos. The prevalence of this topic
in the course evaluation provided additional evidence that this was a widespread interest, and the
course team decided to invest more resources in displaying more Chinese and English text in the videos
(2015). Computer‐Assisted Reading and Discovery for Student‐Generated Text in Massive Open Online Courses. Journal of Learning Analytics,
2(1), 156–184.
ISSN 1929‐7750 (online). The Journal of Learning Analytics works under a Creative Commons License, Attribution ‐ NonCommercial‐NoDerivs 3.0 Unported (CC BY‐NC‐ND 3.0) 177
themselves. The computer‐assisted reading of these course evaluations helped faculty to confirm the
importance of this issue for learners and to improve this dimension of the course iteratively as it
progressed.
Figure 9. Output from 10‐topic STM model examining 1,057 course evaluations concerning what could
be improved in ChinaX. The top left panel includes top words from four sample topics: Topic 1: “Audio‐visual”; Topic 2: “Discussion forums”; Topic 4: “Assessments”; and Topic 7: “Course Content.” The top right panel shows the proportion of each topic across the corpus. The bottom left panel shows
the effect of topic usage on being “Very Satisfied” versus “Extremely Satisfied.” In each of these examples, the STM successfully modelled responses to course evaluations, providing
useful information about student learning and experience. While Likert‐type items can gauge general
levels of student satisfaction, effort, or learning, the rich data of open‐ended responses give many more
possibilities for characterizing the underlying reasons why students are satisfied or unsatisfied. In
circumstances where the data are unwieldy to read, we have shown the ability of the STM to generalize
the results of these responses while also incorporating quantitative factors such as student satisfaction.
In this way, the STM enables instructors to use course evaluation in a meaningful way, even with short
periods between iterations of a course, while lessening the time costs of reading volumes.

(2015). Computer‐Assisted Reading and Discovery for Student‐Generated Text in Massive Open Online Courses. Journal of Learning Analytics,
2(1), 156–184.
ISSN 1929‐7750 (online). The Journal of Learning Analytics works under a Creative Commons License, Attribution ‐ NonCommercial‐NoDerivs 3.0 Unported (CC BY‐NC‐ND 3.0) 178
Figure 10. Students discuss what they found could be improved about the class, with examples from
topics 1, 2, 4, and 7.
5 CONCLUSION
As MOOCs and other online learning environments expand in scale, the same data growth that proves
overwhelming to faculty and instructional teams increases the reliability and utility of the STM. The STM
becomes ever more useful in exactly the place where the human ability to process the entirety of
student contributions in a timely fashion breaks down. These computer‐assisted reading approaches
have promising applications for helping faculty make sense of the vast conversations happening in
MOOCs and large‐scale learning environments. By way of conclusion, we offer three possible extensions
of this work into domains beyond those discussed in this paper.
While the examples in this paper come from discussion forums, pre‐course surveys, and course
evaluations, there are also applications with student assessment. Much of the early research and
development in MOOCs has focused on scalable mechanisms of assessing and assigning grades to
individual student work. There have been important advances, but methods of peer grading and
machine grading have proven controversial, technically challenging, and logistically difficult to
implement (Piech et al., 2013; Rees, 2013). The supervised machine analysis of shorter pieces of student
writing has proven particularly intractable (Brew & Leacock, 2013; Reich et al., 2014a). It may, therefore,

(2015). Computer‐Assisted Reading and Discovery for Student‐Generated Text in Massive Open Online Courses. Journal of Learning Analytics,
2(1), 156–184.
ISSN 1929‐7750 (online). The Journal of Learning Analytics works under a Creative Commons License, Attribution ‐ NonCommercial‐NoDerivs 3.0 Unported (CC BY‐NC‐ND 3.0) 179
prove useful to complement these efforts at individual assessment of student learning with STM and
other topic modelling approaches that attempt to assess student learning collectively. STM holds the
promise of inviting students to submit their written work, knowing that each of their individual
contributions will add to a model of student thinking that represents an entire learning community.
The examples in this paper also exclusively come from MOOCs built within learning management
systems, where the focus of learning is on lecture videos and computationally graded assessments
(sometimes called xMOOCs). STM technologies and methods also hold promise for connectivist learning
environments (Downes, 2008), which emphasize the aggregation of student‐produced text and media
from sites across the open Web (sometimes called cMOOCs). STM approaches to analyzing these
aggregated corpora offer connectivist educators a new set of tools to make aggregate meaning of the
production of a network of learners. As we look towards a future of learning environments with larger
networks of students, the most important technologies will not be those that facilitate dissemination of
content from faculty, but those that allow educators to better understand the range and quality of
contributions from students.
Finally, we have focused entirely on online environments, but there are promising applications for these
tools in residential settings as well. In many large lecture courses, faculty use exit tickets or “mud cards”
to have students articulate concepts that they are struggling with, and the STM could help characterize
the topics and distributions of those challenges. Course evaluations are another promising domain for
future research. Nearly every university uses some form of course evaluation to provide feedback to and
evaluate instructors, but for reasons of expediency the analyses of these course evaluations is mostly
limited to the quantitative elements. STM models open new possibilities for helping faculty,
administrators, and instructional staff better understand not just how satisfied and engaged students
were in a course, but how they qualitatively describe the strengths and weaknesses of particular
courses.
Throughout higher education and across the disciplines, reasoning from evidence through writing is one
of the central ways that students develop and demonstrate their understanding. Structural Topic
Models and other unsupervised machine‐learning methods are an important set of tools,
complementary to peer grading and supervised machine learning techniques, to help instructors and
educational researchers better understand students’ written contributions to learning communities and
learning experiences.
REFERENCES
Anaya, A. R., & Boticario, J. G. (2011). Application of machine learning techniques to analyse student
interactions and improve the collaboration process. Expert Systems with Applications, 38(2),
1171–1181. doi:10.1016/j.eswa.2010.05.010
Blei, D. M. (2012). Probabilistic topic models. Communications of the ACM, 55(4), 77–84.
doi:10.1145/2133806.2133826

(2015). Computer‐Assisted Reading and Discovery for Student‐Generated Text in Massive Open Online Courses. Journal of Learning Analytics,
2(1), 156–184.
ISSN 1929‐7750 (online). The Journal of Learning Analytics works under a Creative Commons License, Attribution ‐ NonCommercial‐NoDerivs 3.0 Unported (CC BY‐NC‐ND 3.0) 180
Blei, D. M., Ng, A., & Jordan, M. (2003). Latent Dirichlet allocation. Journal of Machine Learning
Research, 3, 993–1022. Retrieved from
http://machinelearning.wustl.edu/mlpapers/paper_files/BleiNJ03.pdf
Bishop, C. M. (2006). Pattern recognition and machine learning. New York, NY: Springer.
Breslow, L., Pritchard, D. E., DeBoer, J., Stump, G. S., & Ho, A. D. (2013). Studying learning in the
worldwide classroom: Research into EdX’s first MOOC. Research & Practice in Assessment, 8(1),
13–25. http://www.rpajournal.com/dev/wp‐content/uploads/2013/05/SF2.pdf
Brew, C., & Leacock, C. (2013). Automated short answer scoring. In M. Shermis & J. Burnstein (Eds.),
Handbook of automated essay evaluation: Current applications and new directions (pp. 136–
153). New York, NY: Routledge.
Brinton, C. G., Chiang, M., Jain, S., Lam, H., Liu, Z., & Wong, F. M. F. (2013). Learning about social
learning in MOOCs: From statistical analysis to generative model. arXiv preprint
arXiv:1312.2159.
Chang, J., Gerrish, S., Wang, C., Boyd‐Graber, J. L., & Blei, D. M. (2009). Reading tea leaves: How humans interpret topic models. In Proceedings of Advances in Neural Information Processing Systems 22 NIPS (2009).http://papers.nips.cc/paper/3700‐reading‐tea‐leaves‐how‐humans‐interpret‐topic‐models Computing Research Association. (2013). New technology‐based models for postsecondary learning: Conceptual frameworks and research agenda. Retrieved from http://cra.org/uploads/documents/resources/rissues/Postseconday_Learning_NSF‐CRA_report.pdf
Downes, S. (2008). Places to go: Connectivism & connective knowledge. Innovate: Journal of Online
Education, 5(1). http://bsili.3csn.org/files/2010/06/Places_to_Go‐
__Connectivism__Connective_Knowledge.pdf
Dringus, L. P., & Ellis, T. (2005). Using data mining as a strategy for assessing asynchronous discussion
forums. Computers & Education, 45(1), 141–160. doi:10.1016/j.compedu.2004.05.003
Duwairi, Rehab M. (2006). A framework for the computerized assessment of university student
essays. Computers in Human Behavior, 22(3), 381–388.
Eggers, A., & Spirling, A. (2011). Partisan convergence in executive‐legislative interactions modeling
debates in the House of Commons, 1832–1915. Retrieved from Harvard Institute for
Quantitative Social Science website:
202.154.59.182/mfile/files/Jurnal/Jurnal%202011/Partisan%20Convergence%20in%20Executive
‐
Legislative%20Interactions%20Modeling%20Debates%20in%20the%20House%20of%20Commo
ns,%201832%961915.pdf
Fisher, W. W. (2014). HLS1x: CopyrightX course report. (HarvardX Working Paper Series 5.) Retrieved
from SSRN: http://papers.ssrn.com/sol3/papers.cfm?abstract_id=2382332
Grainger, B. (2013). Massive open online course (MOOC) report. Retrieved from University of London
website: http://www.londoninternational.ac.uk/sites/default/files/documents/mooc_report‐
2013.pdf
Grimmer, J., & King, G. (2011). General purpose computer‐assisted clustering and conceptualization.
(2015). Computer‐Assisted Reading and Discovery for Student‐Generated Text in Massive Open Online Courses. Journal of Learning Analytics,
2(1), 156–184.
ISSN 1929‐7750 (online). The Journal of Learning Analytics works under a Creative Commons License, Attribution ‐ NonCommercial‐NoDerivs 3.0 Unported (CC BY‐NC‐ND 3.0) 181
Proceedings of the National Academy of Sciences, 108(7), 2643–2650. Retrieved from
http://www.pnas.org/content/108/7/2643.abstract
Grimmer, J., & Stewart, B. M. (2013). Text as data: The promise and pitfalls of automatic content
analysis methods for political texts. Political Analysis, 21(3), 267–297. Retrieved from
http://stanford.edu/~jgrimmer/tad2.pdf
Guo, P. J., Kim, J., & Rubin, R. (2014). How video production affects student engagement: An empirical
study of MOOC videos. Proceedings of the First ACM Conference on Learning@ Scale conference,
41–50. Retrieved from http://pgbovine.net/publications/edX‐MOOC‐video‐production‐and‐
engagement_LAS‐2014.pdf
Hastie, T., Tibshirani, R., & Friedman, J. (2009). The elements of statistical learning (2nd Ed.). New York,
NY: Springer.
Hillard, D., Purpura, S., & Wilkerson, J. (2008). Computer‐assisted topic classification for mixed‐methods
social science research. Journal of Information Technology & Politics, 4(4), 31–46. Retrieved
from http://faculty.washington.edu/jwilker/TopicClassification.pdf
Ho, A. D., Reich, J., Nesterko, S. O., Seaton, D. T., Mullaney, T., Waldo, J., & Chuang, I. (2014). HarvardX
and MITx: The first year of open online courses (HarvardX and MITx Working Paper No. 1).
Retrieved from SSRN: http://papers.ssrn.com/sol3/papers.cfm?abstract_id=2381263
Jamal, A., Keohane, R., Romney, D., & Tingley, D. (2014). Anti‐Americanism or anti‐interventionism:
Evidence from the Arabic Twitter universe. Perspectives on Politics, 13(1), 55–73. Retrieved from
http://scholar.harvard.edu/dtingley/publications/american‐eyes‐arabic‐tweeters
King, G., Pan, J., & Roberts, M. E. (2013). How censorship in China allows government criticism but
silences collective expression. American Political Science Review, 107, 1–18. Retrieved from
http://gking.harvard.edu/files/censored.pdf
Kizilcec, R. F. & Schneider, E. (2015). Motivation as a lens to understand online learners: Towards a data‐
driven design with the OLEI scale. Transactions on Computer‐Human Interactions, 22(2).
doi:10.1145/2699735
Koller, D., Ng, A., Do, C., & Chen, Z. (2013, May/June). Retention and intention in massive open online
courses: In depth. Educause Review. Retrieved from
http://net.educause.edu/ir/library/pdf/ERM1337.pdf
Kolowich, S. (2014). The professors who make the MOOCs. The Chronicle of Higher Education, 59(28),
A20–A23. Retrieved from http://chronicle.com/article/The‐Professors‐Behind‐the‐
MOOC/137905/#id=overview
Lowe, W., & Benoit, K. (2013). Validating estimates of latent traits from textual data using human
judgment as a benchmark. Political Analysis, 21(3), 298–313. Retrieved from
http://pan.oxfordjournals.org/content/early/2013/06/17/pan.mpt002
Lucas, C., Nielsen, R., Roberts, M., Stewart, B., Storer, A., & Tingley, D. (2013). Computer assisted text
analysis for comparative politics. Retrieved from
http://scholar.harvard.edu/files/dtingley/files/comparativepoliticstext.pdf
Mak, S. F. J., Williams, R., & Mackness, J. (2010). Blogs and forums as communication and learning tools
(2015). Computer‐Assisted Reading and Discovery for Student‐Generated Text in Massive Open Online Courses. Journal of Learning Analytics,
2(1), 156–184.
ISSN 1929‐7750 (online). The Journal of Learning Analytics works under a Creative Commons License, Attribution ‐ NonCommercial‐NoDerivs 3.0 Unported (CC BY‐NC‐ND 3.0) 182
in a MOOC. Proceedings of the 7th International Conference on Networked Learning 2010, 275–
285. Retrieved from
http://www.lancaster.ac.uk/fss/organisations/netlc/past/nlc2010/abstracts/PDFs/Mak.pdf
Mimno, D., Wallach, H. M., Talley, E., Leenders, M., & McCallum, A. (2011, July). Optimizing semantic
coherence in topic models. Proceedings of the Conference on Empirical Methods in Natural
Language Processing (pp. 262–272). Association for Computational Linguistics.
http://dl.acm.org/citation.cfm?id=2145462
Murphy, E., & Rodriguez‐Manzanares, M. A. (2012). Rapport in distance education. The International
Review of Research in Open and Distance Learning, 13(1). Retrieved from
http://www.irrodl.org/index.php/irrodl/article/view/1057/2076
Murphy, K. P. (2012). Machine learning: A probabilistic perspective. Cambridge, MA: MIT Press. Piech, C., Huang, J., Chen, Z., Do, C., Ng, A., & Koller, D. (2013). Tuned models of peer assessment in
MOOCs. arXiv preprint arXiv:1307.2579
Quinn, K. M., Monroe, B. L., Colaresi, M., Crespin, M. H., & Radev, D. R. (2010). How to analyze political
attention with minimal assumptions and costs. American Journal of Political Science, 54(1), 209–
228. Retrieved from https://www.law.berkeley.edu/files/TopicModel.pdf
Team, R. Core (2012). R: A language and environment for statistical computing. Vienna, Austria: R Foundation for Statistical Computing. Retrieved from: http://cran.case.edu/web/packages/dplR/vignettes/timeseries‐dplR.pdf
Reich, J., Nesterko, S. O., Seaton, D. T., Mullaney, T., Waldo, J., Chuang, I., & Ho, A. D. (2014a). PH207x:
Health in Numbers and PH278x: Human Health and Global Environmental Change 2012–2013
course report. (HarvardX Working Paper No. 2.) Retrieved from SSRN:
http://papers.ssrn.com/sol3/papers.cfm?abstract_id=2382242
Reich, J., Emanuel, J., Nesterko, S. O., Seaton, D. T., Mullaney, T., Waldo, J., & Ho, A. D. (2014b). HeroesX:
The Ancient Greek Hero: Spring 2013 course report. (HarvardX Working Paper No. 3.) Retrieved
from SSRN: http://papers.ssrn.com/sol3/papers.cfm?abstract_id=2382246
Reich, J., Nesterko, S. O., Seaton, D. T., Mullaney, T., Waldo, J., Chuang, I., & Ho, A. D. (2014c). JusticeX:
Spring 2013 course report. (HarvardX Working Paper No. 4.) Retrieved from SSRN:
http://papers.ssrn.com/sol3/papers.cfm?abstract_id=2382248
Rees, J. (2013, March 5). Peer grading canʼt work. Inside Higher Ed. Retrieved from
http://www.insidehighered.com/views/2013/03/05/essays‐flaws‐peer‐grading‐
moocs#ixzz2MiKxNP7b
Roberts, M. E., Stewart, B. M., & Airoldi, E. M. (2014). Structural topic models. Working Paper.
Retrieved from http://scholar.harvard.edu/files/bstewart/files/stm.pdf
Roberts, M. E., Stewart, B. M., & Tingley, D. (2014). stm: R package for structural topic models. Working
Paper.Retrieved from http://scholar.harvard.edu/files/bstewart/files/stmvignette.pdf
Roberts, M. E., Stewart, B. M., Tingley, D., & Airoldi, E. M. (2013). The structural topic model and applied
social science. Advances in Neural Information Processing Systems Workshop on Topic Models:
Computation, Application, and Evaluation. Retrieved from
http://scholar.harvard.edu/files/bstewart/files/stmnips2013.pdf
(2015). Computer‐Assisted Reading and Discovery for Student‐Generated Text in Massive Open Online Courses. Journal of Learning Analytics,
2(1), 156–184.
ISSN 1929‐7750 (online). The Journal of Learning Analytics works under a Creative Commons License, Attribution ‐ NonCommercial‐NoDerivs 3.0 Unported (CC BY‐NC‐ND 3.0) 183
Roberts, M. E., Stewart, B. M., Tingley, D., Lucas, C., Leder‐Luis, J., Gadarian, S. K., Albertson, B, & Rand,
D. G. (2014). Structural topic models for open‐ended survey responses. American Journal of
Political Science, 58(4), 1064–1082. doi: 10.1111/ajps.12103
Romero, C., & Ventura, S. (2007). Educational data mining: A survey from 1995 to 2005. Expert Systems
with Applications, 33(1), 135–146. Retrieved from
http://www.sciencedirect.com/science/article/pii/S0957417406001266
Shermis, M. D., & Hamner, B. (2012). Contrasting state‐of‐the‐art automated scoring of essays: Analysis.
Paper presented at National Council on Measurement in Education Annual Meeting, Vancouver,
B.C. http://www.scoreright.org/NCME_2012_Paper3_29_12.pdf
Stewart, B. M., & Zhukov, Y. M. (2009). Use of force and civil–military relations in Russia: An automated
content analysis. Small Wars & Insurgencies, 20(2), 319–343. Retrieved from
http://scholar.harvard.edu/files/bstewart/files/2009_stewartzhukov_swi.pdf
Stockmann, D. (2012). Media commercialization and authoritarian rule in China. Cambridge, UK:
Cambridge University Press.
Stump, G. S., DeBoer, J., Whittinghill, J., & Breslow, L. (2013). Development of a framework to classify
MOOC discussion forum posts: Methodology and challenges. Retrieved from
https://tll.mit.edu/sites/default/files/library/Coding_a_MOOC_Discussion_Forum.pdf
Thomas, M. (2002). Learning within incoherent structures: The space of online discussion forums.
Journal of Computer Assisted Learning, 18(3), 351–366. doi/10.1046/j.0266‐4909.2002.03800.x
Van Atteveldt, W., Kleinnijenhuis, J., & Ruigrok, N. (2008). Parsing, semantic networks, and political
authority using syntactic analysis to extract semantic relations from Dutch newspaper articles.
Political Analysis, 16(4), 428–446. Retrieved from
http://pan.oxfordjournals.org/content/16/4/428.short
Wallach, H. M., Murray, I., Salakhutdinov, R., & Mimno, D. (2009, June). Evaluation methods for topic
models. Proceedings of the 26th Annual International Conference on Machine Learning (pp.
1105–1112). New York, NY: ACM Press. http://dl.acm.org/citation.cfm?id=1553515
Wang, Y. & Baker, R. S. J. d. (2014). MOOC learner motivation and course completion rates. Working
Paper. Retrieved from http://www.moocresearch.com/wp‐content/uploads/2014/06/MRI‐
Report‐WangBaker‐June‐2014.pdf
Winchester, T. M., & Winchester, M. K. (2014). A longitudinal investigation of the impact of faculty
reflective practices on students’ evaluations of teaching. British Journal of Educational
Technology, 45(1), 112–124. Retrieved from
http://onlinelibrary.wiley.com/doi/10.1111/bjet.12019/abstract
Yang, D., Wen, M., Kumar, A., Xing, E., Rosé, C. P. (2014). Towards an integration of text and graph clustering methods as a lens for studying social interaction in MOOCs. Working paper. Retrieved from http://www.moocresearch.com/wp‐content/uploads/2014/06/C9184_ROSE_MOOC‐Research‐InitiativeRose9184X.pdf

(2015). Computer‐Assisted Reading and Discovery for Student‐Generated Text in Massive Open Online Courses. Journal of Learning Analytics,
2(1), 156–184.
ISSN 1929‐7750 (online). The Journal of Learning Analytics works under a Creative Commons License, Attribution ‐ NonCommercial‐NoDerivs 3.0 Unported (CC BY‐NC‐ND 3.0) 184
APPENDIX
Figure 11. Educational goals. The left column lists words associated with each topic and the right
column gives the distribution of topics across the corpus.