computers and electronics in agriculture - north …. sharma et al./computers and electronics in...
TRANSCRIPT

Computers and Electronics in Agriculture 124 (2016) 254–262
Contents lists available at ScienceDirect
Computers and Electronics in Agriculture
journal homepage: www.elsevier .com/locate /compag
Original papers
Use of corn height measured with an acoustic sensor improves yieldestimation with ground based active optical sensors
http://dx.doi.org/10.1016/j.compag.2016.04.0160168-1699/� 2016 Published by Elsevier B.V.
⇑ Corresponding author.E-mail addresses: [email protected] (H. Bu), [email protected] (D.
W. Franzen), [email protected] (A. Denton).
L.K. Sharma a, H. Bu b, D.W. Franzen b,⇑, A. Denton c
aUniversity of Maine, 57 Houlton Road, Presque Isle, ME 04769, United StatesbNorth Dakota State University, Department 7180, PO Box 6050, Fargo, ND 58108, United StatescNorth Dakota State University, Computer Science Department, PO Box 6050, Fargo, ND 58108, United States
a r t i c l e i n f o
Article history:Received 9 March 2015Received in revised form 12 April 2016Accepted 20 April 2016
Keywords:Corn heightCorn yieldAcoustic height sensorActive-optical sensorNDVI
a b s t r a c t
Corn height measured manually has shown promising results in improving the relationship betweenactive-optical (AO) sensor readings and crop yield. Manual measurement of corn height is not practicalin US commercial corn production, so an alternative automatic method must be found in order to capturethe benefit of including canopy height into in-season yield estimates and from there into in-season nitro-gen (N) fertilizer applications. One existing alternative to measure canopy height is an acoustic heightsensor. A commercial acoustic height sensor was utilized in these experiments at two corn growth stages(V6 and V12) along with AO sensors. Eight corn N rate sites in North Dakota, USA, were used to comparethe acoustic height sensor as a practical alternative to manual height measurements as an additionalparameter to increase the relationship between AO sensor readings and corn yield. Six N treatments, 0,45, 90, 134, 179, and 224 kg ha�1, were applied before planting in a randomized complete block exper-imental design with four replications. Height measurement using the acoustic sensor provided animproved yield relationship compared to manual height at all locations. The level of improvement ofthe relationship between AO readings multiplied by acoustic sensor readings and yield was greater atV6 growth stage compared to the V12 growth stage. At V12, corn height measured manually and withthe acoustic sensor multiplied by AO readings provided similar improvement to the relationship withyield compared to relating AO readings alone with yield at most locations. The acoustic height sensormay be useful in increasing the usefulness of AO sensor corn yield prediction algorithms for use inon-the-go in-season N application to corn particularly if the sensor height is normalized within sitebefore combining multiple locations.
� 2016 Published by Elsevier B.V.
1. Introduction
Use of precision agricultural techniques by farmers andag-industry farm input providers has increased steadily over thepast twenty-five years Precision agricultural methods for soilsampling have the ability to improve delineation of nutrient man-agement patterns as a basis for site-specific nutrient application(Sadler et al., 2000). Crop yield is affected by pest infestation, rain-fall, soil properties, climate variations, crop stress and landscapetopography (Raun et al., 2005), which vary spatially and temporallyand complicate site-specific nutrient management due to small-scale variability. On-the-go active-optical (AO) sensor technologyhas been used to detect small-scale variability of crop N status
within a field, sometimes at as small a scale as 1 m2, enabling moreefficient N fertilizer application to corn, wheat, cotton and sorghum(Gitelson and Merzlyak, 1997; Raun et al., 2001 and 2002; Kitchen,2006; Holland and Schepers, 2010; Franzen et al., 2014).
Algorithms developed for the use with AO sensors in relatingcrop yield with sensor readings contain considerable error despitetheir value in improving small-scale site-specific N management.The measurement of crop growth in another manner at the timeof AO sensor reading may provide an improved yield predictionalgorithm. Measuring corn height corn might help detect yielddifferences due to water stress, evapotranspiration rate, and othercrop stresses (Sammis et al., 1988) at a scale similar to that of AOsensors. Under optimum N availability conditions, corn plantsgrow to their full potential and reach a maximum height; however,if there is a stress due to suboptimal water supply or fertilizerdeficiency, plant height will be reduced along with yield(Venuprasad et al., 2008; Li et al., 2013). Crop height as a single

L.K. Sharma et al. / Computers and Electronics in Agriculture 124 (2016) 254–262 255
factor could be used to measure the vegetative growth and poten-tial yield of corn. Corn plant height is a highly sensitive growthparameter and is influenced by soil water content (Hussain et al.,1999), texture (Kladivko et al., 1986), fertilizer rate (Kapustaet al., 1996), and cultivation methods (Kladivko et al., 1986;Sharma and Franzen, 2014). Machado et al. (2002) found that cornheight could explain 60% of yield variability.
Red NDVI (normalized differential vegetative index, [red � nearinfrared]/[red + near infrared]) reflectance is based on two-dimensional measurement of the plant canopy, and is most suc-cessfully utilized during early growth stages when leaves do notshade the inter-plant spaces completely. At later growth stagesred NDVI readings fall into a narrow range from 0.85 to 0.95 anddiscrimination between weaker plants and healthier plantsbecomes impossible as leaves cover the soil surface regardless ofplant health. This problem is called ‘saturation’ (Wilhelm et al.,2000; Haboudane et al., 2004; Sharma and Franzen, 2014). A weakrelationship between red NDVI sensor readings and yield wasfound by Sharma and Franzen (2014) at the V12 stage of corndue to red NDVI saturation. Franzen et al. (2003), found improve-ment in estimation of sugar beet top leaf N concentration anddry matter content in Minnesota using the GreenSeeker� AO redNDVI readings at sugar beet harvest when optical sensor readingswere multiplied by a manually obtained plant canopy height,which helped to overcome red NDVI saturation.
Manually measured corn height combined with AO sensors hasimproved the relationship between AO sensor readings and cornyield. Several studies have used corn height in addition to Green-Seeker� sensor readings to estimate yield (Sharma and Franzen,2014; Freeman et al., 2007; Martin et al., 2012). In all of these stud-ies, significant relationships were found between yield and AO sen-sor readings multiplied by corn height. Corn height alone has beenused to estimate corn yield (Yin et al., 2011a,b; Machado et al.,2002; Katsvairo et al., 2003). Sharma and Franzen (2014) foundthat corn height can improve corn yield estimates and could beused along with AO sensor readings to improve the algorithmsdeveloped to direct in-season N rate application. Although includ-ing corn height may have the ability to improve AO sensoralgorithms, manual measurement of plant height is highly laborintensive and impractical on a commercial scale.
Several nondestructive methods have been used to measureplant height, including image processing (Changgui and Wenyi,2007), 3-D perspective view to measure tree height (Zhang andHuang, 2009), 3-D view with a 3 point correction (Han, 2011)and light detection and ranging (LIDAR) (Zhang and Grift, 2012).
Table 1Preplant soil analysis for the eight experimental sites.
Location Depth cm Nitrate-N (kg ha�1) P (mg kg�1)
Arthur 0–15 5 90–60 12
Beach 0–15 17 220–60 7
Durbin 0–15 5 340–60 45
Jamestown 0–15 10 80–60 12
Mott 0–15 18 40–60 10
New Leipzig 0–15 24 160–60 18
Richardton 0–15 11 330–60 8
Rutland 0–15 20 80–60 54
Using plant image for height measurement has been successfullytested by several researchers (Morden et al., 1997; Van Hentenand Bontsema, 1995; Tarbell and Reid, 1991; Tarbell et al., 1991).Plant height could also be measured using high resolution ultra-sound distance sensing of the crop canopy (Shrestha et al., 2002;Katsvairo et al., 2003) and stereo vision (Shrestha and Steward,2001). Use of stereo vision is most applicable for small scale workin laboratories and greenhouses (Matsuura et al., 2001; Kanumaet al., 1998; Lines et al., 2001). In some studies, remote sensingtechniques such as synthetic aperture radar (SAR) (Ulander et al.,1995; Dammert and Askne, 1998; Shimada et al., 2001) andairborne LIDAR (Nilsson, 1996; Magnussen et al., 1999; Perssonet al., 2002; Kwak et al., 2007; Yamamoto et al., 2011) was usedto measure the plant height. All of these techniques and instru-ments have been used effectively in the greenhouse or laboratory,but their practical application to use in the field is questionable.
In order to measure plant height at low cost in real-time and toincorporate plant height into AO sensor algorithms for use inin-season N management, the SenixViewTM model TSPC-30S1-232(Senix Corporation, Hinesburg, Vermont, USA) automated ultra-sonic acoustic sensor was used at two different corn stages(V6 and V12). This study was conducted to compare the use of cornheight measured with the acoustic sensor with corn heightmeasured manually to determine if sensor height measurementscombined with AO sensor readings are similarly related to cornyield as previous studies indicate using manually measured cornheight combined with AO sensor.
2. Materials and methods
2.1. Research sites and soil analysis
Eight experimental sites were established on farm fields in 2013in eastern and western North Dakota, USA. At each location, eightsoil sample cores were taken before planting and N applicationusing a 2.5-cm diameter hand probe. Soil cores were obtained toa depth of 0–15 cm for analysis of nitrate-nitrogen (N), phospho-rous (P), potassium (K), zinc (Zn), organic matter, and pH.A 0–60 cm soil core depth was taken for residual soil nitrate-Nanalysis (Table 1). For preplant soil test analysis, soil samples wereair-dried after they collected from the research site, ground to passthrough a 2 mm screen, and thoroughly mixed. Nitrate-N wasanalyzed using cadmium reduction described by Gelderman andBeegle (1998). Plant available phosphorus was analyzed using
K (mg kg�1) Zn (mg kg�1) Organic matter (g kg�1) pH
110 1.16 22 6.6
300 0.85 30 6.2
460 0.62 59 7.5
220 1.14 33 5.7
230 0.95 52 7.6
560 1.46 52 5.6
170 0.65 32 5.1
415 0.72 61 7.0

Table 2GPS coordinates and soil series of experimental sites.
Locations GPS coordinates Soil typea
Arthur 47�06050.96300N,97�57055.21900W
Coarse-silty, mixed, superactive,frigid Pachic Hapludolls
Beach 46�4903.03500N,103�59040.45100W
Fine-silty, mixed, superactive, frigidTypic Haplustolls
Durbin 46�51022.07200N,97�09028.36600W
Fine, smectitic, frigid Typic Epiaquerts
Jamestown 46�45058.57100N,98�47055.93000W
Fine-loamy, mixed, superactive, frigidCalcic Hapludolls
Mott 46�56043.58300N,102�19010.91900W
Fine-loamy, mixed, superactive, frigidTypic Haplustolls
NewLeipzig
46�26044.05100N,101�58031.37900W
Fine, smectitic, frigid VerticNatrustolls
Richardton 46�3500.09500N,102�21041.36400W
Fine-loamy, mixed, superactive, frigidTypic Haplustolls
Rutland 45�57050.17600N,97�31044.20500W
Fine, smectitic, frigid Pachic VerticArgiudolls
a Soil type from Soil Survey Staff (2013).
256 L.K. Sharma et al. / Computers and Electronics in Agriculture 124 (2016) 254–262
the Olsen method (Olsen et al., 1954b), and plant available potas-sium by the 1-N ammonium acetate method (Thomas, 1982). TheDTPA extraction (Lindsay and Norvell, 1978) together with atomicabsorption spectroscopy detection was used for Zn analysis.Organic matter content was determined using the loss followingignition method (Schulte and Hopkins, 1996). Soil pH was analyzedusing a 1:1 soil:deionized H2O solution method (Watson andBrown, 1998). The eight experimental sites were planted by thecooperators using their choice of corn hybrid. The experimentalsite locations, soil series within location, planting date and sensorreading dates can be found in Tables 2 and 3. The experimentaldesign at each experimental site was a randomized complete block,with six N treatments: control (no added N), 45, 90, 135, 189 and224 kg N ha�1 applied as ammonium nitrate, with four replica-tions. Each experimental unit (the area of each treatment withina replication) was 6.1 m long and 3.05 m wide. A 1.5 m wide lanewas produced by cutting out standing corn at the soil surface atabout V6 to separate replications and allow in-season field workwithout damaging corn within the experimental units. Someexperimental sites had different row spacing (50–75 cm) becausefarmers had different planters; therefore, there were 4–6 rowspresent within each experimental unit depending on the experi-mental site.
No supplemental N was applied to the experimental site by thefarmers. At experimental sites where fertilizer P, K or other nutri-ents were not applied by the grower because the fertilizer blendused on the field also contained N, supplemental P, K and Zn, if rec-ommended by the soil test, was applied by the researchers in abroadcast application before planting. Phosphate was applied asmono ammonium phosphate (110 g kg�1 N, 520 g kg�1 P2O5 equiv-alent) and K as potassium chloride (60 g kg�1 K2O equivalent)according to North Dakota State University recommendations(Franzen, 2010). If the soil analysis indicated that a site wasdeficient in Zn, zinc sulfate (360 g kg�1 percent Zn granules) at arate of 11 kg ha�1 Zn was applied as a broadcast at the time of Ntreatment application. If any experimental site was found to be Sdeficient, gypsum was applied at 22 kg ha�1 S (112 kg ha�1
200 g kg�1 S gypsum). At sites where S deficiency occurred aftercorn emergence, a similar rate of gypsum was applied as granulesover the top of the corn in a broadcast application.
2.2. Description of the active-optical sensors and methods of use
The two AO sensors used in these experiments emit modularlight pulses from diodes to generate particular wavebands whichare absorbed by plant tissues. In the GreenSeekerTM (GS) (TrimbleNavigation Limited, Sunnyvale, California, USA) bursts of light areemitted from diodes such that red (R) (660 nm) and near infrared(NIR) (710 nm) pulses alternately for 1 ms at 40,000 Hz, with eachburst composed of about 40 pulses. The illuminated area in ourstudy was positioned perpendicular to the direction of travel.According to Trimble, the GS field of view is constant for heightsbetween 60 and 120 cm above the canopy. The operators of theGS consistently operated the sensors at 60–70 cm above the corncanopy. Outputs from the sensor are normalized differential vege-tative indexes (NDVI), defined as [(NIR � visual wavelength)/(NIR+ visual wavelength)].
The source of light for the Holland Scientific Crop CircleTM (CC)sensor (ACS-470, Holland Scientific, Lincoln, Nebraska, USA) is amodulated polychromatic light emitting diode (LED) array whichcan emit and measure light spectrums from 430 nm to 850 nmbands. For these experiments, we used two filters in the visiblerange (red 650 nm, red edge 730 nm) and one filter in the NIR(760 nm). The sensor was calibrated using software provided byHolland Scientific. Measurements can be collected at a rate of2–20 readings per second. Values for CC measurements were the
mean of measurements obtained within 6.1 m length of row isthe average of about 4000 measurements when moving at5 km h�1. Outputs of the sensor are reflectance values that allowcalculation of the vegetation indices red NDVI and red edge NDVI.The formulas for red NDVI and red edge NDVI follow:
Red NDVI ¼ NIR � RedNIR þ Red
and Red Edge NDVI ¼ NIR � Red EdgeNIR þ Red Edge
The NDVI readings from the GS and CC were obtained when thecorn was about V6 and V12 (about 10 days to 2 weeks after V6)stages. Readings were taken 60–70 cm over the top of one interiorcorn row in each experimental unit and the row was noted so thatthe row being sensed was the row to be harvested after cornreached maturity. The NDVI was calculated within the CC instru-ment with built-in software, whereas the GS reflectance valueswere stored in a text file by the sensor software and NDVI valueswere calculated post-process using Microsoft Excel 2013.
For each experimental unit, the GS and CC readings consisted of30–50 individual NDVI or reflectance measurements. Means foreach treatment area were calculated by using in-house programsfor GS and CC raw data developed for Excel (Fargo and Franzen,2012). The relationship between sensor readings and yield wasnormalized using the value of ‘in-season estimate of yield’ (INSEY)(Raun et al., 2001). The INSEY was calculated by dividing the sensorreading by the growing degree days from the date of planting tosensing.
2.3. Corn height measurement using the manual method or theSenixView� sensor
Manual corn height measurement was conducted on the sameday and on the same rows as those subjected to GS and CC sensorand automatic height sensor measurements. The manual heightwas conducted by selecting three representative plants withinthe interior row to be sensed with the AO sensors in each experi-mental unit. A tape measure was used to determine the heightsof three corn plants from the soil surface to about 5 cm abovethe corn whorl base (Fig. 1). The three measurements were aver-aged to provide the manual corn height within each experimentalunit.
For automated height measurement, the SenixView acousticheight sensor model TSPC-30S1-232 (Senix Corporation, Hines-burg, Vermont, USA) was used. The SenixView sensor measuresthe distance of an object from to the sensor itself. The sensor iscommercialized for research and development in industrialautomation distance measurement. Typically, it is used for

Table 3Tillage system, planting date, and date of the first and second sensing of the experimental sites.
Locations Soil texture/Tillage Planting date 1st sensing V6 GDDa 2nd sensing V12 GDDa Corn variety
Arthur Medium-textured conventional-till 5/15/13 6/20/13 516 7/10/13 979 Mycogen-2T222Beach No-till 5/15/13 7/01/13 498 7/17/13 804 Pioneer D-97Durbin High clay conventional-till 5/15/13 6/25/13 623 7/15/13 1095 Not AvailableJamestown Medium textured no-till 5/11/13 6/18/13 424 7/09/13 870 Croplan 229VT2RTBMott No-till 5/19/13 7/01/13 593 7/17/13 911 P8107New Leipzig No-till 5/07/13 7/01/13 662 7/17/13 980 P8954XRRichardton No-till 5/13/13 None – 7/17/13 517 P8107Rutland No-till 5/08/13 6/18/13 754 7/09/13 1008 Mycogen 2G-161
a GDD is growing degree days from date of planting to the date of sensing at V6 or V12.
Fig. 1. Illustration of manual height and sensor measurement of corn canopy height. Corn canopy height is measured from soil surface to about 5 cm above the junctionbetween the two fully upper leaves. Sensor height measurement is the result of near simultaneous emission of ultrasonic waves from a specific height above the soil surface,and reception of echos from multiple surfaces originating from the upper leaf canopy.
L.K. Sharma et al. / Computers and Electronics in Agriculture 124 (2016) 254–262 257
measuring liquid levels, motion controls, people detection, proxim-ity sensing and dimensioning (SenixViewTM data sheet http://www.senix.com/senixview.htm) therefore it has very high sensitivitytowards any change in distance. The height sensor was calibratedwith the software provided with the sensor.
The sensor was mounted on a two-wheel bicycle fabricated forthis purpose with the front wheel smaller than the rear wheel tomaintain a uniform height and balance between the rows(Fig. 2). Depending on the crop height, the height of the sensorfrom the ground was adjusted and measured from the soil surfaceby adjusting the telescoping pole on which the sensor wasmounted before measurements. The values from the sensor weresubtracted from the value of the height of sensor from the soil sur-face. After collecting the data, negative, zero, and any values lessthan 5 cm were deleted from the file recorded on the computerduring post-processing. A Dell Mini (Dell Latitude 10ST2e, Dell,
Dell Latitude 10ST2e
12volt Battery
Senixview TSPC-30S1-232
SenixView Box
Telescoping rod
Fig. 2. Method of collecting data from SenixView� height sensor mounted onbicycle while connected with Dell Latitude 10ST2e.
Inc., Round Rock, Texas, USA), placed on the bicycle in front ofthe operator, was connected to the sensor to collect the heightdata. The software, SenixView Version 3, was installed on the DellMini.
Logging rate was set at one sample per second. The SenixViewsensor records 20 echos per second, so each recorded measure-ment was the mean of 20 individual measurements. Typically,the number of recorded measurements taken in each experimentalunit was 7–12, depending on the speed of the sensor operator.Speed varied with smoothness of the soil surface and moistureconditions within the site. Each echo measurement should beconsidered as an integration of heights from the crop canopy(Fig. 1). The canopy is not horizontal, so acoustic energy from thesensor strikes corn leaves at different angles. Whereas the manualheight measurement once defined is similar for each plant regard-less of leaf architecture. However, the acoustic sensor measure-ments are susceptible to different readings due to upright leaves,leaves that arch back to ground, and leaf movement with wind.The acoustic sensor measurements are therefore a trade-offbetween a firmly defined manual measurement, but is entirelyimpractical commercially, and a practical automatic measuringtool whose values inherently contain greater error.
The growth stages V6 and V12 were chosen because theserepresent two important times for possible in-season N applicationto corn. At V6, the corn plant has not yet determined maximumyield, so yield is not yet limited by shortage of N. An earlyin-season N application is usually made between V5 and V8. Usingthe INSEY normalization factor, an algorithm for in-season applica-tion to corn using the V6 data is valid for plus or minus two leaves;therefore, a V6 dataset helps to build an algorithm for V4 to V8sensing, while an algorithm based on V12 data helps build an algo-rithm for V10 to V14 sensing, which then leads directly into tassel-ing and pollination. Therefore, V6 and V12 were chosen to operateAO sensors and height measurements in anticipation of future

Table 4Coefficients of determination (r2) for the linear regressions between yield and manualheight and acoustic sensor height and combined no-till sites with corn yield at V6 andV12. Corn heights at Richardton and Durbin at V6 were not obtained due toexcessively wet conditions.
Location Sensing stage Manualheight
Sensor height
r2 Sig r2 Sig
Arthur (MTC)a V6 0.28 –* 0.40 –***
V12 0.44 –*** 0.31 –**
Beach (NT) V6 0.44 –*** 0.49 –***
V12 0.66 –*** 0.25 –**
Durbin (CTC) V12 0.60 –*** 0.48 –***
Jamestown (NT) V6 0.41 –*** 0.31 –**
V12 0.43 –*** 0.18 –*
Mott (NT) V6 0.12 NS 0.32 –**
V12 0.00 NS 0.02 NS
New Leipzig (NT) V6 0.26 –** 0.34 –***
V12 0.35 –** 0.00 NSRichardton (NT) V12 0.01 NS 0.01 NS
Rutland (NT) V6 0.03 NS 0.00 NSV12 0.16 –* 0.18 –*
No-till sites V6 0.26 –* 0.14 –*
V12 0.39 –** 0.38 –**
* Significance at 0.05 using the LSD statistic.** Significance at 0.01 using the LSD statistic.
*** Significance at 0.001 using the LSD statistic.a MTC is medium textured conventional tillage, CTC is clay textured conventional
tillage, NT is no-till.
258 L.K. Sharma et al. / Computers and Electronics in Agriculture 124 (2016) 254–262
in-season algorithm development. The sensor height data fromDurbin and Richardton at V6 was not collected due to wet soilconditions, where mud and crop residue built up on the tires andprevented practical use of the bicycle.
2.4. Harvest
The interior row (6.1 m in length less the outside ear at thebeginning and end of each length) that was earlier sensed at V6and V12 in each experimental unit was hand harvested after cornphysiological maturity. An Almaco� (Almaco, Nevada, Iowa, USA)corn sheller was used that allowed complete shelling of wet anddry corn. Grain moisture at shelling was determined on a grainsubsample using a Dickey-John� GAC-500 grain moisture and testweight instrument (Dickey-John, Auburn, Illinois, USA).
2.5. Statistical analysis
Regression analyses were conducted on sensor readings andyield in SAS for Windows 9.2 (SAS Institute, Cary, North Carolina,USA) using PROC REG with yield as dependent variable, and INSEYor INSEY multiplied by corn canopy manual height (INSEYMH) orINSEY multiplied by corn canopy sensor derived height (INSEYSH)(Sharma and Franzen, 2013) determined at V6 and V12 as the inde-pendent variable to evaluate the relationship between yield andcorn canopy height. Linear regression equations were found to bethe best descriptor of the regression relationships. The coefficientof determination (r2) value was used to evaluate the linear regres-sion relationships. Analysis of variance of yield and corn heightwas conducted in SAS using PROC GLM to compare differencesbetween N treatments, with the LSD being used to separate treat-ment differences. A p-value of 5% probability (0.05) was used tostatistically differentiate the treatments into those that werestatistically different and those that were not. The means werefurther differentiated into values with a 1% probability (0.01) and0.1 percent probability (0.001).
3. Results and discussion
The coefficients of determination of the linear regressionbetween yield and INSEYSH (INSEY multiplied by sensor height)and yield and INSEYMH (INSEY multiplied by manual height) withthe GS and CC sensor readings at V6 and V12 were significant atArthur, Beach, Durbin and Jamestown (Table 4). At Mott, the coeffi-cients of determination of yield and INSEYMH were not significantat V6 and V12, while that of yield and INSEYSH was significant onlyat V6. At New Leipzig, the coefficients of determination of yield andINSEYMH were significant related at V6 and V12, but that of yieldand INSEYSHwas only significant at V6. The coefficients of determi-nation of yield with INSEYSH and INSEYMH were not significant atRichardton at V12 and wet field conditions prevented corn heightsensing at V6. The coefficients of determination of the linear regres-sion between yield and INSEYSH and INSEYMH were significant atRutland only at V12. Normal corn development was compromisedat Mott, New Leipzig and Richardton sites due to exceptionally highin-season rainfall and the corn plants struggled to overcome theeffects of waterlogged soils throughout the summer.
The coefficients of determination of the linear regressionbetween yield and INSEYSH with GS and CC sensor readings atV6 were significantly improved in 10 of 24 individual experimentalsite comparisons compared to that between yield and INSEY alone(Table 5). There were no differences in the coefficients of determi-nation of the linear regression between yield and INSEYSH andthose of yield and INSEY alone at 10 of 24 experimental site loca-tions. Combining data from the no-till sites (Table 5), the coeffi-
cients of determination of the linear regression between yieldand INSEYSH was improved over that of yield and INSEY alone in2 of 4 comparisons, with no significant differences between thecoefficients of determination of yield and INSEYSH and that of yieldand INSEY alone in the remaining 2 comparisons. The coefficientsof determination of linear regression between yield and INSEYSHwith GS and C sensors were significant in 20 of 24 single site com-parisons (Table 5).
The coefficients of determination of the linear regressionbetween yield and INSEYSH with GS and CC sensor readings weresignificant in 31 of 32 individual experimental site comparisons atV12 (Table 5). The coefficients of determination of the linearregression between yield and INSEYSH with GS and CC sensorreadings at V12 was improved in only 4 of 32 individual experi-mental site comparisons. There were no significant differences inthe coefficients of determination of the linear regression betweenyield and INSEYSH with GS and CC sensor readings at V12 and thatof yield and INSEY alone at 22 of 32 individual experimental sitecomparisons and 4 of 4 combined comparisons. The coefficient ofdetermination of the linear regression of yield and INSEYSH withGS and CC sensor readings were reduced compared to that of yieldand INSEY in 5 of 32 individual site comparisons. The V12 CC rededge INSEYSH was not significant at Richardton (Table 5).
The data behind the linear regressions of corn yield withINSEYSH and INSEYMH is provided in Table 6. Corn yield increasedwith N rate at Arthur, Beach, Durbin, Mott, New Leipzig andRichardton, but not at Jamestown and Rutland. Sensor measuredcorn height increased with N rate at Arthur (V6), Beach(V6, V12), Durbin (V12), New Leipzig (V6) and Richardton (V12).
Considering all sites, corn height measured with the sensor atV6 stage was more sensitive to N treatment compared to cornheight measured manually (Table 6). In contrast, at V12 stage cornheight measured manually resulted in greater treatment differ-ences compared to corn height measured with the sensor. Cornheight measured with the sensor at V6 increased with N rate at 3of the 4 sites where corn yield increased with N rate. Corn height
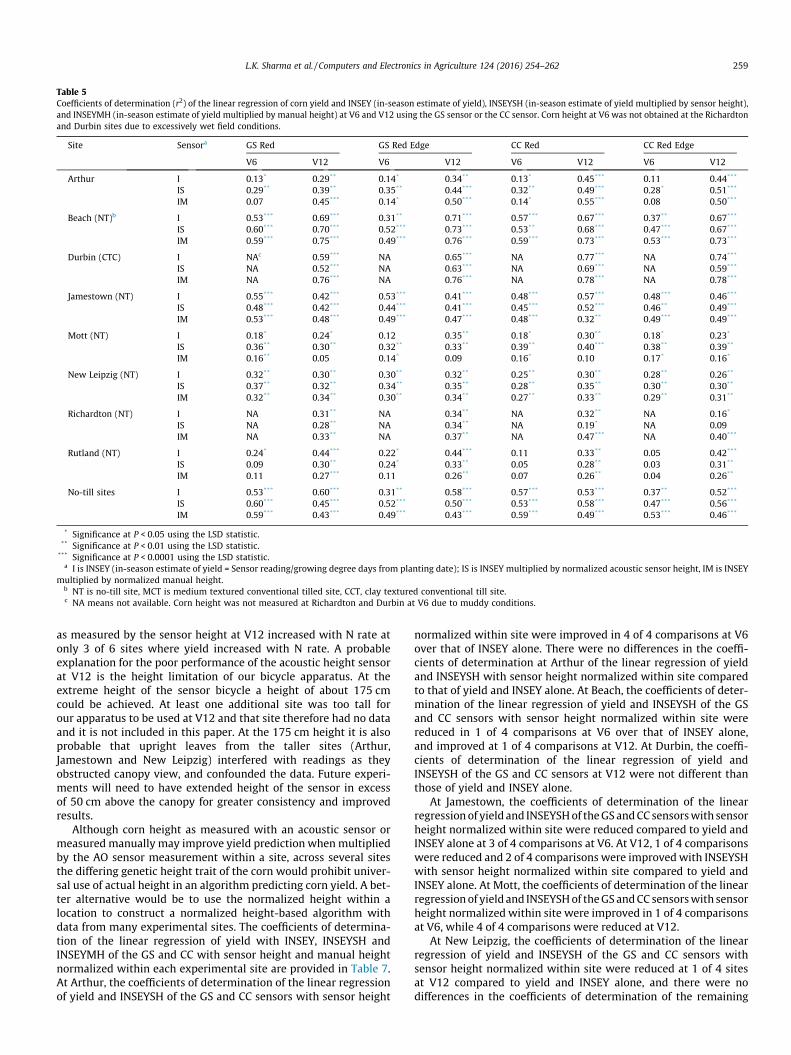
Table 5Coefficients of determination (r2) of the linear regression of corn yield and INSEY (in-season estimate of yield), INSEYSH (in-season estimate of yield multiplied by sensor height),and INSEYMH (in-season estimate of yield multiplied by manual height) at V6 and V12 using the GS sensor or the CC sensor. Corn height at V6 was not obtained at the Richardtonand Durbin sites due to excessively wet field conditions.
Site Sensora GS Red GS Red Edge CC Red CC Red Edge
V6 V12 V6 V12 V6 V12 V6 V12
Arthur I 0.13* 0.29** 0.14* 0.34** 0.13* 0.45*** 0.11 0.44***
IS 0.29** 0.39** 0.35** 0.44*** 0.32** 0.49*** 0.28* 0.51***
IM 0.07 0.45*** 0.14* 0.50*** 0.14* 0.55*** 0.08 0.50***
Beach (NT)b I 0.53*** 0.69*** 0.31** 0.71*** 0.57*** 0.67*** 0.37** 0.67***
IS 0.60*** 0.70*** 0.52*** 0.73*** 0.53** 0.68*** 0.47*** 0.67***
IM 0.59*** 0.75*** 0.49*** 0.76*** 0.59*** 0.73*** 0.53*** 0.73***
Durbin (CTC) I NAc 0.59*** NA 0.65*** NA 0.77*** NA 0.74***
IS NA 0.52*** NA 0.63*** NA 0.69*** NA 0.59***
IM NA 0.76*** NA 0.76*** NA 0.78*** NA 0.78***
Jamestown (NT) I 0.55*** 0.42*** 0.53*** 0.41*** 0.48*** 0.57*** 0.48*** 0.46***
IS 0.48*** 0.42*** 0.44*** 0.41*** 0.45*** 0.52*** 0.46** 0.49***
IM 0.53*** 0.48*** 0.49*** 0.47*** 0.48*** 0.32** 0.49*** 0.49***
Mott (NT) I 0.18* 0.24* 0.12 0.35** 0.18* 0.30** 0.18* 0.23*
IS 0.36** 0.30** 0.32** 0.33** 0.39** 0.40*** 0.38** 0.39**
IM 0.16** 0.05 0.14* 0.09 0.16* 0.10 0.17* 0.16*
New Leipzig (NT) I 0.32** 0.30** 0.30** 0.32** 0.25** 0.30** 0.28** 0.26**
IS 0.37** 0.32** 0.34** 0.35** 0.28** 0.35** 0.30** 0.30**
IM 0.32** 0.34** 0.30** 0.34** 0.27** 0.33** 0.29** 0.31**
Richardton (NT) I NA 0.31** NA 0.34** NA 0.32** NA 0.16*
IS NA 0.28** NA 0.34** NA 0.19* NA 0.09IM NA 0.33** NA 0.37** NA 0.47*** NA 0.40***
Rutland (NT) I 0.24* 0.44*** 0.22* 0.44*** 0.11 0.33** 0.05 0.42***
IS 0.09 0.30** 0.24* 0.33** 0.05 0.28** 0.03 0.31**
IM 0.11 0.27*** 0.11 0.26** 0.07 0.26** 0.04 0.26**
No-till sites I 0.53*** 0.60*** 0.31** 0.58*** 0.57*** 0.53*** 0.37** 0.52***
IS 0.60*** 0.45*** 0.52*** 0.50*** 0.53*** 0.58*** 0.47*** 0.56***
IM 0.59*** 0.43*** 0.49*** 0.43*** 0.59*** 0.49*** 0.53*** 0.46***
* Significance at P < 0.05 using the LSD statistic.** Significance at P < 0.01 using the LSD statistic.
*** Significance at P < 0.0001 using the LSD statistic.a I is INSEY (in-season estimate of yield = Sensor reading/growing degree days from planting date); IS is INSEY multiplied by normalized acoustic sensor height, IM is INSEY
multiplied by normalized manual height.b NT is no-till site, MCT is medium textured conventional tilled site, CCT, clay textured conventional till site.c NA means not available. Corn height was not measured at Richardton and Durbin at V6 due to muddy conditions.
L.K. Sharma et al. / Computers and Electronics in Agriculture 124 (2016) 254–262 259
as measured by the sensor height at V12 increased with N rate atonly 3 of 6 sites where yield increased with N rate. A probableexplanation for the poor performance of the acoustic height sensorat V12 is the height limitation of our bicycle apparatus. At theextreme height of the sensor bicycle a height of about 175 cmcould be achieved. At least one additional site was too tall forour apparatus to be used at V12 and that site therefore had no dataand it is not included in this paper. At the 175 cm height it is alsoprobable that upright leaves from the taller sites (Arthur,Jamestown and New Leipzig) interfered with readings as theyobstructed canopy view, and confounded the data. Future experi-ments will need to have extended height of the sensor in excessof 50 cm above the canopy for greater consistency and improvedresults.
Although corn height as measured with an acoustic sensor ormeasured manually may improve yield prediction whenmultipliedby the AO sensor measurement within a site, across several sitesthe differing genetic height trait of the corn would prohibit univer-sal use of actual height in an algorithm predicting corn yield. A bet-ter alternative would be to use the normalized height within alocation to construct a normalized height-based algorithm withdata from many experimental sites. The coefficients of determina-tion of the linear regression of yield with INSEY, INSEYSH andINSEYMH of the GS and CC with sensor height and manual heightnormalized within each experimental site are provided in Table 7.At Arthur, the coefficients of determination of the linear regressionof yield and INSEYSH of the GS and CC sensors with sensor height
normalized within site were improved in 4 of 4 comparisons at V6over that of INSEY alone. There were no differences in the coeffi-cients of determination at Arthur of the linear regression of yieldand INSEYSH with sensor height normalized within site comparedto that of yield and INSEY alone. At Beach, the coefficients of deter-mination of the linear regression of yield and INSEYSH of the GSand CC sensors with sensor height normalized within site werereduced in 1 of 4 comparisons at V6 over that of INSEY alone,and improved at 1 of 4 comparisons at V12. At Durbin, the coeffi-cients of determination of the linear regression of yield andINSEYSH of the GS and CC sensors at V12 were not different thanthose of yield and INSEY alone.
At Jamestown, the coefficients of determination of the linearregressionof yield and INSEYSHof theGS andCC sensorswith sensorheight normalized within site were reduced compared to yield andINSEY alone at 3 of 4 comparisons at V6. At V12, 1 of 4 comparisonswere reduced and 2 of 4 comparisons were improvedwith INSEYSHwith sensor height normalized within site compared to yield andINSEY alone. At Mott, the coefficients of determination of the linearregressionof yield and INSEYSHof theGS andCC sensorswith sensorheight normalized within site were improved in 1 of 4 comparisonsat V6, while 4 of 4 comparisons were reduced at V12.
At New Leipzig, the coefficients of determination of the linearregression of yield and INSEYSH of the GS and CC sensors withsensor height normalized within site were reduced at 1 of 4 sitesat V12 compared to yield and INSEY alone, and there were nodifferences in the coefficients of determination of the remaining
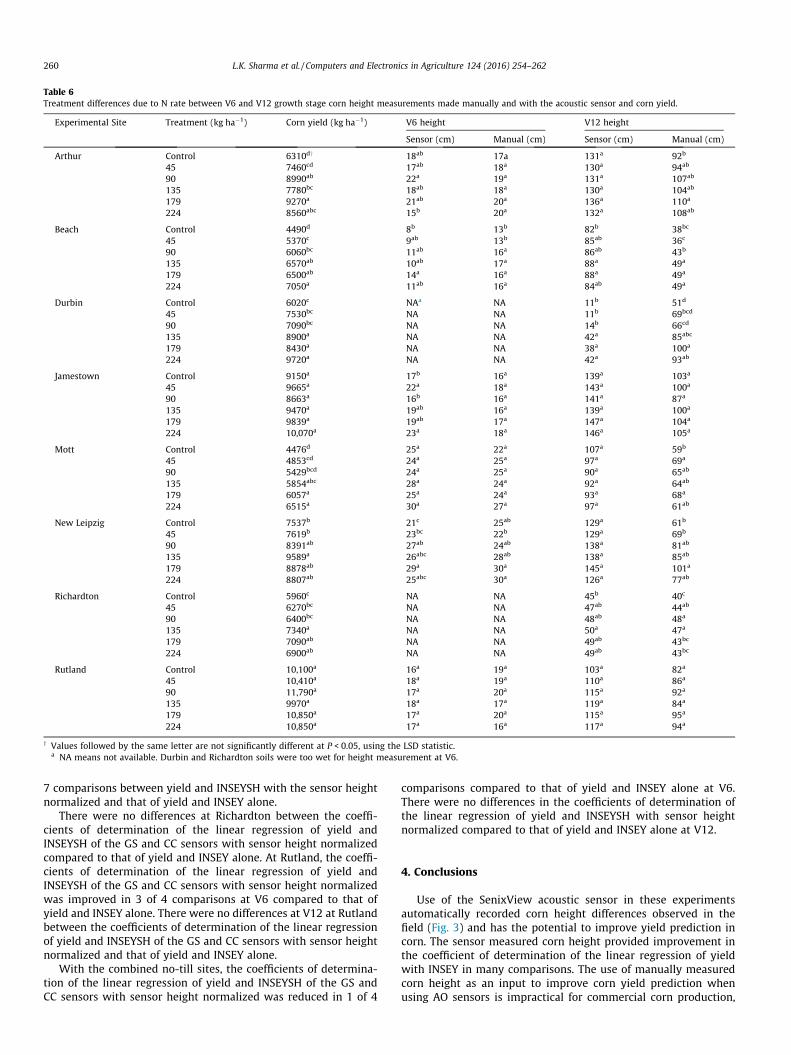
Table 6Treatment differences due to N rate between V6 and V12 growth stage corn height measurements made manually and with the acoustic sensor and corn yield.
Experimental Site Treatment (kg ha�1) Corn yield (kg ha�1) V6 height V12 height
Sensor (cm) Manual (cm) Sensor (cm) Manual (cm)
Arthur Control 6310dy 18ab 17a 131a 92b
45 7460cd 17ab 18a 130a 94ab
90 8990ab 22a 19a 131a 107ab
135 7780bc 18ab 18a 130a 104ab
179 9270a 21ab 20a 136a 110a
224 8560abc 15b 20a 132a 108ab
Beach Control 4490d 8b 13b 82b 38bc
45 5370c 9ab 13b 85ab 36c
90 6060bc 11ab 16a 86ab 43b
135 6570ab 10ab 17a 88a 49a
179 6500ab 14a 16a 88a 49a
224 7050a 11ab 16a 84ab 49a
Durbin Control 6020c NAa NA 11b 51d
45 7530bc NA NA 11b 69bcd
90 7090bc NA NA 14b 66cd
135 8900a NA NA 42a 85abc
179 8430a NA NA 38a 100a
224 9720a NA NA 42a 93ab
Jamestown Control 9150a 17b 16a 139a 103a
45 9665a 22a 18a 143a 100a
90 8663a 16b 16a 141a 87a
135 9470a 19ab 16a 139a 100a
179 9839a 19ab 17a 147a 104a
224 10,070a 23a 18a 146a 105a
Mott Control 4476d 25a 22a 107a 59b
45 4853cd 24a 25a 97a 69a
90 5429bcd 24a 25a 90a 65ab
135 5854abc 28a 24a 92a 64ab
179 6057a 25a 24a 93a 68a
224 6515a 30a 27a 97a 61ab
New Leipzig Control 7537b 21c 25ab 129a 61b
45 7619b 23bc 22b 129a 69b
90 8391ab 27ab 24ab 138a 81ab
135 9589a 26abc 28ab 138a 85ab
179 8878ab 29a 30a 145a 101a
224 8807ab 25abc 30a 126a 77ab
Richardton Control 5960c NA NA 45b 40c
45 6270bc NA NA 47ab 44ab
90 6400bc NA NA 48ab 48a
135 7340a NA NA 50a 47a
179 7090ab NA NA 49ab 43bc
224 6900ab NA NA 49ab 43bc
Rutland Control 10,100a 16a 19a 103a 82a
45 10,410a 18a 19a 110a 86a
90 11,790a 17a 20a 115a 92a
135 9970a 18a 17a 119a 84a
179 10,850a 17a 20a 115a 95a
224 10,850a 17a 16a 117a 94a
y Values followed by the same letter are not significantly different at P < 0.05, using the LSD statistic.a NA means not available. Durbin and Richardton soils were too wet for height measurement at V6.
260 L.K. Sharma et al. / Computers and Electronics in Agriculture 124 (2016) 254–262
7 comparisons between yield and INSEYSH with the sensor heightnormalized and that of yield and INSEY alone.
There were no differences at Richardton between the coeffi-cients of determination of the linear regression of yield andINSEYSH of the GS and CC sensors with sensor height normalizedcompared to that of yield and INSEY alone. At Rutland, the coeffi-cients of determination of the linear regression of yield andINSEYSH of the GS and CC sensors with sensor height normalizedwas improved in 3 of 4 comparisons at V6 compared to that ofyield and INSEY alone. There were no differences at V12 at Rutlandbetween the coefficients of determination of the linear regressionof yield and INSEYSH of the GS and CC sensors with sensor heightnormalized and that of yield and INSEY alone.
With the combined no-till sites, the coefficients of determina-tion of the linear regression of yield and INSEYSH of the GS andCC sensors with sensor height normalized was reduced in 1 of 4
comparisons compared to that of yield and INSEY alone at V6.There were no differences in the coefficients of determination ofthe linear regression of yield and INSEYSH with sensor heightnormalized compared to that of yield and INSEY alone at V12.
4. Conclusions
Use of the SenixView acoustic sensor in these experimentsautomatically recorded corn height differences observed in thefield (Fig. 3) and has the potential to improve yield prediction incorn. The sensor measured corn height provided improvement inthe coefficient of determination of the linear regression of yieldwith INSEY in many comparisons. The use of manually measuredcorn height as an input to improve corn yield prediction whenusing AO sensors is impractical for commercial corn production,

Table 7Coefficients of determination (r2) between INSEY and acoustic sensor height normalized within each site, or manual height normalized within each experimental site and cornyield.
Site Sensora GS Red GS Red Edge CC Red CC Red Edge
V6 V12 V6 V12 V6 V12 V6 V12
Arthur I 0.03 0.37*** 0.06 0.51*** 0.08 0.42*** 0.04 0.45***
IS 0.40*** 0.56*** 0.44*** 0.62*** 0.42*** 0.55*** 0.38*** 0.57***
IM 0.05 0.38*** 0.11* 0.45*** 0.13* 0.43*** 0.11* 0.51***
Beach (NT)b I 0.30** 0.67*** 0.49*** 0.32** 0.52*** 0.67*** 0.36** 0.32**
IS 0.32** 0.51*** 0.39*** 0.40*** 0.38** 0.51*** 0.36** 0.40***
IM 0.49*** 0.69*** 0.61*** 0.61*** 0.55*** 0.69*** 0.48*** 0.61***
Durbin (CTC) I NA 0.59*** NA 0.68*** NA 0.73*** NA 0.71***
IS NA 0.59*** NA 0.59*** NA 0.59*** NA 0.59***
IM NA 0.61*** NA 0.61*** NA 0.63*** NA 0.63***
Jamestown (NT) I 0.40*** 0.36** 0.41*** 0.48*** 0.39** 0.04 0.41*** 0.04IS 0.19* 0.30** 0.22** 0.39** 0.21** 0.35** 0.21** 0.29**
IM 0.44*** 0.39** 0.45*** 0.51*** 0.41*** 0.44*** 0.42*** 0.35**
Mott (NT) I 0.12* 0.19* 0.17* 0.20** 0.17* 0.19* 0.17* 0.20**
IS 0.12* 0.02 0.15* 0.02 0.18* 0.02 0.21** 0.05IM 0.20** 0.08 0.24** 0.08 0.26** 0.08 0.26** 0.08
New Leipzig (NT) I 0.30** 0.30** 0.31** 0.30** 0.33** 0.25** 0.28** 0.59***
IS 0.31** 0.20** 0.33** 0.33** 0.25** 0.25** 0.26** 0.23**
IM 0.20** 0.20** 0.30** 0.30** 0.25** 0.27** 0.29** 0.22**
Richardton (NT) I NAc 0.20** NA 0.23** NA 0.20** NA 0.23**
IS NA 0.25** NA 0.26** NA 0.25** NA 0.26**
IM NA 0.33** NA 0.35** NA 0.33** NA 0.33**
Rutland (NT) I 0.24** 0.44*** 0.11 0.44*** 0.11 0.33*** 0.03 0.42***
IS 0.21** 0.48*** 0.24** 0.49*** 0.19* 0.47*** 0.16* 0.45***
IM 0.09 0.44*** 0.11 0.40*** 0.15* 0.43*** 0.14* 0.37***
No-till sites I 0.28** 0.33** 0.26** 0.44*** 0.37** 0.67*** 0.35** 0.56***
IS 0.30** 0.37** 0.31** 0.36** 0.35** 0.54*** 0.35** 0.50***
IM 0.22** 0.49*** 0.22** 0.43*** 0.30** 0.49*** 0.31** 0.44***
* Significance at P < 0.05, using the LSD statistic.** Significance at P < 0.01, using the LSD statistic.
*** Significance at P < 0.0001, using the LSD statistic.a I is INSEY (in-season estimate of yield = Sensor reading/growing degree days from planting date); IS is INSEY multiplied by normalized acoustic sensor height, IM is INSEY
multiplied by normalized manual height.b NT is no-till site, MCT is medium textured conventional tilled site, CCT, clay textured conventional till site.c NA means not available. Corn height was not measured at Richardton and Durbin at V6 due to muddy conditions.
Control
High N treatment
Fig. 3. Visual difference in corn height in control treatment as compared to higher N treatments.
L.K. Sharma et al. / Computers and Electronics in Agriculture 124 (2016) 254–262 261
therefore use of a sensor to improve the relationship between yieldand AO sensor reading is important. The normalization of sensorheight within each site resulted in values that could be used tocombine multiple sites into a yield prediction algorithm thatincludes the AO sensor reading, corn height measured with the
height sensor, and yield data. Although the current database ofcorn height with corn yield is not sufficient to construct a usablealgorithm for commercial use, it indicates that with a larger sensorheight database such an algorithm might be possible that tran-scends differences in genetic corn hybrid height characteristics.
262 L.K. Sharma et al. / Computers and Electronics in Agriculture 124 (2016) 254–262
Acknowledgements
The authors are thankful for support from the North DakotaCorn Council, the International Plant Nutrition Institute, PioneerHi-Bred, Int., Inc. and the US-NSF grant funding agency, grant num-ber PFI-1114363 for partial support of this project.
References
Changgui, Z., Wenyi, F., 2007. Error effect of exterior orientation elements on treeheight measurement using space intersection theory. J. Northeast Forest. Univ.35, 86–91.
Dammert, P.B.G., Askne, J., 1998. Interferometric tree height observations in borealforests with SAR interferometry. In: Proceedings of the IEEE InternationalGeoscience and Remote Sensing Symposium, Seattle, WA, USA, pp. 1363–1366.
Fargo, N.D., Franzen, M.D., 2012. A Program for Categorizing Active-Optical SensorTxt Data with Excel. Unpublished program. North Dakota St. Univ., Fargo, ND.
Franzen, D.W., 2010. North Dakota Fertilizer Tables and Equations. North Dakota St.Univ. Ext. Circ. SF-882.
Franzen, D.W., Wagner, G., Sims, A., 2003. Application of a ground-based sensor todetermine N credits from sugarbeet. In: Sugarbeet Research and ExtensionReports. Sugarbeet Research and Education Board of Minnesota and NorthDakota, Fargo, ND, vol. 34, pp. 119–123.
Franzen, D.W., Sharma, L.K., Bu, H., 2014. Active Optical Sensor Algorithms for CornYield Prediction and a Corn Side-dress Nitrogen Rate Aid. NDSU ExtensionCircular SF1176-5. <http://www.ag.ndsu.edu/pubs/plantsci/soilfert/sf1176-5.pdf> (accessed 12.2015).
Freeman, K.W., Girma, K., Arnall, D.B., Mullen, R.W., Martin, K.L., Teal, R.K., 2007. By-plant prediction of corn forage biomass and nitrogen uptake at various growthstages using remote sensing and plant height. Agron. J. 99, 530–536.
Gelderman, R.H., Beegle, D., 1998. Nitrate-nitrogen (Revised January 1998). In:Brown, J.R. (Ed.), Recommended Chemical Soil Test Procedure for the NorthCentral Region. North Central Regional Res. Pub. No. 221 (2015 revised).Missouri Agricultural Experiment Station Bulletin SB 1001, Univ. of Missouri,Columbia, pp. 5.1–5.4. <http://extension.missouri.edu/explorepdf/specialb/sb1001.pdf> (accessed 1.25.2016).
Gitelson, A.A., Merzlyak, M.N., 1997. Remote estimation of chlorophyll content inhigher plant leaves. Int. J. Rem. Sens. 18, 2691–2697.
Haboudane, D., Miller, J.R., Pattey, E., Zarco-Tejada, P.J., Strachan, I.B., 2004.Hyperspectral vegetation indices and novel algorithms for predicting greenLAI of crop canopies: modeling and validation in the context of precisionagriculture. Rem. Sens. Environ. 90, 337–352.
Han, D., 2011. Tree height measurement based on image processing with 3-pointscorrection. In: Proceedings of the International Conference on ComputerScience and Network Technology, Harbin, China, pp. 2281–2284.
Holland, K.H., Schepers, J.S., 2010. Derivation of a variable rate nitrogen applicationmodel for in-season fertilization of corn. Agron. J. 102, 1415–1424.
Hussain, I., Olson, K.R., Ebelhar, S.A., 1999. Impacts of tillage and no-till onproduction of maize and soybean on an eroded Illinois silt loam soil. Soil TillageRes. 52, 37–49.
Kanuma, T., Ganno, K., Hayashi, S., Sakaue, O., 1998. Leaf area measurement usingstereo vision. In: Proc. of the 3rd IFAC/CIGR Workshop on Artificial Intelligencein Agriculture, Makuhari Messe, Chiba, Japan, pp. 157–162.
Kapusta, G., Krausz, R.F., Matthews, J.L., 1996. Corn yield is equal in conventional,reduced, and no tillage after 20 years. Agron. J. 88, 812–817.
Katsvairo, T.W., Cox, W.J., Van Es, H.M., 2003. Spatial growth and nitrogen uptakeavailability of corn at two nitrogen levels. Agron. J. 95, 1000–1011.
Kitchen, N., 2006. Variable-rate nitrogen fertilizer application in corn using in-fieldsensing of leaves and canopy. Agronomy Technical Note MO-35. University ofMissouri, Columbia, MO.
Kladivko, E.J., Griffith, D.R., Mannering, J.V., 1986. Conservation tillage effects on soilproperties and yield of corn and soya beans in Indiana. Soil Tillage Res. 8, 277–287.
Kwak, D., Lee, W., Lee, J., Biging, G.S., Gong, P., 2007. Detection of individual treesand estimation of tree height using LiDAR data. J. Forest. Res. 12, 425–434.
Li, D., Liu, H., Qiao, Y., Wang, Y., Cai, Z., Dong, B., Shi, C., Liu, Y., Li, X., Liu, M., 2013.Effects of elevated CO2 on the growth, seed yield, and water use efficiency ofsoybean (Glycine max (L.) Merr.) under drought stress. Agric. Water Manage.129, 105–112.
Lindsay, W.L., Norvell, W.A., 1978. Development of a DTPA soil test for zinc, iron,manganese, and copper. Soil Sci. Soc. Am. J. 42, 421–428.
Lines, J.A., Tillett, R.D., Ross, L.G., Chan, D., Hockaday, S., McFarlane, N.J.B., 2001. Anautomatic image-based system for estimating the mass of freeswimming fish.Comput. Electron. Agr. 31, 151–168.
Machado Jr., S., Bynum, E.D., Archer, T.L., Lascano, R.J., Wilson, L.T., Bordovsky, J.,2002. Spatial and temporal variability of corn growth and grain yield:implications for site-specific farming. Crop Sci. 42, 1564–1576.
Magnussen, S., Eggermonth, P., Riccia, V.L., 1999. Recovering tree heights fromairborne LIDAR data. J. For. Sci. 45, 407–422.
Martin, K.L., Raun, W.R., Solie, J.B., 2012. By-plant prediction of corn grain yieldusing optical sensor readings and measured plant height. J. Plant Nutr. 35,1429–1439.
Matsuura, Y., He, D., Kozai T., 2001. Development of a Transplant PopulationAnalysis System. ASAE Paper No. 01-7051. ASAE, St. Joseph, MI.
Morden, R.E., Ling, P.P., Giacomelli, G.A., 1997. An Automated Plant GrowthMonitoring Systems Using Machine Vision. ASAE Paper No. 974033. ASAE, St.Joseph, MI.
Nilsson, M., 1996. Estimation of tree heights and stand volume using an airborneLIDAR system. J. Rem. Sens. Environ. 56, 1–7.
Olsen, S.R., Cole, C.V., Watanabe, F.S., Dean, L.A., 1954b. Estimation of AvailablePhosphorus in Soils by Extraction with Sodium Bicarbonate. USDA Circular 939.U.S. Government Printing Office, Washington, D.C..
Persson, Å., Holmgren, J., Söderman, U., 2002. Detecting and measuring individualtrees using an airborne LIDAR. Photogramm. Eng. Rem. Sens. 68, 925–932.
Raun, W.R., Solie, J.B., Johnson, G.V., Stone, M.L., Lukina, E.V., Thomason, W.E.,Schepers, J.S., 2001. In-season prediction of potential grain yield in winterwheat using canopy reflectance. Agron. J. 93, 131–138.
Raun, W.R., Solie, J.B., Johnson, G.V., Stone, M.L., Mullen, R.W., Freeman, K.W.,Thomason, W.E., Lukina, E.V., 2002. Improving nitrogen use efficiency in cerealgrain production with optical sensing and variable rate application. Agron. J. 94,815–820.
Raun, W.R., Solie, J.B., Stone, M.L., Martin, K.L., Freeman, K.W., Mullen, R.W., 2005.Optical sensor-based algorithm for crop nitrogen fertilization. Commun. SoilSci. Plant Anal. 36, 2759–2781.
Sadler, E.J., Bauer, P.J., Busscher, W.J., 2000. Site-specific analysis of a droughtedcorn crop: I. Growth and grain yield. Agron. J. 92, 395–402.
Sammis, T.W., Smeal, D., Williams, S., 1988. Predicting corn yield under limitedirrigation using plant height. Trans. ASAE 31, 830–838.
Schulte, E.E., Hopkins, B.G., 1996. Estimation of soil organic matter by weight-loss-on ignition. In: Magdoff, F.R. et al. (Eds.), Soil Organic Matter: Analysis andInterpretation. SSSA Special Publication 46. SSSA, Madison, WI, pp. 21–31(Chapter 3).
Sharma, L.K., Franzen, D.W., 2013. Use of corn height to improve relationshipsbetween active optical sensor readings and yield estimates. Prec. Agric. 15, 331–345.
Sharma, L.K., Franzen, D.W., 2014. Use of corn height to improve the relationshipbetween active optical sensor readings and yield estimates. Precision Agric. 15,331–345. http://dx.doi.org/10.1007/s11119-013-9330-9.
Shimada, M., Muhtar, Q., Tadono, T., Wakabayashi, H., 2001. Tree height estimationusing an airborne L-band polarimetric interferometric SAR. In: Proceedings ofthe IEEE International Geoscience and Remote Sensing Symposium, Australia,Sydney, pp. 1430–1432.
Shrestha, D.S., Steward, B.L., 2001. Automatic Corn Plant Population MeasurementUsing Machine Vision. ASAE Paper No. 01-1067. ASAE, St. Joseph, MI.
Shrestha, D.S., Steward, B.L., Birrell, S.J., Kaspar, T.C., 2002. Plant height estimationusing two sensing systems. In: Proceedings of the ASAE Annual InternationalMeeting, 2002. CD-ROM, St. Joseph, MI.
Soil Survey Staff, 2013. Natural Resources Conservation Service, USDA, Web SoilSurvey Available online at <http://websoilsurvey.nrcs.usda.gov/> (accessed 08/15/2013).
Tarbell, K.A., Tcheng, D.K., Reid, J.F., 1991. Corn growth and development attributesobtained using inductive learning techniques. Trans. ASAE 34 (5), 2264–2271.
Tarbell, K.A., Reid, J.F., 1991. A computer vision system for characterizing corngrowth and development. Trans. ASAE 34 (5), 2245–2255.
Thomas, G.W., 1982. Exchangeable cations. In: Page, A.L. et al. (Eds.), Methods ofSoil Analysis. Part 2 (Agronomy Monographs 9). ASA and SSSA, Madison, WI, pp.159–165.
Ulander, L.M.H., Dammert, P.B.G., Hagberg, J.O., 1995. Measuring tree height usingERS-1 SAR interferometry. In: Proceedings of the IEEE International Geoscienceand Remote Sensing Symposium, Firenze, Italy, pp. 2189–2193.
Van Henten, E.J., Bontsema, J., 1995. Non-destructive crop measurement by imageprocessing for crop growth control. J. Agric. Eng. Res. 61, 97–105.
Venuprasad, R., Sta Cruz, M.T., Amante, M., Magbanua, R., Kumar, A., Atlin, G.N.,2008. Response to two cycles of divergent selection for grain yield underdrought stress in four rice breeding populations. J. Field Crops Res. 107, 232–244.
Watson, D., Brown, J.R., 1998. pH and lime requirement. In: Brown, J.R. (Ed.)Recommended Chemical Soil Test Procedure for the North Central Region.North Central Regional Res. Pub. No. 221 (2015 revised). Missouri Agric. Exp.Stat. SB 1001, Univ. of Missouri, Columbia, pp. 13.
Wilhelm, W., Ruwe, K., Schlemmer, M.R., 2000. Comparison of three Leaf Area IndexMeters in a Corn Canopy. Publication from USDA-ARS/UNL Faculty Paper 71.<http://digitalcommons.unl.edu/usdaarsfacpug/71>.
Yamamoto, K., Takahashi, T., Miyachi, Y., Kondo, N., Morita, S., Nakao, M., Takashi, S.,Shibayama, T., Takaichi, Y., Tsuzuku, M., 2011. Estimation of mean tree heightusing small-footprint airborne LiDAR without a digital terrain model. J. Forest.Res. 16, 425–431.
Yin, X., Jaja, N., McClure, M.A., Hayes, R.M., 2011a. Comparison of models inassessing relationship of corn yield with plant height measured during early- tomid-season. J. Agr. Sci. 3, 14–24.
Yin, X., McClure, M.A., Jaja, N., Tyler, D.D., Hayes, R.M., 2011b. In-season predictionof corn yield using plant height under major production systems. Agron. J. 103,923–929.
Zhang, L., Grift, T.E., 2012. A LIDAR-based crop height measurement system forMiscanthus giganteus. Comput. Electron. Agr. 85, 70–76.
Zhang, J., Huang, X., 2009. Measuring method of tree height based on digital imageprocessing technology. In: Proceedings of the First International Conference onInformation Science and Engineering, Nanjing, China, pp. 1327–1331.