computing the safety integrity level (sil) for turbo
TRANSCRIPT

Copyright© 2019 by Turbomachinery Laboratory, Texas A&M Engineering Experiment Station
COMPUTING THE SAFETY INTEGRITY LEVEL (SIL) FOR TURBO MACHINERY PROTECTION
Curtis (Curt) Miller General Manager / Principal Consultant SIS SILverstone LLC Houston, TX USA
Lil Kassie Rotating Equipment Consultant Superior Engineering Chicago, Indiana, USA
Mr. Miller has a P.E. in Control Systems and received his B.S. in Chemical Engineering from Texas A&M in 1986. He is a Certified Functional Safety Expert (CFSE) and has recorded 20,000+ hours in functional safety. He is further specialized in protection systems for turbo-machinery, including turbines, compressors, and reciprocating engines / compressors. He has participated in ISA84, AIChE, and API committees, has 20+ papers, and authored a book titled “Win/Win: A Manager’s Guide to Functional Safety”. He is a vetted instructor for CFSE and ISA EC50/52/54 (LOPA/SIS) courses.
Lil Kassie is presently an independent Rotating Equipment Consultant. He has been involved with the selection, sizing, installation, commissioning and maintenance of rotating equipment for over 45 years. For over 30 years he worked for BP/ Amoco in the following positions; Machinery Advisor, BP Refining - worldwide; Consultant, BP/ Amoco, US - Refining; Superintendent, Rotating Equipment Group, Amoco, Whiting Refinery, Whiting, IN. and Rotating Equipment Engineer at the same refinery. Prior to joining BP/ Amoco he worked for Ingersoll Rand Co, Philipsburg, NJ.as field engineer, in the Turbo Products Division, and for the ECI Refinery, East Chicago, IN. as Superintendent, Rotating Equipment. Lil holds a BS and MS in Mechanical Engineering from the University of Wisconsin and is presently a Member (Emeritus) on the Turbo Advisory Committee.
ABSTRACT
SIL has become the new standard by which industry, manufacturers, and end users will be held to by regulators as good engineering practice. Specifically supporting turbomachinery, the API670 “Machinery Protective Systems” (5th edition, 2014) [R1] standard has embraced such methodology.
To begin the presentation, background on risk assessment, SIL assignment, and API 670 will be reviewed. After it, common SIL assignments for various types of rotating equipment will be presented. he paper will then take a deeper look into what is important regarding the “SIL verification calculations” based on common interlocks. Such calculations are required to quantify that the probability of failure-average (PFDavg) of the system design meets the SIL assigned earlier in the risk assessment.
Since not all of the key factors that affect SIL calculations are intuitively obvious, the authors will break down the SIL calculation models and discuss each parameter in detail. After this model foundation is set, the combined effect of an interlock’s design including components (i.e. data), architecture, and maintenance practices will be shown.
Lastly, various examples utilizing a cross-section of equipment configurations will help reinforce such SIL calculation principles.

Copyright© 2019 by Turbomachinery Laboratory, Texas A&M Engineering Experiment Station
INTRODUCTION
Tutorials are a highly effective method of transferring knowledge and may be used as an important means of imparting learning. The focus of this tutorial is on the specifics of the SIL calculations. Each safety instrumented function (SIF) design must be verified through probabilistic calculations to meet their risk bases SIL target. (See ISA61511 Clause 11.9.1) The key here is to do the probabilistic calculations for each SIF which will verify safety and spurious trip performance criteria as well as optimize design to economically meet the requirements for each different function. The spurious trip discovery could be quite significant for plant production where it has been stated that up to 18% of plant trips are associated with instrumentation.
BACKGROUND ON RISK MANAGEMENT AND APPLICATION OF SIL
The SIL lifecycle starts with an operating company’s hazard assessment to determine if there are any risk gaps. The original methodology was to utilize qualitative processes, but these have now been updated to more quantitative processes. A review of this progression follows in the next sections.
Qualitative Techniques for Risk Mitigation
Process Hazard Assessment (PHA) is a systematic way to identify all potential hazards for a facility so the risk team can determine how to manage each one. Generally speaking, HAZOPs are favored for their thoroughness with processes, since the whole plant is reviewed node-by-node, with a detailed set of guide words applied to each characteristic of the process. What-ifs, FMEAs, and Checklists are alternative PHA techniques used for many rotating equipment configurations.
The primary objective of the PHA studies was to identify the causes of potential safety and environmental hazards, as well as major operability problems. Based on the evaluated consequences and safeguards identified, the multi-disciplined PHA team will propose recommendations to reduce the risk and enhance operability to tolerable levels in compliance with each company’s risk criteria.
Quantitative Techniques for Risk Mitigation
Use of qualitative risk ranking tools is relatively simple, but unfortunately, it lead to inconsistencies between different PHA teams as well as having the potential to under or over-estimate the risk. For lower level risks, this is not generally a significant concern, however, for higher risks there is a need for management to be able to make better informed decisions using a more consistent basis. That requires a greater level of insight and is provided by more quantitative analysis techniques that determine if there is a risk or Safety Integrity Level (SIL) gap.
In layman terms, SIL refers to “orders of 10 risk reduction” as shown in the following table:
SIL Risk Reduction 1 > 10 factor 2 > 100 factor 3 > 1,000 factor
Table 1: SIL & Risk Reduction
After such risk targets are discovered, other Safety Life Cycle (SLC) processes are followed such as verification calculations to ensure that the Safety Instrumented Functions (SIFs) designs can achieve the necessary risk reduction.
SIL Determination Methods
There are various graphical and numerical techniques to determine the required SIL value to achieve a target risk goal. Those cited in ISA61511Application of Safety Instrumented Systems for the Process Industries [R3] follow in Table 2.

Copyright© 2019 by Turbomachinery Laboratory, Texas A&M Engineering Experiment Station
Annex Name Origin
A ALARP (As Low as Reasonably Practicable) UK B Semi-Quantitative USA C Safety Layer Matrix USA D Calibrated Risk Graph: Semi-Qualitative UK E Risk Graph: Qualitative Germany F Layer of Protection Analysis (LOPA) USA
Table 2: Different SIL Selection Methods
Each of these methods should give roughly the same answer if they're "calibrated" to the same tolerable risk. The real choice in technique depends more on what fits best with a company’s existing risk management philosophy and procedures. For each hazard, the SIL technique must take into account:
1. The corporations' tolerable limits 2. Full and mitigated consequences of each hazard 3. Root cause or initiating event frequency 4. Number and effectiveness of independent safeguards
If there's a gap between the tolerable and current hazard frequency (taking into account the applicable safeguards, but not the SIF), then added protection is required. It can be either a SIF or other layers of protection.
Common SIL Ratings for Rotating Equipment
As mentioned in the preceding section, the process of SIL assignment takes into account the end user’s risk target, consequence severity, initiating cause frequency, the number of safeguards, and the application of conditional modifiers, so the final SIL requirement can vary widely.
Utilizing the experience of the authors and a broad perspective of reviews, the following Table 3 offers a glimpse of what could be expected for critical rotating equipment.
SIL Target
Driver Application High Low Norm
Steam turbine Overspeed SIL2 SIL1 SIL1
Centrifugal Compressor
Anti-Surge SIL2 None 1 IPL Back flow Isolation SIL2 None SIL1
High Level SIL2 None SIL1 Gas turbine Light Off SIL2 SIL1 SIL1
Turbine Generator Overspeed SIL2 SIL2 SIL2
Reciprocating Compressor
High Level SIL2 None SIL1 HP discharge SIL2 None SIL1
Table 3: Common SIL Targets for Rotating Equipment
Naturally, each company must review each application individually to avoid either over- specification, or more imperative for safety, under-specification of turbomachinery SIL.

Copyright© 2019 by Turbomachinery Laboratory, Texas A&M Engineering Experiment Station
The Complete Functional Safety Lifecycle
Once an interlock has received the “SIL branding”, the ISA61511 standard requires that other SLC steps be followed diligently to ensure that both random and systematic failure is not introduced into its design and operability. Although the focus of this paper is the SIL calculations, the other steps include:
• Functional Safety Management • Safety Requirements Specification (SRS) • SIF Conceptual Design • SIL Verification Calculations • Validation Tests • Functional Safety Assessments (FSA) • Routine Periodic Tests / Maintenance • Management of Change/Decommissioning
SPECIFIC APPLICATIONS OF SIL WITHIN API670
Before getting into the details of SIL verification calculations, it was felt that a review of the API670 standard’s correlation to SIL would be helpful. It should also be noted that the 2014 standard is already being updated via committee at the time of this writing.
Although API Machinery Protection Standard API670 has been around since the 1980s, the November 2014 update adds over 150 pages of new content. The most notable changes are shown in the following Table 4:
Clause /Annex Specification
8 Electronic Overspeed -More detailed discussion 9 Surge detection (New)
10 ESD (New) K Surge Detection (New) L Safety Integrity Level (New) M Spurious Shutdowns (New) N Condition Monitoring (New) O Overspeed (New) P Recip Compressors (New) Q Wireless (New)
Table 4: New Clauses & Annexes in API670
Such additions support a cohesive strategy with the other process and machine functional safety standards.
Emergency Shutdown Device (ESD) and API670
The Emergency Shutdown Device (ESD) detailed in clause 10 is synonymous to the SIS detailed by ISA61511. By having such a “single brain” for supporting all the critical safety functions, the first requirement of consolidating all trip demands and ensuring “proper timing and sequencing for a safe shutdown” is met.
There is latitude on whether all the shutdown logic is performed in the ESD. If such functions are included in the ESD, then it is termed “Integrated Architecture”. If it is not and separate surge, monitoring, and overspeed systems are tied to the ESD through hardwiring or communications, the overall system is considered to have “distributed architecture”.
Annex L – Safety Integrity Level
Copyright© 2019 by Turbomachinery Laboratory, Texas A&M Engineering Experiment Station
Annex L provides a 17-page introduction of the SIL concepts and correlates their application to turbomachinery standards. Although the risk graph methodology is not as prevalent in the USA as it is in Europe, its principles still apply to those that have standardized on LOPA as mentioned earlier.
Key takeaways from this SIL annex include:
• SIL compliance, although associated directly to the ESD logic solver, should be extended to the I/O devices • Separation of control and safety is imperative • SIL is determined by performance requirements set by each user, not by prescriptive methods
Such practices line up closely with those of the currently functional standards like ISA61511.
Annex M – Spurious Shutdowns
Since safe, fault tolerant methods with higher spurious trip rates may at times oppose process uptime (i.e. machine reliability), this annex “recommends some practice to reduce the risk of economic losses”.
Key takeaways from this spurious trip annex include:
• Utilization of fault tolerant designs for safety and reliability • Applying preventative diagnostics where applicable
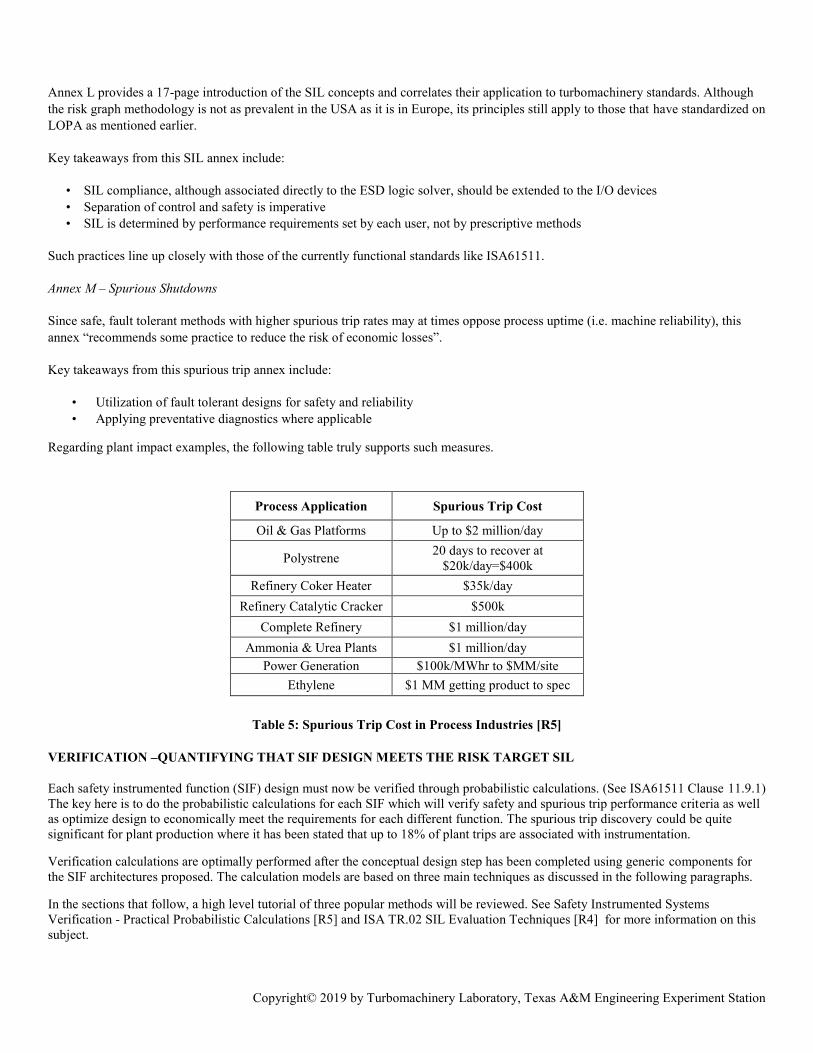
Regarding plant impact examples, the following table truly supports such measures.
Process Application Spurious Trip Cost
Oil & Gas Platforms Up to $2 million/day
Polystrene 20 days to recover at $20k/day=$400k
Refinery Coker Heater $35k/day Refinery Catalytic Cracker $500k
Complete Refinery $1 million/day Ammonia & Urea Plants $1 million/day
Power Generation $100k/MWhr to $MM/site Ethylene $1 MM getting product to spec
Table 5: Spurious Trip Cost in Process Industries [R5]
VERIFICATION –QUANTIFYING THAT SIF DESIGN MEETS THE RISK TARGET SIL
Each safety instrumented function (SIF) design must now be verified through probabilistic calculations. (See ISA61511 Clause 11.9.1) The key here is to do the probabilistic calculations for each SIF which will verify safety and spurious trip performance criteria as well as optimize design to economically meet the requirements for each different function. The spurious trip discovery could be quite significant for plant production where it has been stated that up to 18% of plant trips are associated with instrumentation.
Verification calculations are optimally performed after the conceptual design step has been completed using generic components for the SIF architectures proposed. The calculation models are based on three main techniques as discussed in the following paragraphs.
In the sections that follow, a high level tutorial of three popular methods will be reviewed. See Safety Instrumented Systems Verification - Practical Probabilistic Calculations [R5] and ISA TR.02 SIL Evaluation Techniques [R4] for more information on this subject.
Copyright© 2019 by Turbomachinery Laboratory, Texas A&M Engineering Experiment Station
Verification Technique 1: Simplified Equations
Simplified calculations have been derived using basic calculus methods where you would get the integral average of the probability function, PF(T).
For instance, for a 1oo2 component voting system:
PF(T) ≈ λd * T (where PF<0.1) for one component (T=test interval, λd = dangerous failure rate)
Then for two components where we multiply probabilities:
PF(T, 2 devices) ≈ (λd*T)( λd*T) = λ2d*T2 assuming identical
The integral average function is:
PFDavg = 1/T * ∫ PF(t)dt
So if we substitute the PF(T, 2 devices) above:
PFDavg = 1/T * ∫ λ2d*T2 dt
Then if we integrate, we get:
PFDavg = 1/T * [λ2d * T3/3] = λ2d * T2/3
As an example, if T = 2 years, and λd=1/20 years for a pressure switch:
PFDavg = (1/20)2*22 /3 = 3.33E-3, or alternatively, Risk Reduction Factor (RRF) = 1/PFDavg = 300
That may have seemed simplified, but the complete equation, accounting for online partial testing, imperfect proof tests, and common cause can become more daunting. This is the formula for such a case and is expressed as:
PFDavg = λ2dd * (RT+TIPT/2)2 [partial test contribution] + λ2d * T2/3 [base contribution, derived above] + λ2dn * T2LT/3 [imperfect test contribution] + (β*λd*T/2) + (β*λdn*TLT) [common cause adds]
Where: λdd = Partial test failure effectiveness, RT= Online repair time, TIPT=Partial test frequency, λdn = Failures never detected due to imperfect test TLT = Lifetime (mission) time before rebuild/replace β = Common cause, lowered w/diversity/separation
Verification Technique 2: Fault Trees
Fault tree math is another method that practitioners use to perform their SIL verification analysis. It utilizes the OR and AND gate math principles that most engineers picked up during college in general programming classes.
The math is quite simple; addition is applied to OR (symbol- ) and multiplication is used for AND (symbol- ) gates. These rules apply for standard probabilities, but for PFDavg, you cannot just multiple the individual component’s average or you would have an optimistic answer. To overcome such an issue, a conservative averaging of multiple time iterations of the standard probability will yield a conservative answer.
This methodology was applied to the 1oo2 example applied in the last section on simplified equations. Its graphical depiction is as follows:

Copyright© 2019 by Turbomachinery Laboratory, Texas A&M Engineering Experiment Station
Figure 1: Fault Tree for 1oo2 Voting Sensors
In this case, again with identical components, the 1oo2 pressure switch probability would be:
PF(T) ≈ (λd * T)( λd*T) = (λd*T)2.
The results are shown in the following table based on 1 month time increments:
Increment T (yr) λd λd * T (λd*T)2
1 0.083 0.05 0.00417 0.00002 2 0.167 0.05 0.00833 0.00007 3 0.250 0.05 0.01250 0.00016 4 0.333 0.05 0.01667 0.00028 5 0.417 0.05 0.02083 0.00043 6 0.500 0.05 0.02500 0.00063 7 0.583 0.05 0.02917 0.00085 8 0.667 0.05 0.03333 0.00111 9 0.750 0.05 0.03750 0.00141
10 0.833 0.05 0.04167 0.00174 11 0.917 0.05 0.04583 0.00210 12 1.000 0.05 0.05000 0.00250 13 1.083 0.05 0.05417 0.00293 14 1.167 0.05 0.05833 0.00340 15 1.250 0.05 0.06250 0.00391 16 1.333 0.05 0.06667 0.00444 17 1.417 0.05 0.07083 0.00502 18 1.500 0.05 0.07500 0.00563 19 1.583 0.05 0.07917 0.00627 20 1.667 0.05 0.08333 0.00694 21 1.750 0.05 0.08750 0.00766 22 1.833 0.05 0.09167 0.00840 23 1.917 0.05 0.09583 0.00918 24 2.000 0.05 0.10000 0.01000
Total 0.08507 Avg 0.00354 RRF 282
Table 6: Fault Tree Example PFDavg for 1oo2 Sensors
Overall, the PFDavg is comparable to the simplified example. If smaller time increments had been taken, specifically in the early periods, a closer approximation would have resulted.

Copyright© 2019 by Turbomachinery Laboratory, Texas A&M Engineering Experiment Station
Verification Technique 3: Markov Models
Markov modeling techniques were developed by Andrey Markov, a Russian mathematician, over a 100 years ago. They utilize graphical pictorials which show the state (represented by a circle) and probability transitions (represented by an arc). These pictorials are then translated to matrix arrays which can then be solved by applying time iterations to yield discrete approximations for PFDavg.
For the 1oo2 system example we have applied in the last two section, the Markov graphic would look like this:
Figure 2: Markov State Diagram for 1oo2 Voting Sensors
The probability “transition matrix”, where the system degrades from state A, then to B, and finally to C would look like this:
┌ ┐ │ (1-2PF) 2PF 0 │ │ 0 (1-PF) PF │ │ 0 0 1 │ └ ┘
The “state matrix”, which would be the current state of the system and probability in any of the states A, B, or C at different iterations would be depicted by:
┌ ┐ │ SA SB SC │ └ ┘
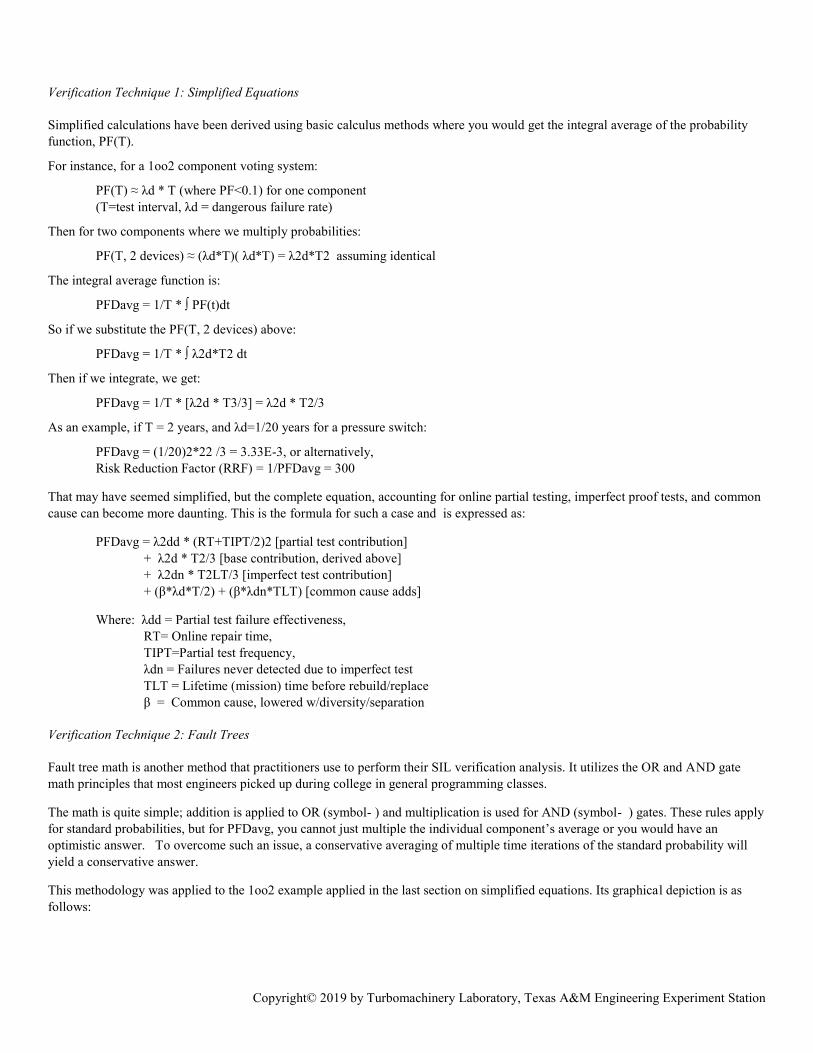
Matrix multiplication is then applied to the state matrix and transition matrix. Naturally, with Microsoft Excel™, such a feat is easily accomplished utilizing 2400 increments. The result table is shown below:
Copyright© 2019 by Turbomachinery Laboratory, Texas A&M Engineering Experiment Station
:
λd = 0.05 /yr 9.999E-01 8.33E-05 00 9.9996E-01 4.17E-050 0 1
Increment StateA StateB StateC0 1.0000 0.0000 0.00E+001 0.9999 0.0001 0.00E+002 0.9998 0.0002 3.47E-093 0.9998 0.0002 1.04E-084 0.9997 0.0003 2.08E-085 0.9996 0.0004 3.47E-086 0.9995 0.0005 5.21E-087 0.9994 0.0006 7.29E-088 0.9993 0.0007 9.72E-089 0.9993 0.0007 1.25E-0710 0.9992 0.0008 1.56E-0711 0.9991 0.0009 1.91E-0712 0.9990 0.0010 2.29E-0713 0.9989 0.0011 2.71E-0714 0.9988 0.0012 3.16E-0715 0.9988 0.0012 3.64E-0716 0.9987 0.0013 4.16E-0717 0.9986 0.0014 4.72E-07: :
2395 0.8191 0.1719 9.01E-032396 0.8191 0.1719 9.02E-032397 0.8190 0.1720 9.02E-032398 0.8189 0.1720 9.03E-032399 0.8189 0.1721 9.04E-032400 0.8188 0.1722 9.05E-03
7.41840.003091323.519
TotalAvgRRF
Transition Matrix
State Matrix
Table 7: Markov Example PFDavg for 1oo2 Sensors
Once more, a comparable answer to the simplified equation is achieved.
The Complete SIF SIL Verification Calculation
As with other designs, the SIF is only as strong as its weakest component. For the calculations performed in this section, only one component was calculated. To get the complete SIF PFDavg, one must add the PFDavg of all devices. Stated in a formula, see the following:
PFDavg(Complete SIF) = PFDavg (Sensors) + PFDavg(Logic Solver) + PFDavg (Final Element)
What to Do when SIL RRF Targets are not Attained??
If calculations show that the draft design does not meet the SIL target, the choices are:
1. Shorten the testing interval, but not beyond the practical point for operations 2. Shorten the maintenance interval 2. Select better technology/equipment. 3. Add redundancy, fault tolerance, or other IPLs
The conceptual design iterations will continue until the SIL or risk reduction target is met with the overall most economical system.

Copyright© 2019 by Turbomachinery Laboratory, Texas A&M Engineering Experiment Station
SIL Verification Calculations – Software Example
Although the SIL verification calculations can be completed by hand with techniques previously reviewed (e.g. Simplified equations, Markov models, and Fault Tree Analysis), most functional safety professionals prefer to use off-the-shelf tools. Shown below is the output of such software.
Figure 3: SIL Verification Analysis Output

Copyright© 2019 by Turbomachinery Laboratory, Texas A&M Engineering Experiment Station
SUMMARY OF INFORMATION REQUIRED AND COMMON ASSUMPTIONS FOR SIL CALCULATIONS
Up to this point in the paper, some general information requirements have been presented. Namely, the minimum parameters that a functional safety practitioner needs to get started as shown in the calculation techniques include:
1. Component technology (Sensor, Logic Solver, Final Elements) 2. Component Voting (Redundancy/Fault tolerance) 3. Periodic test frequency 4. Maintenance intervals
Expanded List of Key Parameters for Optimized Calculations
For precise calculations, additional parameters will have to be applied to take advantage of the full functional safety principles and technology options. A comprehensive listing with short descriptions of each are as follows:
1. Diagnostic Alarm Setting - Option applicable for analog devices only. It allows you to indicate if upon detection of an internal failure, a Failed Detected fault, the analog output is driven over range or under range.
2. Architectural Constraints – ISA61511 requirements based on failure rates, modes, & diagnostics. Use IEC61508 normally except when have “Proven In Use” justification of the SIF components (e.g. documentation)
3. Beta (β)-Factor – Common cause factor for redundant components. Generally ranges from 2-10% 4. Control System - Assumed to be independent of the current SIFs (i.e. DCS or separate PLC) 5. Demand Rate – Low if SIF tested 2+times before process demand. If activated often, may be high/continuous 6. Diagnostic Filtering – How a transmitter and PLC handle diagnosed failures 7. External Comparison – Diagnostic monitoring of the dynamic signals between the control and SIF 8. Interface Components – Must specify other devices (e.g. voltage isolators, safety barriers, modulators, etc.) in SIF loop 9. Mission Time – Operational time of component to be either replaced or refurbished to “like new 10. MTTR (Mean time to repair) - Indicates expected time to repair the equipment items in the group in case of a detected failure 11. Proof Test Coverage – No proof tests are 100% effective in finding all failures. Coverage is based upon the specific SIS
components parts and testing methods applied (Exida “Proof Test Generator” was used in this analysis and the specific manufactures testing methods or better must be followed)
12. Proof Test Interval (PTI) - Period of time in which components are regularly tested. Is important in calculations 13. Redundancy/Voting – How multiple devices within a SIF react together Examples:
a. Sensor (1oo1: Single device, 1oo2: either will cause trip, 2oo2: both needed to trip) b. Final Element (1oo1: Single device, 1oo2: two valves in series, 2oo2: two valves in parallel)
14. Startup Time - Time in hours required to restart the process after a shutdown. 15. Process Connection – Sensor tie-in either (1) remote seal, (2) clean, or (3) dirty tap (low, med, high pluggage) 16. Trip Setting - Depending on the low or high trip setting and the Alarm Setting and Diagnostic Filtering, a Low Failure will
either be classified safe or dangerous, detected or undetected.
Common Assumptions Made for SIL Calculations
Within the parameters mentioned above, functional safety engineers will normally apply a starting basis to be confirmed. A standard listing of common assumptions includes:
1. Control System: The control system is assumed to be independent of the current SIFs (e.g. DCS). 2. Mission Time: Typically assumed to be fifteen (15) to twenty (20) years 3. Startup Time: Normally assumed to be twenty-four (24) hours for most facilities. 4. Failure rates for SIF components: Specific data will be applied where available. In situations where no specifics were
available, “generic” data used for the calculations. 5. Proof Test Interval (PTI): Testing interval that has been used for all devices in the study as provided by the client. 6. Proof Test Coverages: Estimates normally based upon reliability studies (i.e. Failure Modes, Effects, and Diagnostic
Analysis) of components selected.

Copyright© 2019 by Turbomachinery Laboratory, Texas A&M Engineering Experiment Station
7. Beta (β)-Factor: In initial studies, β-factor used for multiple sensor and final element components is a conservative 10%. 8. MTTR: Conservative times 72 hours are generally used 9. Architectural Constraint Requirements: Each safety function must meet minimum hardware fault tolerance (HFT) based on
the target SIL requirement listed in the architectural constraint table. (11.4.1) This design element was included to provide an extra layer of protection to address the uncertainty in the failure rate of the various system components.
10. SIL Capable Device Utilization: Devices that are either certified to IEC 61508 or based on "prior use" (Clause11.5.3) must be used to meet this requirement. Although many will choose certified components just because they don’t have a good device reliability database and since the certified equipment comes with its own approved data, either choice will require “usability” judgment based upon current installation time accumulated and specific application details.
EXAMPLE 1: SIL VERIFICATION APPLIED TO A HIGH HORSEPOWER STEAM TURBINE
These unique SIL processes were recently utilized on a critical high horsepower turbine application and will be generally discussed so that the overall safety lifecycle can be understood.
A. Performing SIL Verification to Prove that SIL2 was Attained for the Overspeed Trip
To prove that the overspeed trip met the SIL2 risk target, reliability calculations were performed as the next step in the functional safety lifecycle. Such calculations were based on the components selected, their voting architecture, diagnostics applied, and finally, testing and replacement intervals.
The specific components that made up the overspeed trip system included the magnetic pickup sensors, logic solver (i.e. Safety PLC or SIS), the trip & throttle shutoff valve, and any interface components in between. There initially was no concern in meeting the SIL2 target since the overspeed system applied SIL3 certified electronics and the final element was partial stroke tested.
Data for the certified devices was readily available in the vender’s product safety manuals. It should be noted that the two (2) commonly accepted functional safety assessment agencies include TUV and exida Certification and the standard adhered to is IEC61508 [R7].
Since the trip & throttle valve had not been certified and the manufacturer had no failure mode specific data, the SIS project engineer contracted a Failure Modes, Effects, and Diagnostics Analysis (FMEDA) from a third party consulting firm. This analysis was specific to the OEM’s valve assembly and therefore resulted in a precise, yet conservative data set to be used in the SIL verification calculations. Otherwise, conservative data based on generic components would have been used and the SIL2 risk target likely would not have been met.
Another SIL2 issue surfaced when an emergency trip device (ETD) was discovered in the turbine mechanical drawings. The ETD was critical to the overspeed trip since it acted as an interface component for dumping the hydraulic power fluid. Since it could not be tested by the partial stroke apparatus, it became a SIL2 limiter and the overspeed system became degraded to SIL1. Fortunately, the design team found an alternative solution to avoid adding an inline steam valve (~ $300k).
The team utilized a commercially available software platform to perform the calculations. SIL2 results were achieved by using partial stroke testing and accounting for specific overspeed failure modes where a significant leak was required to fit the scenario stated. The results are shown in Figure 4.

Copyright© 2019 by Turbomachinery Laboratory, Texas A&M Engineering Experiment Station
Figure 4: SIL Verification Tool Output for High HP Turbine
With the upgraded model, this overspeed trip met SIL2 and had a 7.15 year spurious trip rate.
B. Performing SIL Verification to Prove that SIL2 was Attained for the Vibration Trip
This vibration trip was another initiator for the larger turbine compressor. In this application, a major vendor had provided MTBF data for all the components in their system, but it was not granular to the level required by SIL calculations. (i.e. Not specific to failure modes (safe/dangerous) and diagnostic coverage.) Because the system was somewhat complex with a modular design, putting the data together was more cumbersome.
The table of assumption are included below in Table 8:

Copyright© 2019 by Turbomachinery Laboratory, Texas A&M Engineering Experiment Station
yrs hr %Safe %Dang Cd
Rack 49.2 2.32E-06 0.99 0.01 0.9
Power supply 76.0 1.50E-06 0.99 0.01 0.9
Prox Monitor 21.6 5.28E-06 0.60 0.40 0.8
Relay module 28.3 4.03E-06 0.60 0.40 0.8
I/O Cabling (Use 2oo2 setup w/10% Beta)
Cable 447.5 2.55E-07 0.00 1.00 0.9
Prox 50.9 2.24E-06 0.60 0.40 0.9
Probes 28.0 4.08E-06 0.00 1.00 0.9
6.57E-06 0.20
MTBF (provided)
1oo1 I/O totals
Assumed Safe/Dangerous
and diagnotic Coverages
Non-SIL Rated
Component
Listing
Table 8: Vibration Data & Assumed Coverages
With the above assumptions, the derived data to be utilized in the SIL calculations is listed below in Table 9.
λs (hrs-1) λdd (hrs-1) λdu (hrs-1)
Rack 2.30E-06 2.09E-08 2.32E-09
Power supply 1.49E-06 1.35E-08 1.50E-09
Prox Monitor 3.17E-06 1.69E-06 4.23E-07
Relay module 2.42E-06 1.29E-06 3.23E-07
9.38E-06 3.02E-06 7.49E-07
I/O Cabling (Use 2oo2 setup w/10% Beta)
Cable 0.00E+00 2.30E-07 2.55E-08
Prox 1.35E-06 8.07E-07 8.97E-08
Probes 0.00E+00 3.67E-06 4.08E-07
1.35E-06 4.71E-06 5.23E-07
1oo1 rack totals
1oo1 I/O totals
DerivedNon-SIL Rated
Component
Listing
Table 9: Derived Vibration Data to be Applied in Calculations
Since there was no vendor safety user’s manual with detailed information to support the system components, confirmation that the assumptions made was problematic.
Now that the data was available, it was time to setup the SIL models in the software. As prescribed by the process team, any of three (3) voting high vibration groups would mitigate the scenario stated in the PHA. Effectively, the SIS voting logic was 1oo3. For the vibration monitor to send a high-high vibration, though, it took both vibration probes reading high, so it was effectively 2oo2.
Given two (2) levels of voting (i.e. one for the probes & vibration monitor, another for the SIS PLC), the SIL calculation was split up. Starting with the 2oo2 probes, a SubSIF model yielded the following PFDavg shown in Figure 5:

Copyright© 2019 by Turbomachinery Laboratory, Texas A&M Engineering Experiment Station
Figure 5: Vibration Example – Probe SubSIF Calculation
This sensor PFDavg result was then utilized in the full calculation where three (3) such probe groups, each representing different locations on the turbine-compressor package, were voted to trip.
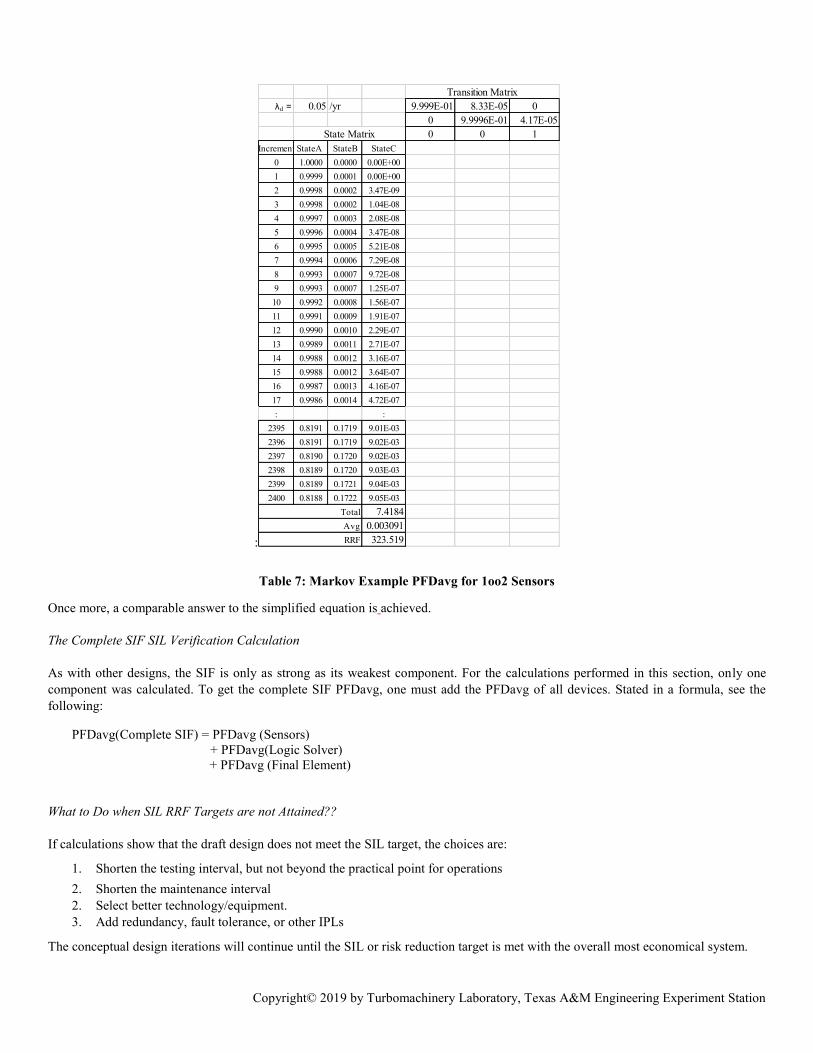
The overall SIF results are shown in the following Figure 6:
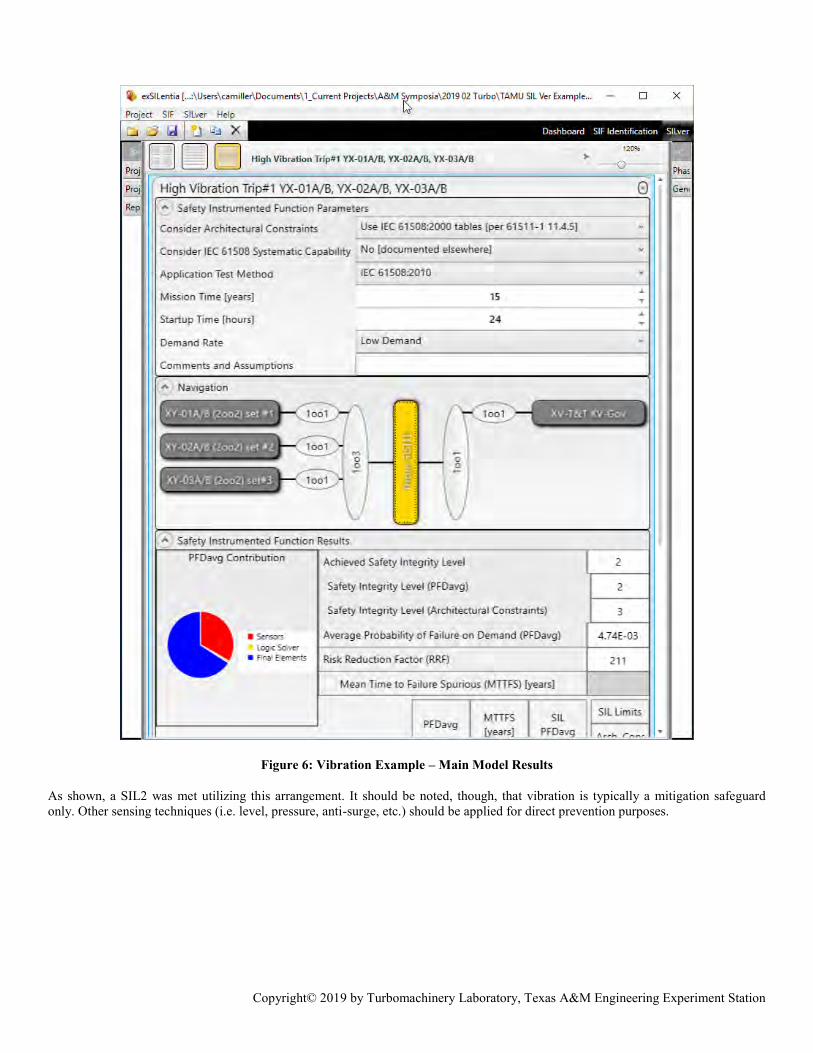
Copyright© 2019 by Turbomachinery Laboratory, Texas A&M Engineering Experiment Station
Figure 6: Vibration Example – Main Model Results
As shown, a SIL2 was met utilizing this arrangement. It should be noted, though, that vibration is typically a mitigation safeguard only. Other sensing techniques (i.e. level, pressure, anti-surge, etc.) should be applied for direct prevention purposes.

Copyright© 2019 by Turbomachinery Laboratory, Texas A&M Engineering Experiment Station
EXAMPLE 2: SIL VERIFICATION APPLIED MEDIUM VOLTAGE MOTOR FOR A HIGH PRESSURE REPROCATING COMPRESSOR TRIP
A calculation conundrum exists when data is not readily available to support the quantitative models. Such was the case when a 30-year-old vintage gas compression site was reviewed and SIL assessed utilizing the LOPA methodology as shown in the Figure below.
1PHA: Date 2/26/07
Hazard
IC # A B C D E F G #1 #2 #31 1 2.0E-03 1 2.0E-032 1 1.0E-04 1 1.4E-05
2.1E-03 2.0E-03
PFD
11
0.01
LOPA Scenario No.:
P&ID INLET XXX
Resulting ILCategory
Safety
Value
0.015 SIL1LOPA Result
Fail
Initiating Causes (IC)
A
Inlet Compression Site LOPA Worksheet
A
ICL*PFDs *
FMs
Summation (a) For Environmental & Commercial
Independent Protection Layers (IPLs) may be common to more than one initiating event
Applicable IPLs from List below Freq Mod Set
3.0E-05
Controller Type Shutdown Valve(s)
CategoryConsequence
Current Safety Instrumented Function (SIF)
An event resulting in 1 to 3 fatalities
High pressure trip PAHH-xxxxSensor(s)Functional Description
Modicon De-Energize MV motor
ICL * PFD
Recommendation(s)
LOPA Ratio (or PFD SIF if < 1.0)
Target IL
IPL Letter
Ops ResponsePSV1
BC
Frequency / yr
0.200.01ROV-205 spurious trip
(b) For Safety
PSV-387-1,2
Description of IPLCategory
BPCS
Existing SIF
Description
Verify to RRF of 68 SIL1
Description
Description
Manual valve is not fully open
TMEL (/yr)
Safety
DescriptionHAZOP Node 15 p101 HP Gas Separator Deviaton High Pressure High pressure potential for rupture w/ local H2S/NG release
TMEL (Target M itigated Event Likelihood)
Figure 7: LOPA for Compressor High Pressure Trip
Due to a high SIL1 RRF target of 68, precise data was needed to support potential changes such as upgrading hardware or maintenance frequency.
The specific SIF architecture included a pressure switch tied to the DCS with a relay interface to a medium voltage contactor. This SIF structure is pictorially represented by the following Figure:

Copyright© 2019 by Turbomachinery Laboratory, Texas A&M Engineering Experiment Station
Figure 8: Compressor High Pressure Trip Architecture
Data was available, at least in generic format, for both the pressure switch and the DCS controller, but not for the medium voltage (MV) contactor after checking with the vendor. Furthermore, neither the site nor the corporate enterprise had initiated a data collection program on similar device types, so an alternate path was required.
The MV contactor technology was studied and comparable information on a similar device provided a data basis. It was discovered that the MV contactor sequence of operation is as follows:
1. There is an electric motor that needed to be energized to charge a closing spring. 2. After charging the spring, the breaker can be operated by energizing a closing solenoid 3. The energized solenoid unlocks the closing mechanism operated by the energy stored in the closing spring. 4. When the closing spring operates the breaker, it charges an opening spring at the same time.
In other words, it can be simply modeled as an energized -to-trip (ETT) solenoid with spring contributions. The model was then updated utilizing the basis of a known ETT solenoid model.
The results of using the generic data for the pressure switch, DCS controller, and this comparable MV contactor data is shown below in Table 10:
Table 10: Compressor High Pressure Trip – Initial Results
As shown, the SIL achieved fell short with a SIL0 RRF of 8, so improvement was required. The easiest way to visualize what needed to be done was to look at the PFDavg “pie chart” contributions shown in Figure below:
Copyright© 2019 by Turbomachinery Laboratory, Texas A&M Engineering Experiment Station
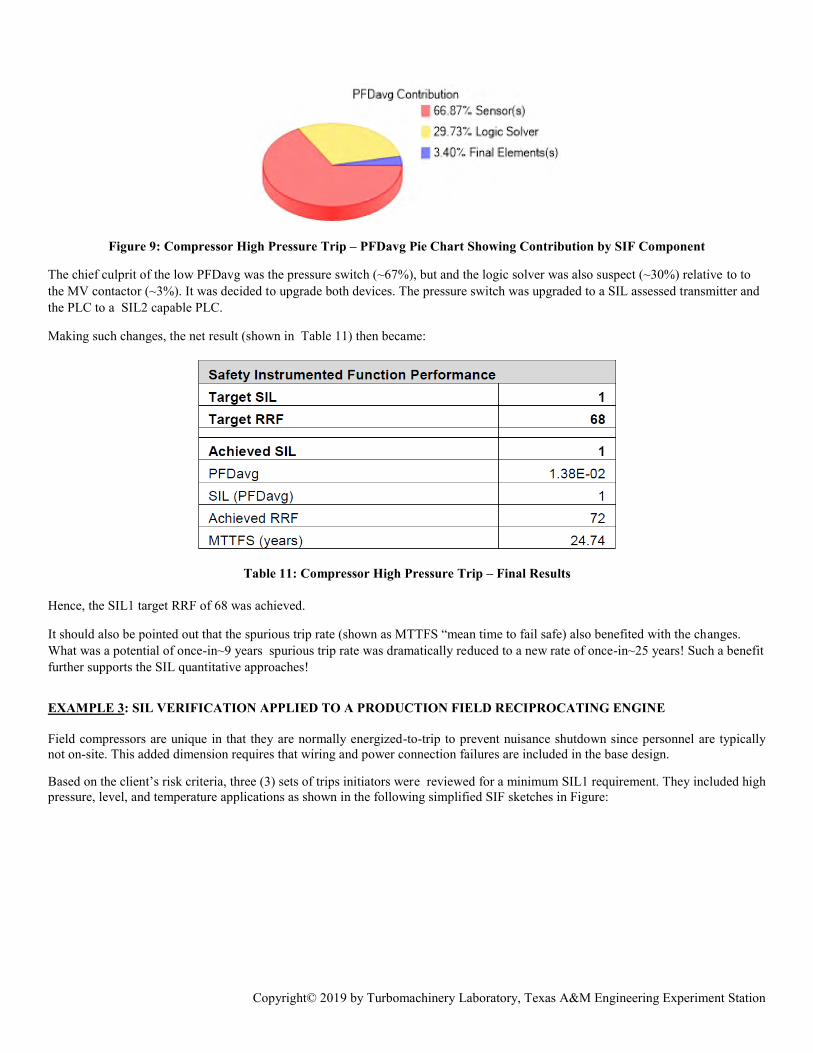
Figure 9: Compressor High Pressure Trip – PFDavg Pie Chart Showing Contribution by SIF Component
The chief culprit of the low PFDavg was the pressure switch (~67%), but and the logic solver was also suspect (~30%) relative to to the MV contactor (~3%). It was decided to upgrade both devices. The pressure switch was upgraded to a SIL assessed transmitter and the PLC to a SIL2 capable PLC.
Making such changes, the net result (shown in Table 11) then became:
Table 11: Compressor High Pressure Trip – Final Results
Hence, the SIL1 target RRF of 68 was achieved.
It should also be pointed out that the spurious trip rate (shown as MTTFS “mean time to fail safe) also benefited with the changes. What was a potential of once-in~9 years spurious trip rate was dramatically reduced to a new rate of once-in~25 years! Such a benefit further supports the SIL quantitative approaches!
EXAMPLE 3: SIL VERIFICATION APPLIED TO A PRODUCTION FIELD RECIPROCATING ENGINE
Field compressors are unique in that they are normally energized-to-trip to prevent nuisance shutdown since personnel are typically not on-site. This added dimension requires that wiring and power connection failures are included in the base design.
Based on the client’s risk criteria, three (3) sets of trips initiators were reviewed for a minimum SIL1 requirement. They included high pressure, level, and temperature applications as shown in the following simplified SIF sketches in Figure:

Copyright© 2019 by Turbomachinery Laboratory, Texas A&M Engineering Experiment Station
Figure 10: Reciprocating Engine Field Compressor
Starting with the engine logic solver, the vendor had a proprietary, non-SIL design, hence there was no failure rate data readily available. It was therefore modeled as a Generic Industrial PLC (simplex) using SERH data.
Regarding the shutdown final element actions, fault tolerant design allowed either closing the fuel valve or dropping out the ignition to stop engine. Such a voting architecture is considered “1oo2”. For their data, the following assumptions were applied:
o For the fuel valve: Generic air operated gate valve, driven by a Generic 3-way solenoid valve was assumed o For the ignition circuit: Thyristor data from a component failure rate data book was applied. This was appropriate since the
ignition system is a capacitor discharge (CD) type and is executed by grounding a specific SD ( i.e. “shorting dot”) terminal in the thyristor which likewise disconnects the alternator
The sensors then were then scrutinized. Generic pressure switch was used and an assumed dangerous failure rate of wiring/ connections as once every 100 years was added as required for the ETT design. Level switches were also applied for the level trips and a similar wiring/connections failure contribution was added.
Lastly, the temperature component makeup required finding suitable data. Generic thermocouple was applied for the elements and a Generic Analog Trip Amplifier was used to represent the temperature scanner. Since the scanner could detect an open thermocouple (executing trip), shorted TC and drift was assumed as dangerous failures within the calculations.
Based on such assumptions, all SIL1 targets were obtained as shown in the following Table.
SIL RRF SIL RRF
LSHH Trip High Scrubber Level Trip 1 10 1 26
PSHH Trip High Scrubber Pressure 1 10 1 20
TSHH Trip High Cylinder Discharge Temperature 1 10 1 15
AchievedTargetSIF Tag SIF Description
Table 12: Reciprocating Engine Field Compressor Results

Copyright© 2019 by Turbomachinery Laboratory, Texas A&M Engineering Experiment Station
CONCLUSIONS
The purpose of the SIL verification process is to substantiate that our SIL targets will conclusively be met by the SIF design and post-installation periodic testing and maintenance. In the past, not all systems were created equal and gaps could unknowingly exist.
Every project that employs such quantitative SIL verification techniques will gain valuable insight on what is required to keep their system in a ready-state and hopefully avoid both dangerous events and unnecessary downtime.
Such a message was supported by the late Trevor Kletz who specifically stated:
“Accidents are not due to the lack of knowledge, but failure to use the knowledge we have”
We should be keen to follow such wise advice!
ABBREVIATIONS
API – American Petroleum Institute DCS – Distributed Control System ESD – Emergency Shutdown Device IEC – International Electrotechnical Commission ISA – International Systems and Automation FMEA – Failure Modes and Effects Analysis (PHA method) FMEDA – Failure Modes, Effects, and Diagnostics Analysis (Component reliability technique) FSM – Functional Safety Management LOPA – Layer of Protection Analysis LSHH – Level Switch High High (trip) MTTFS – Mean time to Fail Safe (Spurious) PFDavg – Probability of Failure Dangerous – Averaged PSHH – Pressure Switch High High (trip) RRF – Risk Reduction factor (RRF=1/PFDavg) SERH – Safety Equipment Reliability Handbook (exida) SLC – Safety Lifecycle SIF – Safety Instrumented Function SIL – Safety Integrity Level
REFERENCES
[R1] API Standard 670, Machine Protection Systems, 5th edition, November 2014 [R2] 29 CFR Part 1910.119, Process Safety Management of Highly Hazardous Chemicals, U.S. Federal Register, Feb. 24, 1992,
http://www.osha.gov [R3] ANSI/ISA 61511, Application of Safety Instrumented Systems for the Process Industries, NC: Raleigh, ISA, 2018. [R4] ISA-TR84.00.02, Safety Instrumented Functions (SIF) - Safety Integrity Level (SIL) Evaluation Techniques (5 Parts) [R4] Goble, W. M. and Cheddie, Harry, Safety Instrumented Systems Verification -Practical Probabilistic Calculations, NC: Research
Triangle Park, ISA, 2005 [R5] Miller, Curtis, Win/Win: A Manager’s Guide to Functional Safety, 1st Edition, 2008 [R6] Out of Control: Why Control Systems go Wrong and How to Prevent Failure, U.K.: Sheffield, Health & Safety Executive, 1995 [R7] IEC 61508, Functional Safety of electrical / electronic / programmable electronic safety-related systems, Geneva: Switzerland,
2010