condition-assessment-based finite element modeling...
TRANSCRIPT

CONDITION-ASSESSMENT-BASED FINITE ELEMENT MODELING OF LONG-SPAN
BRIDGE BY MIXED DIMENSIONAL COUPLING METHOD
T. H. T. Chan a, b, Y. Yu b, c, K.Y. Wong d, Z. X. Li c
a School of Urban Development, Faulty of Built Environment & Engineering, Queensland University of Technology,
Queensland, Australia
b Department of Civil and Structural Engineering, The Hong Kong Polytechnic University, Hung Hom, Kowloon, Hong Kong
c College of Civil Engineering, Southeast University, Nanjing 210096, China
d Highways Department, The Hong Kong SAR Government, Hong Kong
Visual inspection has showed distinct limitations in practical application in condition assessment procedure of
large civil infrastructures. The real condition of structure thus greatly depends on an accurate finite element
model considering initial defects and deteriorating progress. For the purpose of fatigue damage evaluation of
these structures, usually a global structural analysis using a global FE model is first conducted to determine the
critical locations, based on which local analysis is then carried out to obtain the hot-spot stress distribution that is
commonly considered as the fundamental information for the condition assessment. Since the structural
characteristics behaved at the different scales, a mixed dimensional coupling method is obviously necessary and
implemented by merging typical detailed joint geometry model into the global model so that the hot-spot stress
could be directly output through a single step of analysis. As a case study, a multi-scale model of Tsing Ma
Bridge (TMB) is then developed by aforementioned coupling method. The comparison of dynamic
characteristics and static responses in term of first few natural frequencies and vertical displacement influence
line data respectively between the calculated results and monitoring data indicated that the mixed dimensional
coupling method adopted in this paper is convenient and appropriate, and even reliable and accurate for the
purpose of condition assessment of long-span bridge structures. The accumulative fatigue damage due to the
typhoon York showed that it is much severer than that caused by normal traffic loading, which indicated more
attentions should be made after these ultimate events occurred.
Keywords: Condition assessment, Mixed dimensional coupling, Multi-scale model, Large span bridge, Finite
element analysis, Fatigue damage, Ultimate events
1 INTRODUCTION
Nowadays there has been significant attention on structural health monitoring of engineering systems, especially focused
on the space/aerospace, mechanical, and automotive systems [1-3]. Served as a symbol of our present highly industrialized
society, civil infrastructure, which includes bridges and buildings, begins to deteriorate once they are built and used, and this
has drawn increasing attentions recently. It is important to determine the integrity of a structure in term of its age and usage,

and level of safety and reliability for daily use in order to prevent catastrophic events [4]. Bridges, an important component of
civil infrastructure, are normally designed to have a long life span. More and more in-service or to be built long-span bridges
are subjected to different and complicated variable-amplitude traffic loadings daily. Moreover, service loads, environmental
and accidental actions may cause damage to bridges. Continuous health monitoring or regular condition assessment of
important bridges is absolutely necessary so that early identification and localization of any potential damage and condition
assessment can be made.
We all expect a generic framework sharing many technologies and algorithms serving for health monitoring of civil
infrastructures. Civil engineers are especially cognizant of the limitations in their current practice for condition assessment
based on visual inspections. Besides regular condition assessment, typical routine applications of condition assessment are
carried out on bridges, buildings for evaluating seismic vulnerability or post-earthquake damage, and to all types of facilities
after overloading, accidents, or when codes or modes change. However, the community has been aware of the limitations and
shortcomings of visual inspection is that it is often very difficulty to establish the correlation between visual appearance and
structural reliability for safety [5]. Engineers need to know the actual cause of the damage or distress and its impacts on
structural reliability in order to make meaningful management decisions. Therefore, the practical procedure of condition
assessment is greatly reliance on a constructed finite element model [6] as closest to real condition as possible so that it is able
to account for the major effect of the damage, locally deteriorating processes and nonlinear influence on structural response. A
nonlinear model for the damaged structure is needed in order to accurately simulate damage behavior since the small changes
due to damage seems likely to be more identifiable for nonlinear effects [7].
On the other hand, the long-span bridge modeling is usually of the order of magnitude of kilometers while welded details
where damage and cracks initiated due to localized stress concentration are in meters. It is obviously impossible to numerically
model and analyze the global and local behavior of response and damage in a unified spatial scale. In practical numerical
analysis of such a large structure on the global level, the majority of FE models are usually constructed as a “fish-bone” model
which treats one component as one element with the lower dimensional type. However, for the purposes of fatigue analysis and
condition assessment, since the damage is typically a local phenomenon [8], more attentions should be paid on the local
detailed characteristics with the higher dimensional type elements which are not represented in the aforementioned global
model. In this sense, it would be desirable to combine the reduced or lower dimensional element types with higher ones in a
single model to simultaneously consider the structural responses at different spatial scale levels.
Therefore it is essential to develop a numerical method in multiple spatial scales for the damage analysis and condition
assessment of civil infrastructure considering structural deteriorating process. For the purpose of nonlinear fatigue damage
analysis and condition assessment of a long span bridge, an efficient multi-scale modeling strategy is proposed in this paper.
The mixed dimensional coupling method by constraint equations for the effective connection is first introduced, and then a
multi-scale model of the Tsing Ma Bridge (TMB) is accordingly developed. The constructed model is further verified on
dynamic characteristics and static responses by comparing the calculated values with measurement data with respect to the first
few natural frequencies and the vertical displacement influence line. Besides the routine damage analyzing procedures, the
verified model could also be used for condition assessment in term of accumulative fatigue damage due to ultimate events such
as typhoon in association with the structural health monitoring data. The increment of accumulative fatigue damage is
eventually evaluated by applying the modified linear Miner's law and is compared with that under the normal traffic condition.
2 MULTI-SCALE MODELING AND SCALE SHIFTING STRATEGY
2.1 Strategies of multi-scale modelling
In general, structural analysis is usually carried out at different scale levels for different purposes. As listed in Table 1[9],
for a large structure, the size of the model beam element is usually at the level of meter for global structural analysis.
Meanwhile, the beam element is also adopted at the centimeter level of component scale for nominal stress analysis.
Furthermore, the scale of material points, usually modeled with shell or solid elements, is commonly less than the level of a

millimeter for the local detailed hot-spot stress analysis. The major difficulties existing for each modeling scale method are the
strict limitations on structural analysis on their own scale level instead of considering the other scales. Although some
techniques such as transition element and mesh refinement have been applied in the modeling process and tried to make
connections between different scale levels, they are actually still at the same scale level without real solutions to the problem.
Table 1 Physical scales and available theories for numerical analysis for long-span bridges
Figure 1 A sketch of description on multi-scale modeling Figure 2 FE joint model by mixed dimensional coupling
The objective of multi-scale modeling is to construct the global model at the structural level and incorporate the local
concerned details of constitutional relationships for analytical purposes, and the local details could even be modeled layer by
layer if necessary as shown in Figure.1. All the modeling process should be concurrent and characteristics of corresponding
scale level must be taken into account at the same time. In particularly with no loss of generality, the linear analysis could be
performed at the global model of structural elements and the corresponding linear responses can be obtained while nonlinear
analysis must be considered to simulate the nonlinear behavior in local detailed models of higher levels.
2.3 Mixed dimensional coupling methods
Conventionally, the element types of different dimensions are coupled together using rigid links, known as “kinematic
coupling”. This is usually considered as the most basic and widely used method of coupling [10]. As the constraints imposed
by kinematic coupling are usually calculated as a function of the nodal coordinates, considerable stress disturbances are
induced at the transition. The relatively large induced errors impose strict limitations on the application of kinematic coupling
on practical engineering problems. Apart from several kinds of specifically developed transition elements, there are other
coupling ways provided in commercial software package. There has been documented and implemented a general transition
element in ABAQUS [11] which couples a reference node to a group of coupling nodes and distributes forces and moments at
the reference node with a weight factor assigned. However, the correct values of these weights usually are very difficult to
determine, and currently are determined manually by the user so that there are so many uncertainties and factors in the weight
values estimation.
A multi-point constraint equation is an equation which defines a relationship between sets of displacements within a finite
element model. Mathematically, there are two main methods of implementing these constraints, using Lagrange multipliers or
using a penalty function method. The Lagrange multiplier method enforces constraints exactly and the penalty function method
imposes constraints approximately. The scheme was proposed by McCune [12-13] and Armstrong [14-15] and further
Scale Level
Representative
Volume Element
(RVE) for analyses
Objectives of
analyses Available Theory
Global Scale
(Up to km) 5~10 m Internal Forces Theory of Structures
Component Scales
(Meters) 5~10 cm Nominal Stress
Mechanics of Materials and
Theory of Elastic-Plasticity
Material Scales
(Microns) 1~5 mm or less
Hot-spot Stress
orEffective Stress
Meso-mechanics, Damage
Mechanics

developed by Monaghan [16], who utilized an outcome of Reissner’s bending theory of elastic plates and showed that proper
connections between plate and beam elements, and plate and solid elements could be achieved via multipoint constraint
equations evaluated by equating the work done on either side of the dimensional interface. The solution could be arrived at by
introducing the assumed variation of the stresses, given by the appropriate beam, plate or shell theory, over the cross-section of
the interface. This procedure is general and as long as the stress distribution due to any given loading can be determined at
each interface, beam-solid [16], beam-shell [17] or shell-solid [17-18] coupling can be achieved for transitions with arbitrary
shapes of cross-sections. Mixed dimensional coupling using constraint equations has been shown to give good results [16].
Compared within the mixed dimensional coupling methods mentioned above, the scheme of constraint equations is
eventually adopted to perform the connections between elements of different dimensions. The situation of coupling beam with
shell elements would be categorized as four simple loading scenarios, namely axial forces, bending moment, torsion and shear
forces since the different types of constraint equations would be developed for the structure under the different internal forces.
The work generated by each type of elements is firstly equated, and the expression of equating work would then be
transformed to nodal displacements of different types of elements by using the shape function. Once the connection interface
pattern between two element types is determined, the coefficients of constraint equation would be easily calculated by a
specifically developed FORTRAN program. The corresponding constraint equations are conveniently derived and
implemented by the command EQUATION in ABAQUS. The application of mixed dimensional modeling can be more
beneficial when it is used in conjunction with substructuring as shown in Figure 2 above.
3 MULTI-SCALE MODEL OF TMB
3.1 Conventional FE model of TMB
The Tsing Ma Bridge in Hong Kong (Figure 3), with an overall length of 2160 m and a main span of 1377m between the
Tsing Yi tower in the east and Ma Wan tower in the west, is the longest suspension bridge in the world that carries both
highway and railway traffic. It is taken as the case study to develop such multi-scale FE model by the mixed dimensional
coupling method. Since it is the essential part of HK transportation connecting the Hong Kong Airport, a structural monitoring
system named Wind and Structural Health Monitoring System (WASHMS) had been devised to monitor the integrity,
durability and reliability of the bridge [19]. The bridge response is monitored by a total of 284 sensors in seven types,
including accelerometers, strain gauges, displacement transducers, level sensors, anemometers, temperature sensors and
weight-in-motion sensors installed permanently on the bridge, and the data acquisition system and processing system. The
most critical parts of the cross-frames for fatigue damage have been identified during the design structural health monitoring
system [20]. Upon this hypothesis, all these strain gauges are assumed to be installed at critical parts of the bridge-deck
sections. A finite element global structural model embodying the properties of almost all the structural elements with more
than 7300 nodes and 19000 elements was developed, including longitudinal trusses, cross-frames, deck plates, tower beams,
main cables, hangers, etc. More details about the conventional model would be found in [21].
3.2 Multi-scale modeling of TMB by mixed dimensional coupling method
On the basis of the above developed TMB global model, the concerned details of joints should be considered and merged
into the global model to construct the multi-scale model. In the global model (Figure3(a)), the component was modeled as
space beam element while the shell element would be required to simulate the joint details for the deteriorating process. There
were six standard elements identified and modeled in the typical longitudinal truss section of TMB and the joints were repeated
along the longitudinal direction of the bridge. Based on the mixed dimensional method by constraint equations and
substructuring technique, any concerned detailed joint (Figure3(c)), which had been identified as the vulnerable regions to
fatigue damage, could be modeled as substructure and merged into the global model to obtain the multi-scale model
(Figure3(b)). In the concerned local detailed model, the components such as the upper and lower orthotropic steel decks, the
pavement structures and the aerodynamic stainless steel sheets had been considered as equivalent simpler models in the global
model. It is understood that if these components were not considered properly, the bridge so modelled will be much more
flexible than real structure and the computed results due to train-induced displacements will be larger than that of the measured
results. Therefore these components could have to be modeled on the basis of real structure in details if necessary. The multi-
scale FE model of TMB is eventually developed and it could be updated using the online monitoring data and field tests.
Furthermore, the local damage evolution and its influence on the structural response can be considered and simulated in the
modeling. The developed model, as a discrete physical and mathematical representation of the bridge, will be served as a
baseline FE model for multi-scale analysis to provide the global structural stress distribution and local damage evaluation
accounting for deterioration at critical locations.
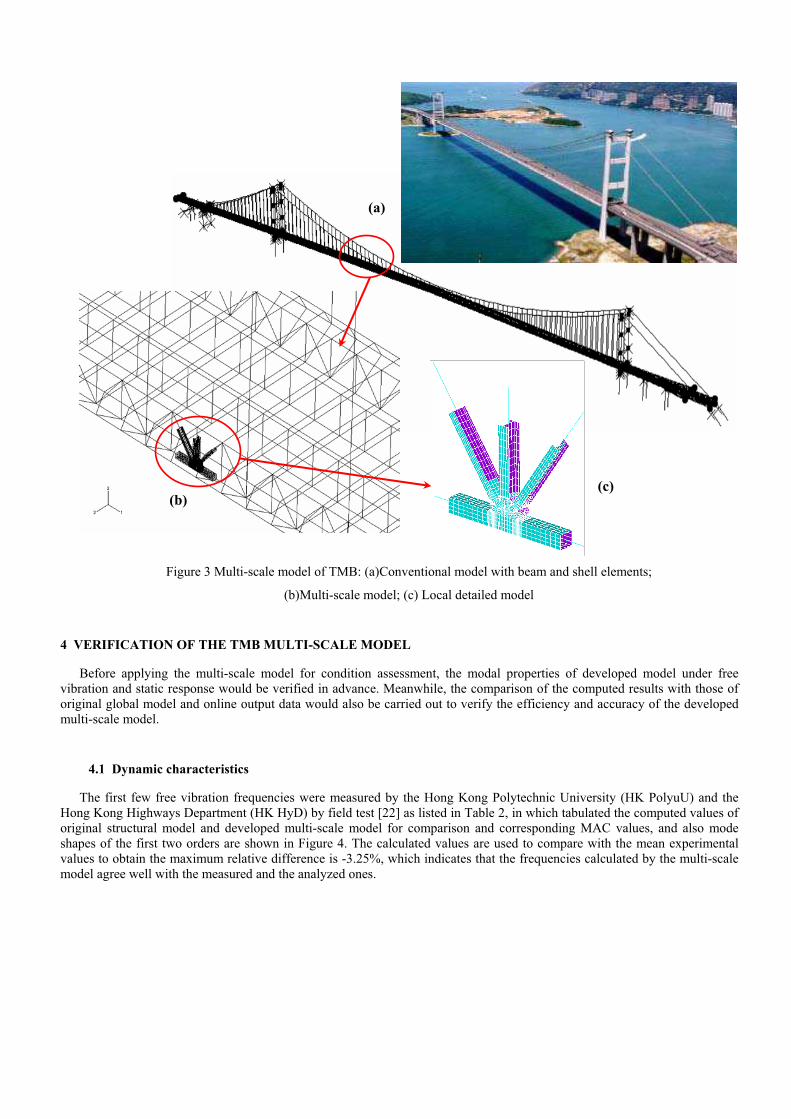
Figure 3 Multi-scale model of TMB: (a)Conventional model with beam and shell elements;
(b)Multi-scale model; (c) Local detailed model
4 VERIFICATION OF THE TMB MULTI-SCALE MODEL
Before applying the multi-scale model for condition assessment, the modal properties of developed model under free
vibration and static response would be verified in advance. Meanwhile, the comparison of the computed results with those of
original global model and online output data would also be carried out to verify the efficiency and accuracy of the developed
multi-scale model.
4.1 Dynamic characteristics
The first few free vibration frequencies were measured by the Hong Kong Polytechnic University (HK PolyuU) and the
Hong Kong Highways Department (HK HyD) by field test [22] as listed in Table 2, in which tabulated the computed values of
original structural model and developed multi-scale model for comparison and corresponding MAC values, and also mode
shapes of the first two orders are shown in Figure 4. The calculated values are used to compare with the mean experimental
values to obtain the maximum relative difference is -3.25%, which indicates that the frequencies calculated by the multi-scale
model agree well with the measured and the analyzed ones.
(a)
(c) (b)

Table 2 Few Free Vibration Frequencies Comparison of
TMB Original Model and Multi-scale Model
Figure 4 First two mode shapes at the directions of Lateral, Vertical and Torsional
of Multi-scale model of TMB
Experimental Results Calculated Results by FEM
Original Global Model Multi-scale Model Mode
Description HK
PolyU
HK
HyD Mean
ValueDifference
(%) Value
Difference
(%)
MAC
Modal Mass
Participation
Factors
Lateral Z-component
First 0.069 0.068 0.0685 0.0683 -0.292 0.0683 -0.292 9.92 1.3324
Second 0.164 0.158 0.161 0.160 -0.621 0.160 -0.621 9.90 -0.0296
Vertical Y-Component
First 0.113 0.113 0.113 0.116 +2.65 0.116 +2.65 9.86 -0.035
Second 0.139 0.138 0.1385 0.143 +3.25 0.143 +3.25 9.77 0.989
Torsion X-Rotation
First 0.267 0.244 0.2555 0.255 -0.196 0.255 -0.196 9.78 52.2
Second 0.320 0.266 0.293 0.299 -2.05 0.299 -2.05 9.80 32.5
Torsional Modes of Multi-scale Model of TMB: (e) First:0.255Hz; (f)Second:0.299Hz
(e) (f)
Lateral Modes of Multi-scale Model of TMB: (a) First:0.0683Hz; (b)Second:0.16Hz
(a) (b)
Vertical Modes of Multi-scale Model of TMB: (c) First:0.116Hz; (d)Second:0.143Hz
(d) (c)

4.2 Static response by vertical displacement influence line
Apart from the dynamic characteristics with respect to natural frequencies, the developed multi-scale model should be
further verified with respect to static and dynamic responses. The data of vertical displacement influence line at the locations
of A, B and C (Figure 5) where GPS level stations are installed in the bridge deck is collected from the field test performed
under a typical train loading. As for the numerical analysis, the simulated train loading had been properly calculated by Chan
et al [23] and then applied to the multi-scale model to obtain the responses at those sensor-installed locations. There are
relatively large differences between the measurement data and predicted ones as shown in right side in Figure 5.
Figure 5 Comparison of calibrated values with calculation and measurement at GPS locations corresponds to:
(a) Location A; (b) Location B; (c) Location C
The large discrepancies could be mainly caused by the following three reasons:
i) Amplitude of train loading. The simulated train loading is estimated on the basis of the situation of full loading that is
larger than the real experimental value, which results in the larger vertical displacement
ii) The possible time-shift. During the simulation analysis, the time zero is assumed when the train begins to pass through the
bridge. However, the selected measurement data is just a segment of the whole time-history record without clearly
knowing when the starting time is.
iii) The X-axis scale. The train is assumed to be traveling across the bridge at a constant speed of 30 m/s while in practice it
may not be so. The differences of train speed between the simulation and real train result in the different scales along the
X-axis.
In order to compare the calculated values at these locations with the measurement data with respect to the vertical influence
line, three factors considering each of the above mentioned three reasons were calculated attempting to tune the factored values
to fit the configuration of measurement data as the dash triangular line in Figure5(a) that corresponds to GPS location A. Once
the three factors were determined, the coefficients were multiplied to the other two cases and the original calculated data was
then calibrated as shown in Figure 5(b)&(c). It can be easily seen that all the calibrated data are now in better agreement with
the measurement than the original prediction values, indicating that the developed multi-scale model is reliable and accurate in
static response analysis of bridge.
5 TYPHOON-INDUCED ACCUMULATED FATIGUE DAMAGE EVALUATION
Typhoons are very common in Hong Kong during May to November every year due to the geographic site of Hong Kong.
Since the typhoons are the most typical severe cases occasionally happened after the structural health monitoring system
A
Ma Wan Tsing Yi
0 500 1000 1500 2000 2500-300
-200
-100
0
100
Measurement Data
Calculated Data
Calibrated Data
TsingYiMaWan
Ver
tica
l dis
pla
cem
ent
(mm
)
Train Location (m)
0 500 1000 1500 2000 2500-800
-600
-400
-200
0
200
400
Measurement Data
Calculated Data
Calibrated Data
TsingYiMaWan
Ver
tica
l dis
pla
cem
ent
(mm
)
Train Location (m)
0 500 1000 1500 2000 2500-800
-600
-400
-200
0
Measurement Data
Calculated Data
Calibrated Data
TsingYiMaWan
Ver
tica
l dis
pla
cem
ent
(mm
)
Train Location (m)
A
B
C

having been installed and may result in catastrophic consequences, the precious recorded data could be used to analyze for
administration as well as research purposes. Therefore, as one of the typical example of typhoons in Hong Kong, Typhoon
“York”, which attacked Hong Kong in September 1999, was chosen and analyzed in this paper.
Figure 6 (a) Strain histories of normal traffic by SSTLN-01; Figure 7 3D visualization of Rain-flow counted cycles
Strain histories of Typhoon York duration at the location distribution with respect to stress range and mean stress
for: (b)”SSTLN-01” (c)”SPTLS-02”; (d)”SPTLS-09” at “SPTLS-09” for (a) duration of Typhoon “York”
(b) the same period under normal traffic
The strain histories of three strain gauges of SSTLN-01(on top chord of north outer longitudinal truss), SPTLS-02(on
diagonal bracing of south outer longitudinal truss) and SPTLS-09(on horizontal centre bracing of underneath railway envelope)
for Typhoon York from 00:00 to 20:00 of Sep.16 1999 are shown as Figure 6 (b)-(d) respectively and it is observed that strain
histories from typhoon showed larger amplitude and different pattern from the one due to normal traffic (Figure 6(a)). In this
work, the algorithm of rain-flow counting method [24] is used to count closed stress-strain hysteresis loops as cycles at
different level of stress range and mean stress in a block of cycles. The 3-D histograms of rain-flow counting results at the
location SPTLS-09 with respect to stress ranges and mean stress are given in Figure 7, in which Figure 7(a) shows stress cycles
for duration of “York” (HKT 00:00-20:00). For the purpose of comparison, the stress cycles at the same time period of
Typhoon York attacking under the normal traffic on Nov.3 1999 is shown in Figure 7(b).
(a)
(b)
(c)
(d)
Strain (10-6
)

Figure 9 Histograms of strain half-cycles results of BS5400, CALTRANS allowable fatigue stress envelop
and measured stress on locations at: (a)SSTLN01; (b)SPTLS02; (c)SPTLS09
Based on the modified accumulative damage evaluation method on Miner’s law considering the effect of mean stress, the
increments of fatigue damage accumulated on the action of typhoon and under normal traffic of 3 Nov. 1999 are respectively
calculated hour by hour and the corresponding computed results are plotted as Figure 8. It is obvious that if solely the instant
T.Y Tower M.W Tower
Sensor
Location
Maximum strain due to train = 147 µ Maximum strain due to Typhoon York = 168 µ
Strain Gauge
SPTLS09
Hal
f-cy
cles
Co
un
ts
BS 5400 : Part 10 r - N curves, Class F
CALTRANS Allowable Fatigue Stress Envelope
Measured Stress
Stress (N/mm2)
(c)
Stress (N/mm2)
Hal
f-cy
cles
Co
un
ts
BS 5400 : Part 10 r - N curves, Class F
CALTRANS Allowable Fatigue Stress Envelope
Measured Stress
T.Y Tower M.W Tower
Sensor Location
Sensor
Location
Strain Gauge
SPTLS02
Maximum strain due to train = 130 µ Maximum strain due to Typhoon York = 131 µ
(b)
BS 5400 : Part 10 r - N curves, Class F
CALTRANS Allowable Fatigue Stress Envelope
Measured Stress
Stress (N/mm2)
Hal
f-cy
cles
Co
un
ts M.W Tower T.Y Tower
Sensor Location
Maximum strain due to train = 138 µ Maximum strain due to Typhoon York = 155 µ
Sensor Location
Strain Gauge
SSTLN01
(a)
Typhoon York Attack
Normal Traffic
Figure 8 Increment curve of cumulative fatigue damage versus hour calculated by modified Miner’s law
under typhoon and normal traffic
typhoon period is considered, then the values of fatigue damage accumulation on the process of the action of the typhoon are
significantly larger than those by the same period under normal traffic, in which the former is almost 16 times bigger than the
latter in figures. Furthermore, their accumulation patterns of fatigue damage are different from each other which depend on
changing intensity of structural response to variable environmental factors. From this point of view, the fatigue damage
induced by normal traffic is regular since the daily strain-time history is similar from day to day which won’t change
significantly while that by the typhoon is comparatively random because of the random property of typhoon itself. However
fatigue damage is dependent upon not only on the magnitude of stress variations, but also on their frequency of occurrence. In
fact, the fatigue stress/load induced by trains and trucks is considered as incremental accumulative events; whereas the fatigue
stress/load induced by dynamic winds is considered as either scheduled discrete accumulative events (for monsoons) or
unscheduled discrete accumulative events (for typhoons). Therefore, the fatigue damage induced by train and winds should be
treated separately and be assessed under different criteria or modeling approaches. The measured strain results at strain gauges
SSTLN-01(Figure9(a)), SPTLS-02(Figure9(b)) and SPTLS-09(Figure9(c)) show that under combined loads of highway traffic,
railway traffic, wind and temperature, the fatigue induced damages at the instrumented components are well below the design
values.
6 CONCLUSION
The multi-scale modeling strategy of the long span bridges for the purpose of fatigue damage evaluation and condition
assessment is studied in this paper. As an important case study, the multi-scale model of TMB is developed by mixed
dimensional coupling method. The comparison of the first few natural frequencies and vertical displacement influence line data
by the developed multi-scale model with the original model and measured data are performed. The verified model could be
used for the condition assessment in term of accumulative fatigue damage evaluation of the bridge under both the loading cases
of typhoon attack and normal traffic. Based on the results from this study, the following specific conclusion could be obtained
as follows:
The multi-scale modeling are based on the mixed dimensional coupling method by constraint equations generated at the
interface between different types of finite elements on the basis of equating work. The constraint equations could be
derived using developed computer programs and easily implemented in commercial software like ABAQUS. Combined
with the substructuring technique, the constraint equations of detailed joints connections are derived and implemented to
the longitudinal truss section of TMB to obtain the corresponding multi-scale model on the basis of conventional FE
model.
The first few order natural frequencies and vertical displacement influence line data under the train loading by multi-scale
model have been used to verify the efficiency and accuracy of the model. The comparison result suggests that the first
few mode shapes and frequencies agrees well with those of original model and measured data. The calibrated data fits
well with measurement configuration of vertical displacement than the original calculated ones.
The accumulative fatigue damage evaluation has been performed by the developed multi-scale model associated with the
monitoring data from stain gauges within the attack duration of Typhoon “York”. The classic linear Miner’s law was
modified to consider the influence of mean stress on the damage result. The stress variation for accumulative fatigue
damage induced by typhoons is normally larger than that induced by normal traffic. It indicated that more attentions
would be paid to evaluate the condition of structures after those extreme events occurred.
REFERENCES
1 Chang, F. K., ed. (1997) Proceedings of 1st International Workshop on Structural Health Monitoring, Stanford, California,
USA
2 Chang, F. K., ed. (1999) Proceedings of 2nd International Workshop on Structural Health Monitoring, Stanford, California,
USA
3 Atkan, A. E., and Gosselin, S. R., eds. (2000) Proceedings of SPIE’s International Symposium on NDE and Health
Monitoring and Diagnostics, Nondestructive Evaluation of Highways, Utilities and Pipelines
4 Chang P. C., Flatau A., Liu S.C. (2003) Review paper: Health monitoring of civil infrastructure. Structural Health
Monitoring, 2(3), 257-267
5 Catbas, F. N., Atkan, A. E. (2002) Condition and Damage Assessment Issues and Some Promising Indices. Structural
Engineering, 128(8), 1026-1036
6 Friswell M. I., Mottershead J.E. (1995) Finite element model updating in structural dynamics. Kluwer Academic
Publishers

7 Friswell M; I., Mottershead J. E. (2001) Physical understanding of structures by model updating. International
Conference on Structural System Identification, September 5-7, 2001, Kassel, Germany
8 Farrar C. R., Doebling S. W. (1997) An Overview of Modal-based Damage Identification Methods, in Proceedings of
DAMAS Conference, Sheffield, UK, June 1997
9 Z. X. Li, T. Q. Zhou, T. H. T. Chan, Y. Yu (2007) Multi-scale Numerical Analysis on Dynamic Response and Local
Damage in Long-span Bridges, Engineering Structures, 29(7), 1507-1524
10 Adams V, Askenazi A. Building better products with finite element analysis, on word press, Santa fe, New mexico, 1999.
11 HKS, hibbitt, karlsson and Screnson Inc. (1998) ABAQUS 5.8 Theory Manual.
12 Mccune R W (1998) Mixed dimensional coupling and error estimation in finite element stress analysis. PhD thesis, The
Queen’s University of Belfast
13 Mccune R. W., Armstrong C. G., Robinson D. J. (2000) Mixed dimensional coupling in finite element models. Numerical
Methods in Engineering, , 49: 725–750
14 Armstrong, Bridgett, Donaghy, McCune, McKeag and Robinson, (1998). Techniques for interactive and automatic
idealisation of cad models, Proceedings of 6th International Conference on Numerical Grid Generation in Computational
Field Simulations, London, 643-662
15 Armstrong, Mccune and Robinson (1998) Multi-dimensional analysis modeling, Proceedings of 6th ACME Annual
Conference on Computational Mechanics in UK, 47-50.
16 Monaghan D. J., Doherty I. W., Mccourt D., Armstrong C. G. (1998) Coupling 1D beams to 3D bodies. 7th International
Meshing Roundtable. Sandia National Laboratories, Dearborn, Michigan, 285–293
17 Monaghan D. J. (2000) Automatically coupling elements of dissimilar dimension in finite element analysis. PhD Thesis,
The Queen’s University of Belfast
18 Da´vila C. G. (1994) Solid-To-Shell Transition Elements for the Computation of Interlaminar Stresses, Computing
Systems in Engineering, 5(2), 193–202
19 Wong K.Y. (2007) Design of a structural health monitoring system for long-span bridges. Structural and Infrastructural
Engineering, 3(2), 169-185
20 Wong K.Y. (2004) Instrumentation and health monitoring of cable-supported bridges. Structural Control and Health
Monitoring, 11, 91-124
21 Chan T.H.T., Guo L., Li Z.X. (2003) Finite Element Modeling for Fatigue Stress Analysis of Large Suspension Bridges,
Journal of Sound and Vibration, 261(3), 443-464
22 Wong, K.Y.(2003) Structural identification of Tsing Ma Bridge, Transaction, The Hong Kong Institute of Engineers,
10(1), 38-47.
23 Chan, T.H.T, Yu, Y., Wong, K.Y., and Guo, L.(2007) A Multi-scale Finite Element Model of Tsing Ma Bridge for Hot
Spot Stress Analysis. Proceedings of International Conference on Health Monitoring of Structure, Material and
Environment (HMSME 2007), 16-18 October, Nanjing, PR China, 130-140
24 Dowling, N.E. (1972) Fatigue failure predictions for complicated stress-strain history. Journal of Materials, JMLSA, ,
7(1), 71-87
Acknowledgments
Funding support for this project by the National Natural Science Foundation of China (No. 50278017) and the Research
Grants Council of the Hong Kong SAR Government (PolyU 5134/03E) together with the support from the Highways
Department of the Hong Kong SAR Government are gratefully acknowledged.