conference call 3q 2014 results - seadrill · 3 1 company highlights q3 2014 ... a new contract two...
TRANSCRIPT

Conference Call – 3Q 2014 ResultsNovember 26, 2014
Forward Looking Statements
The statements described in this presentation that are not historical facts are forward-looking statements
within the meaning of Section 27A of the Securities Act of 1933 and Section 21E of the Securities Exchange
Act of 1934. Forward-looking statements which could be made include, but are not limited to, statements
involving prospects for the Company, expected revenues, capital expenditures, costs and results of
operations and contingencies and other factors discussed in the Company's most recent annual report on
the Form 20-F for the year ended December 31, 2013 and in the Company's other filings with the SEC,
which are available free of charge on the SEC's website at www.sec.gov. Should one or more of these risks
or uncertainties materialize, or should underlying assumptions prove incorrect, actual results may vary
materially from those indicated. All subsequent written and oral forward-looking statements attributable to
the Company or to persons acting on our behalf are expressly qualified in their entirety by reference to
these risks and uncertainties. You should not place undue reliance on forward-looking statements. Each
forward-looking statement speaks only as of the date of the particular statement, and we undertake no
obligation to publicly update or revise any forward-looking statements.
2

Seadrill Third Quarter Call Agenda
3
1 Company Highlights Q3 2014
3 Financial Performance Highlights
2 Contract Wins & Market Outlook
4 Appendix: Seadrill Limited Financials

Company Highlights – Q3 2014
Seadrill Group generated consolidated EBITDA
of US$842 million for the third quarter 2014
Economic utilization for the Group’s floaters on a
consolidated basis was 89 percent
Seadrill Group’s current orderbacklog has
increased to US$24 billion
4
9793 94 95
8286
92 94 94 94
88
9489
0
10
20
30
40
50
60
70
80
90
100
3Q11 4Q11 1Q12 2Q12 3Q12 4Q12 1Q13 2Q13 3Q13 4Q13 1Q14 2Q14 3Q14
Utiliz
ation (
%)
Ultra-Deepwater Economic Utilization (proforma consolidated)
589575
595634
574 604
652 665 663
768788
865842
0
100
200
300
400
500
600
700
800
900
3Q11 4Q11 1Q12 2Q12 3Q12 4Q12 1Q13 2Q13 3Q13 4Q13 1Q14 2Q14 3Q14
US
$ M
illio
ns
Quarterly EBITDA (proforma consolidated)
-
1,000
2,000
3,000
4,000
5,000
6,000
7,000
2014 Remaining 2015 2016 2017 2018 Remaining
US
$ M
illio
ns
Current Backlog (proforma consolidated)
Highlights Since Q2 Call
5
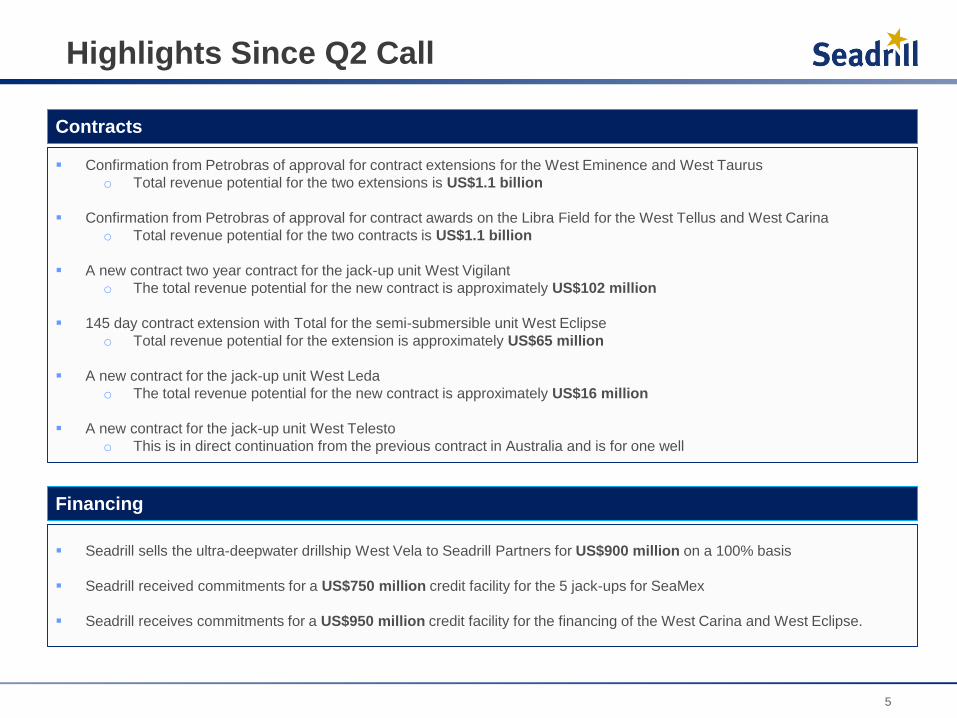
Contracts
Confirmation from Petrobras of approval for contract extensions for the West Eminence and West Taurus
o Total revenue potential for the two extensions is US$1.1 billion
Confirmation from Petrobras of approval for contract awards on the Libra Field for the West Tellus and West Carina
o Total revenue potential for the two contracts is US$1.1 billion
A new contract two year contract for the jack-up unit West Vigilant
o The total revenue potential for the new contract is approximately US$102 million
145 day contract extension with Total for the semi-submersible unit West Eclipse
o Total revenue potential for the extension is approximately US$65 million
A new contract for the jack-up unit West Leda
o The total revenue potential for the new contract is approximately US$16 million
A new contract for the jack-up unit West Telesto
o This is in direct continuation from the previous contract in Australia and is for one well
Financing
Seadrill sells the ultra-deepwater drillship West Vela to Seadrill Partners for US$900 million on a 100% basis
Seadrill received commitments for a US$750 million credit facility for the 5 jack-ups for SeaMex
Seadrill receives commitments for a US$950 million credit facility for the financing of the West Carina and West Eclipse.

Financial performance highlights
Appendix:
Seadrill Limited Financials
6
Contract Wins & Market Outlook

Success with the Biggest Rig Contractor
7
Libra Field Contracts
3 Year Contracts
West Tellus and West Carina
Backlog: US$1.1 billion
Petrobras Extensions
3 Year Contracts
West Taurus and West Eminence
Backlog: US$1.1 billion
New and Maintained
Relationships
West Eclipse, West Vigilant, West Leda
and West Telesto
Backlog: US$200 million

Floaters – US$18.7 Billion Contract Backlog
Contract coverage
Contracted
Uncontracted
2015 2016
8
2017
91%
9%
74%
26%
55%
45%
Proforma consolidated backlog
Unit Customer
West Draco - NewbuildWest Dorado - NewbuildWest Aquila - NewbuildWest Libra - NewbuildWest Saturn ExxonMobil US$633,750West Capella ExxonMobil US$627,500West Gemini Total US$656,000West Neptune LLOG US$570,000West Tellus Petrobras Yard PetrobrasWest Polaris ExxonMobil US$655,736West Carina Petrobras Newbuild PetrobrasWest Jupiter Total US$567,000 12.2019West Navigator Centrica Energi NUF / Rosneft US$610'Transit Rosneft 06.2020West Auriga BP US$565,000 10.2020West Vela BP US$565,000 11.2020
West Eclipse Total US$450,000West Venture Statoil US$431,000West Phoenix Total US$465,000Sevan Developer - NewbuildSevan Driller Petrobas US$409,382West Orion Petrobras US$626,790West Pegasus PEMEX US$467,500 Market RateWest Hercules Statoil US$503,000 US$503,000West Aquarius ExxonMobil US$540,000 US$615,000West Capricorn BP US$494,958 US$494,958 08.2019West Taurus Petrobras US$659,098PetrobrasSevan Louisiana LLOG US$350,000West Leo Tullow Oil US$605,000Sevan Brasil Petrobas US$403,540West Eminence Petrobras US$626,790 PetrobrasWest Sirius BP US$535,000 07.2019West Mira Husky Newbuild Transit US$590,000 06.2020West Rigel Rosneft Newbuild Transit Rosneft 08.2020West Alpha ExxonMobil US$523,000 US$539,000 Rosneft 07.2022
Option Yard or transit period
2014 20181Q 2Q 3Q 4Q4Q
2015 2016 20171Q4Q 1Q 2Q 3Q 2Q 3Q 4Q4Q 1Q 2Q 3Q
Dri
llshi
psSe
mi-
subm
ersi
bles
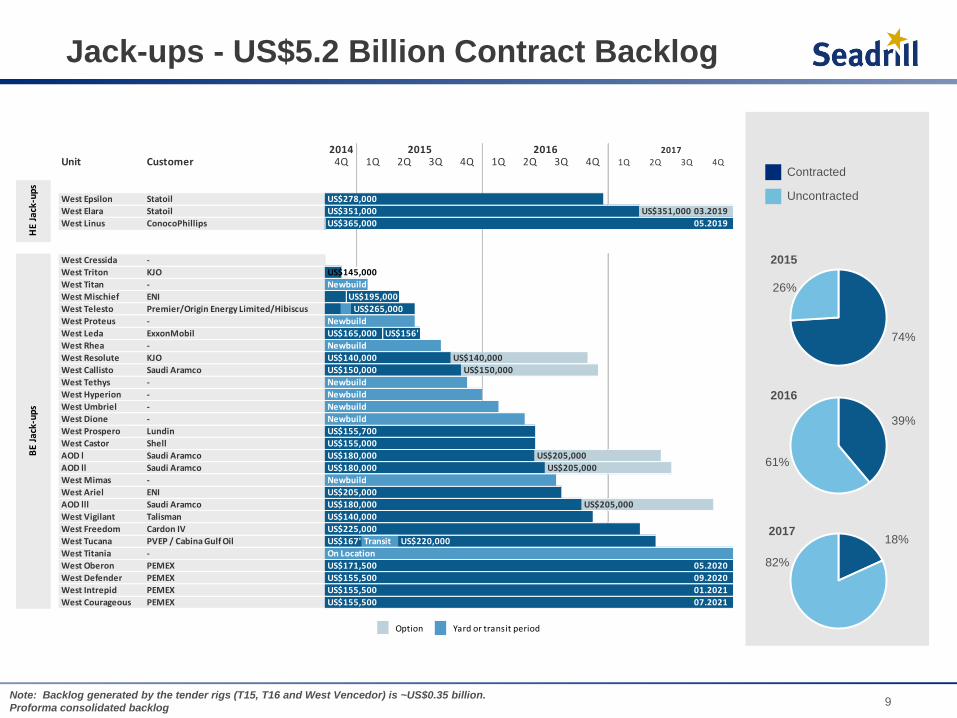
Jack-ups - US$5.2 Billion Contract Backlog
74%
26%
Contracted
Uncontracted
2015
2016
Note: Backlog generated by the tender rigs (T15, T16 and West Vencedor) is ~US$0.35 billion.9
61%
39%
201718%
82%
Proforma consolidated backlog
Unit Customer
West Epsilon Statoil US$278,000
West Elara Statoil US$351,000 US$351,000 03.2019
West Linus ConocoPhillips US$365,000 05.2019
West Cressida -
West Triton KJO US$145,000
West Titan - Newbuild
West Mischief ENI US$195,000
West Telesto Premier/Origin Energy Limited/Hibiscus US$265,000
West Proteus - Newbuild
West Leda ExxonMobil US$165,000 US$156'
West Rhea - Newbuild
West Resolute KJO US$140,000 US$140,000
West Callisto Saudi Aramco US$150,000 US$150,000
West Tethys - Newbuild
West Hyperion - Newbuild
West Umbriel - Newbuild
West Dione - Newbuild
West Prospero Lundin US$155,700
West Castor Shell US$155,000
AOD l Saudi Aramco US$180,000 US$205,000
AOD ll Saudi Aramco US$180,000 US$205,000
West Mimas - Newbuild
West Ariel ENI US$205,000
AOD lll Saudi Aramco US$180,000 US$205,000
West Vigilant Talisman US$140,000
West Freedom Cardon IV US$225,000
West Tucana PVEP / Cabina Gulf Oil US$167' Transit US$220,000
West Titania - On Location
West Oberon PEMEX US$171,500 05.2020
West Defender PEMEX US$155,500 09.2020
West Intrepid PEMEX US$155,500 01.2021
West Courageous PEMEX US$155,500 07.2021
Option Yard or transit period
2014 2017
3Q 4Q4Q 1Q 2Q
2015 2016
BE
Jack
-ups
HE
Jack
-ups
1Q 2Q 3Q4Q 1Q 2Q 3Q 4Q

Financial performance highlights
Financial Performance Highlights
10
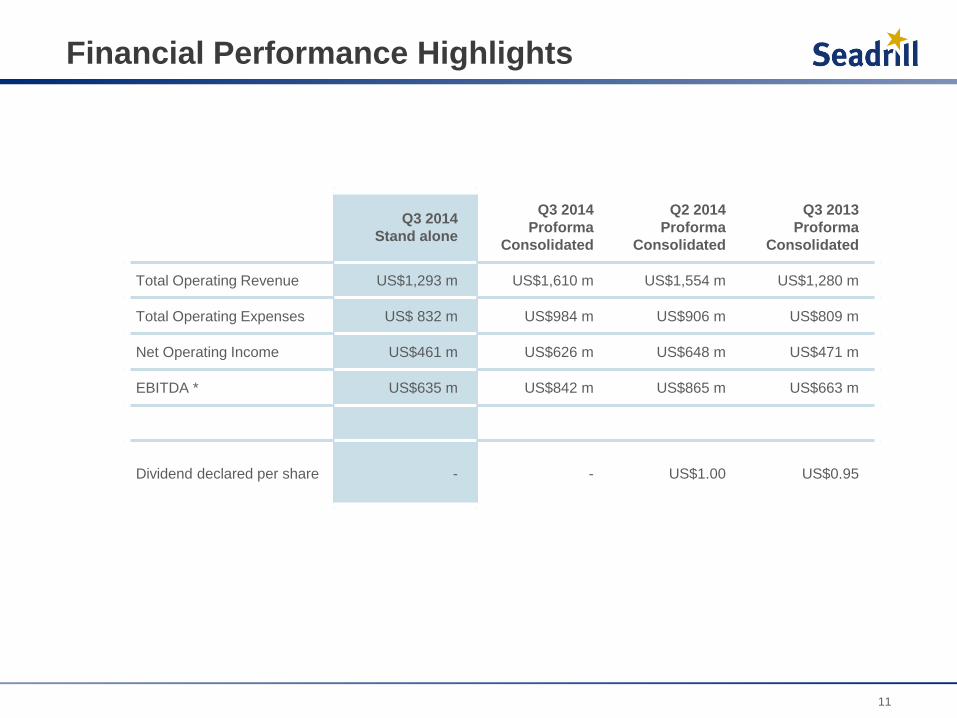
Financial Performance Highlights
Q3 2014
Stand alone
Q3 2014
Proforma
Consolidated
Q2 2014
Proforma
Consolidated
Q3 2013
Proforma
Consolidated
Total Operating Revenue US$1,293 m US$1,610 m US$1,554 m US$1,280 m
Total Operating Expenses US$ 832 m US$984 m US$906 m US$809 m
Net Operating Income US$461 m US$626 m US$648 m US$471 m
EBITDA * US$635 m US$842 m US$865 m US$663 m
Dividend declared per share - - US$1.00 US$0.95
11

Balance Sheet Summary
September
30, 2014
June
30, 2014
Total Current Assets 3,422 3,185
Non-current assets
Newbuildings 3,794 2,593
Drilling units 13,932 14,008
Other 6,239 6,818
Total non-current assets 23,965 23,419
TOTAL ASSETS 27,387 26,604
Current Liabilities
Current portion of long-term debt 1,689 2,147
Other 1,920 1,956
Total current liabilities 3,609 4,103
Non-current liabilities
Total Long-term Debt 11,422 10,025
Other 1,412 1,729
Total non-current liabilities 12,834 11,754
TOTAL LIABILITIES 16,443 15,857
Equity
Total shareholder’s equity 10,944 10,747
Total liabilities and shareholder’s equity 27,387 26,604
12
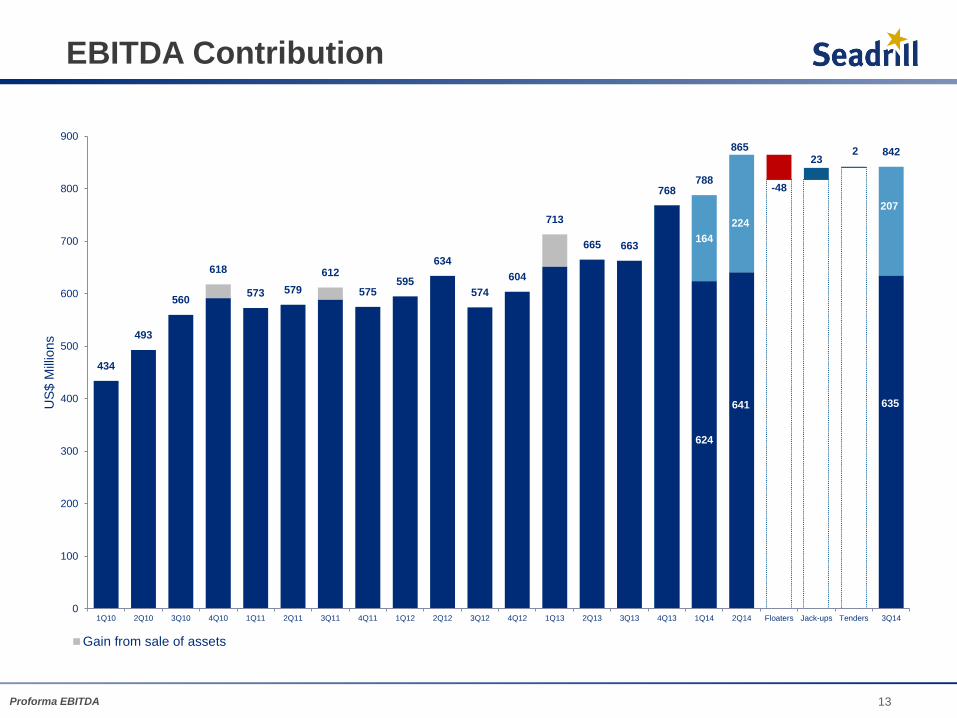
624
164
224
-48
232
434
493
560
618
573 579
612
575595
634
574
604
713
665 663
768788
842
0
100
200
300
400
500
600
700
800
900
1Q10 2Q10 3Q10 4Q10 1Q11 2Q11 3Q11 4Q11 1Q12 2Q12 3Q12 4Q12 1Q13 2Q13 3Q13 4Q13 1Q14 2Q14 Floaters Jack-ups Tenders 3Q14
US
$ M
illio
ns
Gain from sale of assets
207
13
641 635
865
EBITDA Contribution
Proforma EBITDA

Illustrative Funding Profile
14Proforma consolidated
Well Defined & Manageable Funding Requirements
Unfunded Yard Instalments
Floaters
West Rigel
West Mira
2015 Funding Required
2016 Funding Required
Jack-ups
West Titan
West Proteus
West Rhea
West Tethys
Floaters
West Draco
West Dorado
West Aquila
West Libra
Jack-ups
West Hyperion
West Umbriel
West Dione
West Mimas
0
500
1,000
1,500
2,000
2,500
2015 2016 2017
US
$ M
illio
ns
Debt Maturity Profile
0
1,000
2,000
3,000
2014 2015 2016 2017 2018 2019 2020
US
$ M
illio
ns

• 32 6th generation ultra-deepwater units
• 2 Midwater harsh environment semi-submersible rigs
• 29 High-specification jack-ups
• 3 Harsh environment jack-ups
• 3 Tender rigs
Core Assets
Financial Investments
8.18% of SapuraKencana –
Market Value ~US$477mm
50.11% of Sevan Drilling –
Market Value ~US$39mm
39.9% of Archer –
Market Value ~US$212mm
15
Appendix:
Seadrill Limited Financials
16
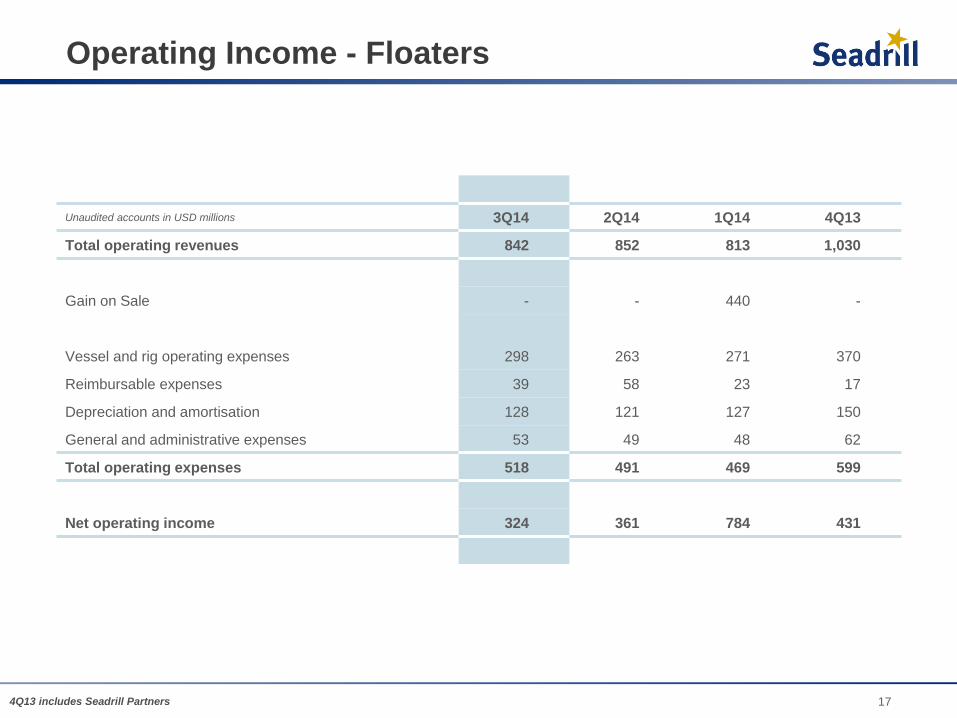
Operating Income - Floaters
Unaudited accounts in USD millions 3Q14 2Q14 1Q14 4Q13
Total operating revenues 842 852 813 1,030
Gain on Sale - - 440 -
Vessel and rig operating expenses 298 263 271 370
Reimbursable expenses 39 58 23 17
Depreciation and amortisation 128 121 127 150
General and administrative expenses 53 49 48 62
Total operating expenses 518 491 469 599
Net operating income 324 361 784 431
174Q13 includes Seadrill Partners

Operating Income – Jack-up Rigs
Unaudited accounts in USD millions 3Q14 2Q14 1Q14 4Q13
Total operating revenues 408 335 315 339
Vessel and rig operating expenses 184 142 130 148
Reimbursable expenses 14 11 9 11
Depreciation and amortisation 46 44 48 46
General and administrative expenses 31 26 25 24
Total operating expenses 275 223 212 229
Net operating income 133 112 103 110
184Q13 includes Seadrill Partners

Operating Income – Total Seadrill Limited
Unaudited accounts in USD millions 3Q14 2Q14 1Q14 4Q13
Total operating revenues 1,293 1,222 1,221 1,469
Gain on sale of assets - - 440 -
Vessel and rig operating expenses 521 437 492 565
Reimbursable expenses 53 69 32 50
Depreciation and amortisation 174 165 174 200
General and administrative expenses 84 75 73 86
Total operating expenses 832 746 771 901
Net operating income 461 476 890 568
194Q13 includes Seadrill Partners

Net Income – Total Seadrill Limited
Unaudited accounts in USD millions 3Q14 2Q14 1Q14 4Q13
Net operating income 461 476 890 568
Financial items and other income
Interest income 2 32 11 8
Interest expense (114) (124) (118) (134)
Share in results from associated companies (26) 54 20 (189)
(Loss)/Gain in financial derivatives (80) (95) (37) 2
Foreign exchange gain/(loss) 52 22 (15) 25
Gain on realization of marketable securities - 131 - -
Other financial items (66)* 51 39 2
Gain on deconsolidation of Seadrill Partners - - 2,339 -
Total financial items and other income (232) 71 2,239 (286)
Income before income taxes 229 547 3,129 282
Income taxes (39) 106 (35) (1)
Net income 190 653 3,094 281
Earnings per share (US$) 0.31 1.29 6.54 0.49
204Q13 includes Seadrill Partners
* Includes US$76mm loss on debt extinguishment

Balance Sheet - Assets
Unaudited accounts in USD millionsSeptember
30, 2014
June
30, 2014
March
31, 2014
Current assets
Cash and cash equivalents 638 543 912
Restricted cash 279 237 206
Marketable securities 878 933 1,072
Accounts receivables, net 797 824 780
Other current assets 830 648 1,061
Total current assets 3,422 3,185 4,031
Non-current assets
Newbuildings 3,794 2,593 3,917
Drilling units 13,932 14,008 13,163
Assets held for sale – non current 1,079 1,048 -
Restricted cash 114 126 146
Deferred tax assets 48 47 28
Other non-current assets 4,998 5,597 6,206
Total non-current assets 23,965 23,419 23,460
Total assets 27,387 26,604 27,491
21

Balance Sheet – Liabilities & Shareholder’s Equity
September
30, 2014
June
30, 2014
March
31, 2014
Current liabilities
Current portion of long-term debt 1,689 2,147 1,662
Trade accounts payable 90 61 111
Other current liabilities 1,830 1,895 2,621
Total current liabilities 3,609 4,103 4,394
Non-current liabilities
Long-term interest bearing debt 11,442 10,025 10,728
Deferred taxes 79 73 48
Other non-current liabilities 1,313 1,656 1,648
Total non-current liabilities 12,834 11,754 12,424
Equity
Total shareholder’s equity 10,944 10,747 10,673
Total liabilities and shareholder’s equity 27,387 26,604 27,491
22