seadrill limited (sdrl) - first quarter 2013...
TRANSCRIPT

1
Seadrill Limited (SDRL) - First quarter 2013 results
Highlights • Seadrill records its best operating quarterly result ever and generates first quarter 2013
EBITDA*) of US$713 million • Seadrill reports first quarter 2013 net income of US$440 million and earnings per share of
US$0.87 • Seadrill increases the ordinary quarterly cash dividend by 3 cents to US$0.88 • Economic utilization for floaters increased to 92% in Q1 2013 from 86% in Q4 2012 • Economic utilization for the jack-up fleet in Q1 2013 was 99%, up from 94% in Q4 2012 • Seadrill ordered four jack-ups for a total estimated project price of US$230 million per rig,
with deliveries in 2015 • Seadrill completed the acquisition of the ultra-deepwater semi-submersible rig Songa Eclipse
for a total consideration of US$590 million • Seadrill secured a two-year extension for the ultra-deepwater semi-submersible rig West Leo
with a total estimated revenue potential of US$430 million • Seadrill completed the sale of the jack-up rig West Janus for US$73 million recording a gain
on sale of US$61 million • Seadrill issued a NOK1.8 billion unsecured bond maturing in March 2018
Subsequent events • Seadrill completes the sale of 18 tender rigs to SapuraKencana Petroleum Bhd. for a total
consideration of US$2.9 billion on April 30, 2013 • Seadrill secures a three-year contract for the newbuild drillship West Neptune with a total
estimated revenue potential of US$662 million • Seadrill completes the sale of the tender rig T15 to Seadrill Partners LLC (SDLP) for a total
consideration of US$210 million *) EBITDA is defined as earnings before interest, depreciation and amortization equal to operating profit plus depreciation and amortization.
Condensed consolidated income statements First quarter 2013 results Consolidated revenues for the first quarter of 2013 were US$1,265 million compared to US$1,215 million in the fourth quarter of 2012. The increase includes the addition of the West Eclipse for the full quarter, West Hercules for 60 days for quarter and overall improvement in utilization for the fleet. Operating profit for the quarter was US$552 million compared to US$441 million in the preceding quarter. The increase is driven by higher revenues as discussed above, gain on sale of the of the 1985 built jack-up West Janus of US$61 million, offset by higher operating expenses in the first quarter Net financial items for the quarter showed a loss of US$68 million compared to a loss of US$335 million in the previous quarter. The decrease in the loss is due to an impairment recognized in the fourth quarter to our investment in Archer Ltd which did not re-occur in this quarter and a

2
overall gain on our financial derivative arrangements in the first quarter compared to an overall loss in the fourth quarter. Income taxes for the first quarter were US$44 million, a decrease of US$64 million from the previous quarter. Net income for the quarter was US$440 million representing basic and diluted earnings per share of US$0.87 and US$0.85, respectively. Balance sheet As of March 31, 2013, total assets were US$21,206 million, an increase of US$1,574 million compared to December 31, 2012. Total current assets decreased to US$2,350 million from US$2,354 million over the course of the quarter, primarily driven by an increase in accounts receivable and cash; offset by a decrease in other current assets. Total non-current assets increased to US$18,856 million from US$17,278 million primarily due to an increase in drilling units following the acquisition of the Songa Eclipse and the consolidation of Asia Offshore Drilling Ltd at the end of the quarter, which added one ultra-deepwater rig and three jack-ups under construction. These rigs have been recognized at fair value on the date of acquisitions as they are business acquisitions for accounting purposes. Total current liabilities increased to US$4,782 million from US$3,613 million largely due to an increase in the current portion of long-term debt and the addition of the estimated fair value liabilities from the consolidation of Asia Offshore Drilling Ltd. See Notes 7 and 8 to our interim financial statements for further discussion. Long-term interest bearing debt decreased to US$8,582 million from US$8,695 million over the course of the quarter and net interest bearing debt increased to US$11,674 million from $11,039 million. The increase is due to the issuance of NOK 1,800 million senior unsecured bond and the $450 million West Eclipse facility. Total equity increased to US$6,530 million from US$6,024 million as of March 31, 2013. The increase is primarily driven by net income for the quarter. Cash flow As of March 31, 2013, cash and cash equivalents were US$361 million, an increase of US$43 million compared to the previous quarter. Net cash from operating activities for the period was US$423 million and net cash used in investing activities for the same period was US$1,074 million, primarily related to additional payments for newbuilds and the acquisition of the Songa Eclipse. Net cash from financing activities was US$694 million, primarily because of net proceeds from the issuance of debt. Outstanding shares As of March 31, 2013, common shares outstanding in Seadrill Limited totaled 469,129,874 adjusted for our holding of 121,059 treasury shares. Additionally, we had stock options for 3.8 million shares outstanding under various share incentive programs for management, of which approximately 1.1 million are vested and exercisable.

3
Operations Offshore drilling units During the first quarter, Seadrill had, 17 floaters, 16 jack-up rigs and 16 tender rigs in operation in Northern Europe, US Gulf of Mexico, Mexico, South Americas, West Africa, Middle East and Southeast Asia (including five tender rigs owned by Varia Perdana). Our floaters (drillships and semi-submersible rigs) achieved an economic utilization rate of 92% in the first quarter compared to 86% in the fourth quarter. We are pleased with the improvement over the prior quarter and remain determined to continue our focus on operational excellence. The main issues affecting our first quarter performance were the need to replace defective OEM bolts on some of our subsea well control equipment and the West Hercules being idle for one month. The operational performance in March, after these issues were dealt with, was solid. Average economic utilization was 99% for our jack-up rigs in the first quarter compared to 94% in the preceding quarter. The tender rig fleet achieved an average economic utilization of 99% in the first quarter, in-line with the fourth quarter economic utilization of 98%. Table 1.0 Contract status offshore drilling units
Unit Current client Area of location Contract start
Contract expiry
Semi-submersible rigs
West Alpha ** ExxonMobil Norway Sep-12 Jul-16
West Aquarius ExxonMobil Canada Jan-13 Jun-15
West Capricorn BP USA Jul-12 Aug-17
West Eclipse Total Angola Jan-13 Jan-14
West Eminence Petrobras Brazil Jul-09 Jul-15
West Hercules ** Statoil Norway Jan-13 Jan-17
West Leo Tullow Oil Ghana Apr-12 May-18
West Mira (NB*) Husky South Korea – Hyundai Shipyard Jun-15 Jun-20
West Orion Petrobras Brazil Jul-10 Jul-16
West Pegasus PEMEX Mexico Aug-11 Aug-16
West Phoenix ** Total UK Jan-12 Apr-15
West Rigel (NB*)** Singapore – Jurong Shipyard
West Sirius BP USA Jul-08 Jul-19
West Taurus Petrobras Brazil Feb-09 Feb-15
West Venture ** Statoil Norway Aug-10 Jul-15
Drillships
West Capella Total Nigeria Apr-09 Apr-19
West Gemini Total Angola Sep-10 Sep-17
West Navigator ** Shell Norway Jan-13 Jun-14
West Polaris ExxonMobil Angola Mar-13 Mar-18
West Auriga (NB*) BP South Korea – Samsung Shipyard Aug-13 Aug-20
West Tellus (NB*) South Korea – Samsung Shipyard
West Vela (NB*) BP South Korea – Samsung Shipyard Nov-13 Nov-20
West Neptune (NB*) LLOG South Korea – Samsung Shipyard Oct-14 Oct-17
West Jupiter (NB*) South Korea – Samsung Shipyard
West Saturn (NB*) South Korea – Samsung Shipyard
West Carina (NB*) South Korea – Samsung Shipyard

4
HE Jack-up rigs
West Elara ** Statoil Norway Mar-12 Mar-17
West Epsilon ** Statoil Norway Dec-10 Dec-16
West Linus (NB*) ** ConocoPhillips Singapore – Jurong Shipyard Apr-14 Apr-19
BE Jack-up rigs
West Courageous Hess Malaysia Feb-13 Feb-14
West Defender Shell Brunei Aug-12 May-16
West Freedom GDF Suez Qatar Dec-12 Aug-13
West Intrepid KJO Saudi Arabia / Kuwait May-09 Nov-13
West Mischief ENI Republic of Congo Dec-12 Dec-14
West Resolute KJO Saudi Arabia / Kuwait Oct-12 Oct-15
West Vigilant Talisman Malaysia Oct-12 Oct-13
West Ariel Vietsovpetro Vietnam Jan-13 Mar-14
West Callisto Saudi Aramco Saudi Arabia Nov-12 Nov-15
West Cressida PTTEP Thailand Nov-10 May-14
West Leda ExxonMobil Malaysia Mar-12 Apr-14
West Prospero Vietsovpetro Vietnam Jan-13 Mar-14
West Triton KJO Saudi Arabia / Kuwait Aug-12 Aug-15
West Castor (NB*) Singapore – Jurong Shipyard
West Tucana (NB*) PVEP Singapore – Jurong Shipyard Aug-13 Dec-13
West Telesto (NB*) Premier China – Dalian Shipyard Sep-13 Mar-14
West Oberon (NB*) China – Dalian Shipyard
West Titan (NB*) China – Dalian Shipyard
West Proteus (NB*) China – Dalian Shipyard
West Rhea (NB*) China – Dalian Shipyard
West Tethys (NB*) China – Dalian Shipyard
AOD-1 *** Saudi Aramco Saudia Arabia May-13 May-16
AOD-2 (NB*)*** Saudi Aramco Singapore - Keppel FELS Jul-13 Jun-16
AOD-3 (NB*)** Saudi Aramco Singapore - Keppel FELS Oct-13 Oct-13
Tender rigs
T15 Chevron Thailand May-13 May-18
T16 (NB*) Chevron China – COSCO Shipyard Jun-13 Jun-18
West Vencedor Cabina Gulf Oil Company/Chevron Angola Mar-10 Mar-15
* Newbuild under construction or in mobilization to its first drilling assignment. **Owned by our subsidiary North Atlantic Drilling in which we own 73 percent of the outstanding shares. ***Owned by Asia Offshore Drilling in which we own 66 percent of the outstanding shares.
Operations in associated companies Archer Limited (“Archer”) Archer is an international oilfield service company specializing in drilling and well services listed on the Oslo Stock Exchange. We currently own 231,053,239 shares in Archer, which represents a gross value of US$168 million based on the closing share price of NOK4.25 on May 27, 2013. Archer contributed to a loss of US$3 million to our first quarter net income based on Bloomberg estimates, compared to a loss of US$4 million in the fourth quarter 2012. Archer is reported as part of investment in associated companies under other financial items. For more information on Archer please see their quarterly report available on www.archerwell.com.
5
Sevan Drilling ASA (“Sevan Drilling”) Sevan Drilling is an offshore drilling company listed on the Oslo Stock Exchange. Sevan Drilling owns and operates two ultra-deepwater rigs of the cylindrical Sevan design in Brazil and has two additional rigs of similar design under construction. Delivery of their newbuilds is scheduled for the fourth quarter 2013 and second quarter 2014. The first newbuild has recently been fixed for a long-term contract in the US Gulf. Seadrill holds a 29.9 percent ownership stake through forward contracts for 177,828,500 shares. The current average strike price per share on the forward contracts is NOK3.98. Our exposure has a gross value of US$92 million based on Sevan’s closing share price on May 27, 2013. Sevan Drilling is reported as part of investment in associated companies under other financial items. For the first quarter, Sevan Drilling contributed to a loss of US$6 million to net income compared to US$2 million in the fourth quarter. Seadrill views the investment in Sevan as opportunistic and will continue to evaluate the investment compared to other alternatives to achieve growth and expansion for Seadrill. For more information on Sevan Drilling, see their separate quarterly report published on www.sevandrilling.com. Varia Perdana Bhd.(“Varia Perdana”) We had a 49 percent ownership interest in Varia Perdana, which owns and operates five self-erecting tender rigs. Our holding in Varia Perdana was divested in April 2013 through SapuraKencana’s acquisition of the tender rig business. During the first quarter, the tender rig T3 worked for PTTEP in Thailand and T10 worked for Chevron in Thailand. The tender rig T6 worked for CPOC (Carigali PTTEP Operating Company) and Carigali Hess in the Malaysia - Thailand Joint Development Area while the Teknik Berkat worked for Petronas Carigali. T9 operated for Petronas Carigali offshore Malaysia. Varia Perdana contributed US$11 million to our first quarter earnings compared to US$13 million in the fourth quarter. Contribution from Varia Perdana is reported as part of investment in associated companies under other financial items.
Other investments SapuraKencana Petroleum Bhd.(“SapuraKencana”) SapuraKencana is a fully integrated Malaysian oil service provider listed on the Malaysian Stock Exchange. On April 30, 2013 the transaction to integrate most of Seadrill’s tender rig fleet into SapuraKencana was completed. The transaction includes all tender rigs in Seadrill’s fleet except for the T15, T16 and the West Vencedor, which Seadrill Partners owns or has an option to acquire. The agreed upon acquisition price is for an enterprise value of US$2.9 billion. The purchase price is comprised of approximately US$1.2 billion in cash, US$350 million in new shares in SapuraKencana (at RMB2.70 per share), about US$760 million related to all the debt in the tender rigs business, future capital commitments of approximately US$310 million and a deferred consideration of US$187 million. The acquisition price has been adjusted for a tender rig EBITDA contribution of about US$75 million. After the transaction Seadrill owns 720,329,691shares in SapuraKencana representing a gross value of US$976 million based on a a share price of RMB4.1 on May 28, 2013. As of March 31, 2013 the assets and liabilities associated with the tender rig business sold to SapuraKencana has been classified as held for sale in our interim financial statements.

6
Subsequent to the closing of the transaction, Seadrill will continue to manage and supervise the current tender rigs under construction, manage three tender rigs outside of Asia and also provide management administration and support services. The Board is very pleased to have reached an agreement with SapuraKencana. After the transaction Seadrill is the third largest equity holder in SapuraKencana and have as of May 27 a total of approximatley US$360 million of unrealized gain on our shares in the Company Based on SapuraKencana´s broad offshore service portfolio and strong position in the Asian market Seadrill sees significant growth opportunities for the Company. We continue to support the Company’s strategic goal of becoming a global offshore services Company and to be the leading offshore service provider in Asia
Newbuilding program Since our last quarterly report in February 2013, we have taken delivery of one ultra-deepwater drillship, the West Auriga and one high specification jack-up, the AOD II. The West Auriga was delivered on time and on budget from the Samsung shipyard in South Korea in early April 2013. On April 15, 2013, the high specification jack-up AOD II was delivered from Keppel FELS in Singapore. The rig is currently in transit to the Middle East where it is expected to commence operations for Saudi Aramco in June. Its sister rig AOD I, delivered in January, commenced operations for Saudi Aramco on the first of May. In March, we exercised fixed price options for the construction of two high specification jack-up rigs at the Dalian shipyard in China. The total estimated project price is US$230 million per rig, with delivery scheduled for the third and fourth quarters of 2015. The two new units are based on the same design as the existing jack-ups under construction at the Dalian and Jurong shipyard in Singapore. We currently have 19 rigs under construction. In 2013 we will take delivery of two ultra-deepwater drillships, five high specification jack-up rigs, one tender rig and one harsh environment jack-up rig. In 2014 a total of four ultra-deepwater drillships will be delivered from the Samsung yard in Korea, while in 2015 we will take delivery of two harsh environment semi-submersible rigs and four high specification jack-up rigs. In total, 10 out of the 19 newbuilds have already secured long-term contracts upon delivery. Total remaining yard installments for our newbuilds are approximately US$5.8 billion and US$1.7 billion has been paid to the yards in pre-delivery installments. Note that in accordance with our accounting policy we re-classify rigs from newbuilds to drilling units upon commencement of its first contract. Please see Notes 10 and 11 to our interim financial statements for additional information. New contracts and contract extensions Since, we reported our fourth quarter earnings on February 28, 2013, we have entered into the following contracts and contract commitments. In April 2013, we secured a three-year contract with LLOG for the ultra-deepwater drillship West Neptune, which is under construction at Samsung and will be delivered during the second quarter 2014. After delivery, the rig will mobilize to the US Gulf of Mexico and commence operations. The agreed upon daily rate is US$570,000 and total estimated revenue potential

7
including compensation for mobilization is approximately US$662 million. LLOG has an option to extend the contract for one-year at mutually agreed rates. We recently secured extensions with Vietsovpetro for the two high specification jack-up rigs West Ariel and West Prospero. The rigs were extended for another eight months for operations offshore Vietnam at an agreed daily rate of US$162,000. For more detailed information regarding daily rates and contract durations including escalation, currency adjustment or other minor changes to daily rates and duration profiles, see our fleet status report or news releases on the our website www.seadrill.com
Market development The fundamental outlook for the oil and gas industry remains positive. Continued exploration successes and a backlog of development drilling programs continue to provide a line of sight to continued strength in the contract drilling industry. Modern ultra-deepwater floaters and premium jack-up rigs continue to be preferred by operators over older generation units due to the safety and operational efficiencies that these units can deliver through new technology, great capacities, and more versatility to drill a wider range of well designs. Our demonstrated operational and safety performance and a standardized high specification fleet continue to provide benefits in terms of extension opportunities on rigs in operations and new opportunities for our newbuilds. Ultra-deepwater floaters (>7,500 ft water) The utilization for the global ultra-deepwater fleet remains at 100% and a total of 21 new units will be delivered in 2013 and 21 units in 2014. Only two newbuild units are available for 2013, while 15 of the newbuild units for 2014 are without a fixed contract. However, specific discussions are ongoing for most of the uncommitted units and it is likely that the fleet will remain 100% utilized. The fact that only 11 new units have been ordered for delivery in 2015 coupled with the schedule for significant new ultra-deepwater development drilling, may lead to a tighter market. Africa and the US Gulf of Mexico were the predominant regions for ultra-deepwater contracts during Q1. While we expect this trend to continue through the remainder of the year, incremental demand from Asia, Brazil and the Mexican Gulf of Mexico is likely to further diversify and tighten the supply demand balance. We anticipate an increasing diversity of contract terms in the ultra-deepwater market with relatively short-term contracts being related to exploration drilling and activity from small and mid-sized independent oil companies. This customer segment is counterbalanced by long-term drilling campaigns underwritten by development drilling programs and major international oil companies’ exploration needs. We remain optimistic on the outlook for this segment and expect full utilization to continue. The investment case for 6th and 7 th generation ultra-deepwater drilling units is further supported by the fact that several operators are now replacing 4th and 5th generation deepwater units with modern equipment in order to meet new requirements and add additional safety margins to their operation. Furthermore, Oil companies are increasingly favoring contractors with proven rig delivery experience, a history of safe and efficient operations, established infrastructure, and experience and presence in the major deepwater basins Oil companies continue to increase their budgets and spending for ultra-deepwater investments by double-digit numbers; a strong trend that clearly supports deep-water drilling.

8
Premium jack-up rigs (>350 ft water) The market for premium jack-ups (350ft water depth and built after 2005) remains strong with utilization of marketed supply above 95% for the past year. During the same period the amount of open demand has increased in each successive quarter. There is also a clear trend that jack-up contracts are signed earlier and have longer terms than they had a year ago. We have seen several contracts in the market executed with contract duration between three and seven years. Asia and the Middle East continue to be the predominant source of demand for high specification jack-ups. We expect this trend to continue for the foreseeable future, supplemented by increasing high specification jack-up demand in other areas. Pemex in Mexico and major oil companies in West Africa, in particular, are increasingly interested in securing new units to replace aging assets. Oil companies continue to shift their focus toward higher specification jack-up rigs and the benefits in efficiency and safety that these units deliver. There is also increased demand for jack-ups capable of drilling HPHT wells which require units with higher pressure capacities and greater deck space found on modern units. These trends are supported by the increased number of cold stacked jack-ups since Q4 2012, indicating reluctance by oil companies to contract these older units even in geographic markets where demand is perceived to be greater than the marketed supply. Our continued belief in the need for fleet renewal within the premium jack-up market is evidenced by Seadrill’s decision to order four high specification jack-ups in the first quarter of this year Ongoing tender activity in the North Sea is expected to translate into additional awards, with a trend towards very large, high specification harsh environment jack-ups similar to our West Elara and West Linus units. Seadrill has recently participated in several long-term, high specification jack-up tenders but awards have been given to other drilling contractors at economic terms and conditions that are unattractive to Seadrill. We will continue to focus our investments on assets that offer greater flexibility and thereby meet the demand from a broad number of prospective clients. Corporate strategy, dividend and outlook Growth and Investments Seadrill is one of the leading offshore drilling companies in the global oil and gas industry with presence in all important offshore regions. We are the second largest owner and operator of ultra-deepwater units in the industry and the largest operator of modern premium jack-up rigs. The average age of our floating rigs is 3.7 years, while the average age of our jack-up fleet is 2.8 years (following the sale of the West Janus). The Company has now completed the sale of the tender rig business. Proceeds from this transaction give Seadrill significant capacity to grow both the ultra-deepwater and jack-up segments. The Board sees strong opportunities to grow these segments either organically or through selective acquisitions. Revenue backlog As of May 21 2013, our orderbacklog following the sale of the tender rig fleet was US$19.1 billion. This is a decrease of US$1.9 billion from February, largely related to a US$1.3 billion in revenue for the quarter and the sale of the tender rig fleet, which accounted for US$1.8 billion of the decrease, offset against new contracts and contract extensions. Our order backlog provides

9
clarity for future earnings as well as generates visibility for dividend capacity. With respect to our ultra-deepwater fleet we have the West Tellus available in 2013. We have three uncontracted ultra-deepwater units currently under construction and the West Navigator coming off contract in June 2014. Discussions with clients are ongoing for all these units and we do expect to announce new contracts for most of these units within the next six months. The average contract duration for our contracted deep-water units is 44 months. Most capacity has been firmed up for our jack-up fleet. There are two uncontracted newbuilds to be delivered in the third and fourth quarter 2013. With a strong jack-up market, we expect to have contracted these units at current market rates prior to delivery. The average contract length for our contracted jack-up units is 17 months. Financial flexibility We have significantly increased our financial flexibility this year through the sale of our tender rig business for US$2.9 billion and the drop down of T15 into Seadrill Partners LLC at a fair value of US$210 million. With attractive investment opportunities available to us, it can be expected that the liquidity provided from these transactions will be used to grow the Company further. Since our last quarterly report, we have secured a total of US$680 million in new financing. In March, we issued a NOK1.8 billion bond maturing in 2018, which bears a coupon of Nibor plus 3.75% per annum. Furthermore, we obtained a US$360 million five-year bank facility secured by the three Asia Offshore Drilling rigs at attractive terms and conditions. The harsh environment jack-up West Linus, scheduled for delivery in 2013, represents additional funding capacity that is yet to be utilized, however, we have already received interest from several banks for financing over and above the remaining yard installment at very competitive terms. In September 2012, we issued a US$1.0 billion bond in the US market with a coupon of 5.625%. The bond has recently been trading at approximately 104, corresponding to a yield of 4.6%. The solid performance of the Bond and the improved margins offered in the bank market confirms Seadrill’s improved credit statistics. The Board is of the opinion that a rating of the Company’s credit can improve the margins further and expect to start the rating process later this year. Seadrill has successfully secured funding for all 12 newbuilds to be delivered in 2013 except the West Linus, which we expect to secure during the third quarter. The support from Export Credit Agencies (ECA) together with commercial banks has been a key factor to this success and the Company intends to build further on these relationships for the 2014 and 2015 funding program. The Board remains highly confident that competitive financing can be raised for all Seadrill’s remaining newbuilds without raising any additional equity. Other Significant Investments We have investments in other listed offshore drillers and oil service companies. As of today our portfolio includes a 39.9 percent holding in Archer Limited, a 29.9 percent in Sevan Drilling, and 12 percent holding in SapuraKencana. Except for our strategic investments in Archer and SapuraKencana, the Board evaluates the prospects of these investments on a continuous basis. At current market prices, the total value of these investments is approximately US$1.2 billion. Quarterly Cash Dividend The Board has in connection with the disclosure of the first quarter results evaluated the current dividend level and prospects and has resolved to increase the regular quarterly dividend by US$0.03 to US$0.88. The dividend increase reflects Seadrill’s strong operational results, positive market outlook, solid orderbacklog and strong support received from the financing market. The Board believes that the new dividend is sustainable long-term and can be further increased as EBITDA is expected to grow by 50% over the next eight quarters. The ex. Dividend

10
date has been set to June 5, 2013, record date is June 7, 2013 and payment date is on or about June 20, 2013. Outlook The Board is pleased to see a record financial result for the Company. With a strong underlying operational performance in both the ultra-deepwater and jack-up segments and newbuilds commencing operation we expect Seadrill to continue to improve on financial results and increase its dividend capacity. The Board still expects Seadrill to reach an annual EBITDA run rate of US$4 billion in 2015. The overall ambition remains to deliver the highest shareholder return in our industry through dedicated focus on operational management, safe operations, financial management, and active portfolio management. The fundamentals are still in place for a strong offshore drilling market. Ultra-deepwater production is estimated to increase from approximately 1 million barrels a day currently, to approximately 5 million barrels a day in 2020. Strong production growth is likely to spur an increase in development drilling programs. Calculations by the independent energy advisor Rystad show that another 185 new units are needed by 2020 in order to meet the demand. In these numbers no additional supply is assumed to replace the 95 units that are older than 30 years. The premium jack-up market continues to demonstrate strength as evidenced by increasing dayrates and utilization rates. Customers continue to show preference for newer units from drilling contractors with proven track records of safe and efficient operations. Currently 311 jack-ups or 63% of the total fleet of 493 jack-ups are older than 25 years. In response to this trend, we have continued to invest in this segment with the order of four high specification jack-up units at the Dalian yard in China, for an all-in cost of US$230 million per unit. These four orders will increase Seadrill’s jack-up fleet to 28 units with an average age of 2.8 years, and further strengthens our position as the leading operator of premium modern, high specification drilling units. The Board is pleased to have completed the successful integration of our tender rig fleet into SapuraKencana. We are also pleased to see the positive development of the SapuraKencana share price since the deal was consummated. Our Q2 results will recognize EBITDA from the tender rig segment up until the closing date of the transaction, and our Q2 results will be positively impacted by a sales gain from this transaction. Seadrill will lose approximately US$100 million of EBITDA per quarter from the transaction, however as our newbuilds enter operation this year the EBITDA will be regained. The Board has together with the Board of NADL decided to postpone the proposed listing of NADL in New York until Q3 2013. The reason for the delay is related to the fact that NADL actively have been engaged in discussions with potential strategic partners. Such a transaction may include joint ventures as well as direct ownership. The target is to position the Company better for the high growth activities, which are expected in harsh environment areas like the Barents and Kara Sea. Certain progress has been made and a final decision if such a partnership will be realized should be expected within the next month. The Board is fully committed to completing the listing process whatever the outcome of these discussions may be and the Company will resume the IPO process in the third quarter. Seadrill Partners has performed well since the Company was introduced to the market in October 2012. Seadrill’s stake in Seadrill Partners has a current market value of US$889 million based on the closing price as of May 25. We see large opportunities to aggressively grow Seadrill Partners and its dividend distribution by dropping down some of Seadrill’s long term

11
contract assets, The flexibility to fund such growth will increase when the Company achieves seasoned issuer status in October 2013. We see no deterioration in the margin as a function of cost increases. Significant progress has been made in reducing the future G&A cost. The new head office in London is now operative and the former Seadrill head office in Stavanger will be closed down by June 30. Thus far in the second quarter we have achieved a technical utilization of more than 97% for our floater units and in excess of 99% for our jack-up fleet. This performance evidences that the Company is reverting to our solid operational track-record. The continuing low new-build prices, strong day-rate environment, solid cash flow and sizeable order backlog that is likely to increase in the months to come, creates a very interesting opportunity to support a high dividend payout while we continue to invest in our business and grow the Company. Based on the operational performance so far in the quarter the shareholders should expect continued strong results and dividend support in Q2. Forward-Looking Statements This news release includes forward looking statements. Such statements are generally not historical in nature, and specifically include statements about the Company’s plans, strategies, business prospects, changes and trends in its business and the markets in which it operates. In particular, statements include short list with general description of the forward looking statements in this release. These statements are made based upon management’s current plans, expectations, assumptions and beliefs concerning future events impacting the Company and therefore involve a number of risks, uncertainties and assumptions that could cause actual results to differ materially from those expressed or implied in the forward-looking statements, which speak only as of the date of this news release. Important factors that could cause actual results to differ material from those in the forward-looking statements include, but are not limited to offshore drilling market conditions, contract backlog, dry-docking and other costs of maintenance of the drilling rigs in the Company’s fleet, the cost and timing of shipyard and other capital projects, the performance of the drilling rigs in the Company’s fleet, delay in payment or disputes with customers, fluctuations in the international price of oil, international financial market conditions including the international financial crisie, changes in governmental regulations that affect the Company or the operations of the Company’s fleet, increased competition in the offshore drilling industry, and general economic, political and business conditions globally . Consequently, no forward-looking statement can be guaranteed. When considering these forward-looking statements, you should keep in mind the risks described from time to time in the Company’s filings with the SEC, including its Registration Statement on Form 20-F. The Company undertakes no obligation to update any forward looking statements to reflect events or circumstances after the date on which such statement is made or to reflect the occurrence of unanticipated events. New factors emerge from time to time, and it is not possible for us to predict all of these factors. Further, the Company cannot assess the impact of each such factors on its business or the extent to which any factor, or combination of factors, may cause actual results to be materially different from those contained in any forward looking statement.

12
May 28, 2013 The Board of Directors Seadrill Limited Hamilton, Bermuda Questions should be directed to Seadrill Management Ltd represented by: Fredrik Halvorsen: Chief Executive Officer and President Rune Magnus Lundetræ: Chief Financial Officer and Senior Vice President

13
Seadrill Limited
INDEX TO UNAUDITED CONSOLIDATED FINANCIAL STATEMENTS
Unaudited Consolidated Statement of Operations for the three month period ended March 31, 2013 and 2012
Page 2
Unaudited Consolidated Statement of Comprehensive Income for the three month period ended March 31, 2013 and 2012
Page 3
Unaudited Consolidated Balance Sheet as of March 31, 2013 and December 31, 2012
Page 4
Unaudited Consolidated Statement of Cash Flows for the three month period ended March 31, 2013 and 2012
Page 5
Unaudited Consolidated Statement of Changes in Shareholders’ Equity for the three month period ended March 31, 2013 and 2012.
Page 7
Notes to Unaudited Consolidated Financial Statements
Page 8

14
Seadrill Limited
UNAUDITED CONSOLIDATED STATEMENT OF OPERATIONS
for the three month period ended March 31, 2013 and 2012
(In US$ millions) Three month period
ended March 31,
2013 2012
Operating revenues
Contract revenues 1,195 1,025
Reimbursable revenues 64 25
Other revenues 6 -
Total operating revenues 1,265 1,050
Gain on sale of assets 61 -
Operating expenses
Vessel and rig operating expenses 482 381
Reimbursable expenses 59 23
Depreciation and amortization 161 139
General and administrative expenses 72 51
Total operating expenses 774 594
Net operating income 552 456
Financial items
Interest income 4 4
Interest expenses (108) (71)
Share in results from associated companies 2 18
Gain on re-measurement of previously held equity interest 10 -
Gain on bargain purchase 15 -
Gain/ (loss) on derivative financial instruments (5) 91
Foreign currency exchange gain / (loss) 13 (20)
Other financial items 1 2
Total financial items (68) 24
Income before income taxes 484 480
Income taxes (44) (41)
Net income 440 439
Net income attributable to the parent 409 416
Net income attributable to the non-controlling interest 31 23
Basic earnings per share (US$) 0.87 0.89
Diluted earnings per share (US$) 0.85 0.87
Declared regular dividend per share (US$) - 0.82
Declared extraordinary dividend per share (US$) - 0.15
See accompanying notes that are an integral part of these Consolidated Financial Statements.

15
Seadrill Limited
UNAUDITED CONSOLIDATED STATEMENT OF COMPREHENSIVE INCOME
for the three month period ended March 31, 2013 and 2012
(In US$ millions)
Three month period
ended March 31,
2013 2012
Net income 440 439
Other comprehensive income/ (loss), net of tax:
Change in unrealized (loss) on marketable securities (19) -
Change in unrealized foreign exchange differences - (8)
Change in unrealized (loss) relating to pension (2) -
Change in unrealized gain on interest rate swaps in VIEs 2 5
Other comprehensive (loss): (19) (3)
Total comprehensive income for the period 421 436
Comprehensive income attributable to the non-controlling interest 34 28
Comprehensive income attributable to the parent 387 408 See accompanying notes that are an integral part of these Consolidated Financial Statements.

16
Seadrill Limited
UNAUDITED CONSOLIDATED BALANCE SHEET
as of March 31, 2013 and December 31, 2012
(In US$ millions)
March 31,
2013
December 31, 2012
ASSETS Current assets Cash and cash equivalents 328 318 Restricted cash 174 184 Marketable securities, net 314 333 Accounts receivables, net 884 917 Amount due from related party 264 293 Current assets held for sale 195 -Other current assets 191 309
Total current assets 2,350 2,354
Non-current assets Investment in associated companies 420 509 Newbuildings 2,654 1,882 Drilling units 12,746 12,894 Goodwill 1,200 1,320 Restricted cash 201 218 Deferred tax assets 12 13 Equipment 41 40Non-current assets held for sale 1,188 -Other non-current assets 394 402
Total non-current assets 18,856 17,278
Total assets 21,206 19,632
LIABILITIES AND EQUITY Current liabilities Current portion of long-term debt 2,598 2,066Trade accounts payable 58 72Short-term deferred taxes 7 6Short-term debt to related party 218 131Current liabilities associated with assets held for sale 155 -Other current liabilities 1,746 1,338
Total current liabilities 4,782 3,613
Non-current liabilities Long-term interest bearing debt 7,883 8,695Long-term debt due to related parties 935 935Deferred taxes 32 77Non-current liabilities associated with assets held for sale 701 -Other non-current liabilities 343 288
Total non-current liabilities 9,894 9,995
Equity Common shares of par value US$2.00 per share: 800,000,000 shares authorized 469,129,874 outstanding at March 31, 2013 (December 31, 2012, 469,178,074) 939 938Additional paid in capital 2,329 2,332Contributed surplus 1,956 1,956Accumulated other comprehensive income 175 194Accumulated earnings 492 83Non-controlling interest 639 521
Total equity 6,530 6,024
Total liabilities and equity 21,206 19,632
See accompanying notes that are an integral part of these Consolidated Financial Statements.

17
Seadrill Limited
UNAUDITED CONSOLIDATED STATEMENT OF CASH FLOWS
for the three month period ended March 31, 2013 and 2012
(In US$ millions)
Three month period
ended March 31,
2013 2012
Cash Flows from Operating Activities
Net income 440 439Adjustments to reconcile net income to net cash provided by operating activities:
Depreciation and amortization 161 139 Amortization of deferred loan charges 7 7 Amortization of unfavorable contracts (7) -
Amortization of favorable contracts 2 3 Amortization of mobilization revenue (31) (31) Share of results from associated companies (2) (18) Share-based compensation expense 2 2
Unrealized (gain) related to derivative financial instruments (8) (37) Deferred income tax expense (3) (3) Unrealized foreign exchange (gain)/loss on long-term interest bearing debt (10) 4 Gain on disposals of fixed assets (61) -
Gain on re-measurement of previously held equity interest (10) - Gain on bargain purchase (15) - Changes in long-term maintenance (54) (14)
Changes in operating assets and liabilities, net of effect of acquisitions
Unrecognized mobilization fees received from customers 56 53 Trade accounts receivable (72) (86) Trade accounts payable 17 27
Prepaid expenses/(accrued revenue) 86 (33) Interest bearing note receivable with customers (4) - Other, net (71) (12)
Net cash provided by operating activities 423 440
Cash Flows from Investing Activities Additions to newbuildings (282) (506) Additions to rigs and equipment (100) (18) Acquisition of business (531)
Sale of rigs and equipment 48 - Change in margin calls and other restricted cash 15 108 Investment in associated companies (99) (14) Loan granted to related parties (125) -
Proceeds from realization of marketable securities - 4
Net cash used in investing activities (1,074) (426)

18
Seadrill Limited
UNAUDITED CONSOLIDATED STATEMENT OF CASH FLOWS
for the three month period ended March 31, 2013 and 2012
(In US$ millions)
Three month period
ended March 31,
2013 2012
Cash Flows from Financing Activities
Proceeds from debt 782 824 Repayments of debt (263) (622) Debt fees paid (24) (2) Proceeds from debt to related party 215 -
Repayments of debt to related party (120) - Contribution from non-controlling interests related to private placement - 66 Paid to non-controlling interests (16) (10) Change in current liability relating to share forward contracts 125 -
Proceeds from issuance of equity in subsidiaries to non-controlling interest - 59 Purchase of treasury shares (5) - Proceeds from sale of treasury shares - 2 Dividends paid - (369)
Net cash provided/(used) by financing activities 694 (52)
Effect of exchange rate changes on cash and cash equivalents - -
Net increase / (decrease) in cash and cash equivalents 43 (38)Cash and cash equivalents at beginning of the year 318 483
Cash and cash equivalents at the end of period 361 445
Cash and cash equivalents at the end of period 328 445
Cash and cash equivalents at the end of period – held for sale 33 -
Supplementary disclosure of cash flow information Interest paid, net of capitalized interest (72) (68)
Taxes paid (33) (45)
See accompanying notes that are an integral part of these Consolidated Financial Statements.

19
Seadrill Limited
UNAUDITED CONSOLIDATED STATEMENT OF CHANGES IN EQUITY
for the three month period ended March 31, 2013 and 2012
(In US$ millions)
See accompanying notes that are an integral part of these Consolidated Financial Statements.
Share
Capital
Additional
paid-in capital
Contributed
surplus
Accumulated
OCI
Retained
earnings NCI
Total
equity
Balance at December 31, 2011 935 2,097 1,956 (5) 994 325 6,302
Sale of treasury shares 2 2
Employee stock options issued 2 2
Private placement in subsidiary 84 66 150Costs related to capital increase in subsidiary (3) (3)Other comprehensive income (8) 5 (3)
Dividend payment (369) (10) (379)
Net income 416 23 439
Balance at March 31, 2012 935 2,182 1,956 (13) 1,041 409 6,510
Balance at December 31, 2012 938 2,332 1,956 194 83 521 6,024
Sale of treasury shares 1 1
Purchase of treasury shares (5) (5)
Employee stock options issued 2 2Establishment of non-controlling interest 100 100
Other comprehensive income (19) 3 (16)
Dividend payment (16) (16)
Net income 409 31 440
Balance at March 31, 2013 939 2,329 1,956 175 492 639 6,530
20
Seadrill Limited
Notes to Unaudited Consolidated Financial Statements
Note 1 - General information
Seadrill Limited was incorporated in Bermuda in May 2005 and is a publicly listed company on the New York Stock Exchange and the Oslo Stock Exchange. Through the acquisition of other companies and investment in newbuildings, we have developed into one of the largest international offshore drilling contractors. As of March 31, 2013 we owned and operated 44 offshore drilling units and have 26 units under construction. Our fleet consists of drillships, jack-up rigs, semi-submersible rigs and tender rigs for operations in shallow and deepwater areas, as well as benign and harsh environments. As used herein, and unless otherwise required by the context, the term “Seadrill” refers to Seadrill Limited and the terms “Company”, “we”, “Group”, “our” and words of similar import refer to Seadrill and its consolidated companies. The use herein of such terms as group, organization, we, us, our and its, or references to specific entities, is not intended to be a precise description of corporate relationships. Basis of presentation
The unaudited interim consolidated financial statements are stated in accordance with generally accepted accounting principles in the United States of America (US GAAP). The unaudited interim consolidated financial statements do not include all of the disclosures required in complete annual financial statements. These interim financial statements should be read in conjunction with our annual financial statements as at December 31, 2012. The year-end condensed balance sheet data that was derived from our audited 2012 financial statements does not include all disclosures required by accounting principles generally accepted in the United States of America. In the opinion of management, all adjustments (consisting of normal recurring adjustments) considered necessary for a fair statement have been included. The amounts are presented in United States dollar (US dollar) rounded to the nearest million, unless stated otherwise. We have in 2012 and 2011 significantly expanded our fleet of drilling rigs and as a result of this our long term maintenance has increased accordingly. In response to this, we determined that we had incorrectly classified payments related to long term maintenance as an investing activity rather than as an operating activity in the consolidated statement of cash flows for the period ended March 31, 2012. We concluded that such classification was not material to cash flows from operating activities and investing activities for previously reported periods. Accordingly, the presentation of the consolidated statement of cash flows for the period ending March 31, 2012 has been revised. This resulted in a decrease in cash provided by Operating Activities and an increase in cash used by Investing Activities, of $14 million.
Significant accounting policies
The accounting policies adopted in the preparation of the unaudited interim financial statements are consistent with those followed in the preparation of our annual audited consolidated financial statements for the year ended December 31, 2012 unless otherwise included in these unaudited interim financial statements as separate disclosures.
Note 2 - Recent Accounting Pronouncements
Recently Adopted Accounting Standards
Balance sheet—Effective January 1, 2013, we adopted the accounting standards update that expands the disclosure requirements for the offsetting of assets and liabilities related to certain financial instruments and derivative instruments. The update requires disclosures to present both gross information and net information for financial instruments and derivative instruments that are eligible for net presentation due to a right of offset, an enforceable master netting arrangement or similar agreement. The update is effective for interim and annual periods beginning on or after January 1, 2013. The adoption did not have an effect on our interim consolidated financial statements. Balance sheet—Effective January 1, 2013, we adopted the accounting standards update that requires an entity to report the effect of significant reclassifications out of accumulated other comprehensive income on the respective

21
line items in net income if the amount being reclassified is required under U.S. generally accepted accounting principles to be reclassified in its entirety to net income. For other amounts that are not required under U.S. GAAP to be reclassified in their entirety to net income in the same reporting period, an entity is required to cross-reference other disclosures required under U.S. GAAP that provide additional detail about those amounts. For public entities, the amendments are effective prospectively for reporting periods beginning after December 15, 2012. The adoption did not have an effect on our interim consolidated financial statements.
Note 3 - Segment information
Operating segments
The company provides offshore drilling services to the oil and gas industry. Our business has been organized into segments based on differences in management structure and reporting, economic characteristics, customer base, asset class, and contract structure. We currently operate in the following three segments: Floaters: We offer services encompassing drilling, completion and maintenance of offshore exploration and production wells. The drilling contracts for this segment relate to semi-submersible rigs and drillships for harsh and benign environments in mid-, deep- and ultra-deep waters. Jack-up rigs: We offer services encompassing drilling, completion and maintenance of offshore exploration and production wells. The drilling contracts for this segment relate to jack-up rigs for operations in harsh and benign environments. Tender rigs: We offer services encompassing drilling, completion and maintenance of offshore production wells in Southeast Asia, West Africa and the Americas. The drilling contracts for this segment relate to self-erecting tender rigs and semi-submersible tender rigs. Segment results are evaluated on the basis of operating profit, and the information given below is based on information used for internal management reporting. The accounting principles for the segments are the same as for our consolidated financial statements.
Contract revenues
(In US$ millions) Three months
ended March 31,
2013 2012
Floaters 757 657Jack-up rigs 256 199Tender rigs 182 169
Total 1,195 1,025
Depreciation and amortization (In US$ millions) Three months
ended March 31,
2013 2012 Floaters 117 94Jack-up rigs 37 32Tender rigs 7 13
Total 161 139

22
Operating income - net income
(In US$ millions) Three months
ended March 31,
2013 2012 Floaters 317 318Jack-up rigs 145 67Tender rigs 90 71Operating income 552 456
Unallocated items:
Total financial items (68) 24Income taxes (44) (41)
Net Income 440 439
Total Assets
(In US$ millions) As at March
31, 2013
As at December 31, 2012
Floaters 14,657 13,725Jack-up rigs 4,989 4,210Tender rigs 177 1,697Assets held for sale* 1,383 -
Total 21,206 19,632
* See note 21 for details related to assets and liabilities held for sale.
Goodwill
(In US$ millions) As at March
31, 2013
As at December 31, 2012
Floaters 890 890Jack-up rigs 281 281Tender rigs* 29 149
Total 1,200 1,320
* See note 21 for details related to assets and liabilities held for sale.
Total liabilities
(In US$ millions) As at March
31, 2013
As at December 31, 2012
Floaters 10,144 9,514Jack-up rigs 3,453 2,918Tender rigs 223 1,176Liabilities associated with assets held for sale* 856 -
Total 14,676 13,608
* See note 21 for details related to assets and liabilities held for sale.

23
Capital expenditures – fixed assets
(In US$ millions) As at March
31, 2013
As at December 31, 2012
Floaters 1,490 1,316Jack-up rigs 981 280Tender rigs * 183 287
Total 2,654 1,883
* See note 21 for details related to assets and liabilities held for sale.
Note 4 - Earnings per share
The computation of basic earnings per share (“EPS”) is based on the weighted average number of shares outstanding during the period. Diluted EPS includes the effect of the assumed conversion of potentially dilutive instruments. The components of the numerator for the calculation of basic and diluted EPS are as follows: (In US$ millions) Three months
ended March 31,
2013 2012 Net income available to stockholders 409 416Effect of dilution 9 9
Diluted net income available to stockholders 418 425
The components of the denominator for the calculation of basic and diluted EPS are as follows: (In millions) Three months
ended March 31,
2013 2012 Basic earnings per share:
Weighted average number of common shares outstanding 469 468
Diluted earnings per share:
Weighted average number of common shares outstanding 469 468Effect of dilutive share options 1 2Effect of dilutive convertible bonds 19 19
489 489

24
Note 5 – Taxation
Income taxes consist of the following: (In US$ millions)
Three month period
ended March 31, 2013 2012 Current tax expense:
Bermuda - -Foreign 41 41
Deferred tax expense: Bermuda - -Foreign 1 (2)Tax related to internal sale of assets in subsidiary, amortized for group purposes 2 2
Total tax expense 44 41
Effective tax rate 9.10% 8.75% The Company, including its subsidiaries, is taxable in several jurisdictions based on its rig operations. A loss in one jurisdiction may not be offset against taxable income in another jurisdiction. Thus, the Company may pay tax within some jurisdictions even though it might have an overall loss at the consolidated level. Income taxes for the three months ended March 31, 2013 and 2012 differed from the amount computed by applying the statutory income tax rate of 0% as follows: (In US$ millions)
Three month period
ended March 31, 2013 2012
Income taxes at statutory rate - -Effect of transfers to new tax jurisdictions 2 2Effect of taxable income in various countries 42 39
Total 44 41
Deferred Income Taxes
Deferred income taxes reflect the impact of temporary differences between the amount of assets and liabilities recognized for financial reporting purposes and such amounts recognized for tax purposes. The net deferred tax asset (liability) consists of the following: Deferred Tax Assets:
(In US$ millions)
As at March 31,
2013
As at December 31, 2012
Pension 8 8Provisions 2 3Other 2 2
Gross deferred tax asset 12 13
25
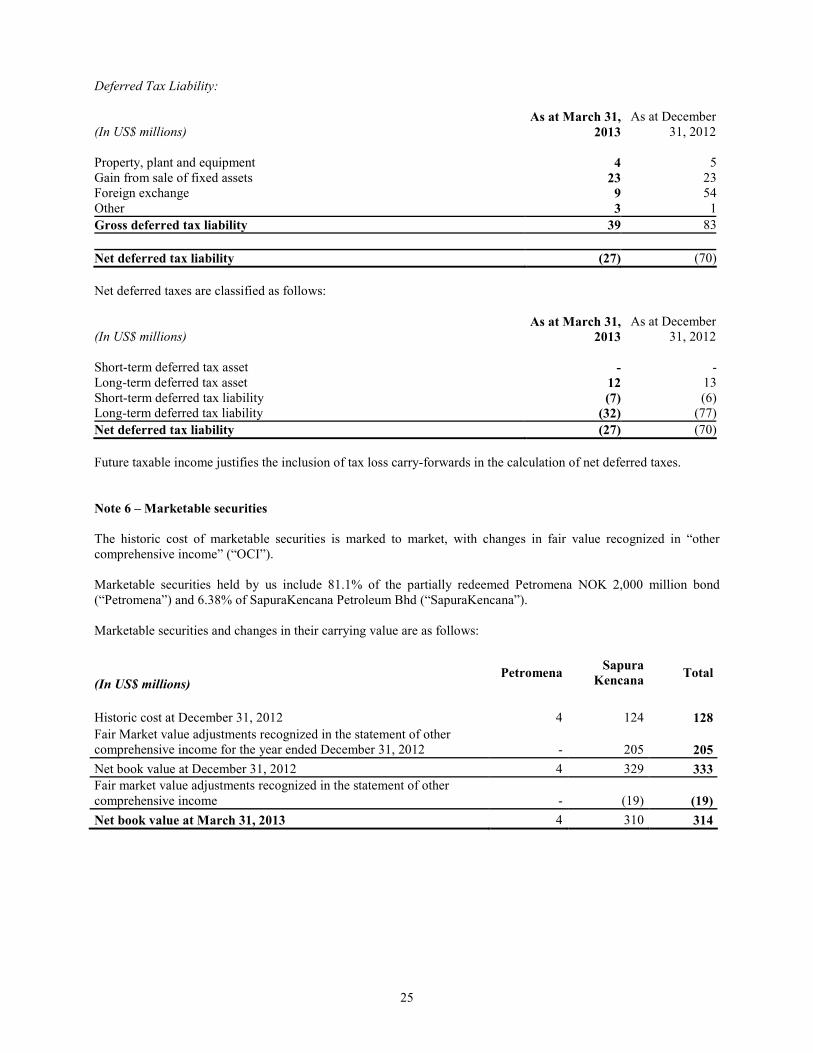
Deferred Tax Liability:
(In US$ millions)
As at March 31,
2013
As at December 31, 2012
Property, plant and equipment 4 5Gain from sale of fixed assets 23 23Foreign exchange 9 54Other 3 1
Gross deferred tax liability 39 83
Net deferred tax liability (27) (70)
Net deferred taxes are classified as follows: (In US$ millions)
As at March 31,
2013
As at December 31, 2012
Short-term deferred tax asset - -Long-term deferred tax asset 12 13Short-term deferred tax liability (7) (6)Long-term deferred tax liability (32) (77)
Net deferred tax liability (27) (70)
Future taxable income justifies the inclusion of tax loss carry-forwards in the calculation of net deferred taxes.
Note 6 – Marketable securities
The historic cost of marketable securities is marked to market, with changes in fair value recognized in “other comprehensive income” (“OCI”). Marketable securities held by us include 81.1% of the partially redeemed Petromena NOK 2,000 million bond (“Petromena”) and 6.38% of SapuraKencana Petroleum Bhd (“SapuraKencana”). Marketable securities and changes in their carrying value are as follows:
(In US$ millions) Petromena
Sapura
Kencana Total
Historic cost at December 31, 2012 4 124 128
Fair Market value adjustments recognized in the statement of other comprehensive income for the year ended December 31, 2012 - 205 205
Net book value at December 31, 2012 4 329 333
Fair market value adjustments recognized in the statement of other comprehensive income - (19) (19)
Net book value at March 31, 2013 4 310 314

26
Note 7 – Associated companies
Sevan Drilling ASA On January 30, 2013, we sold 96,000,000 shares of Sevan Drilling ASA (“Sevan”) and received a forward agreement with exposure to the same number of shares. The shares were sold at NOK 3.95 per share. The forward agreement ran until May 6th, 2013 and has a strike price of NOK 3.9851. On February 7, 2013, we were allocated and subscribed for 81,828,500 shares in Sevan at a subscription price of NOK 3.95. Subsequently, we financed these shares and entered into a forward agreement with exposure to the same number of shares. The forward agreement ran until May 6, 2013 and has a strike price of NOK 3.9815 per share. Following these transactions, we are not directly holding any shares in Sevan, but will be exposed through forward agreements to 177,828,500 shares. As of March 31, 2013 this exposure in Sevan constitutes 29.91 percent of all outstanding shares in Sevan. We have concluded that these above transactions are to be accounted for in accordance with the guidelines set out in ASC 860 Transfers and Pricing and treated as secured borrowings. Based on the guidance we have not changed the accounting for our investment in Sevan and continue to account for this as an investment in associated company using equity method accounting. The cash received from this transaction has been recorded with a corresponding short term liability at the inception of the arrangement. Archer Limited
On February 8, 2013, we were allocated 82,003,000 shares in the private placement of Archer Limited (“Archer”), amounting to a value of $98.4 million. In addition, as consideration for acting as an underwriter to the placement, we received another 2,811,793 shares, amounting to a value of $3.4 million. In conjunction with this private placement Archer refinanced some of its debt obligations. As part of Archer’s refinancing, Seadrill provided a guarantee to Archer on its payment obligations on a certain financing arrangement. The maximum liability to Seadrill is limited to $100 million, for a period of a maximum of ten years. As at March 31, 2013 we held 39.9% of the outstanding shares of Archer. Asia Offshore Drilling Ltd On January 31, 2013, Seadrill granted Asia Offshore Drilling Ltd (“AOD”) a unsecured loan of US$114.5 million. The loan bears interest at LIBOR + a margin of 7.5% and an arrangement fee constituting 1% of the principal is payable on maturity. The loan is repayable over a term of three months. The US$100 million was repaid to Seadrill following the equity issue on March 12, 2013. On March 12, 2013, AOD issued 20,000,000 new shares with a par value of US$1.00 and a subscription price of US$5.00, increasing the total of numbers of shares issued as of March 31, 2013 to 60,000,100. The additional share issue raised US$ 100 million in total, with Seadrill and the other major shareholder Mermaid Maritime Plc (“Mermaid”) subscribing to the entire share issue. Following this Seadrill owns 66.18%. Seadrill’s share was provided through a partial conversion of the short term loan of US$ 114.5 million to equity.
On March 25, 2013, we gained control of the board of AOD, and therefore we have consolidated the results of AOD into our financial statements prospectively with effect from March 25, 2013. Accordingly, AOD has been derecognized from associated companies. Refer to note 8.

27
Note 8 – Business Acquisitions
Acquisition of Songa Eclipse On November 15, 2012 a subsidiary of Seadrill Ltd entered into an agreement with Songa Eclipse Ltd to acquire the ultra-deepwater semi-submersible drilling rig, "Songa Eclipse" for cash consideration of US$590 million. The cash consideration also includes the acquisition of the drilling contract with Total Offshore Angola that is fixed and ending in December 2013 with three one year options to extend the contract. This acquisition is in line with our strategy of building a modern fleet through selective acquisitions and organic growth giving us an increased exposure to the ultra-deepwater market. A prepayment of US$59 million was made before the end of 2012 and the physical delivery and final payment took place on January 3, 2013 which is considered to be the acquisition date. This purchase is considered to constitute a business combination for accounting purposes. The fair value of the net assets acquired have been determined using independent broker valuations and estimated market prices for similar contracts. The unfavorable contract acquired is amortized over the estimated length of the contract, including extension periods, and is presented in the Statement of Operations within other revenues. Subsequent to the acquisition, the drilling rig has been renamed the West Eclipse. The preliminary fair values of net assets acquired were as follows: (In US$ millions)
January 3,
2013
Fair value of net assets acquired: Drilling units 698 Unfavorable contract – Other current liabilities (27) Unfavorable contract – Other non-current liabilities (81)
Net assets acquired 590
Fair value of consideration 590
The amounts of revenue and net income from the acquisition included in the interim consolidated financial statements are US$39 million and US$7 million respectively. Consolidation of Asia Offshore Drilling Ltd On March 25, 2013, we and the other major shareholder in AOD, Mermaid Maritime Plc, signed a shareholder resolution that changed the board composition in favor of the Company. Based on this change as of March 25, 2013 we control the Board and own 66.18% of the outstanding shares. As a result of obtaining control we must consolidate the results and financial position of AOD. The acquisition is considered to constitute a business combination achieved in stages for accounting purposes. The fair values of the net assets acquired have been determined based on independent broker valuations for drilling rigs and newbuilds and estimated remaining contractual payments for newbuilds under construction. The fair value of the non-controlling interest has been determined based on the quoted share price for AOD at the time of the acquisition. The preliminary fair values of net assets acquired, the remeasurement of our previously held equity interest, measurement of the non-controlling interest and associated bargain purchase gain are as follows: (In US$ millions)
March 25,
2013
Cash and cash equivalents 1
Current assets 1
Drilling units 633
Non-current assets 633
Construction obligation (316)Other current liabilities (8)
Current liabilities (324)
Non-current liabilities -
Net assets acquired 310
28
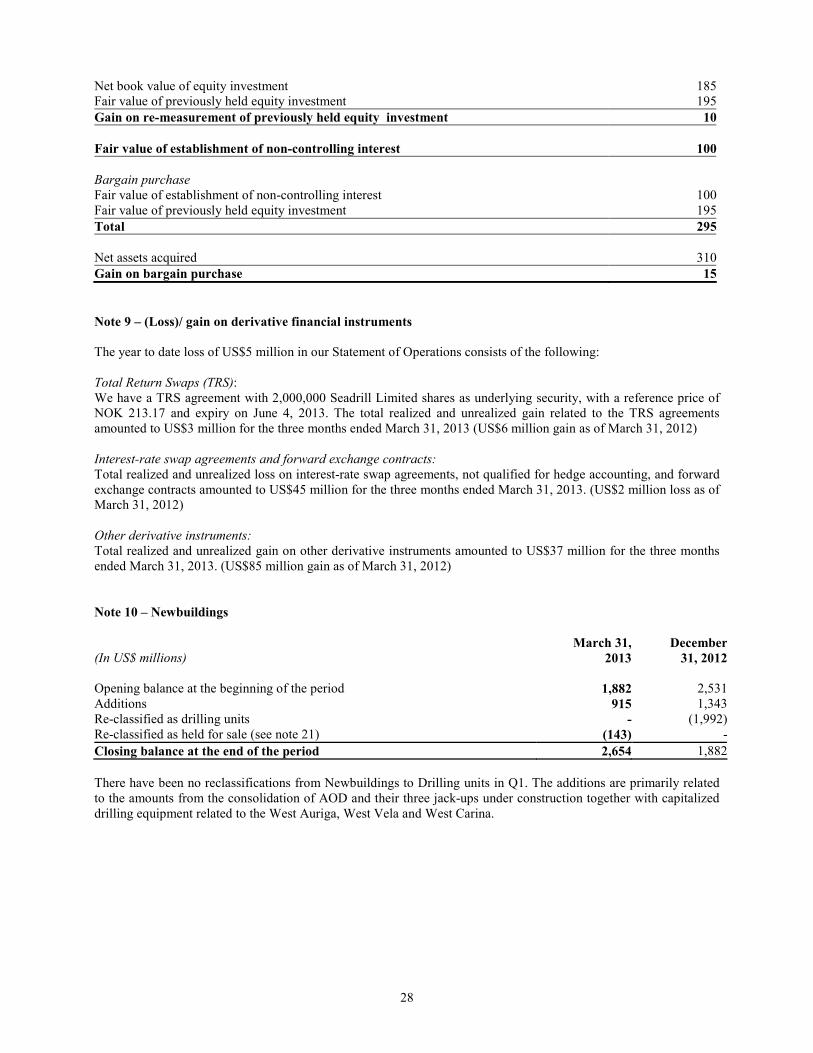
Net book value of equity investment 185Fair value of previously held equity investment 195
Gain on re-measurement of previously held equity investment 10
Fair value of establishment of non-controlling interest 100
Bargain purchase
Fair value of establishment of non-controlling interest 100 Fair value of previously held equity investment 195
Total 295
Net assets acquired 310
Gain on bargain purchase 15
Note 9 – (Loss)/ gain on derivative financial instruments
The year to date loss of US$5 million in our Statement of Operations consists of the following:
Total Return Swaps (TRS): We have a TRS agreement with 2,000,000 Seadrill Limited shares as underlying security, with a reference price of NOK 213.17 and expiry on June 4, 2013. The total realized and unrealized gain related to the TRS agreements amounted to US$3 million for the three months ended March 31, 2013 (US$6 million gain as of March 31, 2012) Interest-rate swap agreements and forward exchange contracts:
Total realized and unrealized loss on interest-rate swap agreements, not qualified for hedge accounting, and forward exchange contracts amounted to US$45 million for the three months ended March 31, 2013. (US$2 million loss as of March 31, 2012) Other derivative instruments:
Total realized and unrealized gain on other derivative instruments amounted to US$37 million for the three months ended March 31, 2013. (US$85 million gain as of March 31, 2012)
Note 10 – Newbuildings
(In US$ millions)
March 31,
2013
December
31, 2012
Opening balance at the beginning of the period 1,882 2,531 Additions 915 1,343Re-classified as drilling units - (1,992)Re-classified as held for sale (see note 21) (143) -
Closing balance at the end of the period 2,654 1,882
There have been no reclassifications from Newbuildings to Drilling units in Q1. The additions are primarily related to the amounts from the consolidation of AOD and their three jack-ups under construction together with capitalized drilling equipment related to the West Auriga, West Vela and West Carina.

29
Note 11 – Drilling units
(In US$ millions)
March 31,
2013
December 31, 2012
Cost 15,979 15,177Accumulated depreciation (2,442) (2,283)Re-classified as held for sale (see note 21) (791) -
Net book value 12,746 12,894
The increase in cost is primarily due to the purchase of Songa Eclipse (renamed West Eclipse) from Songa Offshore SE (see note 8). The depreciation expense was US$159 million and US$138 million for the three months ended March 31, 2013 and 2012, respectively.
Note 12– Equipment
Equipment consists of IT and office equipment, furniture and fittings.
(In US$ millions)
March 31,
2013
December 31, 2012
Cost 65 62Accumulated depreciation (24) (22)
Net book value 41 40
Depreciation expense was US$2 million and US$1 million for the three months ended March 31, 2013 and 2012, respectively.
Note 13 – Goodwill
In the three and twelve months ended December 31, 2012 there was no change in the total carrying value of goodwill. The goodwill balance and changes in the carrying amount of goodwill are as follows: (In US$ millions)
March 31,
2013
December 31, 2012
Net book value at beginning of period 1,320 1,320Goodwill acquired during the period - -Impairment losses - -Goodwill associated with assets held for sale (see note 21) (120) -
Net book value at end of period 1,200 1,320

30
Note 14 – Long-term interest bearing debt and interest expenses
(In US$ millions) March 31,
2013
December 31, 2012
Credit facilities: US$800 facility 216 227US$900 facility * - 731US$100 facility * - 69US$1,500 facility 838 882US$1,200 facility 833 867US$700 facility 543 560US$1,121 facility 992 1,019US$2,000 facility (North Atlantic Drilling) 1,708 1,750US$170 facility 80 83US$550 facility 481 495US$400 facility 350 360US$440 facility 101 101US$450 facility 450 -
Total credit facilities 6,592 7,144
Debt recorded in consolidated VIE’s:
US$700 facility 414 397US$1,400 facility 792 822
Total debt recorded in consolidated VIE’s 1,206 1,219
Bonds and convertible bonds:
Bonds 1,867 1,567Convertible bonds 565 561
Total bonds and convertible bonds 2,432 2,128
Other credit facilities with corresponding restricted cash deposits: 251 270
Total interest bearing debt 10,481 10,761
Less: current portion (2,598) (2,066)
Long-term portion of interest bearing debt 7,883 8,695
The outstanding debt as of March 31, 2013 is repayable as follows: (In US$ millions)
March 31,
2013
2014 2,598
2015 1,896
2016 1,209
2017 1,481
2018 and thereafter 3,382
Effect of amortization of convertible bond (85)
Total debt 10,481
* The following loans are classified as liabilities held for sale as at March 31, 2013. (In US$ millions)
March 31,
2013
Credit facilities:
US$900 facility 713
US$100 facility 67
Total interest bearing debt 780
Less: current portion (81)
Long-term portion of interest bearing debt classified as held for sale 699

31
In January 2013, we drew down on the new $450 million Eclipse facility, which was entered into with a syndicate of banks and financial institutions. The facility is secured over the West Eclipse semi-submersible rig, which has a net book value of $697 million. The facility matures within one year and bears interest of LIBOR plus 3%. On March 5, 2013 we issued a NOK 1,800 million senior unsecured bond with maturity in March 2018. The bond bears interest of NIBOR plus a margin of 3.75%. The financial covenant related to this bond require us to maintain a market adjusted equity ratio of at least 30%.
Note 15 – Share capital
March 31, 2013 December 31, 2012 All shares are common shares of US$2.00 par value
each Shares
US$
millions Shares US$
millions Authorized share capital 800,000,000 1,600 800,000,000 1,600 Issued and fully paid share capital 469,250,933 939 469,250,933 938 Treasury shares held by Company (121,059) - (72,859) -
Shares issued and outstanding 469,129,874 939 469,178,074 938
Note 16 – Accumulated other comprehensive income
Accumulated other comprehensive income as at March 31, 2013 and December 31, 2012 was as follows:
(In US$ millions) As at
March 31,
As at December 31,
2013 2012
The total balance of accumulated other comprehensive income is made up as follows:
Unrealized gain on marketable securities 187 206
Unrealized gain on foreign exchange 67 67
Actuarial gain relating to pension (32) (30)
Unrealized loss on interest rate swaps in VIEs (47) (49)
Accumulated other comprehensive income 175 194
The applicable amount of income taxes associated with each component of other comprehensive income is $0 due to the fact that the items relate to companies domiciled in non-taxable jurisdictions. However, for actuarial loss related to pension, the accumulated applicable amount of income taxes is US$9 million (US$8 million as of December 31, 2012), as this item is related to companies domiciled in Norway where the tax rate is 28%.
Note 17 – Related party transactions
We have entered into sale and leaseback contracts for several drilling units with Ship Finance International Limited (“Ship Finance”), a company in which our principal shareholders Hemen Holding Ltd and Farahead Investments Inc (hereafter jointly referred to as “Hemen”) and companies associated with Hemen have a significant interest. Hemen is controlled by trusts established by the Company’s President and Chairman Mr. John Fredriksen for the benefit of his immediate family. We have determined that the Ship Finance subsidiaries, which own the units, are variable interest entities (VIEs), and that we are the primary beneficiary of the risks and rewards connected with the ownership of the units and the charter contracts. Accordingly, these VIEs are consolidated in our financial statements. The equity attributable to Ship Finance in the VIEs is included in non-controlling interests in our consolidated financial statements.

32
In the three month period ended March 31, 2013 and 2012, we incurred the following lease costs on units leased back from Ship Finance subsidiaries:
(In US$ millions) Three month period
ended March 31,
2013 2012 West Polaris 18 31West Hercules 19 19West Taurus 28 28
Total 65 78
These lease costs are eliminated on consolidation. On July 1, 2010, the VIE companies SFL Deepwater and SFL Polaris declared and paid a dividend of US$290 million and US$145 million respectively to Ship Finance International Limited (SFIL). SFIL simultaneously granted loans to SFL Deepwater and SFL Polaris of the same amounts with an interest rate of 4.5%. These loans are presented as long term debt to related parties in our balance sheet on March 31, 2013 and December 31, 2012. On November 12, 2012 we granted Archer a short term unsecured loan of US$55 million. The loan bears interest of LIBOR + a margin and was settled in February 2013. On December 20, 2012, we sold our North Atlantic Drilling Ltd unsecured bond of US$500 million to Metrogas plus accrued interest of US$8.7 million with a call option to repurchase the bond in full for a price equal to par plus unpaid accrued interest on the date of repurchase. The call option matures in June 2013. The obligation is recorded as a long-term related party liability. In conjunction with this arrangement we also entered into an agreement to settle dividend payable to Metrogas in return for a short-term unsecured loan of US$93 million. The net proceeds from these arrangements were US$415.3 million. On December 21, 2012, we obtained a short-term unsecured loan of US$93 million from Metrogas. The loan bears interest of LIBOR + a margin and was repaid after the period end on May 2, 2013. On December 31, 2012, we obtained a short-term loan from Metrogas of NOK140 million. The loan bears interest of NIBOR + a margin and was repaid in January 2, 2013. On January 31, 2013, we granted AOD a unsecured loan of US$114.5 million. The loan bears interest of LIBOR + a margin of 7.5%. See note 7. On February 20, 2013, we obtained a short-term unsecured loan of US$43 million from Archer. The loan bears interest of LIBOR + a margin of 5% and was repaid on February 27, 2013. On February 27, 2013, we obtained a short-term loan from Metrogas of NOK300 million. The loan bears interest of NIBOR + a margin and was repaid on March 12, 2013. On March 27, 2013, we obtained a short-term loan from Metrogas of NOK700 million. The loan bears interest of NIBOR + a margin, and was repaid after the period end on April 3, 2013. On March 27, 2013 we granted Archer a short term unsecured loan of US$10 million. The loan bears interest of LIBOR + a margin of 5% and matured April 2, 2013. Frontline provides management support and administrative services for the Company, and charged the Company fees of US$0.4 million and US$0.5 for the three months ended March 31, 2013 and 2012 respectively. These amounts are included in "General and administrative expenses".

33
Note 18 – Risk management and financial instruments
The majority of our gross earnings from rigs and vessels are receivable in US dollars and the majority of our other transactions, assets and liabilities are denominated in US dollars, the functional currency of the Company. However, we have operations and assets in a number of countries worldwide and incur expenditures in other currencies, causing results from operations to be affected by fluctuations in currency exchange rates, primarily relative to the US dollar. We are also exposed to changes in interest rates on floating interest rate debt, and to the impact of changes in currency exchange rates on NOK denominated debt. There is thus a risk that currency and interest rate fluctuations will have a negative effect on the value of our cash flows.
Interest rate risk management
Our exposure to interest rate risk relates mainly to floating interest rate debt and balances of surplus funds placed with financial institutions. This exposure is managed through the use of interest rate swaps and other derivative arrangements. Our objective is to obtain the most favorable interest rate borrowings available without increasing foreign currency exposure. Surplus funds are used for prepayment of revolving facilities or placed in fixed deposits with reputable financial institutions, yielding higher returns than are available on overnight deposits in banks. Such deposits generally have short-term maturities, in order to provide us with flexibility to meet all requirements for working capital and capital investments. The extent to which we utilize interest rate swaps and other derivatives to manage interest rate risk is determined by the net debt exposure and our views on future interest rates.
Interest rate swap agreements not qualified as hedge accounting
At March 31, 2013 we had interest rate swap agreements with an outstanding principal of US$8,950 million (December 31, 2012: US$6,148 million). In addition, we had outstanding cross currency interest rate swaps at March 31, 2013 with a principal amount of US$532 million (December 31, 2012: US$216 million). These agreements do not qualify for hedge accounting and accordingly any changes in the fair values of the swap agreements are included in the Consolidated Statement of Operations under "(Loss)/gain on derivative financial instruments". The combined total fair value of the interest rate swaps and cross currency interest swaps outstanding at March 31, 2013 amounted to a liability of US$381 million (December 31, 2012: a liability of US$375 million). The fair value of the interest rate swaps are classified as other current liabilities and the cross currency interest swaps are classified as other current assets in the balance sheet. During the three months to March 31, 2013 we entered into the following new interest rate and cross currency interest rate swaps:
Outstanding principal
(In US$ millions) Receive rate Pay rate Length of contract
250 3 month LIBOR 1.36% Jan 2013 - Jan 2020
250 3 month LIBOR 1.39% Jan 2013 - Jan 2020
250 3 month LIBOR 1.45% Jan 2013 - Jan 2020
250 3 month LIBOR 1.45% Jan 2013 - Jan 2020
250 3 month LIBOR 1.47% Jan 2013 - Jan 2020
250 3 month LIBOR 1.47% Jan 2013 - Jan 2020
450 3 month LIBOR 1.10% Feb 2013 - Feb 2018
250 3 month LIBOR 1.52% Feb 2013 - Feb 2020
200 3 month LIBOR 1.39% Mar 2013 - Mar 2020
300 3 month LIBOR 1.57% Mar 2014 - Mar 2020
Interest rate hedge accounting
One of the Ship Finance subsidiaries consolidated by the Company as a VIE has entered into an interest rate swap in order to mitigate its exposure to variability in cash flows for future interest payments on the loans taken out to finance the acquisition of West Taurus. These interest rate swaps qualify for hedge accounting and any changes in their fair value are included in "Other comprehensive income". Below is a summary of the notional amount, fixed interest rate payable and duration of this interest rate swap.

34
Variable interest entity Outstanding principal
(In US$ Millions) Receive rate Pay rate Length of contract
SFL Deepwater Limited (West Taurus)
450 1 month LIBOR 2.17% Dec 2008 - Aug 2013
In the three month period ended March 31, 2013, the above VIE Ship Finance subsidiary recorded fair value gains of $2 million on interest rate swaps. This gain was recorded by the VIE in "Other comprehensive income" but due to its ownership by Ship Finance this loss is allocated to "Non-controlling interest" in our equity statement. Any change in fair value resulting from hedge ineffectiveness is recognized immediately in earnings. The VIE, and therefore Seadrill, did not recognize any gain or loss due to hedge ineffectiveness in the consolidated financial statements during the three month period ended March 31, 2013.
Foreign currency risk management
We use foreign currency forward contracts and other derivatives to manage exposure to foreign currency risk on certain assets, liabilities and future anticipated transactions. Such derivative contracts do not qualify for hedge accounting treatment and are recorded in the balance sheet under receivables if the contracts have a net positive fair value, and under other short-term liabilities if the contracts have a net negative fair value. At March 31 2013, we had forward contracts and cross currency interest rate swaps to sell approximately US$390 million between February 2014 and March 2018 at exchange rates ranging from NOK5.70 to NOK5.79 per US dollar. The total fair value of currency forward contracts as at March 31, 2013 amounted to a liability of US$19 million (December 31, 2012: asset of US$4 million).
Total Return Swap Agreements
In March 2013, the Company entered into a TRS agreement with 2,000,000 Seadrill Limited shares as underlying security. This agreement expires in June 2013 and the agreed reference price was NOK 213.17 per share. The total realized and unrealized gain relating to TRS agreements for the three months ended March 31, 2013, amounted to US$3 million.
Credit risk
The Company has financial assets, including cash and cash equivalents, marketable securities, other receivables and certain amounts receivable on derivative instruments, mainly forward exchange contracts and interest rate swaps. These assets expose the Company to credit risk arising from possible default by the counterparty. The Company considers the counterparties to be creditworthy financial institutions and does not expect any significant loss to result from non-performance by such counterparties. The Company, in the normal course of business, does not demand collateral. The credit exposure of interest rate swap agreements, currency option contracts and foreign currency contracts is represented by the fair value of contracts with a positive fair value at the end of each period, reduced by the effects of master netting agreements. It is the Company's policy to enter into master netting agreements with the counterparties to derivative financial instrument contracts, which give the Company the legal right to discharge all or a portion of amounts owed to a counterparty by offsetting them against amounts that the counterparty owes to the Company.

35
Fair values of financial instruments
The carrying value and estimated fair value of the Company's financial instruments at March 31, 2013 and December 31, 2012 were as follows: March 31, 2013 December 31, 2012
(In US$ millions) Fair
value
Carrying
value
Fair
value
Carrying
value
Cash and cash equivalents 328 328 318 318Restricted cash 375 375 402 402 Current portion of long-term debt 2,601 2,598 2,066 2,066Long-term portion of floating rate debt 5,465 5,465 6,287 6,287Long term portion of fixed rate CIRR loans 201 201 218 218Long term portion of fixed interest loans - - 70 79Long term portion of fixed interest convertible bonds 721 565 872 561Long term portion of fixed interest bonds 1,355 1,342 1,360 1,342Long term portion of floating interest bonds 310 310 224 220
Total debt 10,653 10,481 11,097 10,773
The carrying value of cash and cash equivalents and restricted cash, which are highly liquid, is a reasonable estimate of fair value and categorized at level 1 on the fair value measurement hierarchy. The fair value of the current and long-term portion of floating rate debt is estimated to be equal to the carrying value since it bears variable interest rates, which are reset regularly, usually every one to six months. This debt is not freely tradable and cannot be purchased by the Company at prices other than the outstanding balance plus accrued interest. We have categorized this at level 2 on the fair value measurement hierarchy. The fair value of the long-term portion of the fixed rate CIRR loans is equal to the carrying value, as they are matched with equal balances of restricted cash. We have categorized this at level 2 on the fair value measurement hierarchy. The convertible bonds are freely tradable and their fair value has been set equal to the price at which they were traded at on March 31, 2013 and December 31, 2012. We have categorized this at level 1 on the fair value measurement hierarchy. The fixed interest rate bonds are freely tradable and their fair value has been set equal to the price at which they were traded at on March 31, 2013 and December 31, 2012. We have categorized this at level 1 on the fair value measurement hierarchy. Financial instruments that are measured at fair value on a recurring basis: Fair value Fair value measurements
at reporting date using Quoted Prices in
Active Markets
for Identical
Assets
Significant
Other
Observable
Inputs
Significant
Unobservable
Inputs
(In US$ millions) March
31, 2013
(Level 1) (Level 2) (Level 3)
Assets: Marketable securities 314 310 - 4
Other derivative instruments – short term receivable 14 - 14 -
Total assets 328 310 14 4
Liabilities: Interest rate swap contracts – short term payable 381 - 381 -
Other derivative instruments – short term payable 9 - 9 -
Total liabilities 390 - 390 -

36
Fair value Fair value measurements
at reporting date using Quoted Prices in
Active Markets for Identical
Assets
Significant Other
Observable Inputs
Significant Unobservable
Inputs
(In US$ millions) December31, 2012
(Level 1) (Level 2) (Level 3)
Assets: Marketable securities 333 329 - 4Other derivative instruments – short term receivable 11 - 11 -
Total assets 344 329 11 4
Liabilities: Interest rate swap contracts – short term payable 397 - 397 -Other derivative instruments – short term payable - - - -
Total liabilities 397 - 397 -
ASC Topic 820 Fair Value Measurement and Disclosures emphasizes that fair value is a market-based measurement, not an entity-specific measurement, and should be determined based on the assumptions that market participants would use in pricing the asset or liability. As a basis for considering market participant assumptions in fair value measurements, ASC Topic 820 establishes a fair value hierarchy that distinguishes between market participant assumptions based on market data obtained from sources independent of the reporting entity (observable inputs that are classified within levels one and two of the hierarchy) and the reporting entity's own assumptions about market participant assumptions (unobservable inputs classified within level three of the hierarchy). Level one input utilizes unadjusted quoted prices in active markets for identical assets or liabilities that the Company has the ability to access. Level two inputs are inputs other than quoted prices included in level one that are observable for the asset or liability, either directly or indirectly. Level two inputs may include quoted prices for similar assets and liabilities in active markets, as well as inputs that are observable for the asset or liability, other than quoted prices, such as interest rates, foreign exchange rates and yield curves that are observable at commonly quoted intervals. Level three inputs are unobservable inputs for the asset or liability, which are typically based on an entity's own assumptions, as there is little, if any, related market activity. In instances where the determination of the fair value measurement is based on inputs from different levels of the fair value hierarchy, the level in the fair value hierarchy within which the entire fair value measurement falls is based on the lowest level input that is significant to the fair value measurement in its entirety. The Company's assessment of the significance of a particular input to the fair value measurement in its entirety requires judgment, and considers factors specific to the asset or liability. Quoted market prices are used to estimate the fair value of marketable securities, which are valued at fair value on a recurring basis. The fair value of total return equity swaps is calculated using the closing prices of the underlying listed shares, dividends paid since inception and the interest rate charged by the counterparty. The fair values of interest rate swaps and forward exchange contracts are calculated using well-established independent valuation techniques applied to contracted cash flows and LIBOR and NIBOR interest rates as of March 31, 2013. The fair value of other derivative instruments is calculated using the closing prices of the underlying securities, dividends paid since inception and the interest charged by the counterparty. As of March 31, 2013 and December 31, 2012 liabilities or assets related to financial and derivative instruments are presented at gross amounts and have not been presented net because we do not have the right of offset. The amounts are included in our fair value table above.

37
Note 19 – Commitments and contingencies
Purchase Commitments
At March 31, 2013, we had twenty six contractual commitments under newbuilding contracts. The contracts are for the construction of two semi-submersible rigs, seven drillships, twelve jack-up rigs, and five tender rigs. The units are scheduled to be delivered in 2013, 2014 and 2015. As of March 31, we have paid $2,482 million related to these rigs, including payments to the construction yards and other payments, and are committed to make further payments amounting to $6,514 million. These amounts include contract variation orders, spares, accrued interest expenses, construction supervision and operation preparation. The maturity schedule for the remaining payments is as follows: (In US$ millions) 2013* 2,836
2014 1,748
2015 1,930
Total 6,514
* Included in this amount are contractual commitments which relate to assets held for sale (see Note 21) of $307 million for the T-17, T-18 and West Esperanza tender rigs.
Legal Proceedings
We are a party, as plaintiff or defendant, to lawsuits in various jurisdictions for demurrage, damages, off-hire and other claims and commercial disputes arising from the construction or operation of our drilling units, in the ordinary course of business or in connection with our acquisition activities. We believe that the resolution of such claims will not have a material impact individually or in the aggregate on our operations or financial condition. Our best estimate of the outcome of the various disputes has been reflected in our financial statements as of March 31, 2013.
Note 20 – Variable Interest Entities (VIEs)
As of March 31, 2013, the Company leased a drillship and two semi-submersible rigs from VIEs under finance leases. Each of the units had been sold by the Company to single purpose subsidiaries of Ship Finance Ltd and simultaneously leased back by the Company on bareboat charter contracts for a term of 15 years. The Company has several options to repurchase the units during the charter periods, and obligations to purchase the assets at the end of the 15 year lease period. The following table gives a summary of the sale and leaseback arrangements, as of March 31, 2013: Unit Effective
from Sale value (In US$ millions)
First repurchase
option (In US$ millions)
Month of first repurchase
option
Last repurchase option * (In US$ millions)
Month of last repurchase Option *
West Polaris Jul 2008 850 548 Sep 2012 178 Jun 2023 West Taurus Nov 2008 850 418 Feb 2015 149 Nov 2023 West Hercules Oct 2008 850 580 Aug 2011 135 Aug 2023 * For the unit West Polaris, Ship Finance has a put option exercisable at the end of the lease terms by which the vessel may be sold to Seadrill for a fixed price of $75 million. For West Taurus and West Hercules repurchase obligations at the end of the lease terms have been agreed, at $149 million and $135 million, respectively. The Company has determined that the Ship Finance subsidiaries, which own the units, are variable interest entities (VIEs), and that the Company is the primary beneficiary of the risks and rewards connected with the ownership of the units and the charter contracts. Accordingly, these VIEs are fully consolidated in the Company's consolidated financial statements. The Company did not record any gains from the sale of the units, as they continued to be reported as assets at their original cost in the Company's balance sheet at the time of each transaction. The equity attributable to Ship Finance in the VIEs is included in non-controlling interests in the Company's consolidated

38
accounts. At March 31, 2013 and at December 31, 2012 the units are reported under drilling units in the Company's balance sheet. The bareboat charter rates are set on the basis of a Base LIBOR Interest Rate for each bareboat charter contract, and thereafter are adjusted for differences between the LIBOR fixing each month and the Base LIBOR Interest Rate for each contract. A summary of the bareboat charter rates per day for each unit is given below. The amounts shown are based on the Base LIBOR Interest Rate, and reflect average rates for the year. (In US$ thousands)
Unit Base LIBOR interest rate 2013 2014 2015 2016 2017
West Polaris 2.85 % 223.3 176.5 175.4 170.0 170.0 West Taurus 4.25 % 316.2* 320.7 165.0 158.8 157.5 West Hercules 4.25 % 250.0 238.5 180.0 172.5 170.0 * For a period the interest rates West Taurus have been fixed at 2.17% and the bareboat charter rate for West Taurus is fixed regardless of movements in LIBOR interest rates. The fixed charter rate is reflected in the above table. The assets and liabilities in the accounts of the VIEs as at March 31, 2013 and as at December 31, 2012 are as follows: March 31, 2013 December 31, 2012
(In US$ millions)
SFL West Polaris Limited
SFL Deepwater
Limited
SFL West Polaris Limited
SFL Deepwater
Limited Name of unit West Polaris West Taurus
West Hercules
West Polaris West Taurus West Hercules
Investment in finance lease 522 1,089 534 1,120 Other assets 14 20 7 20
Total assets 536 1,109 541 1,140
Long term debt 378 0 360 0 Other liabilities 81 948 107 989
Total liabilities 459 948 467 989
Equity 77 161 74 151
Book value of units in the Company's consolidated accounts
587 1,050 594 1,140
Note 21 – Assets and liabilities held for sale We classify an asset as held for sale when the facts and circumstances meet the criteria for such classification, including the following: (a) we have committed to a plan to sell the asset, (b) the asset is available for immediate sale, (c) we have initiated actions to complete the sale, including locating a buyer, (d) the sale is expected to be completed within one year, (e) the asset is being actively marketed at a price that is reasonable relative to its fair value, and (f) the plan to sell is unlikely to be subject to significant changes or termination. On February 11, 2013, we signed a conditional purchase and sale agreement for certain legal entities which own and operate a portion of our tender rig business to SapuraKencana Petroleum Bhd (“SapuraKencana”). The entities sold included the following rigs: T-4, T-7, T-11, T-12, T-17, T-18, West Pelaut, West Menang, West Alliance, West Berani, West Jaya and West Setia.

39
Assets and liabilities included as held for sale is shown below:
(In US$ millions)
As at March 31,
2013
ASSETS Cash and cash equivalents 33 Accounts receivables, net 105 Amount due from related party 5 Other current assets 52
Assets held for sale - current 195
Non-current assets
Investment in associated companies 126 Newbuildings 143 Drilling units 791 Goodwill 120 Other non-current assets 8
Assets held for sale - non-current 1,188
Total Assets held for sale 1,383
LIABILITIES Current portion of long-term debt 81 Trade accounts payable 31 Short-term debt to related party 18 Other current liabilities 25
Current liabilities associated with assets held for sale 155
Long-term interest bearing debt 699 Other non-current liabilities 2
Non-current liabilities associated with assets held for sale 701
Total Liabilities associated with assets held for sale 856
The sale described above was completed on April 30, 2013 (see note 22). We have concluded that we have significant continuing involvement in the ongoing business with SapuraKencana and therefore we have not presented this asset group as discontinued operations in our statement of operations.
Note 22 – Subsequent Events
On April 30, 2013 – Seadrill and SapuraKencana Petroleum Bhd (“SapuraKencana”) completed the previously announced transaction pursuant to the conditional SPA. The agreed upon acquisition price is for an enterprise value of US$2.9 billion, which includes cash, SapuraKencana shares, all debt in the tender rig business, and Seadrill's future capital commitments for newbuilds. On May 7, 2013 - Seadrill entered into an agreement to sell the companies that own and operate the tender rig T15 to Seadrill Partners LLC for a total consideration of US$210 million, less approximately US$100 million of debt outstanding under the credit facility secured on the T15. The balance of the acquisition price will be financed with vendor financing provided by Seadrill in the form of a loan in the amount of approximately US$110 million due in 2016, accruing interest quarterly at 5% plus LIBOR. The transaction closed May 17, 2013. On May 10, 2013 – Seadrill has extended both the forward agreements for the Sevan shares subsequent to the prior agreements' expiration. Seadrill entered into a new forward agreement for 96,000,000 Sevan shares expiring August 6, 2013 with a strike price of NOK 4.02 and entered into a new forward agreement for 81,828,500 Sevan shares expiring August 6, 2013 with a strike price of NOK 4.01. Seadrill will not directly hold any shares in Sevan, but will be exposed through forward agreements to 177,828,500 shares, or 29.9 percent of Sevan's outstanding shares.