seadrill q2 2013
TRANSCRIPT

1
Seadrill Limited (SDRL) - Second quarter 2013 results
Highlights • Seadrill reports its best operating results and net income ever and generated second quarter
2013 EBITDA*) of US$665 million • Seadrill reports second quarter 2013 net income of US$1,750 million and earnings per share
of US$3.68 • Seadrill increases the ordinary quarterly cash dividend by 3 cents to US$0.91 • Economic utilization for floaters increased to 94% in Q2 2013 from 92% in Q1 2013 • Economic utilization for the jack-up fleet in Q2 2013 was 98%, down from 99% in Q1 2013 • Seadrill secured a three-year contract for the newbuild drillship West Neptune with a total
estimated revenue potential of US$662 million • Seadrill realized a gain of US$1,256 million from the sale of the tender rig division to
SapuraKencana Petroleum for a total consideration of US$2.9 billion • Seadrill completed the sale of the tender rig T-15 to Seadrill Partners LLC (SDLP) for a total
consideration of US$210 million • Seadrill ordered two jack-ups for a total estimated project price of US$230 million per rig,
with deliveries in 4Q 2015 and 1Q 2016 • Seadrill and SapuraKencana joint project secured an eight year contract for three Pipe
Laying Support Vessels with a total estimated revenue potential of US$2.7 billion • North Atlantic Drilling completes sale and leaseback transaction for the newbuild harsh
environment jack-up West Linus for US$600 million
Subsequent events • Seadrill appoints Per Wullf as CEO to take over from Fredrik Halvorsen • Seadrill orders four ultra-deepwater drillships for an estimated project price below US$600
million per rig, with deliveries scheduled for the second half of 2015 • Seadrill orders two jack-ups for an estimated project price of US$230 million per rig, with
deliveries in the second and third quarters of 2016, respectively • Seadrill reaches 50.1% ownership in Sevan Drilling and launches mandatory offer for all
outstanding shares which closed on August 22, 2013 • Seadrill secures a 180 day contract for the newbuild ultra-deepwater drillship West Tellus
with a total estimated revenue potential of US$150 million • Seadrill secures a 2.5 year contract for the jack-up rig West Freedom with a total estimated
revenue potential of US$222 million • Seadrill secures a one year contract extension with Talisman in Malaysia for the jack-up rig
West Vigilant at US$167,000 per day • North Atlantic Drilling is awarded an extension of the current drilling contract, in addition to a
new drilling contract for West Navigator, securing employment to December 2014 with a total estimated revenue potential of US$98 million
*) EBITDA is defined as earnings before interest, depreciation and amortization equal to operating profit plus depreciation and amortization.

2
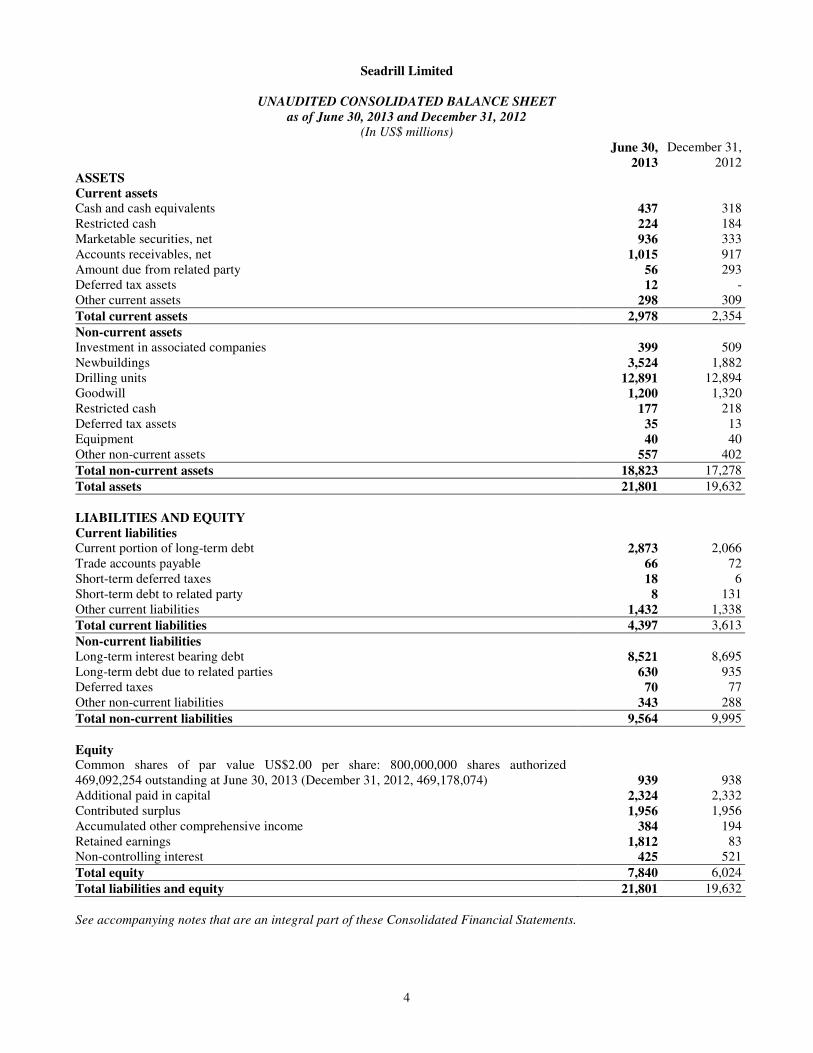
Consolidated financial information Second quarter 2013 results Consolidated revenues for the second quarter of 2013 were US$1,268 million compared to US$1,265 million in the first quarter of 2013. The increase was despite the sale of the tender rig business, which operated for only 30 days in the quarter, resulting in a US$100 million revenue decline from 1Q 2013. Overall improvement in fleet performance more than offset this revenue reduction. Operating profit for the quarter was US$507 million compared to US$552 million in the preceding quarter. The decrease is driven by gain on sale of the West Janus in the first quarter, offset by lower operating and SG&A expenses during the second quarter. Net financial and other items for the quarter showed a gain of US$1,292 million compared to a loss of US$68 million in the previous quarter. The gain is primarily related to the sale of the tender rig business and positive impacts from interest rate swap movements. Income taxes for the second quarter were US$49 million, an increase of US$5 million from the previous quarter. Net income for the quarter was US$1,750 million representing basic and diluted earnings per share of US$3.68 and US$3.53, respectively. Balance sheet As of June 30, 2013, total assets were US$21,801 million, an increase of US$595 million compared to March 31, 2013. Total current assets increased to US$2,978 million from US$2,350 million over the course of the quarter, primarily driven by an increase in marketable securities and other current assets, offset by a decrease in amounts due from related party and the sale of the tender rig business. Total non-current assets increased to US$18,823 million from US$18,856 million primarily due to yard payments on the West Auriga, West Vela, T-16, and West Mira, offset by the sale of the tender rig business. Total current liabilities decreased to US$4,397 million from US$4,782 million largely due to decreases in short term debt to related party and liabilities associated with sale the tender rig business, offset by an increase in the current portion of long-term debt. Long-term interest bearing debt increased to US$8,521 million from US$7,883 million over the course of the quarter and total net interest bearing debt decreased to US$11,186 million from US$11,674 million. The decrease is primarily due to repayments of related party debt. Total equity increased to US$7,840 million from US$6,530 million as of June 30, 2013. The increase is primarily driven by net income for the quarter, offset by dividends paid. Cash flow As of June 30, 2013, cash and cash equivalents were US$437 million, an increase of US$109 million compared to the previous quarter. Net cash from operating activities for the six month period ended June 30, 2013 was US$671 million and net cash used in investing activities for the same period was US$444 million. Net cash used in financing activities was US$108 million.

3
Outstanding shares As of June 30, 2013, common shares outstanding in Seadrill Limited totaled 469,092,254 adjusted for our holding of 158,679 treasury shares. Additionally, we had stock options for 3.7 million shares outstanding under various share incentive programs for management, of which approximately 1.3 million are vested and exercisable. The Company held a TRS agreement with exposure to 2 million shares in Seadrill, with a TRS strike price of NOK 241.88 per share. Operations Offshore drilling units During the second quarter, Seadrill had 17 floaters, 17 jack-up rigs and 1 tender rig in operation in Northern Europe, US Gulf of Mexico, Mexico, South America, Canada, West Africa, Middle East and Southeast Asia. Our floaters (drillships and semi-submersible rigs) achieved an economic utilization rate of 94% in the second quarter compared to 92% in the first quarter. We are pleased with the continuous improvement over the prior quarters. The main issues affecting our second quarter performance were related to a planned 5-year classing yardstay for the West Phoenix and downtime on the West Capricorn for equipment change-outs. Average economic utilization was 98% for our jack-up rigs in the second quarter compared to 99% in the preceding quarter. The tender rig fleet which has been divested and operated for 30 days in the quarter had an average economic utilization of 92% in the second quarter, below the first quarter economic utilization of 99%. The planned yardstay for the Teknik Berkat was the primary reason for the reduced utilization rate. The reminder of the fleet had operating performance above 96%. Table 1.0 Contract status offshore drilling units
Unit Current client Area of location Contract start
Contract expiry
Semi-submersible rigs
West Alpha ** ExxonMobil Norway / Russia Sep-12 Jul-16
West Venture ** Statoil Norway Aug-10 Jul-15
West Phoenix ** Total UK Jan-12 Apr-15
West Hercules ** Statoil Norway Jan-13 Jan-17
West Sirius BP USA Jul-08 Jul-19
West Taurus Petrobras Brazil Feb-09 Feb-15
West Eminence Petrobras Brazil Jul-09 Jul-15
West Aquarius **** ExxonMobil Canada Jan-13 Oct-15
West Orion Petrobras Brazil Jul-10 Jul-16
West Pegasus PEMEX Mexico Aug-11 Aug-16
West Capricorn **** BP USA Jul-12 Aug-17
West Eclipse Total Angola Jan-13 Jan-15
West Leo Tullow Oil Ghana, Ivory Coast Apr-12 Jun-18
West Mira (NB*) Husky South Korea – Hyundai Shipyard Jun-15 Jun-20
West Rigel (NB*)** Singapore – Jurong Shipyard
Drillships
West Navigator ** Shell - Centrica Enegi NUF Norway Jan-13 Dec-14
West Polaris ExxonMobil Angola Mar-13 Mar-18
West Capella **** Total Nigeria Apr-09 Apr-19
West Gemini Total Angola Sep-10 Sep-17
West Auriga (NB*) BP USA Aug-13 Aug-20

4
West Vela (NB*) BP South Korea – Samsung Shipyard / USA Nov-13 Nov-20
West Tellus (NB*) Chevron South Korea – Samsung Shipyard / China / Liberia Nov-13 Jul-14
West Neptune (NB*) LLOG
South Korea – Samsung Shipyard / USA Oct-14 Oct-17
West Saturn (NB*) South Korea – Samsung Shipyard
West Jupiter (NB*) South Korea – Samsung Shipyard
West Carina (NB*) South Korea – Samsung Shipyard
West Aquila (NB*) South Korea – Samsung Shipyard
West Libra (NB*) South Korea – Samsung Shipyard
West Draco (NB*) South Korea – DMSE Shipyard
West Dorado (NB*) South Korea – DMSE Shipyard
HE Jack-up rigs
West Epsilon ** Statoil Norway Dec-10 Dec-16
West Elara ** Statoil Norway Mar-12 Mar-17
West Linus (NB*) ** ConocoPhillips Singapore – Jurong Shipyard / Norway Apr-14 Apr-19
BE Jack-up rigs
West Defender Shell Brunei Aug-12 May-16
West Resolute KJO Saudi Arabia / Kuwait Oct-12 Oct-15
West Prospero Vietsovpetro Vietnam Jul-13 Mar-14
West Courageous Hess Malaysia Feb-13 Feb-14
West Triton KJO Saudi Arabia / Kuwait Aug-12 Aug-15
West Vigilant Talisman Malaysia Oct-12 Oct-14
West Intrepid KJO Saudi Arabia / Kuwait May-09 Nov-13
West Ariel Vietsovpetro Vietnam Jul-13 Mar-14
West Cressida PTTEP Thailand Nov-10 Aug-14
West Freedom GDF Suez / Cardon IV Qatar / Venezuela Dec-12 Mar-16
West Callisto Saudi Aramco Saudi Arabia Nov-12 Nov-15
West Leda ExxonMobil Malaysia Mar-12 Apr-14
West Mischief ENI Republic of Congo Dec-12 Dec-14
AOD-1 *** Saudi Aramco Saudia Arabia May-13 May-16
AOD-2 *** Saudi Aramco Saudia Arabia Jul-13 Jun-16
AOD-3 *** (NB*) Saudi Aramco Singapore - Keppel FELS / Saudia Arabia Oct-13 Oct-16
West Tucana (NB*) PVEP Singapore – Jurong Shipyard / Vietnam Aug-13 Jul-14
West Telesto (NB*) Premier China – Dalian Shipyard / Vietnam Sep-13 Jan-14
West Castor (NB*) Singapore – Jurong Shipyard
West Oberon (NB*) China – Dalian Shipyard
West Titan (NB*) China – Dalian Shipyard
West Proteus (NB*) China – Dalian Shipyard
West Rhea (NB*) China – Dalian Shipyard
West Tethys (NB*) China – Dalian Shipyard West Hyperion (NB*) China – Dalian Shipyard
West Umbriel (NB*) China – Dalian Shipyard
West Dione (NB*) China – Dalian Shipyard
West Mimas (NB*) China – Dalian Shipyard
Tender rigs
T15 **** Chevron Thailand Jul-13 Jul-18
T16 Chevron Singapore / Thailand Aug-13 Aug-18
West Vencedor **** Cabina Gulf Oil Company/Chevron Angola Mar-10 Mar-15

5
* Newbuild under construction or in mobilization to its first drilling assignment. **Owned by our subsidiary North Atlantic Drilling in which we own 73 percent of the outstanding shares. ***Owned by Asia Offshore Drilling in which we own 66 percent of the outstanding shares. ****Owned by Seadrill Partners Operations in associated companies Archer Limited (“Archer”) Archer is an international oilfield service company specializing in drilling and well services listed on the Oslo Stock Exchange. We currently own 231,053,239 shares in Archer, which represents a gross value of US$206 million based on the closing share price of NOK5.35 on August 27, 2013. Archer contributed to a loss of US$16 million to our second quarter net income. Archer is reported as part of investment in associated companies under other financial items. For more information on Archer please see their quarterly report available on www.archerwell.com. Sevan Drilling ASA (“Sevan Drilling”) Sevan Drilling is an offshore drilling company listed on the Oslo Stock Exchange. Sevan Drilling owns and operates two ultra-deepwater rigs of the cylindrical Sevan design in Brazil and has two additional rigs of similar design under construction. Delivery of their newbuilds is scheduled for the third quarter 2013 and second quarter 2014. The first newbuild has been fixed for a long-term contract in the US Gulf. In July we increased our ownership interests from 29.9% to 50.11% and subsequently launched a tender offer for the remaining shares. Upon expiration of the tender offer on August 22, Seadrill’s stake in Sevan was 50.11%, representing a gross value of US$218 million based on the closing share price of NOK4.4 on August 27, 2013. We will be consolidating Sevan’s results as of the beginning of the third quarter. The consolidation of Sevan is an important step in Seadrill’s growth. For the second quarter Sevan Drilling is reported as part of investment in associated companies under other financial items. Sevan Drilling contributed to a loss of US$6 million to net income, in-line with the prior quarter’s contribution. For more information on Sevan Drilling, see their separate quarterly report published on www.sevandrilling.com. Varia Perdana Bhd.(“Varia Perdana”) In conjunction with the sale of our tender rig fleet to SapuraKencana in April, we have divested our interest in Varia Perdana. For 30 days in the second quarter we had a 49 percent ownership interest in Varia Perdana, which owns and operates five self-erecting tender rigs. Varia Perdana contributed US$3 million to our second quarter earnings compared to US$11 million in the first quarter. Contribution from Varia Perdana is reported as part of investment in associated companies under other financial items.
Other investments SapuraKencana Petroleum Bhd.(“SapuraKencana”) SapuraKencana is a fully integrated Malaysian oil service provider listed on the Malaysian Stock Exchange. As of April 30, Seadrill had sold all tender rigs apart from the West Vencedor, T-15 and T-16 to SapuraKencana. 30 days of operations are included in second quarter results. Seadrill’s 12% stake in SapuraKencana will continue to be included in other marketable securities. After the

6
transaction Seadrill is the third largest equity holder in SapuraKencana. Based on the closing share price of MYR3.24 on August 27, 2013 the total value of our shares is US$701 million In addition to our equity stake in SapuraKencana we continue to invest in our Brazilian joint project in support of its PLSV newbuild program. Subsequent to the closing of the transaction, Seadrill will continue to manage and supervise the current tender rigs under construction, manage three tender rigs outside of Asia and also provide management administration and support services. Seadrill, as an equity investor, will continue to support SapuraKencana’s strategy of growing its’ broad offshore service portfolio. We believe in SapuraKencana’s strong position in the Asian market and see significant international growth opportunities for the company. We continue to support the company’s strategic goal of becoming a global offshore services company and to be the leading offshore service provider in Asia.
Newbuilding program Since our last quarterly report in May 2013, we have taken delivery of one ultra-deepwater drillship, the West Vela and two high specification jack-ups. The West Vela was delivered on time and on budget from the Samsung shipyard in South Korea in June 2013. The jack-up unit AOD III was delivered in July 2013 from the Keppel FELS yard in South Korea and the West Tucana was delivered from the Jurong shipyard in August. In July we entered into new contracts for the construction of four ultra-deepwater drillships with the Samsung and DSME yards in South Korea. The total estimated project price is less than US$600 million per rig, with scheduled delivery for the second half of 2015. The units include design and equipment features which make them particularly attractive for development drilling activities in all ultra-deepwater basins. In addition to the new contracts we have received fixed price options for the delivery of two further units for delivery in the first half of 2016. In June and July, we entered into new contracts for the construction of a total of four high specification jack-up rigs at the Dalian shipyard in China. The total estimated project price is US$230 million per rig, with delivery scheduled for the fourth quarter of 2015 and the first, second, and third quarters of 2016. The four new units are based on the same design as the existing jack-ups under construction at the Dalian and Jurong shipyard in Singapore. We currently have 27 rigs under construction. In total, 9 out of the 27 newbuilds have already secured long-term contracts upon delivery. Total remaining yard installments for our newbuilds are approximately US$6.6 billion and US$1.9 billion has been paid to the yards in pre-delivery installments. New contracts and contract extensions Since we reported our first quarter earnings on May 28, 2013, we have entered into the following contracts and contract commitments. In July 2013, we secured a contract in Venezuela with Cardon IV, a Joint venture of ENI SpA and Repsol, for the jack-up rig West Freedom. The contract is for a firm term of 30 months plus an option for a 6 month extension with a total estimated revenue potential on the primary contract term of US$222 million inclusive of mobilization.

7
In July we secured a contract with Chevron for the newbuild ultra-deepwater drillship, the West Tellus. The contract commences in China immediately upon shipyard delivery and thereafter relocates to Liberia. The agreement is for a period of 180 days with a total estimated revenue potential of approximately US$150 million inclusive of mobilization. In July 2013, the North Atlantic Drilling secured a contract extension for the West Navigator with Shell from June 2014 to September 2014. In addition, the Company signed an agreement with Centrica Energi NUF for a minimum of 70 days in direct continuation of the Shell contract. Estimated total revenue potential for the extension and new contract is US$98 million. In August we secured a one year contract extension for the jack-up rig West Vigilant with Talisman in Malaysia at a rate of US$167,000 per day. Total order backlog as of August 27 is US$19 billion. Seadrill is currently in advanced negotiations for several new long term contracts for deepwater rigs as well as jack ups. The day rate level and contract duration being negotiated during these discussions confirms the strength of the market. Based on successful conclusion of these negotiations it is likely that order backlog will continue to build during the next quarters. For more detailed information regarding daily rates and contract durations including escalation, currency adjustment or other minor changes to daily rates and duration profiles, see our fleet status report or news releases on the our website www.seadrill.com
Market development The fundamental outlook for the offshore drilling industry remains positive. The trend seen during the last few years in which the major oil companies focus their E&P investments to deepwater areas is likely to continue. At the same time oil and gas companies continue to demonstrate their preference for newer, more capable rigs. 6th generation ultra-deepwater floaters are preferred for their greater efficiencies, dual BOP capabilities, higher variable deckloads, and increased lifting capacities. Similarly, higher specification jack-ups are preferred for their increased water depth, hoisting and deck load capacities. Newer and more capable rigs are better suited to drill a wide range of well designs and provide a safer work environment and more efficient well delivery than typical older generations. Over the long term we expect the market to increasingly demonstrate bifurcation in terms of both dayrate rate and utilization for newer, more capable rigs over older commodity assets. Ultra-deepwater floaters (>7,500 ft water) Tendering and contracting activity continued at a solid and stable pace during the first half of the year. As a result, there is no remaining newbuild ultra-deepwater capacity available in 2013. During the same period, the number of available newbuilds in 2014 has been reduced from 20 to 10 with a number of awards still pending. We are confident that the current newbuild order book will be effectively absorbed into the operating fleet. Africa is predicted to be a strong contributing factor to the demand for ultra-deepwater rigs over the next few years. In Angola and Nigeria a backlog of exploration work and several large discoveries to be developed are expected to result in a sharp increase in drilling activity. We also expect to see increasing activity in East Africa where Mozambique, Tanzania and Kenya are amongst the countries with active exploration programs under consideration. In Brazil, a desire by Petrobras to high grade their floater fleet leaves us confident that they will continue to require the services of at least their existing fleet of high specification floaters. The first block auction in 5 years raised a record 2.8 billion Reais with most of the blocks in frontier

8
regions or unexplored areas. Together with recent exploration successes, these new block awards are expected to result in increased demand in the region. In the US GoM, there is an increasing amount of development work as the market returns to normal operating conditions following Macondo. Currently out of 33 ultra-deepwater rigs, 23 are working on exploration projects. We expect development work to accelerate leading to longer duration drilling contracts. The market for harsh environment drilling rigs remains very tight and increasing demand in Northern Norway, Russia and Arctic regions is likely to tighten this further. Premium jack-up rigs (>350 ft water) The supply / demand gap for premium jack-ups (350 feet in water depth and built post 2005) is increasing. The fleet continues to operate at greater than 95% utilization rates for the 3rd successive quarter. The demand gap continues to grow as evidenced by the increase in number of open tenders, upward pressure on dayrates and increased contract durations worldwide. The pace of retirements continues to accelerate with more than 30 rigs leaving the market over the past two years, well in excess of the number scrapped in the prior 10 years. With approximately 60% of the global contracted fleet more than 30 years old we see a positive outlook for the newbuild jack-ups. As evidenced by our commitment this year to build an additional 8 jack-ups, Seadrill has continued to invest in order to maintain its position as the largest and youngest high specification jack-up operator and capitalize on this developing and attractive market Asia and the Middle East continue to be the primary source of demand for high specification jack-up rigs. However West Africa and the Gulf of Mexico have seen an increase in contracting activity, a trend we expect to continue into 2014 and 2015. During the second quarter we contracted the West Freedom in Venezuela at attractive terms and we continue to see increasingly attractive opportunities developing outside Asia and the Middle East. Mexico presents a particularly interesting opportunity. During the last 10 years, 552 wells have been drilled offshore Mexico while 4,653 wells have been drilled in the US Gulf of Mexico. With similar geology, this highlights the enormous potential for the Mexican portion of the Gulf and we believe the first leg of the growth story will occur in the shallow water. Seadrill sees Mexico as a strategically important market going forward. We currently have solid operational performance with the deepwater unit West Pegasus, and expect to be active pursuing Jack-up opportunities in the future. Corporate strategy, dividend and outlook Growth and Investments Since our first quarter earnings report we ordered four ultra-deepwater drillships and four high specification jack-up rigs in response to continued positive market fundamentals. The combination of attractive shipyard prices and high market rates creates what we see as a unique investment environment. The investment opportunity is further improved by increased demand for higher specification units and by limited ordering from our major competitors. Our strategic investment in Sevan Drilling ASA reached 50.11% following the conclusion of the mandatory tender offer for all remaining shares outstanding. We continue to evaluate opportunistic acquisitions alongside our newbuild decisions in order to maintain our position as the market’s only global operator focused on premium asset classes and superior shareholder returns.

9
Since January 1st Seadrill has, including the acquisition of Sevan, added a total of 9 deepwater assets to its fleet. These investments have all been made at close to historic low levels and will significantly lower the implied value per deep water asset in Seadrill’s stock. Seadrill has the highest percentage of its assets in premium classes amongst all drillers. 94% of our floater fleet is 6th generation ultra-deepwater and 100% of our jack-up fleet is high specification. We seek to keep this high exposure to premium asset classes intact with our investments and strategic M&A. Revenue backlog As of August 27, 2013, our orderbacklog following the sale of the tender rig fleet was US$19 billion. Order backlog for our floater fleet is US$15.4 billion, US$3.1 billion for our jack-up fleet, and US$500 million for our tender units. Our order backlog provides clarity for future earnings as well as generates visibility for dividend capacity. With respect to our ultra-deepwater fleet we are fully contracted for 2013 after securing a contract for the West Tellus with Chevron in July. Our available units for 2014 include three ultra-deepwater newbuilds, the West Saturn, West Jupiter, and West Carina, and the West Navigator is coming off contract in December 2014. The West Tellus is completing its work for Chevron in 2Q 2014 and we are in advanced discussions for a follow on contract in West Africa. The average contract duration for our contracted deep-water units is 30 months. Most capacity has been firmed up for our jack-up fleet. There are two uncontracted newbuilds to be delivered in the third and fourth quarter 2013, the West Castor and West Oberon, and one unit coming off contract, the West Intrepid. With a strong jack-up market, we expect to have these units contracted prior to delivery or contract completion. The average contract length for our contracted jack-up units is 15 months. Financial flexibility Since our last quarterly report we have secured US$900 million in new financing commitments. We successfully raised a US$300 million credit facility, secured by the West Tucana and West Castor. Additionally, North Atlantic Drilling completed a sale leaseback transaction with Ship Finance International for the West Linus, raising US$600 million in pre and post delivery financing and began the process of North Atlantic’s fleet becoming independently financed ahead of the planned US listing process. Seadrill has successfully secured funding for all 9 newbuilds to be delivered in 2013 and we are currently in the market to secure funding for Sevan Drilling’s newbuild program after achieving a controlling equity stake in July. Seadrill’s support of Sevan’s financing plan significantly improves on their standalone plan and is expected to reduce their annual financing cost by more than US$30 million annually. We expect additional dropdowns to Seadrill Partners going forward. Our position as the first and only drilling MLP is a competitive advantage relative to other companies in the drilling business. We remain committed to growing Seadrill Partners utilizing our large existing fleet, large contracted backlog, and newbuild assets. The share price of Seadrill Partners has continued its positive development since the IPO in October of last year. The share price as of August 27 is US$29.5 and values the drilling units in the MLP at a significant premium to Seadrill’s current valuation. The positive development in Seadrill’s credit can be seen from the reduced interest spread relative to treasuries in Seadrill bonds as well as lower margins paid in the bank market. The Board anticipates that the credit profile will improve further in the months to come as the

10
company will continue to build orderbacklog and secure further commitments on long term financing. The Board is of the opinion that a rating of the Company’s credit may improve the margins further. We intend to have the rating process concluded during the first quarter of 2014. Based on our discussions with credit investors, we do not at this time think that being unrated is affecting our ability to access the unsecured bond market at attractive prices. We continue to evaluate the potential of this market and consider access to the bond market important to retaining Seadrill’s desired financial flexibility. Seadrill’s capital strategy revolves around having numerous sources of funding in order to be able to take advantage of pricing discrepancies that may appear from time to time. We employ this strategy to be sure that we can always fund our growth strategy as well as meet current obligations we have to lenders and shareholders. At any point in time we can draw from the secured bank, unsecured bond, convertible bond, or MLP markets. We also explore sale leasebacks and asset sales when terms are attractive. Seadrill’s financial flexibility is different from most companies in the contract drilling industry and is a significant competitive advantage. This enables us to maximize equity returns for our shareholders not only from our asset base, but also from a more flexible financing strategy. Other Significant Investments We have investments in other listed offshore drillers and oil service companies. As of today our portfolio includes a 39.9 percent holding in Archer Limited, a 50.11 percent in Sevan Drilling, and a 12.02 percent holding in SapuraKencana. In addition we hold 75.65 percent in Seadrill Partners and 73.18 percent in North Atlantic Drilling. Both companies are consolidated in Seadrill’s financial statements. At current market prices, the total value of these investments is approximately US$3.6 billion. Quarterly Cash Dividend The Board has in connection with the disclosure of the second quarter results evaluated the current dividend level and prospects and has resolved to increase the regular quarterly dividend by 3 cents to US$0.91. The dividend increase reflects Seadrill’s strong operational results, positive market outlook, solid orderbacklog and strong support received from the financing markets. The Board believes that the new dividend is sustainable long-term and can be further increased as EBITDA is expected to grow significantly over the next eight quarters. The ex-dividend date has been set to September 5, 2013, record date is September 9, 2013 and payment date is on or about September 20, 2013. Outlook During the second Quarter the Board announced the appointment of Per Wullf as Seadrill’s CEO. Since joining Seadrill in 2009, Mr. Wullf's focus on operational performance during a period of phenomenal growth has allowed Seadrill to establish a reputation for delivering safe and efficient operations for its customers. He has established strong relationships and has an excellent reputation among our major customers and vendors. With his strong track record, Mr. Wullf is a natural choice for the Board to ensure a smooth transition and bring Seadrill to the next level. We look forward to continued success under his leadership. The Board also wants to give credit to Mr. Fredrik Halvorsen for the solid contribution he gave in the year he acted as Seadrill’s CEO. The move of Seadrill Management from Stavanger to London was handled in a very professional manner with limited operational consequences for our customers. The move to London has significantly improved Seadrill’s efficiency as well as increased the opportunity to recruit world-class management in the future.

11
Several of the Company’s deepwater assets have now concluded their first five-year surveys. With the exception of the West Hercules, whose situation was complicated by making the rig ready for harsh environment operation, the Board is pleased to see that these surveys have been concluded with limited off-hire time and within budgets. This clearly confirms the operational and financial benefits of operating modern drilling assets. The Company has control of costs for existing operations and we are not experiencing significant cost inflation in any of the business segments or operational areas, with the possible exception of Angola and Nigeria. The Board of Seadrill has, in connection with the recent ordering, thoroughly reviewed the Company’s financial position. Seadrill has numerous sources of funding available including the secured loan market, unsecured debt markets, and utilizing drop downs to the MLP. The Board has concluded that it is highly likely that Seadrill’s existing newbuilding commitments can be fully financed and dividend sustained or increased, without having to issue equity. The Board and the Board of North Atlantic Drilling continues to be actively engaged in discussions with a potential strategic partner. These discussions are advancing and we are hopeful on a positive outcome shortly. We remain fully committed to proceeding with the proposed NYSE listing regardless of the outcome. Seadrill Partners has performed well since the Company was introduced to the market in October 2012. Seadrill’s stake in Seadrill Partners has a current market value of US$922 million based on the closing price as of August 27. We see large opportunities to aggressively grow Seadrill Partners and its dividend distribution by dropping down some of Seadrill’s long term contract assets. We are pleased with the execution of the T-15 dropdown and the flexibility to fund such dropdowns will increase when the Company achieves seasoned issuer status in November 2013. Thus far in the third quarter we have achieved a technical utilization of more than 94% for our floater units and in excess of 98% for our jack-up fleet. This performance is evidence that the Company has recovered from the sub-standard operating performance during the fourth quarter 2012 and first quarter 2013. We expect our operating performance to be in-line with second quarter performance going forward. Seadrill is entering a period of high growth during the second half of 2013 and through 2016. The operating results for Q3 will be somewhat impacted by the sale of the tender rig business. We expect the second half results to show a significant increase in operating profit based on a total of eight new rigs commencing operation. The Board expects Seadrill, assuming current market rates, to reach a fully consolidated annualized EBITDA of US$4.5 billion in 2016. The Board is pleased with the strategic position of the Company. We feel there is a unique opportunity to continue our high growth trajectory with a strong and increasing dividend which is funded with strong existing cash flow and supported by a well over 50% increase in operating results between 2013 and 2016. Forward-Looking Statements This news release includes forward looking statements. Such statements are generally not historical in nature, and specifically include statements about the Company’s plans, strategies, business prospects, changes and trends in its business and the markets in which it operates. In particular, statements include short list with general description of the forward looking statements in this release. These statements are made based upon management’s current

12
plans, expectations, assumptions and beliefs concerning future events impacting the Company and therefore involve a number of risks, uncertainties and assumptions that could cause actual results to differ materially from those expressed or implied in the forward-looking statements, which speak only as of the date of this news release. Important factors that could cause actual results to differ material from those in the forward-looking statements include, but are not limited to offshore drilling market conditions, contract backlog, dry-docking and other costs of maintenance of the drilling rigs in the Company’s fleet, the cost and timing of shipyard and other capital projects, the performance of the drilling rigs in the Company’s fleet, delay in payment or disputes with customers, fluctuations in the international price of oil, international financial market conditions including the international financial crisis, changes in governmental regulations that affect the Company or the operations of the Company’s fleet, increased competition in the offshore drilling industry, and general economic, political and business conditions globally . Consequently, no forward-looking statement can be guaranteed. When considering these forward-looking statements, you should keep in mind the risks described from time to time in the Company’s filings with the SEC, including its Registration Statement on Form 20-F. The Company undertakes no obligation to update any forward looking statements to reflect events or circumstances after the date on which such statement is made or to reflect the occurrence of unanticipated events. New factors emerge from time to time, and it is not possible for us to predict all of these factors. Further, the Company cannot assess the impact of each such factors on its business or the extent to which any factor, or combination of factors, may cause actual results to be materially different from those contained in any forward looking statement. August 28, 2013 The Board of Directors Seadrill Limited Hamilton, Bermuda Questions should be directed to Seadrill Management Ltd represented by: Per Wullf: Chief Executive Officer and President Rune Magnus Lundetræ: Chief Financial Officer and Senior Vice President Media contact Rune Magnus Lundetræ Chief Financial Officer Seadrill Management Ltd. +44 (0) 7766 071010

Seadrill Limited
INDEX TO UNAUDITED CONSOLIDATED FINANCIAL STATEMENTS
Unaudited Consolidated Statement of Operations for the three and six months ended June 30, 2013 and 2012 Page 2
Unaudited Consolidated Statement of Comprehensive Income for the three and six months ended June 30, 2013 and 2012
Page 3
Unaudited Consolidated Balance Sheet as of June 30, 2013 and December 31, 2012 Page 4
Unaudited Consolidated Statement of Cash Flows for the six months ended June 30, 2013 and 2012 Page 5
Unaudited Consolidated Statement of Changes in Equity for the six months ended June 30, 2013 and December 31, 2012
Page 7
Notes to Unaudited Consolidated Financial Statements Page 8

2
Seadrill Limited
UNAUDITED CONSOLIDATED STATEMENT OF OPERATIONS
for the three and six months ended June 30, 2013 and 2012
(In US$ millions) Three months
ended June 30, Six months
ended June 30, 2013 2012 2013 2012
Operating revenues
Contract revenues 1,145 1,087 2,340 2,112
Reimbursable revenues 110 37 174 62
Other revenues 13 (1) 19 (2)
Total operating revenues 1,268 1,122 2,533 2,172
Gain on sale of assets - - 61 -
Operating expenses
Vessel and rig operating expenses 439 404 921 785
Reimbursable expenses 100 34 159 57
Depreciation and amortization 158 151 319 291
General and administrative expenses 64 50 136 101
Total operating expenses 761 639 1,535 1,233
Net operating income 507 483 1,059 939
Financial items and other income
Interest income 6 4 10 9
Interest expense (96) (76) (204) (147)
Share in results from associated companies (26) 15 (24) 33
Gain/ (loss) on derivative financial instruments 141 (96) 136 (6)
Foreign exchange gain/ (loss) 14 12 27 (8)
Gain on realization of marketable securities - 85 - 85
Gain on re-measurement of previously held equity interest - 169 10 169
Other financial items (3) 1 (2) 3
Gain on bargain purchase - - 15 -
Gain on sale of tender rigs 1,256 - 1,256 -
Total financial items and other income 1,292 114 1,224 138
Income before income taxes 1,799 597 2,283 1,077
Income tax expense (49) (43) (93) (85)
Net income 1,750 554 2,190 992
Net income attributable to the parent 1,727 526 2,136 941
Net income attributable to non-controlling interests 23 28 54 51
Basic earnings per share (US$) 3.68 1.12 4.55 2.01
Diluted earnings per share (US$) 3.53 1.09 4.38 1.96
Declared regular dividend per share (US$) 0.91 0.84 0.91 1.66
Declared extraordinary dividend per share (US$) - - - 0.15
See accompanying notes that are an integral part of these Consolidated Financial Statements.

3
Seadrill Limited
UNAUDITED CONSOLIDATED STATEMENT OF COMPREHENSIVE INCOME
for the three and six months ended June 30, 2013 and 2012 (In US$ millions)
Three months
ended June 30, Six months
ended June 30, 2013 2012 2013 2012
Net income 1,750 554 2,190 992
Other comprehensive income, net of tax:
Change in unrealized gain on marketable securities 206 98 187 98
Change in unrealized gain on foreign exchange differences - 8 - -
Change in unrealized loss relating to pension 7 - 5 -
Change in unrealized loss on interest rate swaps in VIEs 2 6 4 11
Other comprehensive income: 215 112 196 109
Total comprehensive income for the period 1,965 666 2,386 1,101
Comprehensive income attributable to non-controlling interests 26 62 60 113
Comprehensive income attributable to the parent 1,939 604 2,326 988
See accompanying notes that are an integral part of these Consolidated Financial Statements.
4
Seadrill Limited
UNAUDITED CONSOLIDATED BALANCE SHEET
as of June 30, 2013 and December 31, 2012
(In US$ millions)
June 30,
2013 December 31,
2012 ASSETS Current assets Cash and cash equivalents 437 318 Restricted cash 224 184 Marketable securities, net 936 333 Accounts receivables, net 1,015 917 Amount due from related party 56 293 Deferred tax assets 12 - Other current assets 298 309
Total current assets 2,978 2,354
Non-current assets Investment in associated companies 399 509 Newbuildings 3,524 1,882 Drilling units 12,891 12,894 Goodwill 1,200 1,320 Restricted cash 177 218 Deferred tax assets 35 13 Equipment 40 40 Other non-current assets 557 402
Total non-current assets 18,823 17,278
Total assets 21,801 19,632
LIABILITIES AND EQUITY Current liabilities Current portion of long-term debt 2,873 2,066 Trade accounts payable 66 72 Short-term deferred taxes 18 6 Short-term debt to related party 8 131 Other current liabilities 1,432 1,338
Total current liabilities 4,397 3,613
Non-current liabilities Long-term interest bearing debt 8,521 8,695 Long-term debt due to related parties 630 935 Deferred taxes 70 77 Other non-current liabilities 343 288
Total non-current liabilities 9,564 9,995
Equity Common shares of par value US$2.00 per share: 800,000,000 shares authorized 469,092,254 outstanding at June 30, 2013 (December 31, 2012, 469,178,074) 939 938 Additional paid in capital 2,324 2,332 Contributed surplus 1,956 1,956 Accumulated other comprehensive income 384 194 Retained earnings 1,812 83 Non-controlling interest 425 521
Total equity 7,840 6,024
Total liabilities and equity 21,801 19,632
See accompanying notes that are an integral part of these Consolidated Financial Statements.

5
Seadrill Limited
UNAUDITED CONSOLIDATED STATEMENT OF CASH FLOWS
for the six months ended June 30, 2013 and 2012
(In US$ millions)
Six months
ended June 30,
2013 2012Cash Flows from Operating Activities
Net income 2,190 992
Adjustments to reconcile net income to net cash provided by operating activities:
Depreciation and amortization 319 291
Amortization of deferred loan charges 21 14
Amortization of unfavorable contracts (14) -
Amortization of favorable contracts 2 6
Amortization of mobilization revenue (57) (69)
Share of results from associated companies 24 (33)
Share-based compensation expense 3 2
Unrealized (gain)/loss related to derivative financial instruments (180) 7
Dividend received from associated company 15 7
Deferred income tax (gain) / expense (19) 10
Unrealized foreign exchange (gain)/loss on long-term interest bearing debt (28) 1
Gain on disposal of fixed assets (61) -
Gain on decline in ownership interest - (169)
Gain on disposal of other investments (10) (86)
Gain recognized related to bargain purchase (15) -
Gain related to sale of tender rigs (1,256) -
Changes in long-term maintenance (118) (36)
Changes in operating assets and liabilities, net of effect of acquisitions and disposals
Unrecognized mobilization fees received from customers 93 149
Trade accounts receivable (207) (146)
Trade accounts payable 22 17
Prepaid expenses/(accrued revenue) 26 (2)
Other, net (79) (55)
Net cash provided by operating activities 671 900
Cash Flows from Investing Activities
Additions to newbuildings (1,364) (865)
Additions to rigs and equipment (350) (97)
Settlement of disputes with ship yard - 38
Acquisition of business (531) -
Sale of rigs and equipment 48 -
Proceeds from sale of tender rigs 1,991 -
Change in margin calls and other restricted cash (19) 96
Purchase of marketable securities - (19)
Investment in associated companies (104) (68)
Disposal of associated companies - 65
Loan granted to related parties (125) (20)
Repayment of loan granted to related parties 10 -
Proceeds from realization of marketable securities - 219
Net cash used in investing activities (444) (651)

6
Seadrill Limited
UNAUDITED CONSOLIDATED STATEMENT OF CASH FLOWS
for the six months ended June 30, 2013 and 2012
(In US$ millions)
Six months
ended June 30, 2013 2012
Cash Flows from Financing Activities
Proceeds from debt 2,062 879
Repayments of debt (1,388) (1,045)
Debt fees paid (31) (2)
Proceeds from debt to related party 409 487
Repayments of debt to related party (834) (85)
Contribution from non-controlling interests related to private placement - 147
Paid to non-controlling interests (33) (23)
Proceeds relating to share forward contracts 125 -
Purchase of treasury shares (11) -
Proceeds from sale of treasury shares - 6
Dividends paid (407) (820)
Net cash used by financing activities (108) (456)
Effect of exchange rate changes on cash and cash equivalents - -
Net increase / (decrease) in cash and cash equivalents 119 (207)
Cash and cash equivalents at beginning of the year 318 483
Cash and cash equivalents at the end of period 437 276
Supplementary disclosure of cash flow information
Interest paid, net of capitalized interest (131) (155)
Taxes paid (48) (94)
See accompanying notes that are an integral part of these Consolidated Financial Statements.

7
Seadrill Limited
UNAUDITED CONSOLIDATED STATEMENT OF CHANGES IN EQUITY
for the six months ended June 30, 2013, and 2012
(In US$ millions)
See accompanying notes that are an integral part of these Consolidated Financial Statements.
Share
Capital Additional
paid-in capital Contributed
surplus Accumulated
OCI Retained earnings NCI
Total equity
Balance at December 31, 2011 935 2,097 1,956 (5) 994 325 6,302
Sale of treasury shares 6 6
Employee stock options issued 2 2
Private placement in subsidiary 84 66 150 Costs related to capital increase in subsidiary
(3) (3)
Other comprehensive income 98 11 109
Dividend payment (820) (23) (843)
Net income 941 51 992
Balance at June 30, 2012 935 2,186 1,956 93 1,115 430 6,715
Balance at December 31, 2012 938 2,332 1,956 194 83 521 6,024
Sale of treasury shares 1 1
Purchase of treasury shares (11) (11)
Employee stock options issued 3 3 Establishment of non-controlling interest
100 100
Other comprehensive income 190 6 196
Dividend payment (407) (33) (440) Dividend paid to Non-controlling interests in VIEs
(223) (223)
Net income 2,136 54 2,190
Balance at June 30, 2013 939 2,324 1,956 384 1,812 425 7,840

8
Seadrill Limited
NOTES TO UNAUDITED CONSOLIDATED FINANCIAL STATEMENTS
Note 1 – General information Seadrill Limited was incorporated in Bermuda in May 2005 and is a publicly listed company on the New York Stock Exchange and the Oslo Stock Exchange. Through the acquisition of other companies and investment in newbuildings, we have developed into one of the largest international offshore drilling contractors. As of June 30, 2013 we owned and operated 34 offshore drilling units and had 24 units under construction. Our fleet consists of drillships, jack-up rigs, semi-submersible rigs and tender rigs for operations in shallow and deepwater areas, as well as benign and harsh environments. As used herein, and unless otherwise required by the context, the term “Seadrill” refers to Seadrill Limited and the terms “Company”, “we”, “Group”, “our” and words of similar import refer to Seadrill and its consolidated companies. The use herein of such terms as group, organization, we, us, our and its, or references to specific entities, is not intended to be a precise description of corporate relationships. Basis of presentation The unaudited interim consolidated financial statements are stated in accordance with generally accepted accounting principles in the United States of America (US GAAP). The unaudited interim consolidated financial statements do not include all of the disclosures required in complete annual financial statements. These interim financial statements should be read in conjunction with our annual financial statements as at December 31, 2012. The year-end condensed balance sheet data that was derived from our audited 2012 financial statements does not include all disclosures required by accounting principles generally accepted in the United States of America. In the opinion of management, all adjustments (consisting of normal recurring adjustments) considered necessary for a fair statement have been included. The amounts are presented in United States dollar (US dollar) rounded to the nearest million, unless stated otherwise. We have in 2012 and 2011 significantly expanded our fleet of drilling rigs and as a result of this our long term maintenance has increased accordingly. In response to this, we determined that we had incorrectly classified payments related to long term maintenance as an investing activity rather than as an operating activity in the consolidated statement of cash flows for the period ended June 30, 2012. We concluded that such classification was not material to cash flows from operating activities and investing activities for previously reported periods. Accordingly, the presentation of the consolidated statement of cash flows for the period ending June 30, 2012 has been revised. This resulted in a decrease in cash provided by Operating Activities and a decrease in cash used by Investing Activities, of $36 million. Significant accounting policies The accounting policies adopted in the preparation of the unaudited interim financial statements are consistent with those followed in the preparation of our annual audited consolidated financial statements for the year ended December 31, 2012 unless otherwise included in these unaudited interim financial statements as separate disclosures.
Note 2 – Recent Accounting Pronouncements Recently Adopted Accounting Standards Balance sheet—Effective January 1, 2013, we adopted the accounting standards update that expands the disclosure requirements for the offsetting of assets and liabilities related to certain financial instruments and derivative instruments. The update requires disclosures to present both gross information and net information for financial instruments and derivative instruments that are eligible for net presentation due to a right of offset, an enforceable master netting arrangement or similar agreement. The update is effective for interim and annual periods beginning on or after January 1, 2013. The effect of this to our interim consolidated financial statements is included in note 18. Balance sheet—Effective January 1, 2013, we adopted the accounting standards update that requires an entity to report the effect of significant reclassifications out of accumulated other comprehensive income on the respective line items in net income if the amount being reclassified is required under U.S. generally accepted accounting principles to be reclassified in its entirety to net income. For other amounts that are not required under U.S. GAAP to be reclassified in their entirety to net

9
income in the same reporting period, an entity is required to cross-reference other disclosures required under U.S. GAAP that provide additional detail about those amounts. For public entities, the amendments are effective prospectively for reporting periods beginning after December 15, 2012. The adoption did not have an effect on our interim consolidated financial statements.
Note 3 – Segment information Operating segments
The company provides offshore drilling services to the oil and gas industry. Our business has been organized into segments based on differences in management structure and reporting, economic characteristics, customer base, asset class, and contract structure. We currently operate in the following three segments: Floaters: We offer services encompassing drilling, completion and maintenance of offshore exploration and production wells. The drilling contracts for this segment relate to semi-submersible rigs and drillships for harsh and benign environments in mid-, deep- and ultra-deep waters. Jack-up rigs: We offer services encompassing drilling, completion and maintenance of offshore exploration and production wells. The drilling contracts for this segment relate to jack-up rigs for operations in harsh and benign environments. Tender rigs: We offer services encompassing drilling, completion and maintenance of offshore production wells in Southeast Asia, West Africa and the Americas. The drilling contracts for this segment relate to self-erecting tender rigs and semi-submersible tender rigs. Segment results are evaluated on the basis of operating profit, and the information given below is based on information used for internal management reporting. The accounting principles for the segments are the same as for our consolidated financial statements. Contract revenues
(In US$ millions) Three months
ended June 30, Six months
ended June 30, 2013 2012 2013 2012
Floaters 805 718 1,562 1,375
Jack-up rigs 262 186 518 385
Tender rigs 78 183 260 352
Total 1,145 1,087 2,340 2,112
Depreciation and amortization
(In US$ millions) Three months
ended June 30, Six months
ended June 30, 2013 2012 2013 2012
Floaters 118 101 235 196
Jack-up rigs 38 36 75 68
Tender rigs 2 14 9 27
Total 158 151 319 291

10
Operating income - net income
(In US$ millions) Three months
ended June 30, Six months
ended June 30, 2013 2012 2013 2012
Floaters 369 346 687 664
Jack-up rigs 96 59 241 126
Tender rigs 42 78 131 149
Net operating income 507 483 1,059 939
Unallocated items:
Total financial items and other income 1,292 114 1,224 138
Income taxes (49) (43) (93) (85)
Net Income 1,750 554 2,190 992
Total Assets
(In US$ millions) As of June 30, 2013
As of December 31, 2012
Floaters 16,301 13,725Jack-up rigs 5,186 4,210Tender rigs 314 1,697
Total 21,801 19,632
Goodwill
(In US$ millions) As of June 30, 2013
As of December 31, 2012
Floaters 890 890Jack-up rigs 281 281Tender rigs 29 149
Total 1,200 1,320
Total liabilities
(In US$ millions) As of June 30, 2013
As of December 31, 2012
Floaters 10,439 9,514Jack-up rigs 3,321 2,918Tender rigs 201 1,176
Total 13,961 13,608
Capital expenditures – Newbuildings and Drilling units
(In US$ millions) Six months ended June 30,
2013 2012 Floaters 1,992 829Jack-up rigs 473 64Tender rigs 127 66
Total 2,592 959

11
Note 4 – Gain / (loss) on derivative financial instruments The year to date gain of US$136 million in our Statement of Operations consists of the following: Total Return Swaps (TRS): On June 4, 2013, we settled a TRS agreement for 2,000,000 Seadrill Limited shares, at a price of NOK 213.17. We subsequently entered into a new TRS agreement with exposure to 2,000,000 Seadrill Limited shares with an expiry date September 4, 2013, and reference price NOK 241.88 per share. The total realized and unrealized gain related to the TRS agreements amounted to US$10 million and US$13 million for the three months and six months ended June 30, 2013 (US$1 million and US$7 million gain for the three months and six months ended June 30, 2012). Interest-rate swap agreements cross currency swaps, and forward exchange contracts: Total realized and unrealized gain on interest-rate swap agreements, cross currency swaps, and forward exchange contracts, not qualified for hedge accounting, amounted to US$149 million and US$104 million for the three months and six months ended June 30, 2013 (US$90 million loss and US$92 million loss the three months and six months ended June 30, 2012). Other derivative instruments: Total realized and unrealized gain on other derivative instruments amounted to loss of US$18 million and a gain of US$19 million for the three months and six months ended June 30, 2013 (US$7 million loss and US$80 million gain for the three months and six months ended June 30, 2012).
Note 5 – Taxation Income taxes consist of the following: (In US$ millions) Three months
ended June 30, Six months
ended June 30, 2013 2012 2013 2012
Current tax expense:
Bermuda - - - -
Foreign 77 39 118 81
Deferred tax expense:
Bermuda - - - -
Foreign (30) 2 (29) -
Tax related to internal sale of assets in subsidiary, amortized for group purposes
2 2 4 4
Total tax expense 49 43 93 85
Effective tax rate 2.7% 6.3% 4.1% 7.9%
The effective tax rate for the three months and six months ended 30 June 2013 is 2.7% and 4.1% respectively. Excluding the gain on sale of tender rigs the effective tax rate for the three months and six months ended 30 June 2013 is 9.0% and 9.1% respectively. The Company, including its subsidiaries, is taxable in several jurisdictions based on its rig operations. A loss in one jurisdiction may not be offset against taxable income in another jurisdiction. Thus, the Company may pay tax within some jurisdictions even though it might have an overall loss at the consolidated level.

12
Income taxes for the three and six months ended June 30, 2013 and 2012 differed from the amount computed by applying the statutory income tax rate of 0% as follows: (In US$ millions) Three months
ended June 30, Six months
ended June 30, 2013 2012 2013 2012
Income taxes at statutory rate - - - -
Effect of transfers to new tax jurisdictions 2 2 4 1
Effect of taxable income in various countries 47 41 89 84
Total 49 43 93 85
Deferred Income Taxes Deferred income taxes reflect the impact of temporary differences between the amount of assets and liabilities recognized for financial reporting purposes and such amounts recognized for tax purposes. The net deferred tax asset (liability) consists of the following: Deferred Tax Assets: (In US$ millions)
June 30, 2013
December 31, 2012
Pension 8 8Provisions 25 3Property, plant and equipment 12 -Other 2 2
Gross deferred tax asset 47 13
Deferred Tax Liability: (In US$ millions)
June 30, 2013
December 31, 2012
Property, plant and equipment 15 5 Gain from sale of fixed assets 23 23Foreign exchange 47 54Other 3 1
Gross deferred tax liability 88 83
Net deferred tax liability (41) (70)
Net deferred taxes are classified as follows: (In US$ millions)
June 30, 2013
December 31, 2012
Short-term deferred tax asset 12 -Long-term deferred tax asset 35 13Short-term deferred tax liability (18) (6)Long-term deferred tax liability (70) (77)
Net deferred tax liability (41) (70)
Future taxable income justifies the inclusion of tax loss carry-forwards in the calculation of net deferred taxes.

13
Note 6 – Earnings per share The computation of basic earnings per share (“EPS”) is based on the weighted average number of shares outstanding during the period. Diluted EPS includes the effect of the assumed conversion of potentially dilutive instruments. The components of the numerator for the calculation of basic and diluted EPS are as follows: (In US$ millions)
Three months ended June 30,
Six months ended June 30,
2013 2012 2013 2012
Net income available to stockholders 1,727 526 2,136 941
Effect of dilution 9 9 19 18
Diluted net income available to stockholders 1,736 535 2,155 959
The components of the denominator for the calculation of basic and diluted EPS are as follows: (In US$ millions)
Three months ended June 30,
Six months ended June 30,
2013 2012 2013 2012
Basic earnings per share:
Weighted average number of common shares outstanding 469 468 469 468
Diluted earnings per share:
Weighted average number of common shares outstanding 469 468 469 468
Effect of dilutive share options 2 2 2 2
Effect of dilutive convertible bonds 21 20 21 20
492 489 492 489
Note 7 – Marketable securities The historic cost of marketable securities is marked to market, with changes in fair value recognized in “other comprehensive income” (“OCI”). Marketable securities held by us include 81.1% of the partially redeemed Petromena NOK 2,000 million bond (“Petromena”) and 12% of SapuraKencana Petroleum Bhd (“SapuraKencana”). On April 30, 2013, as part of the consideration for the sale of certain tender rigs to SapuraKencana, we received 400.8 million shares in SapuraKencana, increasing our shareholding from 6.38% to 12.02%. Refer to Note 10. Marketable securities and changes in their carrying value are as follows: (In US$ millions) Petromena SapuraKencana Total
Historic cost at December 31, 2012 4 124 128
Fair Market value adjustments recognized in the statement of other comprehensive income for the year ended December 31, 2012 - 205 205
Net book value at December 31, 2012 4 329 333
Market value of shares acquired on disposal of tender rig division - 416 416 Fair market value adjustments recognized in the statement of other comprehensive income - 187 187
Net book value at June 30, 2013 4 932 936

14
Note 8 – Business Acquisitions Acquisition of Songa Eclipse On November 15, 2012 a subsidiary of Seadrill Ltd entered into an agreement with Songa Eclipse Ltd to acquire the ultra-deepwater semi-submersible drilling rig, "Songa Eclipse" for cash consideration of US$590 million. The cash consideration also includes the acquisition of the drilling contract with Total Offshore Angola that is fixed and ending in December 2013 with three one year options to extend the contract. This acquisition is in line with our strategy of building a modern fleet through selective acquisitions and organic growth giving us an increased exposure to the ultra-deepwater market. A prepayment of US$59 million was made before the end of 2012 and the physical delivery and final payment took place on January 3, 2013 which is considered to be the acquisition date. This purchase is considered to constitute a business combination for accounting purposes. The fair value of the net assets acquired have been determined using independent broker valuations and estimated market prices for similar contracts. The unfavorable contract acquired is amortized over the estimated length of the contract, including extension periods, and is presented in the Statement of Operations within other revenues. Subsequent to the acquisition, the drilling rig has been renamed the West Eclipse. The preliminary fair values of net assets acquired were as follows: (In US$ millions)
January 3, 2013
Fair value of net assets acquired: Drilling units 698 Unfavorable contract – Other current liabilities (27) Unfavorable contract – Other non-current liabilities (81)
Net assets acquired 590 Fair value of consideration 590
The amounts of revenue and net income from the acquisition included in the interim consolidated financial statements are US$39 million and US$7 million respectively. Consolidation of Asia Offshore Drilling Ltd On March 25, 2013, we and the other major shareholder in AOD, Mermaid Maritime Plc, signed a shareholder resolution that changed the board composition in favor of the Company. Based on this change as of March 25, 2013 we control the Board and own 66.18% of the outstanding shares. As a result of obtaining control we must consolidate the results and financial position of AOD. The acquisition is considered to constitute a business combination achieved in stages for accounting purposes. The fair values of the net assets acquired have been determined based on independent broker valuations for drilling rigs and newbuilds and estimated remaining contractual payments for newbuilds under construction. The fair value of the non-controlling interest has been determined based on the quoted share price for AOD at the time of the acquisition. The preliminary fair values of net assets acquired, the remeasurement of our previously held equity interest, measurement of the non-controlling interest and associated bargain purchase gain are as follows: (In US$ millions)
March 25, 2013
Cash and cash equivalents 1
Current assets 1
Drilling units 633
Non-current assets 633
Construction obligation (316)Other current liabilities (8)
Current liabilities (324)
Non-current liabilities -
Net assets acquired 310

15
Net book value of equity investment 185Fair value of previously held equity investment 195
Gain on re-measurement of previously held equity investment 10 Fair value of establishment of non-controlling interest 100 Bargain purchase Fair value of establishment of non-controlling interest 100 Fair value of previously held equity investment 195
Total 295 Net assets acquired 310
Gain on bargain purchase 15
Note 9 – Associated companies Sevan Drilling ASA On January 30, 2013, we sold 96,000,000 shares of Sevan Drilling ASA (“Sevan”) and entered into a forward share purchase agreement with exposure to the same number of shares. The shares were sold at NOK 3.95 per share. The forward agreement ran until May 6, 2013 and had a strike price of NOK 3.9851. On April 30, 2013, this forward agreement for 96,000,000 shares was rolled to August 9, 2013, with a new forward price of NOK 4.02. On February 7, 2013, we were allocated and subscribed for 81,828,500 shares in Sevan at a subscription price of NOK 3.95 as part of private placement. Subsequently, we sold these shares and entered into a forward share purchase agreement with exposure to the same number of shares. The forward agreement ran until May 6, 2013 and had a strike price of NOK 3.9815 per share. On May 6, 2013, this forward agreement for 81,828,500 shares was rolled to August 6, 2013, with a new forward price of NOK 4.01. Following these transactions, we are exposed through forward share purchase agreements to 177,828,500 shares, representing 29.91% of the outstanding shares of Sevan. On June 26 and 27, 2013 we entered into agreements with a commercial bank to acquire a total of 120,065,464 shares in Sevan at an average price of NOK 3.9311 for 20.2% of Sevan’s outstanding shares. This transaction settled on July 2, 2013 and therefore we have not recognized this transaction in our balance sheet as of June 30, 2013. As of June 30, 2013, we had a commitment to pay US$78 million that was settled on July 2, 2013 in accordance with the agreement. As a result of our 29.91% interests in Sevan through existing forward share purchase agreements as discussed above and our additional arrangement to purchase 20.2% shares of Sevan as discussed above, our total ownership interests in Sevan increased to 50.1% as of July 2, 2013. In accordance with US GAAP we have obtained a controlling financial interest in Sevan as of July 2, 2013. Additionally as a result of our increased interests, Seadrill announced that a mandatory offer will be made for the outstanding shares of Sevan. Refer to note 22 for further details. Archer Limited On February 8, 2013, we were allocated 82,003,000 shares in the private placement of Archer Limited (“Archer”), amounting to a value of $98.4 million. In addition, as consideration for acting as an underwriter to the placement, we received another 2,811,793 shares, amounting to a value of $3.4 million. In conjunction with this private placement Archer refinanced some of its debt obligations. As part of Archer’s refinancing, Seadrill provided a guarantee to Archer on its payment obligations on a certain financing arrangement. The maximum liability to Seadrill is limited to $100 million with a guarantee fee of 1.25%. As at June 30, 2013 we held 39.9% of the outstanding shares of Archer. Varia Perdana and Tioman Drilling Varia Perdana Sdn Bhd. ("Varia Perdana") and Tioman Drilling Company Sdn Bhd (“Tioman Drilling”) are companies incorporated in Malaysia, which own and operate a fleet of five tender rigs. The companies were 49% owned by Seadrill,

16
and 51% owned by SapuraCrest Bhd (a subsidiary of SapuraKencana). Our holdings in these companies were disposed on April 30, 2013, through SapuraKencana’s acquisition of our tender rig business. Refer to note 10.
Note 10 – Disposal of Tender rigs As of March 31, 2013 the assets and liabilities associated with the tender rig business disposed to SapuraKencana were classified as held for sale in our interim financial statements. On April 30, 2013 we completed the sale of the entities which owned and operated the following tender rigs: T-4, T-7, T-11, T-12, West Alliance, West Berani, West Jaya, West Menang, West Pelaut, West Setia, and the newbuilds T-17, T-18, and West Esperanza. In addition our 49% ownership in Varia Perdana and Tioman Drilling was sold as part of this transaction, which included the following rigs: T-3, T-6, T-9, T-10, and the Teknik Berkat. This is collectively referred to as the “tender rig businesses”. The agreed upon price was for an enterprise value of US$2.9 billion. The purchase price is comprised of US$1.2 billion in cash, US$416 million in new shares in SapuraKencana (at RMB3.18 per share), US$760 million related to all the debt in the tender rigs business, future capital commitments of US$320 million and a deferred consideration of US$187 million. The deferred consideration consists of non-contingent consideration of US$145 million payable in three years and contingent consideration of US$42 million depending on certain specified future performance conditions. The fair values recognized for accounting purposes are US$135 million and US$ nil for the non-contingent and contingent considerations respectively. The acquisition price was also adjusted for a tender rig EBITDA contribution of about US$75 million. The total recognized gain on this transaction was US$1.3 billion, which has been presented in our Consolidated Statement of Operations, under “Gain on disposal of tender rigs”. Under the terms of the sale agreement, Seadrill will continue to manage and supervise at it risk the construction of the three tender rig newbuilds; T-17, T-18, and West Esperanza. Seadrill will also provide management, administration and support services for the three tender rigs: West Jaya, West Setia, and West Esperanza outside of Asia and until the earlier of (i) SapuraKencana decide on their option to take over the management, or (ii) the client contract expiry date. After this transaction, Seadrill has ownership of 720,329,691 shares in SapuraKencana, a holding of 12.02%, representing a gross value of US$932 million based on the closing share price of RMB4.09 on June 30, 2013. This is currently held as a Marketable Security on the Balance Sheet, refer to Note 7. Due to the significant continuing involvement in the ongoing business with SapuraKencana we have concluded that the results should not be presented as a discontinued operation in our Consolidated Statement of Operations.
Note 11 – Newbuildings (In US$ millions)
June 30, 2013
December 31, 2012
Opening balance at the beginning of the period 1,882 2,531 Additions 2,026 1,343Re-classified as drilling units (231) (1,992)Disposal of tender rigs (153) -
Closing balance at the end of the period 3,524 1,882
The additions are primarily related to consolidation of AOD in the first quarter and the West Auriga and West Vela, which we took delivery of on May 1, 2013 and June 28, 2013 respectively. The transfer to drilling units relates to AOD I, which commenced operations on May 1, 2013. The disposal of tender rigs to SapuraKencana was completed on April 30, 2013, refer to Note 10.

17
Note 12 – Drilling units (In US$ millions)
June 30, 2013
December 31, 2012
Cost 16,289 15,177Accumulated depreciation (2,598) (2,283)Disposals (800) -
Net book value 12,891 12,894
The increase in cost is primarily due to the purchase of Songa Eclipse (renamed West Eclipse) from Songa Offshore SE, which was completed on January 3, 2013. In addition AOD I was reclassified from Newbuildings to Drilling units on May 1, 2013. Disposals include the sale of West Janus in the first quarter, and the disposal of tender rigs to SapuraKencana that closed on April 30, 2013. Refer to Note 10. The depreciation expense was $315 million and $288 million for the six months, and $156 million and $148 million for the three months ended June 30, 2013 and 2012, respectively.
Note 13 – Equipment Equipment consists of IT and office equipment, furniture and fittings. (In US$ millions)
June 30, 2013
December 31, 2012
Cost 66 62Accumulated depreciation (26) (22)
Net book value 40 40
The depreciation expense was $4 million and $3 million for the six months, and $2 million and $2 million for the three months ended June 30, 2013 and 2012, respectively.
Note 14 – Goodwill The goodwill balance and changes in the carrying amount of goodwill are as follows: (In US$ millions)
June 30, 2013
December 31, 2012
Net book value at beginning of period 1,320 1,320Disposal of tender rig business (120) -
Net book value at end of period 1,200 1,320

18
Note 15 – Long-term interest bearing debt and interest expenses
(In US$ millions) June 30,
2013December 31,
2012 Credit facilities:
US$800 facility 205 227US$900 facility - 731US$100 facility - 69US$1,500 facility 794 882US$1,200 facility 800 867US$700 facility 525 560US$1,121 facility 966 1,019US$2,000 facility (North Atlantic Drilling) 1,667 1,750US$170 facility - 83US$550 facility 467 495US$400 facility 340 360US$440 facility 188 101US$450 facility 450 -US$1,450 facility 957 -US$360 facility (Asia Offshore Drilling) 205 -
Total credit facilities 7,564 7,144
Debt recorded in consolidated VIE’s:
US$420 facility* 405 397US$1,400 facility 408 822US$375 facility 375 -
Total debt recorded in consolidated VIE’s 1,188 1,219
Bonds and convertible bonds:
Bonds 1,848 1,567Convertible bonds 569 561
Total bonds and convertible bonds 2,417 2,128
Other credit facilities with corresponding restricted cash deposits: 225 270
Total interest bearing debt 11,394 10,761
Less: current portion (2,873) (2,066)
Long-term portion of interest bearing debt 8,521 8,695 * On December 28, 2012, the US$700 million facility, with SFL West Polaris Limited as borrower, was refinanced and replaced with a new US$420 million facility with a consortium of banks and financial institutions. As at December 31, 2012 the facility had an outstanding balance of $397.5 million. In January 2013, a further US$22.5 million was drawn down. The new facility has a term of five years and bears an interest of LIBOR plus a margin of 3%.
The outstanding debt as of June 30, 2013 is repayable as follows: (In US$ millions)
As at June 30,
Twelve months ended June 30, 2014 2,873 Twelve months ended June 30, 2015 1,341 Twelve months ended June 30, 2016 1,332 Twelve months ended June 30, 2017 2,015 Twelve months ended June 30, 2018 and thereafter 3,914 Effect of amortization of convertible bond (81)
Total debt 11,394
In January 2013, we drew down on the new $450 million Eclipse facility, which was entered into with a syndicate of banks and financial institutions. The facility is secured over the West Eclipse semi-submersible rig, which has a net book value of $697 million. The facility matures within one year and bears interest of LIBOR plus 3%.

19
On March 5, 2013 we issued a NOK 1,800 million senior unsecured bond with maturity in March 2018. The bond bears interest of NIBOR plus a margin of 3.75%. The financial covenants related to this bond require us to maintain a market adjusted equity ratio of at least 30%. On April 10, 2013, our subsidiary Asia Offshore Drilling entered into a US$360 million senior secured credit facility with ABN AMRO Bank N.V. as the coordinating bank. The facility is available in three equal tranches of US$ 120 million, with each tranche relating to the three AOD rigs. The loan has a five year maturity from the initial borrowing date, and bears interest of LIBOR plus 2.75%. The first drawdown of US$ 205 million was made on April 15, 2013, relating to AOD I and AOD II. Subsequent to the balance sheet date, on July 17, 2013, a further drawdown of US$ 155 million was made relating to AOD II and the delivery of AOD III. On April 25, 2013, we drew down US$98 million relating to the T16 tender rig, which is part of the existing $440 million credit facility. On April 30, 2013, the US$900 million facility and US$100 facility were repaid in full as part of the disposal of our tender rigs to SapuraKencana. Refer to note 10. On May 1, 2013 we drew down the first tranche of the $1,450 million facility, relating to the West Auriga, and on June 28, 2013 we drew down the second tranche relating to the West Vela. The facility has a maturity in 2025 and bears an interest of LIBOR plus a margin in the range of 1.2% to 3%. The facility is secured on the West Auriga, West Vela, and West Tellus. The net book values of the West Auriga, West Vela, and West Tellus are $668 million, $621 million, and $186 million respectively. On May 24, 2013, Ship Finance International Limited (“Ship Finance”, a related party) and SFL Hercules refinanced the Hercules tranche of the US$1,400 million facility, which was replaced by a new US$375 million facility, with a syndicate of banks and financial institutions. The Taurus tranche of the US$1,400 million facility remains with SFL Deepwater. The new facility is secured over the West Hercules, which has a net book value of $607 million. The facility matures in six years and bears interest of LIBOR plus 2.75%. On June 27, 2013, we repaid in full all amounts outstanding relating to the US$170 million facility, which was secured over the West Prospero.
Note 16 – Share capital June 30, 2013 December 31, 2012 All shares are common shares of US$2.00 par value each Shares US$ millions Shares US$ millionsAuthorized share capital 800,000,000 1,600 800,000,000 1,600 Issued and fully paid share capital 469,250,933 939 469,250,933 938Treasury shares held by Company (158,679) - (72,859) -
Shares outstanding 469,092,254 939 469,178,074 938

20
Note 17 – Accumulated other comprehensive income Accumulated other comprehensive income as at June 30, 2013 and December 31, 2012 was as follows: (In US$ millions)
June 30,2013
December 31,2012
The total balance of accumulated other comprehensive income is made up as follows:
Unrealized gain on marketable securities 393 206
Unrealized gain on foreign exchange 67 67
Actuarial loss relating to pension (27) (30)
Unrealized loss on interest rate swaps in VIEs (49) (49)
Accumulated other comprehensive income 384 194
With the exception of actuarial loss relating to pension, income taxes associated with each component of other comprehensive income is $0. The income tax benefit on actuarial loss relating to pension is $7 million as of June 30, 2013 and $8 million as of December 31, 2012.
Note 18 – Risk management and financial instruments The majority of our gross earnings from rigs and vessels are receivable in US dollars and the majority of our other transactions, assets and liabilities are denominated in US dollars, the functional currency of the Company. However, we have operations and assets in a number of countries worldwide and incur expenditures in other currencies, causing results from operations to be affected by fluctuations in currency exchange rates, primarily relative to the US dollar. We are also exposed to changes in interest rates on floating interest rate debt and to the impact of changes in currency exchange rates on NOK denominated debt. Therefore there is a risk that currency and interest rate fluctuations will have a negative effect on the value of our cash flows. Interest rate risk management Our exposure to interest rate risk relates mainly to floating interest rate debt and balances of surplus funds placed with financial institutions. This exposure is managed through the use of interest rate swaps and other financial derivative arrangements. Our objective is to obtain the most favorable interest rate borrowings available without increasing foreign currency exposure. Surplus funds are used for prepayment of revolving facilities or placed in fixed deposits with reputable financial institutions, yielding higher returns than are available on overnight deposits in banks. Such deposits generally have short-term maturities, in order to provide us with flexibility to meet all requirements for working capital and capital investments. The extent to which we utilize interest rate swaps and other derivatives to manage interest rate risk is determined by the net debt exposure and our views on future interest rates. Interest rate swap agreements not qualified as hedge accounting At June 30, 2013 we had interest rate swap agreements with an outstanding principal of US$8,871 million (December 31, 2012: US$6,148 million). These agreements do not qualify for hedge accounting and accordingly any changes in the fair values of the swap agreements are included in the Consolidated Statement of Operations under "Gain/(loss) on derivative financial instruments". The total fair value of the interest rate swaps outstanding at June 30, 2013 amounted to a gross liability of US$280 million and a net liability of US$161 million due to master netting agreements with our counterparties (December 31, 2012: a gross and net liability of US$384 million). The fair value of the interest rate swaps are classified as other current liabilities in the balance sheet.

21
During the six months to June 30, 2013 we entered into the following new interest rate and cross currency interest rate swaps:
Outstanding principal (In US$ millions)
Receive rate Pay rate Length of contract
250 3 month LIBOR 1.36% Jan 2013 – Jan 2020
250 3 month LIBOR 1.39% Jan 2013 – Jan 2020
250 3 month LIBOR 1.45% Jan 2013 – Jan 2020
250 3 month LIBOR 1.45% Jan 2013 – Jan 2020
250 3 month LIBOR 1.47% Jan 2013 – Jan 2020
250 3 month LIBOR 1.47% Jan 2013 – Jan 2020
450 3 month LIBOR 1.10% Feb 2013 – Jul 2018
250 3 month LIBOR 1.52% Feb 2013 – Feb 2020
200 3 month LIBOR 1.39% Mar 2013 – Mar 2020
300 3 month LIBOR 1.57% Mar 2014 – Mar 2020
95 3 month LIBOR 1.11% May 2013 – Jun 2020
Cross currency interest rate swaps not qualified as hedge accounting At June 30, 2013 we had outstanding cross currency interest rate swaps with a principal amount of US$532 million (December 31, 2012: US$216 million). These agreements do not qualify for hedge accounting and accordingly any changes in the fair values of the swap agreements are included in the Consolidated Statement of Operations under " Gain/(loss) on derivative financial instruments". The total fair value of cross currency interest swaps outstanding at June 30, 2013 amounted to a liability of US$29 million (December 31, 2012: asset of US$7 million). The fair value of the cross currency interest swaps are classified as other current liabilities in the balance sheet. Interest rate hedge accounting One of the Ship Finance subsidiaries consolidated by the Company as a VIE (refer to Note 19 – Variable Interest Entities) has entered into an interest rate swap in order to mitigate its exposure to variability in cash flows for future interest payments on the loans taken out to finance the acquisition of West Taurus. This interest rate swap qualifies for hedge accounting and any changes in its fair value are included in "Other comprehensive income". Below is a summary of the notional amount, fixed interest rate payable and duration of this interest rate swap. Variable interest entity Outstanding principal
(In US$ Millions) Receive rate Pay rate Length of contract
SFL Deepwater Limited (West Taurus)
450 1 month LIBOR 2.17% Dec 2008 - Aug 2013
In the six month period ended June 30, 2013, the above VIE Ship Finance subsidiary recorded fair value gains of $4 million on interest rate swaps. This gain was recorded by the VIE in "Other comprehensive income" but due to its ownership by Ship Finance this loss is allocated to "Non-controlling interest" in our statement of changes in equity. Any change in fair value resulting from hedge ineffectiveness is recognized immediately in earnings. The VIE, and therefore Seadrill, did not recognize any gain or loss due to hedge ineffectiveness in the consolidated financial statements during the three and six month periods ended June 30, 2013. Foreign exchange risk management The Company and the majority of its subsidiaries use the U.S. dollar as their functional currency because the majority of their revenues and expenses are denominated in U.S. dollars. Accordingly, the Company's reporting currency is also U.S. dollars. We do, however, earn revenue and incur expenses in other currencies and there is thus a risk that currency fluctuations could have an adverse effect on the value of our cash flows.

22
Foreign currency forwards not qualified as hedge accounting We use foreign currency forward contracts and other derivatives to manage exposure to foreign currency risk on certain assets, liabilities and future anticipated transactions. Such derivative contracts do not qualify for hedge accounting treatment and are recorded in the balance sheet under current receivables if the contracts have a net positive fair value, and under other current liabilities if the contracts have a net negative fair value. At June 30, 2013, we had forward contracts to sell approximately US$235 million between July and September 2013 at exchange rates ranging from NOK5.74 to NOK6.05 per US dollar. The total fair value of NOK currency forward contracts as at June 30, 2013 amounted to a liability of US$6 million (December 31, 2012: asset of US$4 million). During the quarter, we also entered into British Pounds Sterling (GBP) swap contracts to sell approximately GBP30 million between July and August 2013 at exchange rates ranging from GBP1.54 to GBP1.55 per US dollar. The total fair value of currency swaps outstanding at June 30, 2013 amounted to a liability of US$0.4 million (December 31, 2012: NIL). The fair value of the cross currency interest swaps are classified as other current liabilities in the balance sheet. Total Return Swap Agreements On June 4, 2013, we settled a TRS agreement for 2,000,000 Seadrill Limited shares, at a price of NOK 213.17. We subsequently entered into a new TRS agreement with exposure to 2,000,000 Seadrill Limited shares with an expiry date September 4, 2013, and reference price NOK 241.88 per share. The fair value of the TRS agreements at June 30, 2013 was an asset of US$2 million (December 31, 2012: liability of US$2 million). The fair values of the TRS agreements are classified as other current assets in the balance sheet as at June 30, 2013, and classified as current liabilities as at December 31, 2012. Credit risk The Company has financial assets, including cash and cash equivalents, marketable securities, other receivables and certain amounts receivable on derivative instruments, mainly forward exchange contracts and interest rate swaps. These assets expose the Company to credit risk arising from possible default by the counterparty. The Company considers the counterparties to be creditworthy financial institutions and does not expect any significant loss to result from non-performance by such counterparties. The Company, in the normal course of business, does not demand collateral. The credit exposure of interest rate swap agreements, currency option contracts and foreign currency contracts is represented by the fair value of contracts with a positive fair value at the end of each period, reduced by the effects of master netting agreements. It is the Company's policy to enter into master netting agreements with the counterparties to derivative financial instrument contracts, which give the Company the legal right to discharge all or a portion of amounts owed to counterparty by offsetting them against amounts that the counterparty owes to the Company. Fair values of financial instruments The carrying value and estimated fair value of the Company's financial instruments at June 30, 2013 and December 31, 2012 were as follows: June 30, 2013 December 31, 2012
(In US$ millions) Fair
valueCarrying
valueFair
valueCarrying
value Cash and cash equivalents 437 437 318 318Restricted cash 401 401 402 402 Current portion of long-term debt 2,875 2,873 2,066 2,066Long-term portion of floating rate debt 6,135 6,135 6,287 6,287Long term portion of fixed rate CIRR loans 177 177 218 218Fixed interest loans - - 70 69Fixed interest convertible bonds 628 569 872 561Fixed interest bonds 1,405 1,342 1,360 1,342Floating interest bonds 508 507 224 224

23
The carrying value of cash and cash equivalents and restricted cash, which are highly liquid, is a reasonable estimate of fair value and categorized at level 1 on the fair value measurement hierarchy. The fair value of the current and long-term portion of floating rate debt is estimated to be equal to the carrying value since it bears variable interest rates, which are reset regularly, usually every one to six months. This debt is not freely tradable and cannot be purchased by the Company at prices other than the outstanding balance plus accrued interest. We have categorized this at level 2 on the fair value measurement hierarchy. The fair value of the long-term portion of the fixed rate CIRR loans is equal to the carrying value, as they are matched with equal balances of restricted cash. We have categorized this at level 2 on the fair value measurement hierarchy. The convertible bonds are freely tradable and their fair value has been set equal to the price at which they were traded at on June 30, 2013 and December 31, 2012. We have categorized this at level 1 on the fair value measurement hierarchy. The fixed interest rate bonds are freely tradable and their fair value has been set equal to the price at which they were traded at on June 30, 2013 and December 31, 2012. We have categorized this at level 1 on the fair value measurement hierarchy. Financial instruments that are measured at fair value on a recurring basis: Fair value measurements
at reporting date using Total
Fair valueQuoted Prices in
Active Markets for Identical
Assets
Significant Other
Observable Inputs
Significant Unobservable
Inputs
(In US$ millions) June 30, 2013
(Level 1) (Level 2) (Level 3)
Assets: Marketable securities 936 932 - 4Interest rate swap contracts – short term receivable 5 5Other derivative instruments – short term receivable 2 - 2 -
Total assets 943 932 7 4Liabilities: Interest rate swap contracts – short term payable 166 - 166 -Cross currency swap contracts – short term payable 29 - 29 -Foreign exchange forwards – short term payable 7 - 7 -Other derivative instruments – short term payable 4 - 4 -
Total liabilities 206 - 206 - Fair value measurements
at reporting date using Total
fair valueQuoted Prices in Active Markets
for Identical Assets
Significant Other
Observable Inputs
Significant Unobservable
Inputs
(In US$ millions) December 31, 2012
(Level 1) (Level 2) (Level 3)
Assets: Marketable securities 333 329 - 4Other derivative instruments – short term receivable 11 - 11 -
Total assets 344 329 11 4
Liabilities: Interest rate swap contracts – short term payable 388 - 388 -Other derivative instruments – short term payable 8 - 8 -
Total liabilities 396 - 396 -
ASC Topic 820 Fair Value Measurement and Disclosures emphasizes that fair value is a market-based measurement, not an entity-specific measurement, and should be determined based on the assumptions that market participants would use in pricing the asset or liability. As a basis for considering market participant assumptions in fair value measurements, ASC

24
Topic 820 establishes a fair value hierarchy that distinguishes between market participant assumptions based on market data obtained from sources independent of the reporting entity (observable inputs that are classified within levels one and two of the hierarchy) and the reporting entity's own assumptions about market participant assumptions (unobservable inputs classified within level three of the hierarchy). Level one input utilizes unadjusted quoted prices in active markets for identical assets or liabilities that the Company has the ability to access. Level two inputs are inputs other than quoted prices included in level one that are observable for the asset or liability, either directly or indirectly. Level two inputs may include quoted prices for similar assets and liabilities in active markets, as well as inputs that are observable for the asset or liability, other than quoted prices, such as interest rates, foreign exchange rates and yield curves that are observable at commonly quoted intervals. Level three inputs are unobservable inputs for the asset or liability, which are typically based on an entity's own assumptions, as there is little, if any, related market activity. In instances where the determination of the fair value measurement is based on inputs from different levels of the fair value hierarchy, the level in the fair value hierarchy within which the entire fair value measurement falls is based on the lowest level input that is significant to the fair value measurement in its entirety. The Company's assessment of the significance of a particular input to the fair value measurement in its entirety requires judgment, and considers factors specific to the asset or liability. Quoted market prices are used to estimate the fair value of marketable securities, which are valued at fair value on a recurring basis. The fair value of total return equity swaps is calculated using the closing prices of the underlying listed shares, dividends paid since inception and the interest rate charged by the counterparty. The fair values of interest rate swaps and forward exchange contracts are calculated using well-established independent valuation techniques applied to contracted cash flows and LIBOR and NIBOR interest rates as of June 30, 2013. The fair value of other derivative instruments is calculated using the closing prices of the underlying securities, dividends paid since inception and the interest charged by the counterparty.
Note 19 – Variable Interest Entities (VIEs) As of June 30, 2013, the Company leased a drillship, two semi-submersible rigs, and a newbuild jack-up from VIEs under finance leases. Each of the units had been sold by the Company to single purpose subsidiaries of Ship Finance Ltd and simultaneously leased back by the Company on bareboat charter contracts for a term of 15 years. The Company has several options to repurchase the units during the charter periods, and obligations to purchase the assets at the end of the 15 year lease period. The following table gives a summary of the sale and leaseback arrangements, as of June 30, 2013: On June 19, 2013, SFL Deepwater Ltd sold the West Hercules to SFL Hercules Ltd. This transaction under common control has no net effects on our consolidated financial statements, and we will continue to consolidate all relevant VIEs. On June 28, 2013, our subsidiary North Atlantic Drilling sold the entity that owns the newbuild jack-up, the West Linus, to Ship Finance Limited. The purchase consideration for this transfer should reflect the market value of the rig as of the delivery date. This shall not exceed US$600 million. Upon closing North Atlantic Drilling received US$195 million and will receive the remaining balance on the delivery date. This rig was simultaneously chartered back over a period of 15 years. If the rig has not been successfully delivered from the shipyard and unconditionally accepted by the charterer by February 28, 2014, Ship Finance will have an option to sell the shares back to the North Atlantic with immediate effect for an amount equal to all cash payments by Ship Finance plus interest and expenses. Seadrill has granted a guarantee in the principal amount of up to US$525 million issued in favor of Ship Finance, which will become payable in the event that the West Linus is not unconditionally accepted by the charterer by June 30, 2014. Unit Effective
from Sale value (In US$ millions)
First repurchase
option (In US$ millions)
Month of first repurchase
option
Last repurchase
option * (In US$ millions)
Month of last repurchase Option *
West Polaris Jul 2008 850 548 Sep 2012 178 Jun 2023 West Taurus Nov 2008 850 418 Feb 2015 149 Nov 2023 West Hercules Oct 2008 850 580 Aug 2011 135 Aug 2023 West Linus Jul 2013 600 370 June 2018 170 June 2028

25
* For the unit West Polaris, Ship Finance has a put option exercisable at the end of the lease terms by which the vessel may be sold to Seadrill for a fixed price of $75 million. For West Taurus and West Hercules repurchase obligations at the end of the lease terms have been agreed, at $149 million and $135 million, respectively. For West Linus the put option is $100 million. The Company has determined that the Ship Finance subsidiaries, which own the units, are variable interest entities (VIEs), and that the Company is the primary beneficiary of the risks and rewards connected with the ownership of the units and the charter contracts. Accordingly, these VIEs are fully consolidated in the Company's consolidated financial statements. The Company did not record any gains from the sale of the units, as they continued to be reported as assets at their original cost in the Company's balance sheet at the time of each transaction. The equity attributable to Ship Finance in the VIEs is included in non-controlling interests in the Company's consolidated accounts. At June 30, 2013 and at December 31, 2012 the units are reported under drilling units in the Company's balance sheet. The bareboat charter rates are set on the basis of a Base LIBOR Interest Rate for each bareboat charter contract, and thereafter are adjusted for differences between the LIBOR fixing each month and the Base LIBOR Interest Rate for each contract. A summary of the bareboat charter rates per day for each unit is given below. The amounts shown are based on the Base LIBOR Interest Rate, and reflect average rates for the year. (In US$ thousands) Unit
Base LIBOR interest rate 2013 2014 2015 2016 2017
West Polaris 2.85 % 223.3 176.5 175.4 170.0 170.0 West Taurus 4.25 % 316.2* 320.7 165.0 158.8 157.5 West Hercules 4.25 % 250.0 238.5 180.0 172.5 170.0 West Linus 1.00 % 85.0** 222.0 222.0 222.0 222.0 * For a period the interest rates for West Taurus have been fixed at 2.17% and the bareboat charter rate for West Taurus is fixed regardless of movements in LIBOR interest rates. The fixed charter rate is reflected in the above table. ** For West Linus, the charter rate is USD 85,000 per day from the date of delivery from the shipyard up until the date of commencement of the Drilling Contract: The assets and liabilities in the accounts of the VIEs as at June 30, 2013 and as at December 31, 2012 are as follows: June 30, 2013 December 31, 2012
(In US$ millions)
SFL West Polaris
Limited
SFL Deepwater
Limited
SFL Hercules Limited
SFL Linus
Limited
SFL West Polaris
Limited
SFL Deepwater
Limited Name of unit West Polaris West Taurus
West Hercules West Linus West
Polaris West Taurus
West Hercules Investment in finance lease 510 555 502 195 534 1,120 Other assets 10 10 10 - 7 20
Total assets 520 565 512 195 541 1,140
Long term debt - Current portion 36 408 28 - Long term debt 369 - 347 195 360 822 Other liabilities 113 140 137 - 107 167
Total liabilities 518 548 512 195 467 989
Equity 2 17 - - 74 151
Book value of units in the Company's consolidated accounts
584 462 607 132 594 1,035

26
Note 20 – Related party transactions We have entered into a number of sale and leaseback contracts for several drilling units with Ship Finance, a company in which our principal shareholders Hemen Holding Ltd and Farahead Investments Inc (hereafter jointly referred to as “Hemen”) and companies associated with Hemen have a significant interest. The shares of Hemen are held by trusts established by the Company’s President and Chairman Mr. John Fredriksen for the benefit of his immediate family. We have determined that the Ship Finance subsidiaries, which own the units, are variable interest entities (VIEs), and that we are the primary beneficiary of the risks and rewards connected with the ownership of the units and the charter contracts. Accordingly, these VIEs are consolidated in our financial statements. The equity attributable to Ship Finance in the VIEs is included in non-controlling interests in our consolidated financial statements. In the six month period ended June 30, 2013 and 2012, we incurred the following lease costs on units leased back from Ship Finance subsidiaries: (In US$ millions) Three months
ended June 30, Six months
ended June 30, 2013 2012 2013 2012
West Polaris 19 31 37 62
West Hercules 19 18 38 37
West Taurus 29 29 57 57
West Linus - - - -
Total 67 78 132 156
These lease costs are eliminated on consolidation. On July 1, 2010, the VIE companies SFL Deepwater and SFL Polaris declared and paid a dividend of US$290 million and US$145 million respectively to Ship Finance International Limited (SFIL). SFIL simultaneously granted loans to SFL Deepwater and SFL Polaris of the same amounts with an interest rate of 4.5%. These loans are presented as long term debt to related parties in our balance sheet on June 30, 2013 and December 31, 2012. On November 12, 2012 we granted Archer a short term unsecured loan of US$55 million. The loan had an interest of LIBOR + a margin and was settled in February 2013. On December 20, 2012, we sold our North Atlantic Drilling Ltd unsecured bond of US$500 million to Metrogas plus accrued interest of US$8.7 million with a call option to repurchase the bond in full for a price equal to par plus unpaid accrued interest on the date of repurchase. The call option matures in June 2013. The obligation is recorded as a long-term related party liability. In conjunction with this arrangement we also entered into an agreement to settle dividend payable to Metrogas in return for a short-term unsecured loan of US$93 million. The net proceeds from these arrangements were US$415.3 million. On May 31, 2013, Seadrill exercised the option to repurchase the bond from Metrogas, and the bond eliminates in the consolidated Seadrill financial statements as at June 30, 2013. On December 21, 2012, we obtained a short-term unsecured loan of US$93 million from Metrogas. The loan had an interest of LIBOR + a margin and was repaid on May 2, 2013. On December 31, 2012, we obtained a short-term loan from Metrogas of NOK140 million. The loan had an interest of NIBOR + a margin and was repaid on January 2, 2013. On February 20, 2013, we obtained a short-term unsecured loan of US$43 million from Archer. The loan had an interest of LIBOR + a margin of 5% and was repaid on February 27, 2013. On February 27, 2013, we obtained a short-term loan from Metrogas of NOK300 million. The loan had an interest of NIBOR + a margin and was repaid on March 12, 2013. On March 27, 2013, we obtained a short-term loan from Metrogas of NOK700 million. The loan had an interest of NIBOR + a margin, and was repaid after the period end on April 3, 2013.
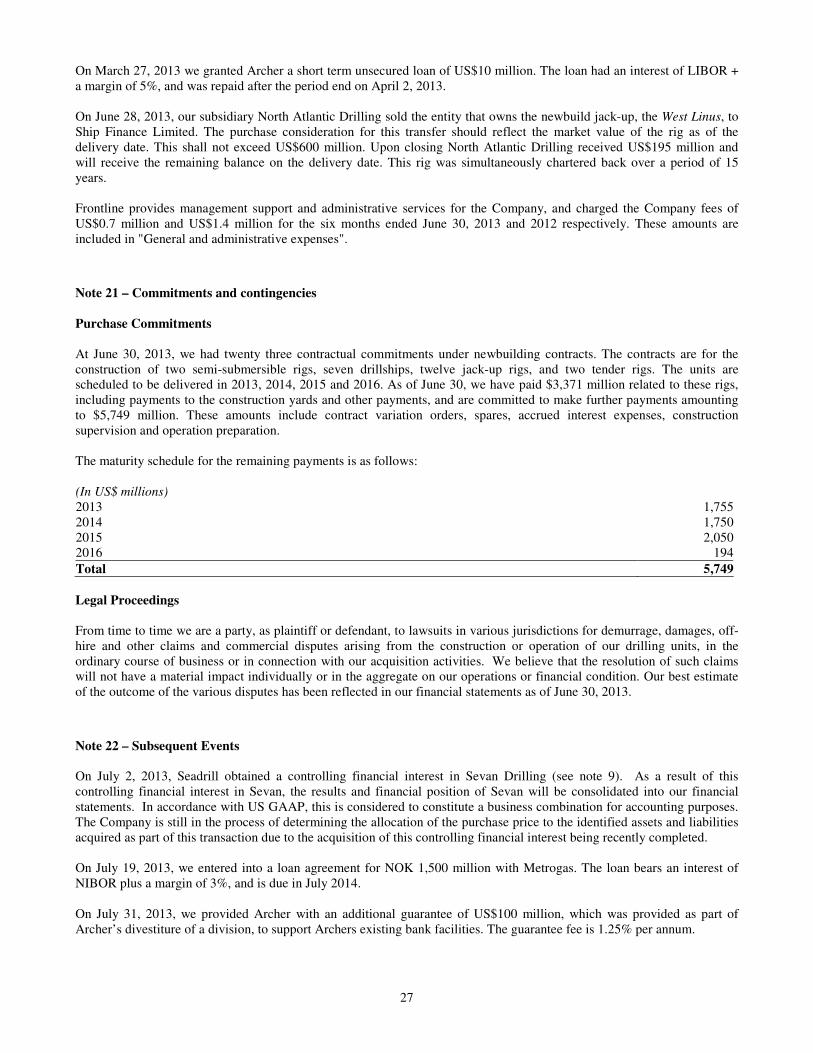
27
On March 27, 2013 we granted Archer a short term unsecured loan of US$10 million. The loan had an interest of LIBOR + a margin of 5%, and was repaid after the period end on April 2, 2013. On June 28, 2013, our subsidiary North Atlantic Drilling sold the entity that owns the newbuild jack-up, the West Linus, to Ship Finance Limited. The purchase consideration for this transfer should reflect the market value of the rig as of the delivery date. This shall not exceed US$600 million. Upon closing North Atlantic Drilling received US$195 million and will receive the remaining balance on the delivery date. This rig was simultaneously chartered back over a period of 15 years. Frontline provides management support and administrative services for the Company, and charged the Company fees of US$0.7 million and US$1.4 million for the six months ended June 30, 2013 and 2012 respectively. These amounts are included in "General and administrative expenses".
Note 21 – Commitments and contingencies Purchase Commitments At June 30, 2013, we had twenty three contractual commitments under newbuilding contracts. The contracts are for the construction of two semi-submersible rigs, seven drillships, twelve jack-up rigs, and two tender rigs. The units are scheduled to be delivered in 2013, 2014, 2015 and 2016. As of June 30, we have paid $3,371 million related to these rigs, including payments to the construction yards and other payments, and are committed to make further payments amounting to $5,749 million. These amounts include contract variation orders, spares, accrued interest expenses, construction supervision and operation preparation. The maturity schedule for the remaining payments is as follows: (In US$ millions) 2013 1,7552014 1,7502015 2,0502016 194
Total 5,749 Legal Proceedings From time to time we are a party, as plaintiff or defendant, to lawsuits in various jurisdictions for demurrage, damages, off-hire and other claims and commercial disputes arising from the construction or operation of our drilling units, in the ordinary course of business or in connection with our acquisition activities. We believe that the resolution of such claims will not have a material impact individually or in the aggregate on our operations or financial condition. Our best estimate of the outcome of the various disputes has been reflected in our financial statements as of June 30, 2013.
Note 22 – Subsequent Events On July 2, 2013, Seadrill obtained a controlling financial interest in Sevan Drilling (see note 9). As a result of this controlling financial interest in Sevan, the results and financial position of Sevan will be consolidated into our financial statements. In accordance with US GAAP, this is considered to constitute a business combination for accounting purposes. The Company is still in the process of determining the allocation of the purchase price to the identified assets and liabilities acquired as part of this transaction due to the acquisition of this controlling financial interest being recently completed. On July 19, 2013, we entered into a loan agreement for NOK 1,500 million with Metrogas. The loan bears an interest of NIBOR plus a margin of 3%, and is due in July 2014. On July 31, 2013, we provided Archer with an additional guarantee of US$100 million, which was provided as part of Archer’s divestiture of a division, to support Archers existing bank facilities. The guarantee fee is 1.25% per annum.
28
On August 7, 2013, we rolled the forward agreement for 96,000,000 Sevan shares for a new expiring date of November 6, 2013 with a strike price of NOK 4.05. Additionally, we rolled the forward agreement for 81,828,500 Sevan shares for a new expiry date of November 6, 2013 with a strike price of NOK 4.04.
On August 22, 2013, the mandatory offer made by Seadrill to purchase all of the shares in Sevan at NOK 3.95 per share expired. We received acceptances under the offer of totaling 47,394 shares. At completion of the offer Seadrill controls 297,941,358 shares of Sevan, either through direct ownership or forward contracts, representing 50.11% of all issued shares of Sevan.

29
Seadrill Limited
STATEMENT BY THE BOARD OF DIRECTORS AND CHIEF EXECUTIVE OFFICER
We confirm, to the best of our knowledge, that the condensed financial statements for the period January 1 to June 30, 2013 has been prepared in accordance with US GAAP – Interim Financial Reporting, and gives a true and fair view of the Group’s assets, liabilities, financial position and profit as a whole. We also confirm, to the best of our knowledge, that the interim report includes a fair review of important events that have occurred during the first six months of the financial year and their impact on the condensed financial statements, a description of the principal risks and uncertainties for the remaining six months of the financial year, and major related transactions. August 28, 2013 The Board of Directors Per Wullf Seadrill Limited CEO and President Seadrill Management Limited Hamilton, Bermuda London, United Kingdom