congestion and delay study - laredo€¦ · conclusion ... the primary purpose of the 2015...
TRANSCRIPT

2015 Laredo
Metropolitan Planning Organization
CONGESTION AND DELAY STUDY Final Report
EVALUATION PERIOD - FALL 2013
Prepared for:
Laredo Urban Transportation Study
Prepared by:
CoPLAN
5508 Sandalwood McKinney, Texas 75070
March 2015
ACKNOWLEDGEMENTS Laredo Urban Transportation Study
MPO POLICY COMMITTEE City of Laredo Representatives Honorable Pete Saenz – Mayor of Laredo (Chairperson) Honorable Roque Vela, Jr. – City Councilman, District V Honorable Charlie San Miguel – City Councilman District VI Laredo Mass Transit Board Honorable Roberto Balli, City Councilman District VIII County of Webb Representatives Honorable Tano E. Tijerina – Webb County Judge (Vice Chairperson) Honorable John Galo – Webb County Commissioner, Precinct 3 Honorable Jaime Canales – Webb County Commissioner, Precinct 4 State of Texas Representatives Melissa Montemayor – District Administrator, TxDOT Alberto Ramirez, P.E. – Transportation Planning and Design Director, TxDOT TECHNICAL REVIEW COMMITTEE City Representatives Claudia San Miguel - El Metro General Manager Jose L. Flores – Laredo International Airport Director Mario I. Maldonado – City of Laredo Bridge Director Roberto Murillo – City of Laredo Traffic Safety Director Rogelio Rivera – City of Laredo Engineering Director Nathan Bratton – City of Laredo Planning Director (Chairperson) County and Regional Representatives Rhonda Tiffin – Webb County Planning Director Robert Martinez – Webb County Rural Transit Director Luis Perez Garcia – Webb County Engineering Director Juan E. Rodriguez – South Texas Economic Development Representative State Representatives Ana Duncan, Planning Representative, TxDOT (Vice-Chairperson) Randy Aguilar, Planning Representative, TxDOT Carlos Rodriguez - Laredo Area Engineer, TxDOT Sara Garza - TPP Field Representative, TxDOT (Region) Federal Representatives Kirk Fauver - Federal Highway Administration Planning Representative Private Sector Representatives Eloy Sanchez or Arturo Dominguez – Kansas City Railroad Representative Thomas Blevins – Union Pacific Railroad Representative Eduardo Alvarez – Transportation Provider Representative School System Representatives Esteban Rangel – Laredo Independent School District Representative Michael Barron – United Independent School District Representative
The contents of this report reflect the views of th e preparers who are responsible for the opinions, findings, and conclusions herein. The co ntents do not necessarily reflect the views or policies of the Federal Highway Administra tion, Federal Transit Administration, or the Texas Department of Transportation.
Table of Contents
Page No.
EXECUTIVE SUMMARY ............................................................................................................ 1 INTRODUCTION ........................................................................................................................ 6
History of the Congestion Management Process ................................................................. 6 What is the Congestion Management Process? .................................................................. 6
1.0 Action 1 – Develop Regional Objective for Congestion Management ............................... 7 2.0 Action 2 – Define CMP Network ....................................................................................... 8 3.0 Action 3 – Develop Multimodal Performance Measures .................................................. 10
3.1 Traffic Flow .............................................................................................................. 10 3.2 Congestion Index (CI) and Volume Weighted Delay ................................................ 10
4.0 Action 4 – Collect Data / Monitor System Performance .................................................. 11 5.0 Action 5 – Analyze Congestion Problems and Needs ..................................................... 16
5.1 Roadway Segment Definition .................................................................................. 16 5.2 Data Reduction........................................................................................................ 16 5.3 Data Formatting ....................................................................................................... 17 5.4 Multimodal Analysis ................................................................................................. 17
6.0 Action 6 – Identify and Assess CMP Strategies .............................................................. 19 6.1 Congestion Results ................................................................................................. 19 6.2 Recommendations .................................................................................................. 23
7.0 Action 7 – Program and Implement CMP Strategies ....................................................... 29 8.0 Action 8 – Evaluate Strategy Effectiveness .................................................................... 29 CONCLUSION .......................................................................................................................... 29 Appendix A 2013 Congested Segments and Mitigation Appendix B 2013 Intersection Segment Results Appendix C 2015 US 83 Case Study
List of Tables
Page No.
Table E-1 – Top 20 Congested Segments .................................................................................. 3 Table 1 – Total Study Miles Summary ....................................................................................... 10 Table 2 – Top 20 Congested Segments .................................................................................... 20 Table 3 – Top 20 Recommendations to Mitigate Congestion .................................................... 24 Table 4 – AM Peak Hour Volumes ............................................................................................ 25 Table 5 – PM Peak Hour Volumes ............................................................................................ 25 Table 6 – Case-Study Delay Results ......................................................................................... 26
List of Figures
Page No.
Figure E-1 – Top 20 Congested Segments ................................................................................. 4 Figure 1 – 2013 Study Route ...................................................................................................... 9 Figure 2 – Speed Limits ............................................................................................................ 13 Figure 3 – School Zones ........................................................................................................... 14 Figure 4 – Intersection Control .................................................................................................. 15 Figure 5 – Peak Period Congestion Results .............................................................................. 18 Figure 6 – Top 20 Congested Segments ................................................................................... 21 Figure 7 – Travel Time Run Example ........................................................................................ 22 Figure 8 – Category of Recommended Congestion Mitigation ................................................... 28
1
EXECUTIVE SUMMARY Congestion management is the use of strategies to optimize operations of a transportation system through management of the existing system. As such, a congestion management process (CMP) is a systematic approach coordinated regionally that provided current performance measures detailing the systems performance and evaluates strategies that meet the local objectives. By definition, the CMP is not to be a stand-alone study…it is to be an integral component of the metropolitan transportation planning process. Once an MPO exceeds a population of 200,000, the CMP is required according to SAFETEA-LU, while the federal regulations are not strictly stated as to the methodology or approach that is to be followed. The flexibility is intentional within the regulations to allow the MPO to development a living methodology that evolves with the local objectives and needs. By responding to congestion through a process that involves developing congestion management objectives, developing performance measures to support these objectives, collecting data, analyzing problems, identifying solutions, and evaluating the effectiveness of implemented strategies, the CMP provides a structure for responding to congestion in a consistent, coordinated fashion. The Laredo Urban Transportation Study (LUTS) is initiating its’ inaugural congestion management process (CMP) to monitor the transportation network in Laredo study area. The study area includes a portion of Webb County and all of the City of Laredo. The goal of the monitoring system is to ensure optimal performance of the transportation system by identifying congested areas and related transportation deficiencies. The primary purpose of the 2015 Congestion and Delay Study is to evaluate the transportation system and prepare a report as part of the Congestion Management Process (CMP) in compliance with the Safe, Accountable, Flexible, and Efficient Transportation Equity Act: A Legacy for Users (SAFETEA-LU) requirements. The secondary purpose of the study was to
The CMP, as defined in federal
regulation, is intended to serve as a
systematic process that provides for
safe and effective integrated
management and operation of the
multimodal transportation system. The
process includes:
• Development of congestion
management objectives
• Establishment of measures of
multimodal transportation
system performance
• Collection of data and system
performance monitoring to
define the extent and duration of
congestion and determine the
causes of congestion
• Identification of congestion
management strategies
•
2
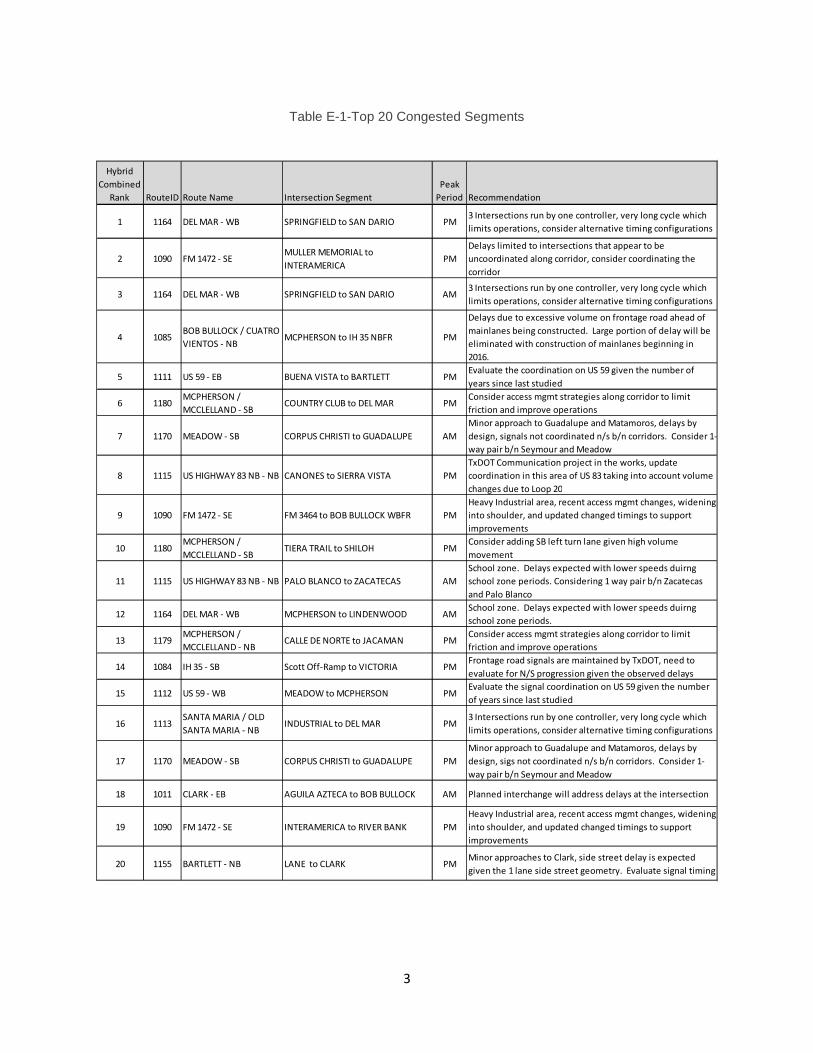
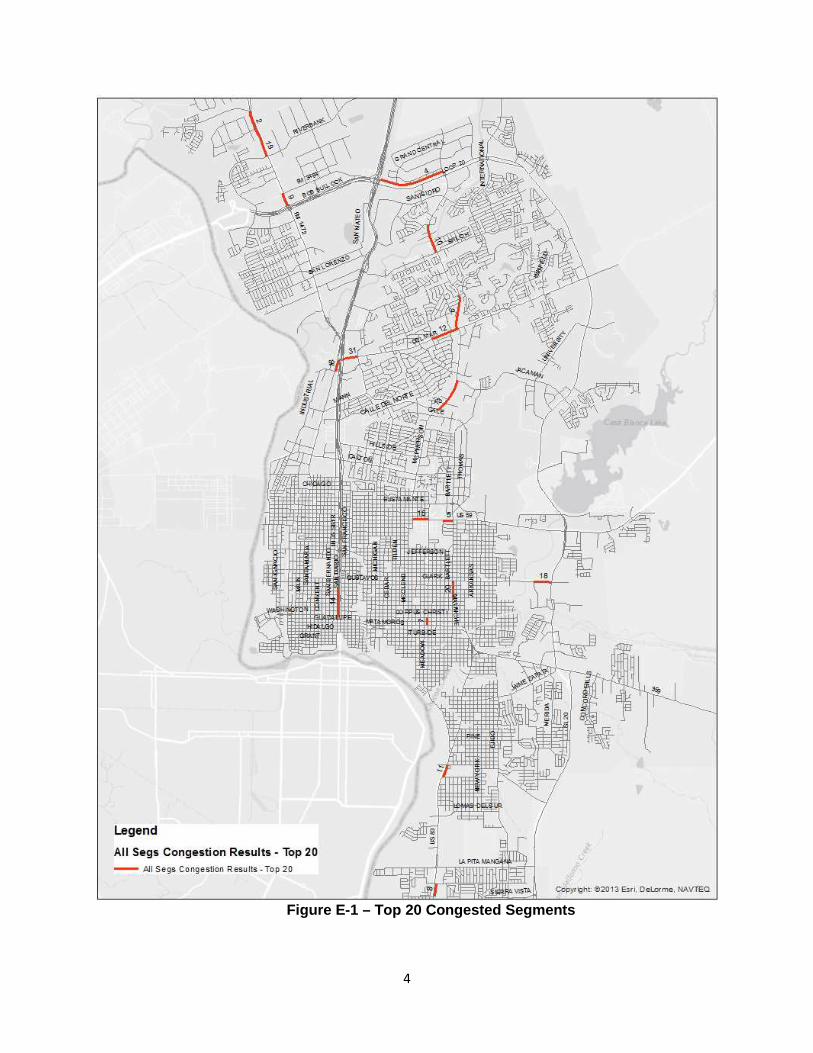
identify trends in congestion and travel time in order to identify problem locations for possible improvements. Being the inaugural study, the MPO is establishing the baseline of existing congestion for comparison in future years. To help establish the CMP network, the MPO staff invited representatives of local agencies and units of government to a kick-off meeting in October 2013. The primary goal of the meeting was to provide an overview of the CMP objectives. The study network, as defined by the Technical Committee, included 272 centerline miles of roadway spread over 92 different roadways divided into 1154 directional links bound by a traffic signal, stop sign, or major cross street. The CMP is intended to use an objectives-driven, performance-based approach to planning for the management of congestion. Through the use of congestion management objectives and performance measures, the CMP provides a mechanism for ensuring that investment decisions are made with a clear focus on desired outcomes. The purpose of this study was to identify problem areas using travel time studies. The results of this study are used as factors in prioritizing needed improvements. Through the use of a Global Positioning System (GPS) in the travel time runs congestion is pinpointed. By collecting position and speed data every one second, areas of delay were highlighted. This data provide the needed reference material to prepare recommendations that are focused on the true cause of the congestion. Travel time runs were conducted using the floating car method. Roadways included arterials and freeways. Intersection delay for through vehicles was recorded at signalized intersections and compared with criteria in the Highway Capacity Manual (HCM) to determine level of service. In order to differentiate between congested roadways and roadways with low speed limits, a performance measure for illustrating the data was introduced. The preferred performance measure as determine by the technical committee is composed of two parts. The first element is a ratio of actual travel speed to posted speed limit and is referred to as the Congestion Index (CI) or % of posted speed. The second element begins with the link daily volumes as included in the travel demand model prepared by TxDOT. By applying the volumes to the measured delays on the links, the volume weighted delay was determined. By combining the strengths of these two elements, the “hybrid” performance measure was determined and used to identify the operating results of each link of the CMP network. Of the 272 directional miles studied in AM and PM, it was determined to classify the top 15% of the segments as congested including both the results of the AM and PM periods. Table E-1 and Figure E-1 below shows the Top 20 congested segments in this study based on the combined hybrid performance measure that includes consider of CI and Volume Weighted Delay. The CMP is intended to be a structured, transparent, process for effective allocation of limited transportation funding among operations and capital projects and programs. As comprehensively tabulated in Appendix A, the recommended mitigation for those segments found to be congested is heavily weighted (70%) toward operational solutions or signal timing optimization. Through an integrated congestion monitoring process, decision-makers are provided with system performance and the effectiveness of potential solutions as well as the results of implemented strategies.
3
Table E-1-Top 20 Congested Segments
Hybrid
Combined
Rank RouteID Route Name Intersection Segment
Peak
Period Recommendation
1 1164 DEL MAR - WB SPRINGFIELD to SAN DARIO PM3 Intersections run by one controller, very long cycle which
limits operations, consider alternative timing configurations
2 1090 FM 1472 - SEMULLER MEMORIAL to
INTERAMERICAPM
Delays limited to intersections that appear to be
uncoordinated along corridor, consider coordinating the
corridor
3 1164 DEL MAR - WB SPRINGFIELD to SAN DARIO AM3 Intersections run by one controller, very long cycle which
limits operations, consider alternative timing configurations
4 1085BOB BULLOCK / CUATRO
VIENTOS - NBMCPHERSON to IH 35 NBFR PM
Delays due to excessive volume on frontage road ahead of
mainlanes being constructed. Large portion of delay will be
eliminated with construction of mainlanes beginning in
2016.
5 1111 US 59 - EB BUENA VISTA to BARTLETT PMEvaluate the coordination on US 59 given the number of
years since last studied
6 1180MCPHERSON /
MCCLELLAND - SBCOUNTRY CLUB to DEL MAR PM
Consider access mgmt strategies along corridor to limit
friction and improve operations
7 1170 MEADOW - SB CORPUS CHRISTI to GUADALUPE AM
Minor approach to Guadalupe and Matamoros, delays by
design, signals not coordinated n/s b/n corridors. Consider 1-
way pair b/n Seymour and Meadow
8 1115 US HIGHWAY 83 NB - NB CANONES to SIERRA VISTA PM
TxDOT Communication project in the works, update
coordination in this area of US 83 taking into account volume
changes due to Loop 20
9 1090 FM 1472 - SE FM 3464 to BOB BULLOCK WBFR PM
Heavy Industrial area, recent access mgmt changes, widening
into shoulder, and updated changed timings to support
improvements
10 1180MCPHERSON /
MCCLELLAND - SBTIERA TRAIL to SHILOH PM
Consider adding SB left turn lane given high volume
movement
11 1115 US HIGHWAY 83 NB - NB PALO BLANCO to ZACATECAS AM
School zone. Delays expected with lower speeds duirng
school zone periods. Considering 1 way pair b/n Zacatecas
and Palo Blanco
12 1164 DEL MAR - WB MCPHERSON to LINDENWOOD AMSchool zone. Delays expected with lower speeds duirng
school zone periods.
13 1179MCPHERSON /
MCCLELLAND - NBCALLE DE NORTE to JACAMAN PM
Consider access mgmt strategies along corridor to limit
friction and improve operations
14 1084 IH 35 - SB Scott Off-Ramp to VICTORIA PMFrontage road signals are maintained by TxDOT, need to
evaluate for N/S progression given the observed delays
15 1112 US 59 - WB MEADOW to MCPHERSON PMEvaluate the signal coordination on US 59 given the number
of years since last studied
16 1113SANTA MARIA / OLD
SANTA MARIA - NBINDUSTRIAL to DEL MAR PM
3 Intersections run by one controller, very long cycle which
limits operations, consider alternative timing configurations
17 1170 MEADOW - SB CORPUS CHRISTI to GUADALUPE PM
Minor approach to Guadalupe and Matamoros, delays by
design, sigs not coordinated n/s b/n corridors. Consider 1-
way pair b/n Seymour and Meadow
18 1011 CLARK - EB AGUILA AZTECA to BOB BULLOCK AM Planned interchange will address delays at the intersection
19 1090 FM 1472 - SE INTERAMERICA to RIVER BANK PM
Heavy Industrial area, recent access mgmt changes, widening
into shoulder, and updated changed timings to support
improvements
20 1155 BARTLETT - NB LANE to CLARK PMMinor approaches to Clark, side street delay is expected
given the 1 lane side street geometry. Evaluate signal timing
4
Figure E-1 – Top 20 Congested Segments
5
Managing demand and implementing operations strategies are more cost-effective in the short-term, than larger added capacity projects. Other Texas MPOs have created funding set-asides to be used to address operation projects that can be quickly addressed without the need for lengthy ROW process. Overall, the current transportation system provides sufficient capacity for the current demand. However, the CMP determined that increased focus be placed on operations to maximize the benefits of these investments and minimizing the overall delays along the corridors and side streets. Attention to operations may be accomplished through the integration of coordinated signal timing plans which provide consistent results to the commuting public during the peak periods.
6
INTRODUCTION
History of the Congestion Management Process
The Laredo MPO has initiated the Congestion Management Process (CMP) to monitor the transportation network in the region. The goal of the monitoring system is to ensure optimal performance of the transportation system by identifying congested areas and related transportation deficiencies. This information will then be used in the transportation planning process to develop strategic improvement projects that will improve and maintain the performance of roadways at a system level. The 2015 study was conducted in the Fall 2013 with travel time runs in September - November 2013. The primary tasks completed as part of this study include: o Mapping of the routes included to the CMP network o Travel time data collection o Delay Calculations o Addition of volumes from travel demand model
What is the Congestion Management Process?
Guidance provided by FHWA includes eight (8) “actions” that comprise a well-developed CMP. The elements are referred to as actions to indicate that the process is not to be thought of as a linear methodology to step through, but may include variations and at times one may need to revisit previous steps as a result of another. The actions below taken directly from the 2011 FHWA published “Congestion Management Process: A Guidebook” were used as the basis for the structure for this report, as well as the MPO’s inaugural CMP itself. 1. Develop Regional Objectives for Congestion Manageme nt – First, it is important to consider,―What is the desired outcome? ―What do we want to achieve? It may not be feasible or desirable to try to eliminate all congestion, and so it is important to define objectives for congestion management that achieve the desired outcome. 2. Define CMP Network – This action involves answering the question, ―What components of the transportation system are the focus…and involves defining both the geographic scope and system elements (e.g., freeways, major arterials, transit routes) that will be analyzed in the CMP. 3. Develop Multimodal Performance Measures – The CMP should address, ―How do we define and measure congestion? This action involves developing performance measures that will be used to measure congestion on both a regional and local scale. These performance measures should relate to, and support, regional objectives. 4. Collect Data/Monitor System Performance – After performance measures are defined, data should be collected and analyzed to determine, ―How does the transportation system perform? Data collection may be on-going and involve a wide range of data sources and partners.
7
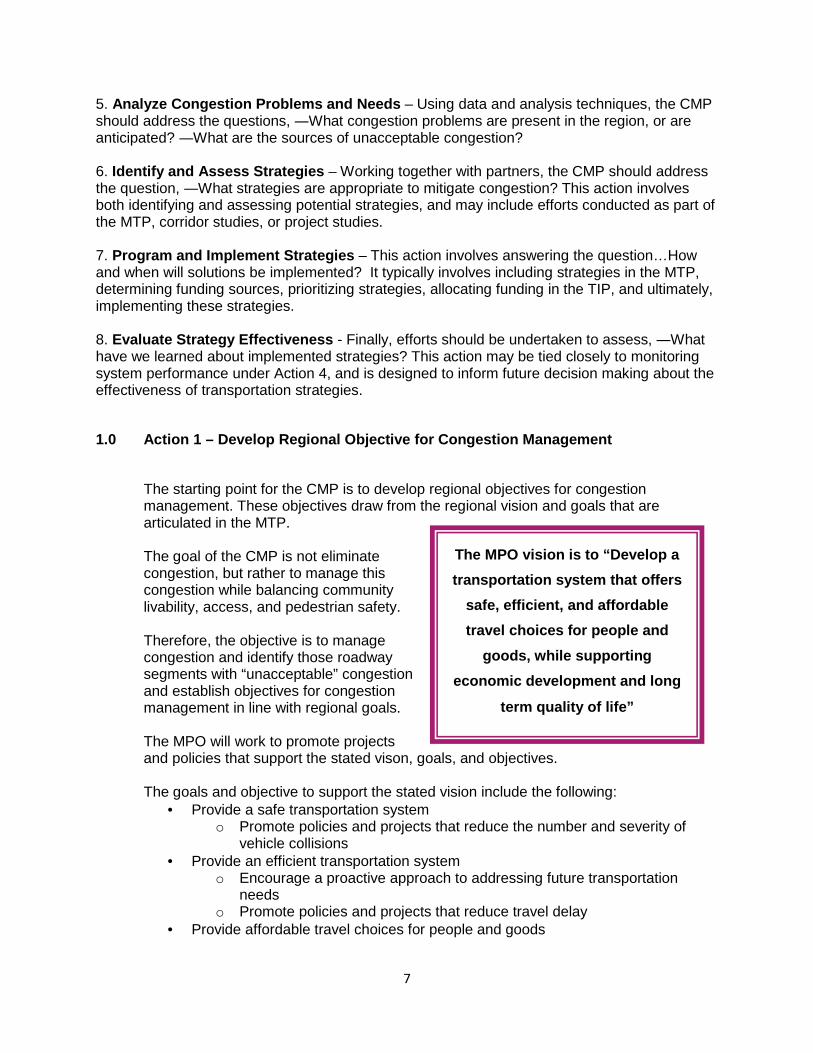
5. Analyze Congestion Problems and Needs – Using data and analysis techniques, the CMP should address the questions, ―What congestion problems are present in the region, or are anticipated? ―What are the sources of unacceptable congestion? 6. Identify and Assess Strategies – Working together with partners, the CMP should address the question, ―What strategies are appropriate to mitigate congestion? This action involves both identifying and assessing potential strategies, and may include efforts conducted as part of the MTP, corridor studies, or project studies. 7. Program and Implement Strategies – This action involves answering the question…How and when will solutions be implemented? It typically involves including strategies in the MTP, determining funding sources, prioritizing strategies, allocating funding in the TIP, and ultimately, implementing these strategies. 8. Evaluate Strategy Effectiveness - Finally, efforts should be undertaken to assess, ―What have we learned about implemented strategies? This action may be tied closely to monitoring system performance under Action 4, and is designed to inform future decision making about the effectiveness of transportation strategies.
1.0 Action 1 – Develop Regional Objective for Conge stion Management
The starting point for the CMP is to develop regional objectives for congestion management. These objectives draw from the regional vision and goals that are articulated in the MTP. The goal of the CMP is not eliminate congestion, but rather to manage this congestion while balancing community livability, access, and pedestrian safety. Therefore, the objective is to manage congestion and identify those roadway segments with “unacceptable” congestion and establish objectives for congestion management in line with regional goals. The MPO will work to promote projects and policies that support the stated vison, goals, and objectives. The goals and objective to support the stated vision include the following:
• Provide a safe transportation system o Promote policies and projects that reduce the number and severity of
vehicle collisions • Provide an efficient transportation system
o Encourage a proactive approach to addressing future transportation needs
o Promote policies and projects that reduce travel delay • Provide affordable travel choices for people and goods
The MPO vision is to “Develop a
transportation system that offers
safe, efficient, and affordable
travel choices for people and
goods, while supporting
economic development and long
term quality of life”
8
o Promote the increase of viable, affordable travel choices for people and goods
o Promote policies and programs to increase transit ridership on existing services
o Promote awareness of multimodal facilities • A transportation system that promotes economic vigor and long term quality of
life o Promote the efficient and effective connection of people, jobs, goods, and
services o Promote the minimization of environmental impact and improved
environmental quality o Promote the unique identities and qualities of neighborhoods,
communities, and region as a whole Stakeholders and participants in this study were part of the Technical Advisory Committee. The committee included representatives of the following governments units or agencies:
• City of Laredo, • Webb County, • El Metro Transit, • South Texas Economic Development, • Laredo Independent School District, • United Independent School District, • Federal Highway Administration, and • TxDOT Laredo District and Region staff.
2.0 Action 2 – Define CMP Network
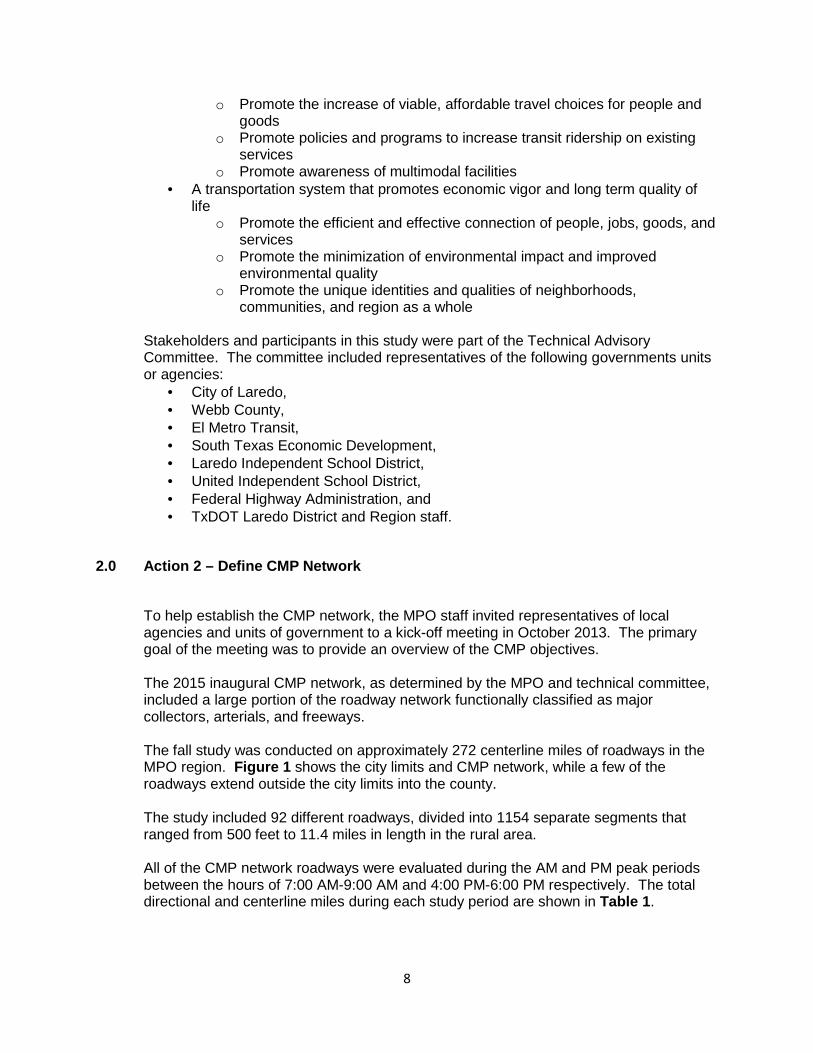
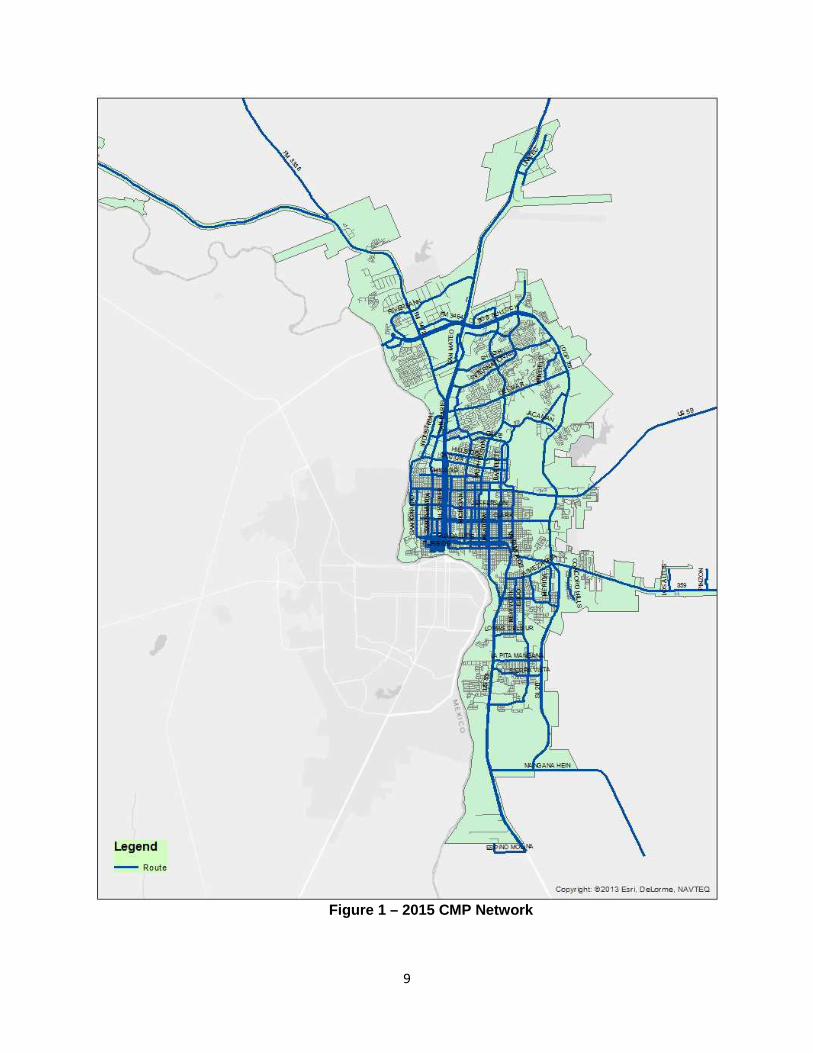
To help establish the CMP network, the MPO staff invited representatives of local agencies and units of government to a kick-off meeting in October 2013. The primary goal of the meeting was to provide an overview of the CMP objectives. The 2015 inaugural CMP network, as determined by the MPO and technical committee, included a large portion of the roadway network functionally classified as major collectors, arterials, and freeways. The fall study was conducted on approximately 272 centerline miles of roadways in the MPO region. Figure 1 shows the city limits and CMP network, while a few of the roadways extend outside the city limits into the county. The study included 92 different roadways, divided into 1154 separate segments that ranged from 500 feet to 11.4 miles in length in the rural area. All of the CMP network roadways were evaluated during the AM and PM peak periods between the hours of 7:00 AM-9:00 AM and 4:00 PM-6:00 PM respectively. The total directional and centerline miles during each study period are shown in Table 1 .
9
Figure 1 – 2015 CMP Network
10
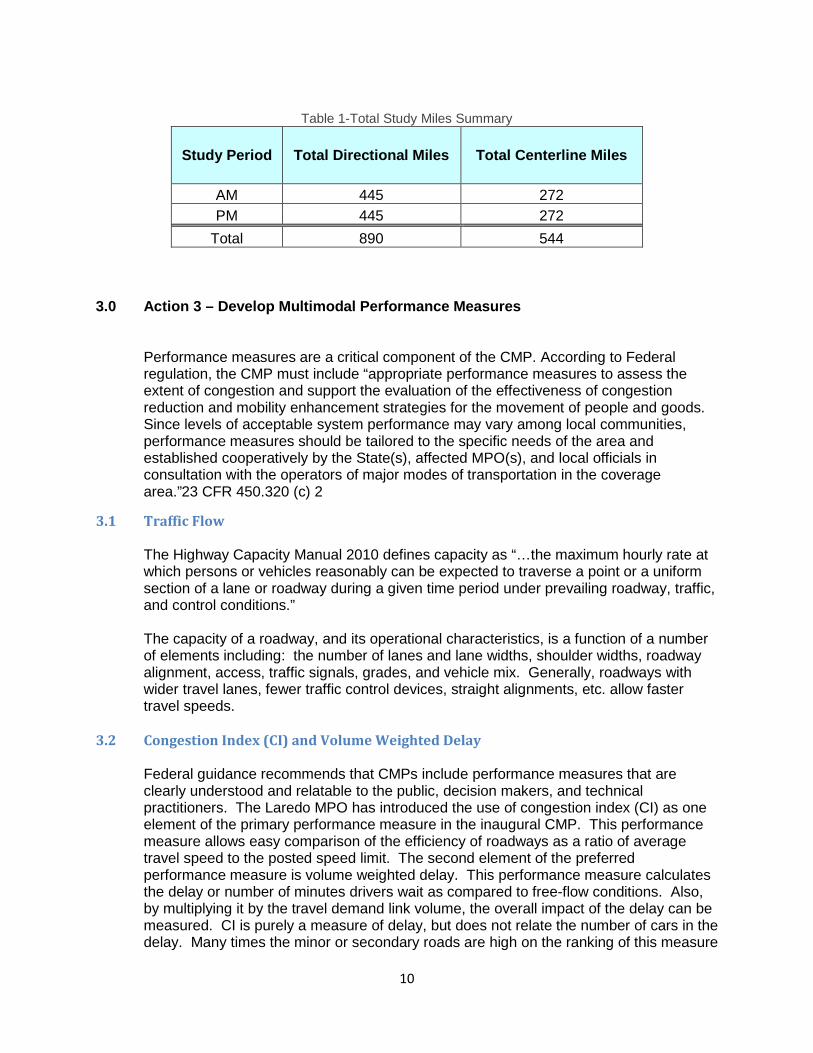
Table 1-Total Study Miles Summary
Study Period Total Directional Miles Total Centerline Miles
AM 445 272 PM 445 272
Total 890 544
3.0 Action 3 – Develop Multimodal Performance Measu res
Performance measures are a critical component of the CMP. According to Federal regulation, the CMP must include “appropriate performance measures to assess the extent of congestion and support the evaluation of the effectiveness of congestion reduction and mobility enhancement strategies for the movement of people and goods. Since levels of acceptable system performance may vary among local communities, performance measures should be tailored to the specific needs of the area and established cooperatively by the State(s), affected MPO(s), and local officials in consultation with the operators of major modes of transportation in the coverage area.”23 CFR 450.320 (c) 2
3.1 Traffic Flow
The Highway Capacity Manual 2010 defines capacity as “…the maximum hourly rate at which persons or vehicles reasonably can be expected to traverse a point or a uniform section of a lane or roadway during a given time period under prevailing roadway, traffic, and control conditions.” The capacity of a roadway, and its operational characteristics, is a function of a number of elements including: the number of lanes and lane widths, shoulder widths, roadway alignment, access, traffic signals, grades, and vehicle mix. Generally, roadways with wider travel lanes, fewer traffic control devices, straight alignments, etc. allow faster travel speeds.
3.2 Congestion Index (CI) and Volume Weighted Delay
Federal guidance recommends that CMPs include performance measures that are clearly understood and relatable to the public, decision makers, and technical practitioners. The Laredo MPO has introduced the use of congestion index (CI) as one element of the primary performance measure in the inaugural CMP. This performance measure allows easy comparison of the efficiency of roadways as a ratio of average travel speed to the posted speed limit. The second element of the preferred performance measure is volume weighted delay. This performance measure calculates the delay or number of minutes drivers wait as compared to free-flow conditions. Also, by multiplying it by the travel demand link volume, the overall impact of the delay can be measured. CI is purely a measure of delay, but does not relate the number of cars in the delay. Many times the minor or secondary roads are high on the ranking of this measure
11
while the volume weighted delay includes the volume, thus relating the overall magnitude of the delay is reported. By combining these two measures as follows, the ranking represents not only the regional significant higher volume roads, but also the lower volume local streets where high delays were observed. • CI = Actual Average Speed / Weighted Average Posted Speed Limit CI = Congestion Index Actual Average Speed = Average speed of all runs on a segment
Weighted Average Posted Speed Limit = Average of all posted speed limits on the segment weighted by length
• Volume Weighted Delay (VWD) = Delay * Segment Volume from Travel Demand
Model • Hybrid Performance Measure Rank = 60% of the VWD Ranking + 40% of the CI
Ranking Based on the local conditions in the Laredo region, attention was focused on the peak periods and intersection level delays. The duration of congestion and other performance measures were not as much of a concern with the short peaking of congestion within the region. This also is applicable in most areas of the region to performance measures based on volume. There are a few areas within the region where capacity is an issue, but most delay occurs at the node level and is not a link problem. Because volume is measured mid-block and does not consider the operations of the nodes (intersections), attention is being focused at the moment where the MPO can get the most benefit. The Laredo MPO’s primary performance measures, as selected by the Technical Committee, on the intersection segment level are Congestion Index (CI) and Volume Weighted Delay. The MPO technical committee evaluated thresholds to define what would be used as “unacceptable” congestion. In order to narrow the focus on those roadway segments that need attention and commonly have recurring delay, a combined performance measure was used and the highest 15% of the network was categorized as congested. Overtime, with future updates, the committee will be able to revisit these thresholds and adjust is desired. FHWA encourages the MPO to be flexible with the process and customize the methodology and performance measures to respond to the local and regional objectives. The MPO can also consider adding other performance measures in future updates that are multi-modal based that reflect the accessibility of transit, bike, and pedestrian facilities. This can be as direct on the regional level as the % of jobs or households within ¼ mile of transit. This will serve as an indicator of the accessibility to transit and should have some correlation to the ridership.
4.0 Action 4 – Collect Data / Monitor System Perfor mance
It is necessary for Laredo MPO to maintain an accurate, up to date regional transportation model in order to conform to State and Federal regulations for transportation planning. TxDOT maintains the regions model using current information
12
on the roadway network, area development, and other relevant characteristics. The MPO will collect data as necessary to support the CMP and planning process. For this 2015 study, the base conditions of the selected corridors were collected including: roadway characteristics, field-measured travel time, and travel speed data. The primary purpose of this year’s 2015 CMP is to establish the MPOs initial CMP base. Mapping of the roadway attributes and floating car travel time runs were conducted on major collectors, arterials and freeways. The breakdown of mileage by peak period is: • 272.0 centerline miles AM and PM peak periods The routes that were studied in 2013 are shown in Figure 1 . In future years, the MPO may consider analysis of a subset of the overall network based on the results of this year’s baseline analysis. That way, the MPO can maximize the detail collected on a smaller roadway set, while not collecting data just for the sake of treating the entire network the same. FHWA favors using professional judgment on defining the network with consideration given for a systematic data collection plan that may include cyclical analysis of certain roadways based on historic results or known changes since the last update. Through the integrate datasets assembled in GIS and the additional data assembled below, the data collected in this study has a variety of additional uses outside the CMP. Because the information is all housed in a GIS, queries can group data by area for use in individual planning processes. Within the GIS, the MPO will have access to the following datasets:
• CMP Routes • Speed Limits • School Zones • Intersection Control • Jurisdiction • Average Speed • Congestion Index (% posted speed) • Free Flow Travel Time • Peak Period Travel Time • Segment Delay • Travel Demand Segment Volume • Volume Weighted Delay
Study’s like a CMP are data intensive and typically require a large amount of resources and time to assemble. Other data sources may include El Metro on transit operations and ridership along with impacts of border crossing delays and incidents through the South Texas Regional Advanced Transportation Information System (STRATIS).
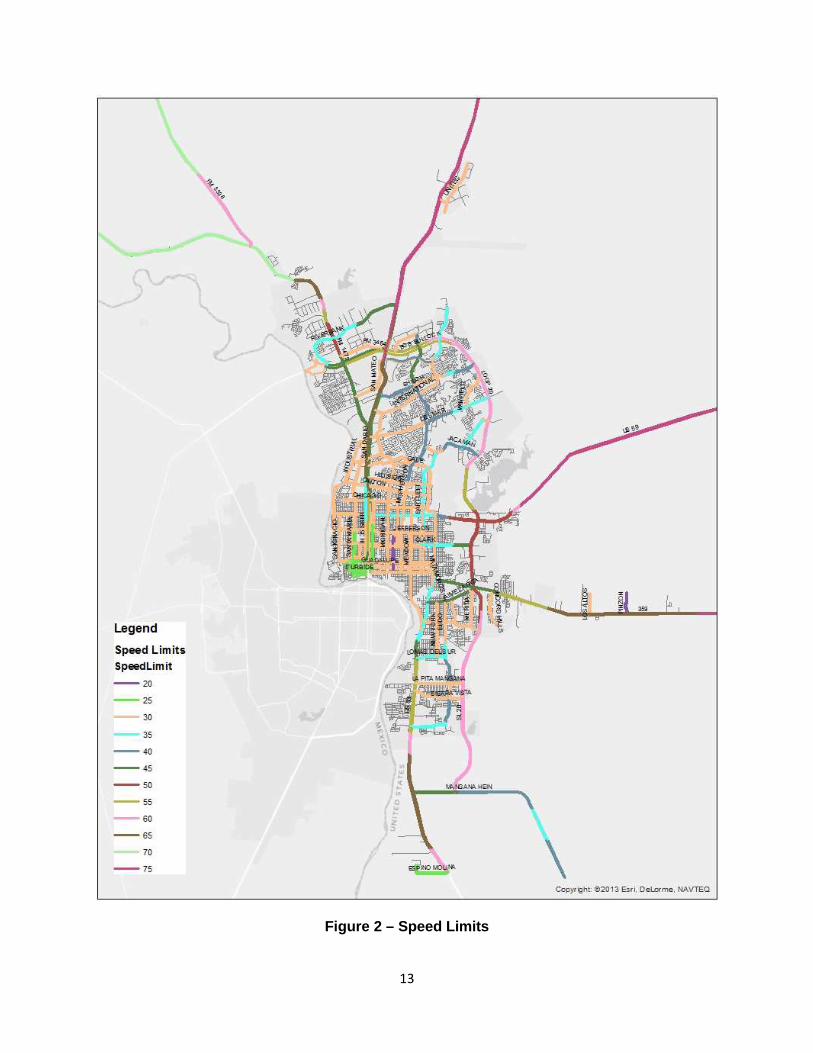
13
Figure 2 – Speed Limits

14
Figure 3 – School Zones
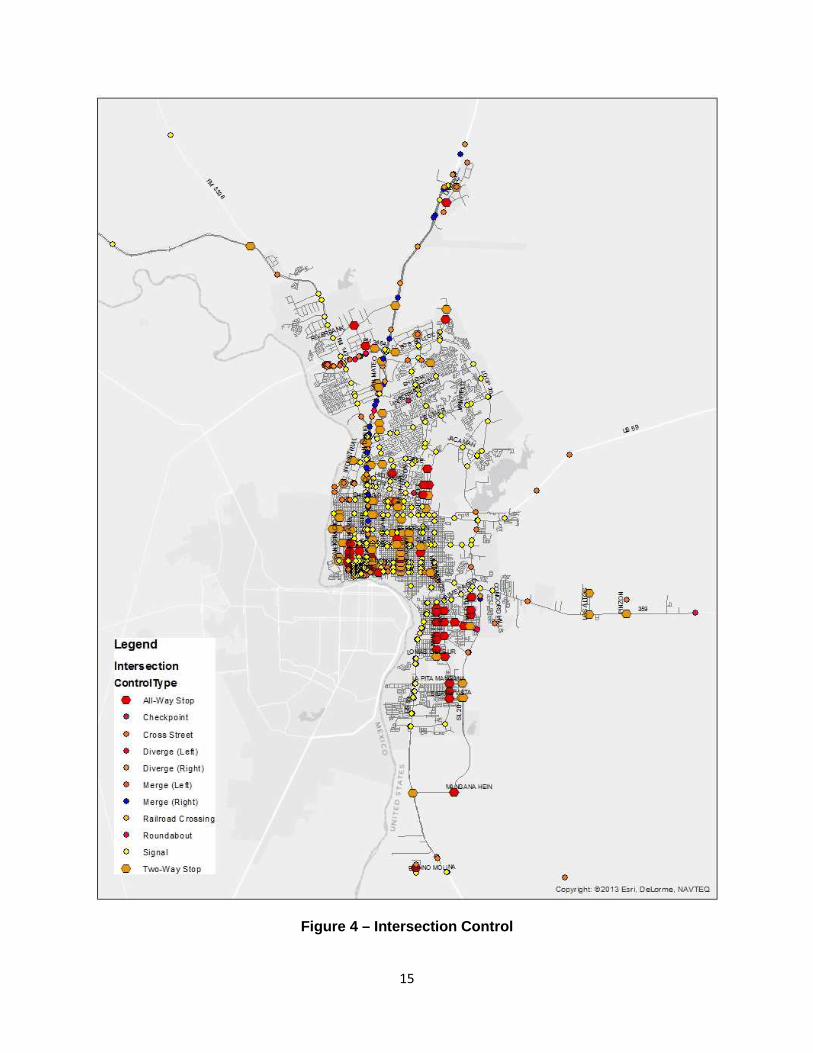
15
Figure 4 – Intersection Control
16
5.0 Action 5 – Analyze Congestion Problems and Needs
Given the data collected and dataset assembled, the primary performance measure for the CMP is a combination or “hybrid” of Congestion Index (CI) and Volume Weighted Delay. CI is the ratio of the actual average speed to the weighted average posted speed limit while Volume Weighted Delay accounts for the travel demand segment volume and the measured delay. According to the MPO thresholds developed by the technical committee, the top 15% of the hybrid performance measure were identified as being congested.
5.1 Roadway Segment Definition
Utilizing the roadway attributes, the CMP corridors were divided into segments with the endpoint or nodes being represented by controlled intersections or major cross-streets. In addition to these segments, they were further broken down into common unit lengths of approximately 0.1 mile to allow for direction comparisons between sub-segments. The roadway segment endpoints are defined at each traffic signal or stop sign. This allowed the segments to be evaluated on a detailed level and then combined, as appropriate, to make corridor recommendations. In addition, for the approximately 272.0 miles of roadways including 92 different roads, the network was further divided into 1154 directional links for detailed evaluation. These segments either had a traffic signal, stop sign, or a major cross street in rural areas with limited controlled intersections, as the end points. The methodology developed and applied specifically for this project resulted in a calculated CI for each 1-second GPS data point. The actual speed between successive points provides detailed results that can highlight the problem areas. This is in contrast to other performance measures that are primarily link based (Level of Service, V/C) and do not include assessment of the intersection delays. These other performance measures may categorize a segment as congested when actually the intersection created sufficient delay to pull the full segment down. A detailed intersection segment and 0.1 sub-segment level CI were used to develop the appropriate recommendations for the congested segments. In addition to the intersection segment CI analysis, one-tenth of a mile segmentation was included to better highlight local areas of delay. The approach is described in Section 6.1.
5.2 Data Reduction The method of recording roadway information and travel times using GPS results create large amounts of data that require manipulation into a useable format. City limits were added directly into the database using the most current boundary files in the MPO’s system. Each roadway was defined as a “route” in both directions and beginning and ending points were determined in order to calculate travel time for the segment. The GIS coordinate system provided by the MPO was modified to match the NAD 83 (feet) coordinate system used in the data collection.
17
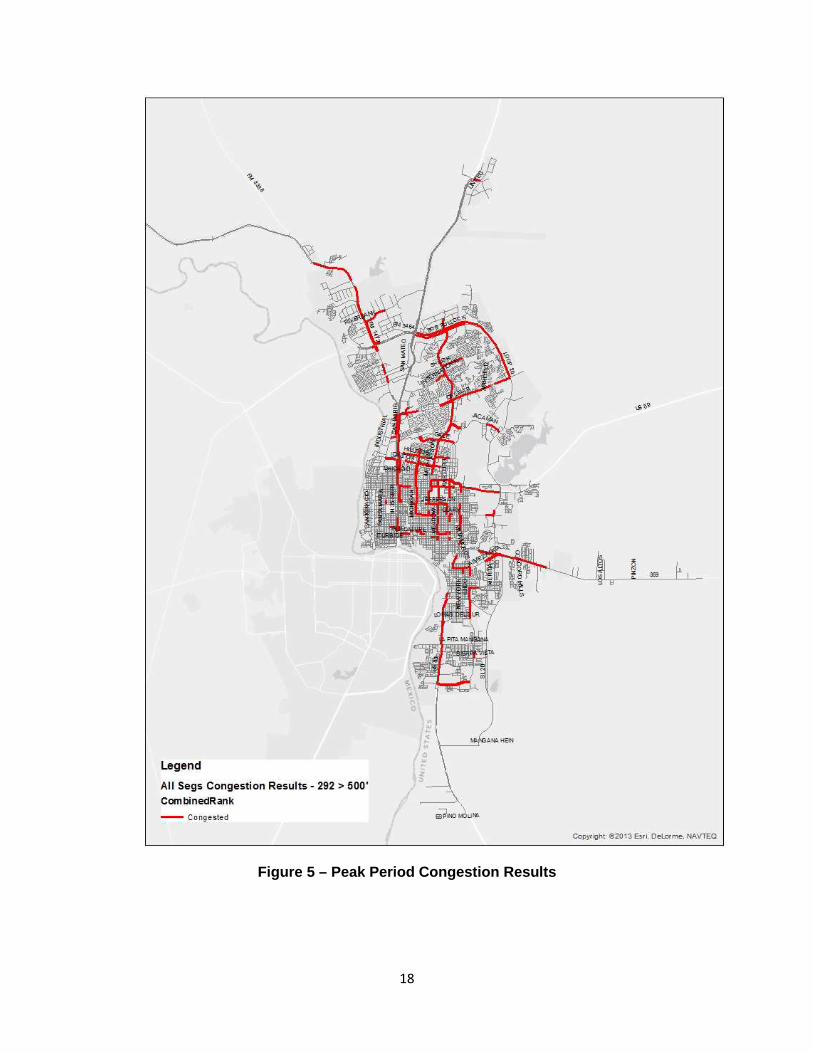
5.3 Data Formatting The travel time information and associated CI’s were formatted into tables, graphs, and in ArcGIS. ArcGIS is a geographic information system (GIS) software that allows the user a quick, easy-to-understand graphical reference. ArcGIS reads the study data files, stored in geo-databases, and presents the information graphically. ArcGIS allows the user to group and summarize data for specific purposes. The 1-second data points are color coded according to the criteria for congested conditions. These 1-second points can be used to determine at what point along a segment a traveler experiences delays or congestion. When congestion occurs during only one time period, the user can study the detailed information to determine the cause of the delay. This information includes the 1-second data points. Thus, improvements can be better focused to ensure the most appropriate use of funds. ArcGIS can be used to view the information provided in this study for reference and for future projects. Maps and figures can be made for presentations. Information such as speed limits along specific roadways, location and number of traffic signals, the location and number of stop signs, and the location and length of school zones can be summarized and viewed. The information can be summarized for the entire County or broken down and summarized by city, and can be used to identify future improvements. Figure 5 illustrates the Hybrid Performance Measure Congestion results for the CMP network. More detailed results can be seen within the tabular summaries included.
5.4 Multimodal Analysis
This year’s network also reflects the existence of the transit network. Specific details on the transit operations are not currently included in the analysis, but the MPO will need to continue building on the system created so the CMP can truly be multi-modal not only with transit but bike and pedestrian accessibility also. El Metro was an active participant in the CMP effort considering the impacts of delay on the transit operations and ridership in the region. The CMP can and should reflect various performance measures to evaluate the components of an integrated multimodal transportation system.
18
Figure 5 – Peak Period Congestion Results
19
6.0 Action 6 – Identify and Assess CMP Strategies
6.1 Congestion Results
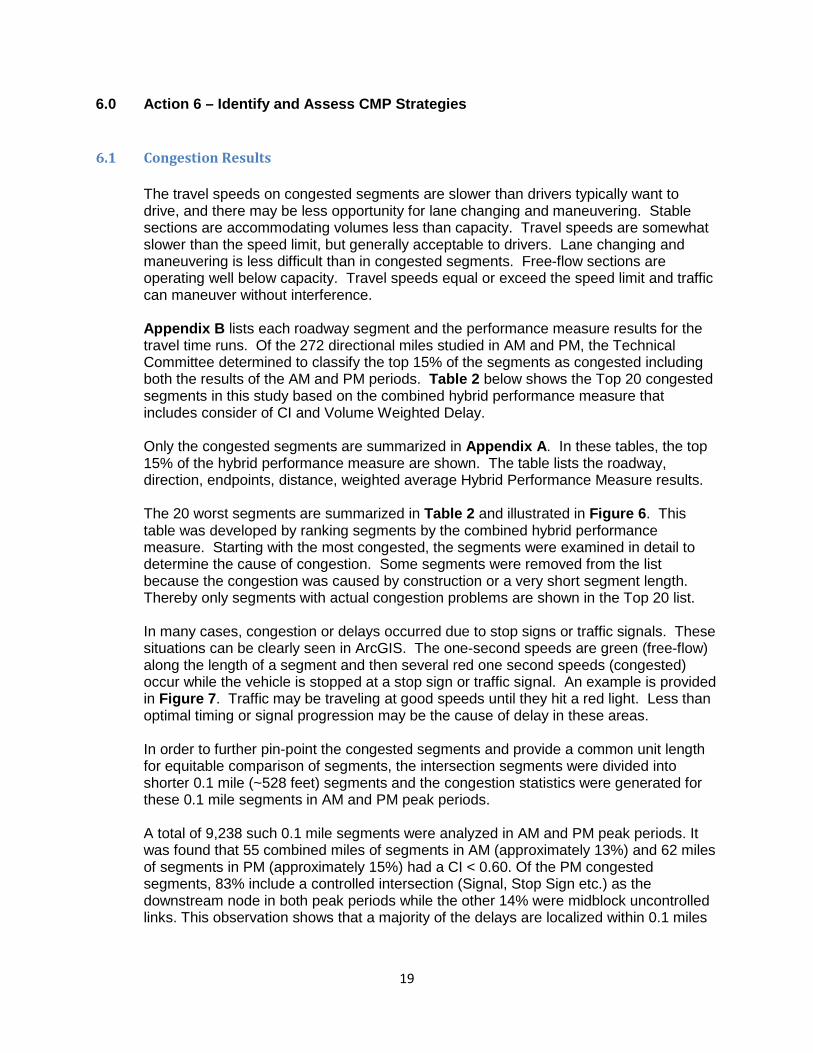
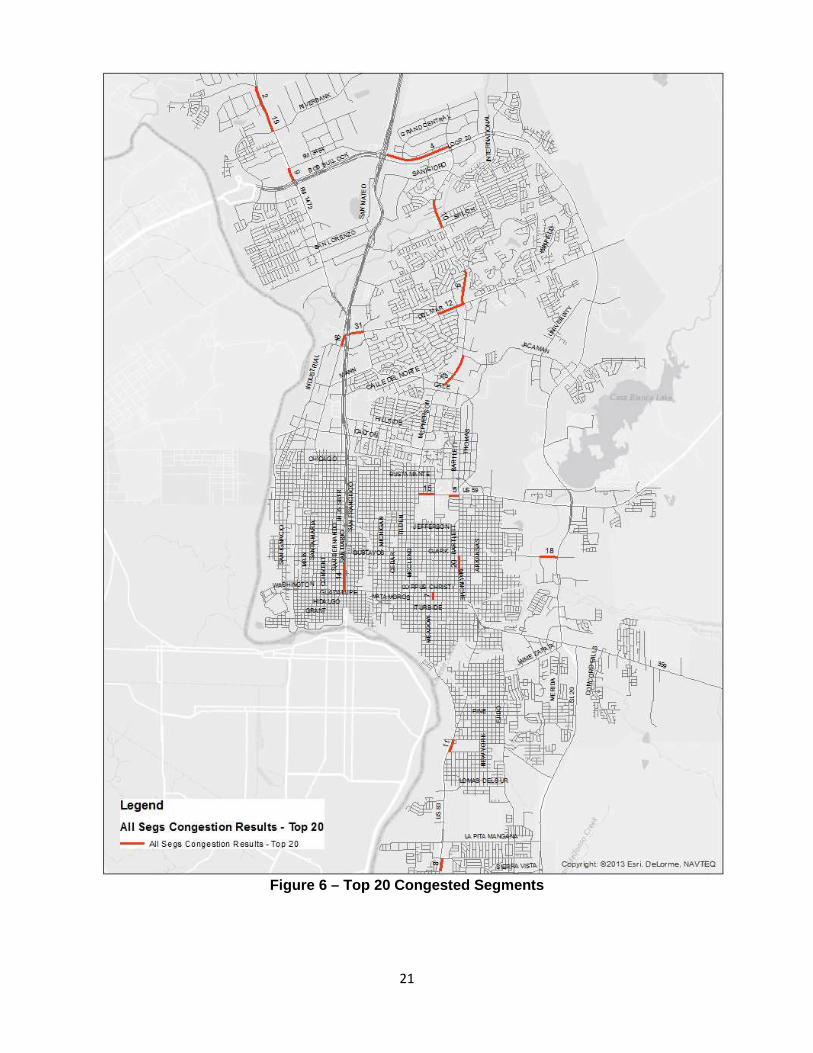
The travel speeds on congested segments are slower than drivers typically want to drive, and there may be less opportunity for lane changing and maneuvering. Stable sections are accommodating volumes less than capacity. Travel speeds are somewhat slower than the speed limit, but generally acceptable to drivers. Lane changing and maneuvering is less difficult than in congested segments. Free-flow sections are operating well below capacity. Travel speeds equal or exceed the speed limit and traffic can maneuver without interference. Appendix B lists each roadway segment and the performance measure results for the travel time runs. Of the 272 directional miles studied in AM and PM, the Technical Committee determined to classify the top 15% of the segments as congested including both the results of the AM and PM periods. Table 2 below shows the Top 20 congested segments in this study based on the combined hybrid performance measure that includes consider of CI and Volume Weighted Delay. Only the congested segments are summarized in Appendix A . In these tables, the top 15% of the hybrid performance measure are shown. The table lists the roadway, direction, endpoints, distance, weighted average Hybrid Performance Measure results. The 20 worst segments are summarized in Table 2 and illustrated in Figure 6 . This table was developed by ranking segments by the combined hybrid performance measure. Starting with the most congested, the segments were examined in detail to determine the cause of congestion. Some segments were removed from the list because the congestion was caused by construction or a very short segment length. Thereby only segments with actual congestion problems are shown in the Top 20 list. In many cases, congestion or delays occurred due to stop signs or traffic signals. These situations can be clearly seen in ArcGIS. The one-second speeds are green (free-flow) along the length of a segment and then several red one second speeds (congested) occur while the vehicle is stopped at a stop sign or traffic signal. An example is provided in Figure 7 . Traffic may be traveling at good speeds until they hit a red light. Less than optimal timing or signal progression may be the cause of delay in these areas. In order to further pin-point the congested segments and provide a common unit length for equitable comparison of segments, the intersection segments were divided into shorter 0.1 mile (~528 feet) segments and the congestion statistics were generated for these 0.1 mile segments in AM and PM peak periods. A total of 9,238 such 0.1 mile segments were analyzed in AM and PM peak periods. It was found that 55 combined miles of segments in AM (approximately 13%) and 62 miles of segments in PM (approximately 15%) had a CI < 0.60. Of the PM congested segments, 83% include a controlled intersection (Signal, Stop Sign etc.) as the downstream node in both peak periods while the other 14% were midblock uncontrolled links. This observation shows that a majority of the delays are localized within 0.1 miles

20
of a controlled intersections and do not occur mid-block. These delays can be reduced by either signal timing improvements or intersection geometric changes.
Table 2 – Top 20 Congested Segments
Hybrid
Combined
Rank RouteID Route Name Intersection Segment
Peak
Period
Average
Speed
(mph)
Wt Avg
Speed Limit
(mph) CI
Average
Seg Delay
(sec)
Length
(ft)
Volume
(Direct
ADT)
1 1164 DEL MAR - WB SPRINGFIELD to SAN DARIO PM 3.98 30.00 0.13 150 1,241 11,624
2 1090 FM 1472 - SEMULLER MEMORIAL to
INTERAMERICAPM 7.79 53.49 0.15 112 1,527 14,579
3 1164 DEL MAR - WB SPRINGFIELD to SAN DARIO AM 5.88 30.00 0.20 124 1,241 11,624
4 1085BOB BULLOCK / CUATRO
VIENTOS - NBMCPHERSON to IH 35 NBFR PM 11.76 55.00 0.21 259 5,507 7,137
5 1111 US 59 - EB BUENA VISTA to BARTLETT PM 6.45 35.00 0.18 75 829 13,381
6 1180MCPHERSON /
MCCLELLAND - SBCOUNTRY CLUB to DEL MAR PM 9.18 40.00 0.23 161 2,852 16,477
7 1170 MEADOW - SB CORPUS CHRISTI to GUADALUPE AM 3.56 30.00 0.12 127 667 6,354
8 1115 US HIGHWAY 83 NB - NB CANONES to SIERRA VISTA PM 11.16 55.00 0.20 53 1,076 16,162
9 1090 FM 1472 - SE FM 3464 to BOB BULLOCK WBFR PM 10.88 45.00 0.24 60 1,113 20,539
10 1180MCPHERSON /
MCCLELLAND - SBTIERA TRAIL to SHILOH PM 13.18 44.15 0.30 89 2,408 19,043
11 1115 US HIGHWAY 83 NB - NB PALO BLANCO to ZACATECAS AM 10.34 35.00 0.30 53 1,084 23,277
12 1164 DEL MAR - WB MCPHERSON to LINDENWOOD AM 8.16 30.00 0.27 143 2,363 6,018
13 1179MCPHERSON /
MCCLELLAND - NBCALLE DE NORTE to JACAMAN PM 12.97 40.00 0.32 166 2,958 20,207
14 1084 IH 35 - SB Scott Off-Ramp to VICTORIA PM 13.76 42.58 0.32 144 2,578 14,393
15 1112 US 59 - WB MEADOW to MCPHERSON PM 10.24 35.00 0.29 62 1,326 17,382
16 1113SANTA MARIA / OLD
SANTA MARIA - NBINDUSTRIAL to DEL MAR PM 7.58 30.00 0.25 102 975 8,121
17 1170 MEADOW - SB CORPUS CHRISTI to GUADALUPE PM 4.62 30.00 0.15 94 667 6,354
18 1011 CLARK - EB AGUILA AZTECA to BOB BULLOCK AM 10.29 45.00 0.23 87 1,454 8,764
19 1090 FM 1472 - SE INTERAMERICA to RIVER BANK PM 15.83 50.00 0.32 71 2,463 15,420
20 1155 BARTLETT - NB LANE to CLARK PM 7.22 30.00 0.24 100 1,366 7,651
21
Figure 6 – Top 20 Congested Segments
22
Figure 7 – Travel Time Run Example
23
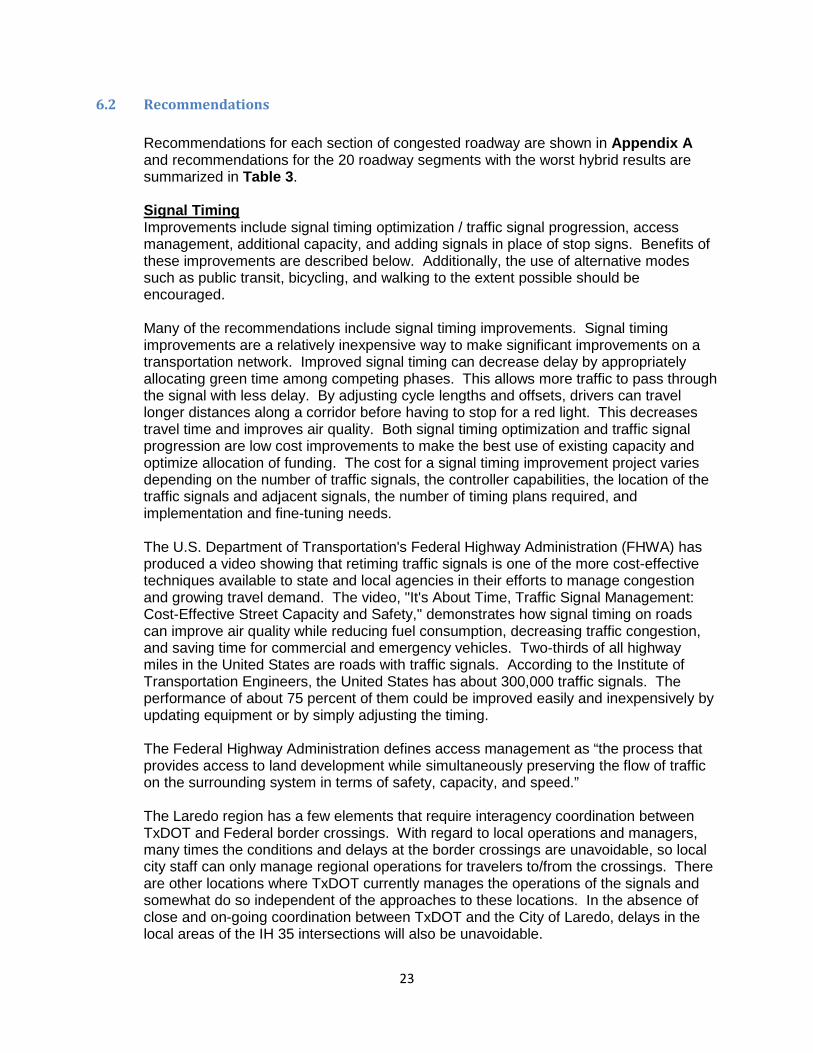
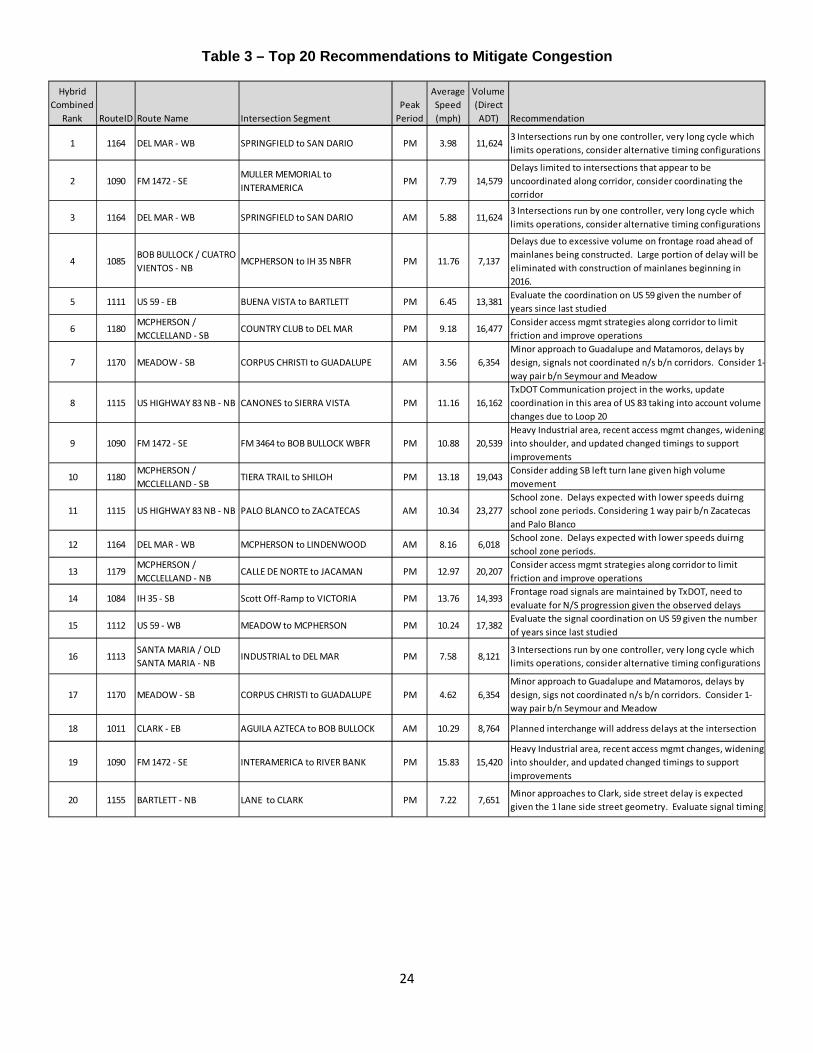
6.2 Recommendations
Recommendations for each section of congested roadway are shown in Appendix A and recommendations for the 20 roadway segments with the worst hybrid results are summarized in Table 3 . Signal Timing Improvements include signal timing optimization / traffic signal progression, access management, additional capacity, and adding signals in place of stop signs. Benefits of these improvements are described below. Additionally, the use of alternative modes such as public transit, bicycling, and walking to the extent possible should be encouraged. Many of the recommendations include signal timing improvements. Signal timing improvements are a relatively inexpensive way to make significant improvements on a transportation network. Improved signal timing can decrease delay by appropriately allocating green time among competing phases. This allows more traffic to pass through the signal with less delay. By adjusting cycle lengths and offsets, drivers can travel longer distances along a corridor before having to stop for a red light. This decreases travel time and improves air quality. Both signal timing optimization and traffic signal progression are low cost improvements to make the best use of existing capacity and optimize allocation of funding. The cost for a signal timing improvement project varies depending on the number of traffic signals, the controller capabilities, the location of the traffic signals and adjacent signals, the number of timing plans required, and implementation and fine-tuning needs. The U.S. Department of Transportation's Federal Highway Administration (FHWA) has produced a video showing that retiming traffic signals is one of the more cost-effective techniques available to state and local agencies in their efforts to manage congestion and growing travel demand. The video, "It's About Time, Traffic Signal Management: Cost-Effective Street Capacity and Safety," demonstrates how signal timing on roads can improve air quality while reducing fuel consumption, decreasing traffic congestion, and saving time for commercial and emergency vehicles. Two-thirds of all highway miles in the United States are roads with traffic signals. According to the Institute of Transportation Engineers, the United States has about 300,000 traffic signals. The performance of about 75 percent of them could be improved easily and inexpensively by updating equipment or by simply adjusting the timing.
The Federal Highway Administration defines access management as “the process that provides access to land development while simultaneously preserving the flow of traffic on the surrounding system in terms of safety, capacity, and speed.” The Laredo region has a few elements that require interagency coordination between TxDOT and Federal border crossings. With regard to local operations and managers, many times the conditions and delays at the border crossings are unavoidable, so local city staff can only manage regional operations for travelers to/from the crossings. There are other locations where TxDOT currently manages the operations of the signals and somewhat do so independent of the approaches to these locations. In the absence of close and on-going coordination between TxDOT and the City of Laredo, delays in the local areas of the IH 35 intersections will also be unavoidable.
24
Table 3 – Top 20 Recommendations to Mitigate Conges tion
Hybrid
Combined
Rank RouteID Route Name Intersection Segment
Peak
Period
Average
Speed
(mph)
Volume
(Direct
ADT) Recommendation
1 1164 DEL MAR - WB SPRINGFIELD to SAN DARIO PM 3.98 11,6243 Intersections run by one controller, very long cycle which
limits operations, consider alternative timing configurations
2 1090 FM 1472 - SEMULLER MEMORIAL to
INTERAMERICAPM 7.79 14,579
Delays limited to intersections that appear to be
uncoordinated along corridor, consider coordinating the
corridor
3 1164 DEL MAR - WB SPRINGFIELD to SAN DARIO AM 5.88 11,6243 Intersections run by one controller, very long cycle which
limits operations, consider alternative timing configurations
4 1085BOB BULLOCK / CUATRO
VIENTOS - NBMCPHERSON to IH 35 NBFR PM 11.76 7,137
Delays due to excessive volume on frontage road ahead of
mainlanes being constructed. Large portion of delay will be
eliminated with construction of mainlanes beginning in
2016.
5 1111 US 59 - EB BUENA VISTA to BARTLETT PM 6.45 13,381Evaluate the coordination on US 59 given the number of
years since last studied
6 1180MCPHERSON /
MCCLELLAND - SBCOUNTRY CLUB to DEL MAR PM 9.18 16,477
Consider access mgmt strategies along corridor to limit
friction and improve operations
7 1170 MEADOW - SB CORPUS CHRISTI to GUADALUPE AM 3.56 6,354
Minor approach to Guadalupe and Matamoros, delays by
design, signals not coordinated n/s b/n corridors. Consider 1-
way pair b/n Seymour and Meadow
8 1115 US HIGHWAY 83 NB - NB CANONES to SIERRA VISTA PM 11.16 16,162
TxDOT Communication project in the works, update
coordination in this area of US 83 taking into account volume
changes due to Loop 20
9 1090 FM 1472 - SE FM 3464 to BOB BULLOCK WBFR PM 10.88 20,539
Heavy Industrial area, recent access mgmt changes, widening
into shoulder, and updated changed timings to support
improvements
10 1180MCPHERSON /
MCCLELLAND - SBTIERA TRAIL to SHILOH PM 13.18 19,043
Consider adding SB left turn lane given high volume
movement
11 1115 US HIGHWAY 83 NB - NB PALO BLANCO to ZACATECAS AM 10.34 23,277
School zone. Delays expected with lower speeds duirng
school zone periods. Considering 1 way pair b/n Zacatecas
and Palo Blanco
12 1164 DEL MAR - WB MCPHERSON to LINDENWOOD AM 8.16 6,018School zone. Delays expected with lower speeds duirng
school zone periods.
13 1179MCPHERSON /
MCCLELLAND - NBCALLE DE NORTE to JACAMAN PM 12.97 20,207
Consider access mgmt strategies along corridor to limit
friction and improve operations
14 1084 IH 35 - SB Scott Off-Ramp to VICTORIA PM 13.76 14,393Frontage road signals are maintained by TxDOT, need to
evaluate for N/S progression given the observed delays
15 1112 US 59 - WB MEADOW to MCPHERSON PM 10.24 17,382Evaluate the signal coordination on US 59 given the number
of years since last studied
16 1113SANTA MARIA / OLD
SANTA MARIA - NBINDUSTRIAL to DEL MAR PM 7.58 8,121
3 Intersections run by one controller, very long cycle which
limits operations, consider alternative timing configurations
17 1170 MEADOW - SB CORPUS CHRISTI to GUADALUPE PM 4.62 6,354
Minor approach to Guadalupe and Matamoros, delays by
design, sigs not coordinated n/s b/n corridors. Consider 1-
way pair b/n Seymour and Meadow
18 1011 CLARK - EB AGUILA AZTECA to BOB BULLOCK AM 10.29 8,764 Planned interchange will address delays at the intersection
19 1090 FM 1472 - SE INTERAMERICA to RIVER BANK PM 15.83 15,420
Heavy Industrial area, recent access mgmt changes, widening
into shoulder, and updated changed timings to support
improvements
20 1155 BARTLETT - NB LANE to CLARK PM 7.22 7,651Minor approaches to Clark, side street delay is expected
given the 1 lane side street geometry. Evaluate signal timing
25
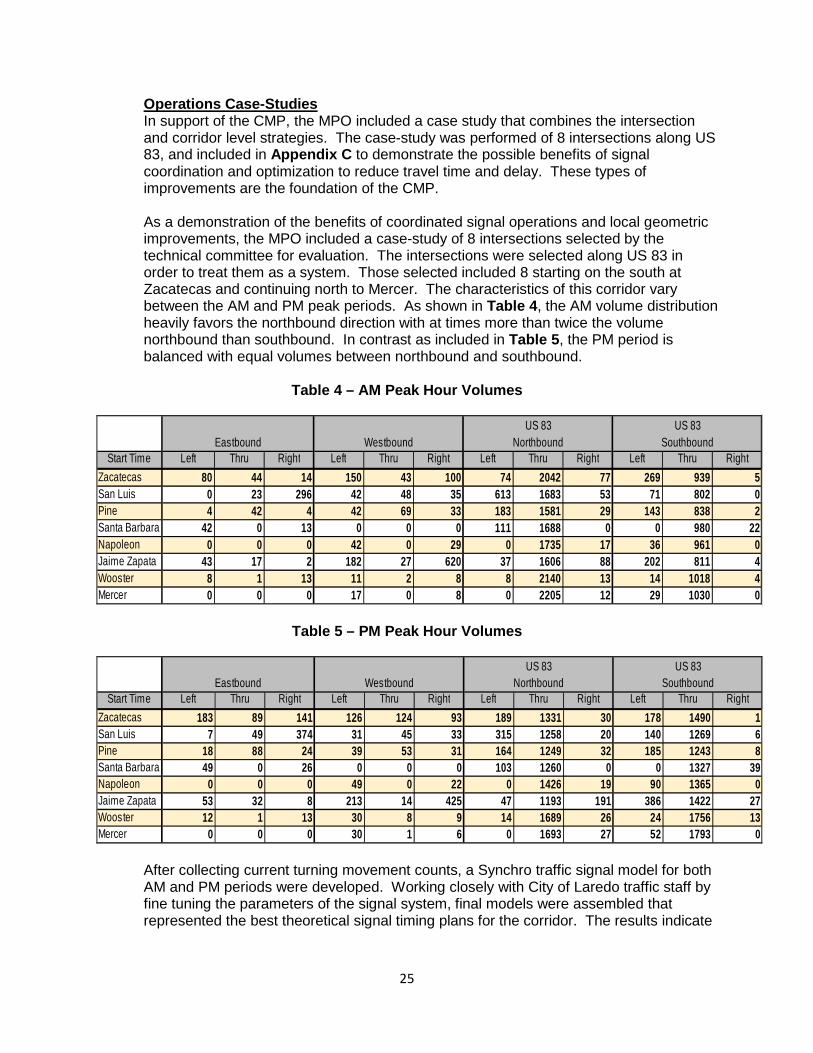
Operations Case-Studies In support of the CMP, the MPO included a case study that combines the intersection and corridor level strategies. The case-study was performed of 8 intersections along US 83, and included in Appendix C to demonstrate the possible benefits of signal coordination and optimization to reduce travel time and delay. These types of improvements are the foundation of the CMP. As a demonstration of the benefits of coordinated signal operations and local geometric improvements, the MPO included a case-study of 8 intersections selected by the technical committee for evaluation. The intersections were selected along US 83 in order to treat them as a system. Those selected included 8 starting on the south at Zacatecas and continuing north to Mercer. The characteristics of this corridor vary between the AM and PM peak periods. As shown in Table 4 , the AM volume distribution heavily favors the northbound direction with at times more than twice the volume northbound than southbound. In contrast as included in Table 5 , the PM period is balanced with equal volumes between northbound and southbound.
Table 4 – AM Peak Hour Volumes
Table 5 – PM Peak Hour Volumes
After collecting current turning movement counts, a Synchro traffic signal model for both AM and PM periods were developed. Working closely with City of Laredo traffic staff by fine tuning the parameters of the signal system, final models were assembled that represented the best theoretical signal timing plans for the corridor. The results indicate
Start Time Left Thru Right Left Thru Right Left Thru Right Left Thru Right
Zacatecas 80 44 14 150 43 100 74 2042 77 269 939 5San Luis 0 23 296 42 48 35 613 1683 53 71 802 0Pine 4 42 4 42 69 33 183 1581 29 143 838 2Santa Barbara 42 0 13 0 0 0 111 1688 0 0 980 22Napoleon 0 0 0 42 0 29 0 1735 17 36 961 0Jaime Zapata 43 17 2 182 27 620 37 1606 88 202 811 4Wooster 8 1 13 11 2 8 8 2140 13 14 1018 4Mercer 0 0 0 17 0 8 0 2205 12 29 1030 0
Eastbound WestboundUS 83
NorthboundUS 83
Southbound
Start Time Left Thru Right Left Thru Right Left Thru Right Left Thru Right
Zacatecas 183 89 141 126 124 93 189 1331 30 178 1490 1San Luis 7 49 374 31 45 33 315 1258 20 140 1269 6Pine 18 88 24 39 53 31 164 1249 32 185 1243 8Santa Barbara 49 0 26 0 0 0 103 1260 0 0 1327 39Napoleon 0 0 0 49 0 22 0 1426 19 90 1365 0Jaime Zapata 53 32 8 213 14 425 47 1193 191 386 1422 27Wooster 12 1 13 30 8 9 14 1689 26 24 1756 13Mercer 0 0 0 30 1 6 0 1693 27 52 1793 0
Eastbound WestboundUS 83
NorthboundUS 83
Southbound
26
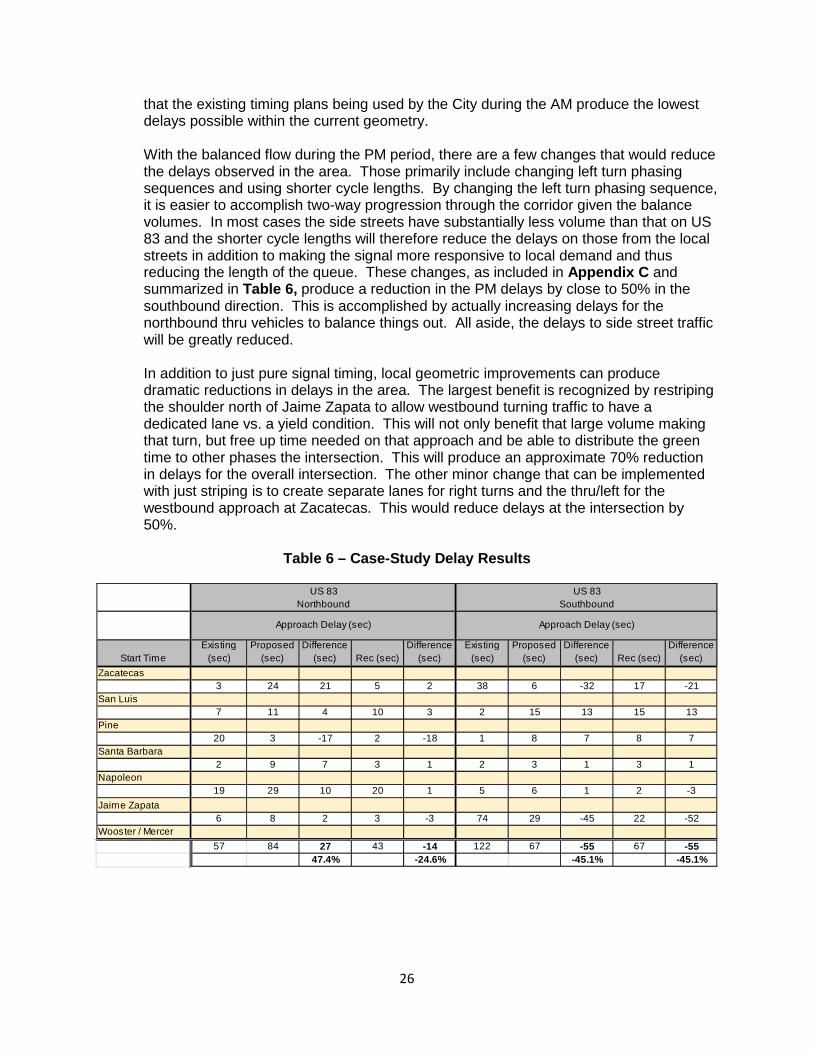
that the existing timing plans being used by the City during the AM produce the lowest delays possible within the current geometry. With the balanced flow during the PM period, there are a few changes that would reduce the delays observed in the area. Those primarily include changing left turn phasing sequences and using shorter cycle lengths. By changing the left turn phasing sequence, it is easier to accomplish two-way progression through the corridor given the balance volumes. In most cases the side streets have substantially less volume than that on US 83 and the shorter cycle lengths will therefore reduce the delays on those from the local streets in addition to making the signal more responsive to local demand and thus reducing the length of the queue. These changes, as included in Appendix C and summarized in Table 6, produce a reduction in the PM delays by close to 50% in the southbound direction. This is accomplished by actually increasing delays for the northbound thru vehicles to balance things out. All aside, the delays to side street traffic will be greatly reduced. In addition to just pure signal timing, local geometric improvements can produce dramatic reductions in delays in the area. The largest benefit is recognized by restriping the shoulder north of Jaime Zapata to allow westbound turning traffic to have a dedicated lane vs. a yield condition. This will not only benefit that large volume making that turn, but free up time needed on that approach and be able to distribute the green time to other phases the intersection. This will produce an approximate 70% reduction in delays for the overall intersection. The other minor change that can be implemented with just striping is to create separate lanes for right turns and the thru/left for the westbound approach at Zacatecas. This would reduce delays at the intersection by 50%.
Table 6 – Case-Study Delay Results
Start TimeExisting
(sec)Proposed
(sec)Difference
(sec) Rec (sec)Difference
(sec)Existing
(sec)Proposed
(sec)Difference
(sec) Rec (sec)Difference
(sec)
Zacatecas3 24 21 5 2 38 6 -32 17 -21
San Luis7 11 4 10 3 2 15 13 15 13
Pine20 3 -17 2 -18 1 8 7 8 7
Santa Barbara2 9 7 3 1 2 3 1 3 1
Napoleon19 29 10 20 1 5 6 1 2 -3
Jaime Zapata6 8 2 3 -3 74 29 -45 22 -52
Wooster / Mercer
57 84 27 43 -14 122 67 -55 67 -5547.4% -24.6% -45.1% -45.1%
US 83Northbound
US 83Southbound
Approach Delay (sec) Approach Delay (sec)
27
Access Management Access management is accomplished in a variety of ways such as managing the design of access points, the location of access points, the number of access points allowed within a given distance (access density), and the roadway median treatment. Generally, the number of access points is minimized and regularly spaced from each other so that conflict points are separated.
Access management can provide a number of benefits to the public agency and to the traveling public. Capacity is preserved and safety (motorized and non-motorized) is improved by minimizing conflict points and minimizing speed differentials between through traffic and slow moving turning traffic. Safety for turning movements is also improved by providing adequate turning (auxiliary) lanes or by prohibiting turns in key locations using a raised median. In addition to safety and efficiency improvements, access management also provides environmental and financial benefits with reduced vehicle emissions and improved fuel economy by maintaining the flow of traffic. On new roadways, or on undeveloped corridors, access management can be used to minimize operational traffic problems, due to unmanaged development, before they occur. In these cases, it is inexpensive and fairly easy to accomplish. The traveling public benefits from a safe and efficient corridor. Property owners benefit from safe access. The agency benefits from a low cost management plan from the onset rather than costly highway improvement projects once problems occur. Once corridors are developed, it is more difficult, expensive, and time consuming to retrofit managed access. Whenever possible, access management should be given high priority on undeveloped corridors. Access management can be very challenging on existing ‘built-up’ urban roadways. Common issues include limited right-of-way and opposition by land owners. Still, retrofitting a corridor with access management can provide benefits. Possible retrofitting improvements include: consolidating and closing driveways, constructing raised medians, constructing auxiliary lanes, providing regularly spaced traffic signals to encourage use of a major cross-street or driveway, and providing alternative routes such as internal access roads. Added Capacity Roadway widening is necessary where traffic signal timing and access management are unable to provide enough capacity for heavy traffic volumes. Some segments may improve in the short term with optimized signal timing, but may ultimately warrant additional capacity through widening. Widening could include adding a through lane for a long section of road, or providing turn lanes at intersections. Adding capacity through roadway widening is generally expensive. Stop Signs / New Signals Adding signals may be an improvement at four-way stop intersections or intersections with heavy major-street and cross-street traffic. This reduces delay for previously stop-controlled movements but may increase delay for movements that were not controlled. As traffic volumes increase, traffic signals or other types of intersection design such as roundabouts or continuous flow intersections should be considered to efficiently move traffic.
28
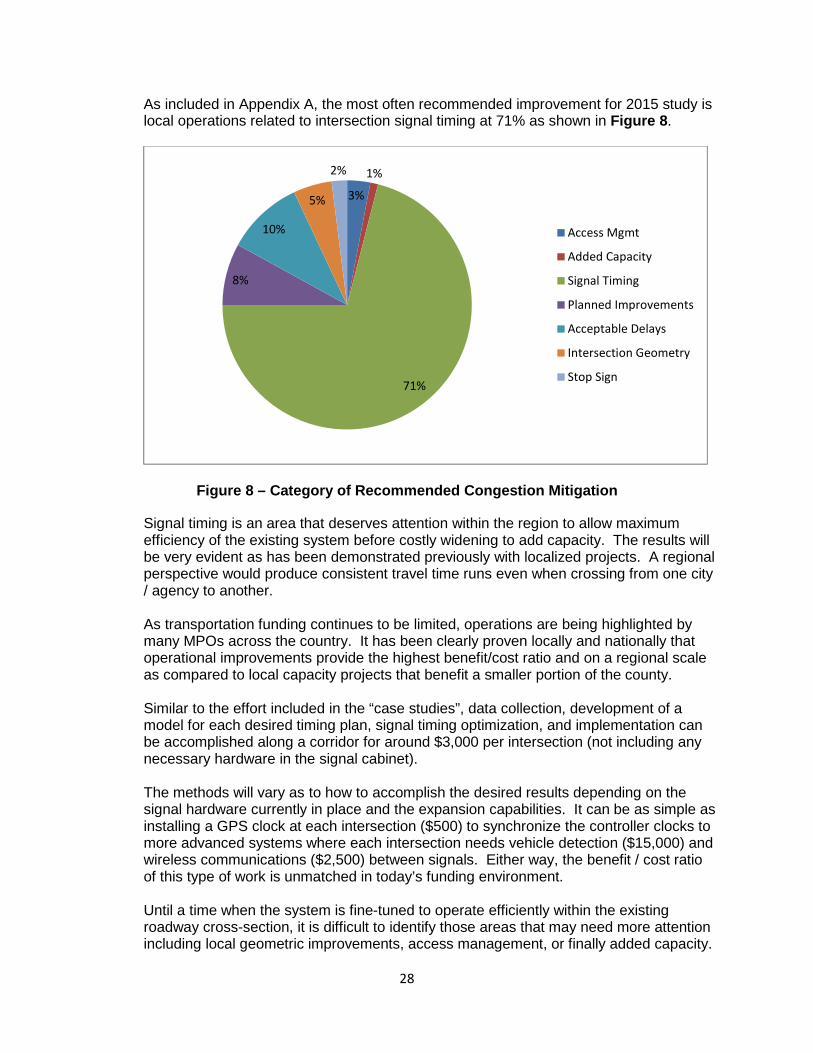
As included in Appendix A, the most often recommended improvement for 2015 study is local operations related to intersection signal timing at 71% as shown in Figure 8 .
Figure 8 – Category of Recommended Congestion Mitig ation
Signal timing is an area that deserves attention within the region to allow maximum efficiency of the existing system before costly widening to add capacity. The results will be very evident as has been demonstrated previously with localized projects. A regional perspective would produce consistent travel time runs even when crossing from one city / agency to another. As transportation funding continues to be limited, operations are being highlighted by many MPOs across the country. It has been clearly proven locally and nationally that operational improvements provide the highest benefit/cost ratio and on a regional scale as compared to local capacity projects that benefit a smaller portion of the county. Similar to the effort included in the “case studies”, data collection, development of a model for each desired timing plan, signal timing optimization, and implementation can be accomplished along a corridor for around $3,000 per intersection (not including any necessary hardware in the signal cabinet). The methods will vary as to how to accomplish the desired results depending on the signal hardware currently in place and the expansion capabilities. It can be as simple as installing a GPS clock at each intersection ($500) to synchronize the controller clocks to more advanced systems where each intersection needs vehicle detection ($15,000) and wireless communications ($2,500) between signals. Either way, the benefit / cost ratio of this type of work is unmatched in today’s funding environment. Until a time when the system is fine-tuned to operate efficiently within the existing roadway cross-section, it is difficult to identify those areas that may need more attention including local geometric improvements, access management, or finally added capacity.
3%
1%
71%
8%
10%
5%
2%
Access Mgmt
Added Capacity
Signal Timing
Planned Improvements
Acceptable Delays
Intersection Geometry
Stop Sign
29
7.0 Action 7 – Program and Implement CMP Strategies A fully integrated CMP not only evaluates the current congestion conditions and recommends mitigation, but prioritizes the improvements and incorporates into the planning process. Those improvements can be viewed as local improvements, corridor strategies, or regional programs / initiatives. Regions are expected to manage their system to get as much capacity out of the existing system prior to capital projects to widen the roadways. Ideally, every effort should be exhausted and documented before getting to the end of the line and adding capacity. This study serves as the initial element of the CMP and should not be viewed as a complete CMP. The CMP is a living process that is part of the planning process. This initial study is documenting the current conditions, ranking the magnitude of observed congestion, recommending possible mitigation, and prioritizing those improvements. The MPO will apply these findings and integrate them into the planning process. One option that many MPOs have used is in the form of “set aside” funding category for localized bottleneck and operational projects. These projects are “quick fixes” and do not need the sometime lengthy process required for capital projects. Also, the prioritization of operational projects compared to the larger capital projects at times is tough to compare. By having a separate category for operational projects makes the time to market much shorter and the community can benefit much sooner.
8.0 Action 8 – Evaluate Strategy Effectiveness
This 2015 Congestion and Delay Study is the first effort toward development of a full CMP. Therefore, the MPO is not able to evaluate the benefits of implemented strategy this time around. However, in the future the Laredo MPO’s CMP will go full circle to identify the conditions, recommend mitigation, prioritize the improvements, plan the schedule and funding, and then evaluate the benefits.
CONCLUSION The Congestion Management Process (CMP) plays an essential role within the transportation planning and programming process by providing decision-makers at MPOs, local governments, and state agencies a clear analytical understanding of congestion in the region. The CMP must be an integral element in well-organized, objectives-driven, performance-based planning approach. The flexibility of the regulations and guidelines has allowed the MPO to customize the CMP in various ways to both reflect regional needs and priorities. MPOs around the country have developed unique methods of implementing the CMP. The MPO looks forward to continue working with the members of the committee to build on the momentum begun through the development of this component of the overall CMP by using the performance measures identified here within, by aligning the CMP closely with the MTP and TIP, and using the CMP performance measures to directly influence project prioritization and funding.

30
Overall, the current transportation system provides sufficient capacity for the current demand. However, the CMP determined that increased focus be placed on operations to maximize the benefits of these investments and minimizing the overall delays along the corridors and side streets. Attention to operations may be accomplished through the integration of coordinated signal timing plans which provide consistent results to the commuting public during the peak periods.

Appendix A
2013 Congested Segments and Mitigation

Appendix B
2013 Intersection Segment Results

Appendix C
2015 US 83 Case Study