congruence of higher education: determinants and no. 16-04
TRANSCRIPT

No. 16-04
2016
Congruence of higher education: determinants and
effects of the allocation process in the labor mar-
ket, applied case to Colombia
Estrada, Juan José; Ospina-Londoño, Mónica
Congruence of higher education: determinants and effects of the allocation process in the labor
market, applied case to Colombia
Juan José Estrada1 & Mónica Ospina-Londoño
2
________________________________________________________________________________
Abstract
This paper provides new evidences to the literature of assignment in the labor market for the
Colombian case. Specifically it focuses on the existing relationship between acquired human capital
in higher education and its congruence in the labor market. Differing from previews studies, the
misallocation analysis is not only based on the horizontal component and the educational mismatch,
but it also includes the vertical mechanism (vertical mechanism is related to skills mismatch and
horizontal mechanism is related to professional career mismatch). Another contribution is how we
measure the abilities through an exploratory factor analysis. The data are taken from the Survey of
Graduates of Higher Education Institutions 2014, provided by OLE. We employ a two-step
treatment effect method proposed by Heckman (1974, 1979) and Lee (1978)), we found that generic
abilities raise the probability of horizontal mismatch and diminish the probability of vertical
mismatch. On the other hand, specific abilities lower the probability of both horizontal and vertical
mismatch. In terms of wages, we found evidence that confirmed the results of the
assignment models because it exists a wage penalty for the mismatched individuals (Sattinger,
1993).
JEL classification: C35; J24; J31
Keywords: Horizontal and vertical mismatch; assignment theory; generic and specific skills;
congruence; productivity and wages
________________________________________________________________________________
1. Introduction
Investment in education has been a recurrent policy to generate economic development3. These types
of policies are based on the predictions of the classical theory of human capital, which arguments that
the growth in educational levels produces a direct rise in individual productivity (Mincer, 1958). In
1 Universidad EAFIT, Medellín – Colombia.
2 Universidad EAFIT, Medellín – Colombia.
3 The World Conference on Education for All concluded that education is the safer and healthier path to reach a
prosperous social, economic and cultural world.
(OECD, 2013) proposed investing in education as a main strategy to improve both economic growth and
efficiency of the distribution of national income.
this model, the output per worker depends only of the individual´s quantity of human capital offered,
and job characteristics don´t have any effect in the production. The latter suggests that increases in
years of education should generate a direct impact in productivity, independent of the type of
education and its relevance to the productive sector.
The growing interest in human capital has generated a significant increase in the investment in
education which has led to greater access to education in almost all developing countries. For
instance, according to World Bank data, in Latin America and the Caribbean the average rate of
enrollment in primary and secondary school moved approximately from 69% in 1970 to 96% in
2013. Meanwhile, the percentage of enrollment to tertiary education rose from 7% to 60% in the
same period.
Educational explosion comes with a body of literature that seeks to validate the efficacy of this
approach. Efforts such those conducted by (Benhabib & Spiegel, 1994) and (Krueger & Lindahl,
2001) have concluded that there is not a positive relationship between education and worker
productivity. For example, the percentage of enrollment in tertiary education in Colombia changed
from 14% in 1990 to 48% in 2013, while the productivity index grew only 23% in the same period,
far below the human capital investment.
Some studies have tried to identify the possible reasons why human capital investment does not
directly increase individual productivity. (Easterly, 2002) argues that investment in education by
itself is not enough; the incentives generated by the government through public policy should be aim
towards congruence, creating educated people having both the required skills by the productive sector
and the available technology to exploit those abilities. A better skills supply enhance workers’
productivity, mainly because these workers would be performing tasks in which they have a
comparative advantage, which should translate into a GDP growth (Eijs and Heijke, 2000).
According to this, the educational policy should take into account the interaction between supply and
demand of human capital, understanding how the match is generated between worker´s education and
his or her job in the labor market. An appropriate match leads to an efficient use of the available
resources, while a worker-job mismatch produces problems of productivity, unemployment and
underemployment within the group with higher qualifications (Brown et al., 2011).
The accuracy of matching in the labor market has attracted the attention of researchers for some time.
The main reason for this growing interest is the increasing acknowledgment of the influence of this
variable in several labor market outcomes such as labor turnover, job satisfaction and wages (Badillo-
Amador, García-Sánchez, & Vila, 2005). This interest has been focused mainly in the relationship
with wages, with important theoretical background advances, which established the effects of
worker-job mismatch on this outcome. Importantly, the interpretation of empirical results strongly
depends on which theory is adopted for the researcher, and the focus and objective of the study
realized.
The aim of this paper is to estimate the effect of congruence of higher education in the individual
productivity, therefore in the individual´s earnings. The approach is based on the determinants of the
allocation process in the labor market, defining congruence as the effect of area of education and
acquiring skills on the chances of achieving an appropriate match, using an individual based
approach. For this purpose, three important aspects will be taken into account: first, the theory under
which the results are going to be considered; second, the types of mismatch and which of these will
be used in the empirical analysis; and third, which forms of human capital and skills will be used as
determinants of the assignment process and wage equation.
This article contributes to the literature of assignment in the labor market, specifically it is interested
in the existing relationship between acquired human capital in higher education and its pertinence in
the labor market. Differing from previews studies, the misallocation analysis is not only based on the
horizontal component and the educational mismatch, but it also includes the vertical component
(measuring the assignment skill process) and its interaction with the mentioned mechanisms. Another
contribution is the way we used for quantifying the abilities in the model through exploratory factor
analysis. The data are taken from the Survey of Graduates of Higher Education Institutions 2014
(Encuesta de Seguimiento a Graduados 2014 de Instituciones de Educación Superior) provided by the
Labor Observatory for Education in Colombia (OLE, for its acronym in Spanish). Through the two-
step treatment effect method we found that interpersonal competencies related to generic abilities,
raise the probability of horizontal mismatch and diminish the probability of vertical mismatch. On the
other hand, specific competencies related to technical abilities lower the probability of both
horizontal and vertical mismatch. Regarding wages, it is confirmed the results of the assignment
models because it exists a wage penalty for the mismatched individuals.
The remaining of this paper is divided as follows. Section 2 makes a literature review regarding wage
determinants and their relationship with worker-job mismatch. Section 3 discusses the types of
mismatch, the theories in which they can be framed and the determinants of the assignment process.
Section 4 presents the data used. The empirical model is presented in section 5. Finally, section 6
contains the conclusion, discussion and possible further research.
2. Theoretical Perspectives
Economists have developed different models in an attempt to explain the behavior of wages, the
differences between individual’s incomes, and the differences in wage’s growth in the agents’ life-
cycle. A part of the heterogeneity in individuals’ wages is explained by the observed and unobserved
characteristics of workers and firms, this is where the worker-job matching appears. This paper is
going to describe the human capital, search and matching, assignment and heterogeneous skills
theory and their relationship with assignment process.
2.1. Human capital theory
This line of economic thought was developed by Becker (1975); Mincer (1958, 1974) and Porat
(1967) who assume a competitive and non-friction economy where workers receive a rental rate for
its human capital stock which is equal among all firms. The model is based in homogeneous
individuals with freedom to choose their educational level and occupations. The assumption of
competitive economy implies that the present value of income life-cycle in different options should
be the same; otherwise all individuals would take the option with the highest payout. The major
constraint that emerges is that individual productivity is the same among all occupations (Rubinstein
& Weiss, 2006).
According to the tradition of human capital theory (Almond & Currie, 2011) wages are determined
solely by individual characteristics, such as education and experience level; theoretically, these
features are independent to the demand. In a simple way the wage function assume equilibrium where
all rental rates are equal through the market, which implies that the assignment process of workers to
jobs would be irrelevant to the wages.
Based on human capital theory, educational mismatch cannot exist if the labor market is efficient;
economists who support this theory propose two hypotheses to explain the apparent existence of
suboptimal matches. The human capital compensation hypothesis says that the apparent mismatch is
largely due to measurement errors that come from the unobservable heterogeneity, therefore when
relevant abilities are taken into account; wage is independent of job characteristics. Career mobility
hypothesis arguments that mismatch exist but only in the short run and disappear with the years of
experience and training. Korpi & Tåhlin (2009) and the meta analysis conducted by Harmon &
Walker (2003) tested and did not support neither of these two hypotheses; on the contrary they
showed consistency in their results when they allowed for mismatch variables in the specifications.
Because conclusions in human capital model are based on restrictive assumptions, other theories have
emerged to explain the individual income.
2.2. Search and matching models
The theory developed by (Burdett, 1978; McCall, 1970; D. T. Mortensen & Pissarides, 1999; D.
Mortensen, 1970) address the problem of asymmetric information and market rigidities in the labor
market. In this limited information model the rate of return is heterogeneous among individuals with
different levels of human capital. That is, firms paying low rental rate can coexist whit high-payment
counterparts for employees with the same level of human capital.
In this model wage’s growth is determined by the worker’s option to accept or reject job offers,
therefore wage’s growth is marginally decreasing in time because more experience leads to more
valuable works and higher occupational level. The latter explains the decreases in the likelihood to
find better job matches (D. T. Mortensen & Pissarides, 1999). The search model explains how
heterogeneous workers are being assigned to jobs with different characteristics suggesting a valuable
implication: the better the match the higher their earnings. It is worth noting that this model does not
involve explicitly interactions between demand and supply in the labor market, agents receive job
offers randomly.
2.3. Assignment and heterogeneous skills theory
When supply and demand characteristics are taken into account to determine individual wages,
assignment (Sattinger, 1993) and heterogeneous skills (Green & McIntosh, 2007) models come up.
Both assignment theory and heterogeneous skills, postulate human capital investment and required
level of education and skills for a job as main determinants of income. These models are based on the
comparative advantage that emerges when two workers’ outcomes are not the same in the same job
task (Roy, 1951). If there were no comparative advantage, the election of human capital level by the
firm would be completely arbitrary and the problem of assignment would disappear.
Following (Di Pietro & Urwin, 2003), the difference between the two theories lie on the
interpretation of educational mismatch (under and overeducation) and skills mismatch (under and
overcompetent). Assignment (Sattinger, 1993) theory establishes a really close relationship between
these two concepts: employees that occupy positions with job requirements differing from his
educational background –educational mismatch– is a consequence of the inappropriate match
between their skills and the abilities needed to fulfill the job’s necessities –skills mismatch–.
Therefore, workers with educational and skills mismatch are less productive than their counterparts
that work in the appropriate position.
On the other hand heterogeneous skills theory postulate a weaker relationship between educational
and skills mismatch than the assignment theory. This model is based on the fact that even among
individuals with the same educational background, the distribution of skills and knowledge is
dissimilar due to the individual heterogeneity. Thus, it is possible to find workers apparently
overeducated, because they are in the lowest tail of the skills distribution conditioned to individuals
with similar qualifications, in terms of skills they may match better.
The differences between assignment and heterogeneous skills theories is relevant to conduct
empirical evaluations, because of the difference in the construction of the educational mismatch and
skills mismatch variables, also the effect of these variables on the labor market outcomes may differ
too. Nevertheless, formalization and predictions of the two theories is the same. Then, we are going
to specify the formal model and its main predictions according to the tradition of assignment models
(Allen & Van Der Velden, 2001; Hartog, 1981, 1986a, 1986b, 2000; Roy, 1950, 1951; Sattinger &
Hartog, 2013; Sattinger, 1975, 1993; Teulings, 1995; Willis & Rosen, 1979). These are going to serve
as a basis for the development of this article. Empirically, after presentation of the data we are going
to explain the creation process of the different variables to both types of mismatch and we will test if
educational and skills mismatch are different process to the Colombian case.
2.3.1. Assignment model
We follow the theoretical model posed by (Hartog, 1986a) that is grounded on the model proposed by
(Tinbergen, 1956) and (Sattinger, 1979) that focuses in a process of selection by workers and firms.
First, firms are seeking for individuals with the indicate stock of human capital to each job that is
characterized by labor requirements. For simplicity only one variable is important to determine the
labor requirements in a particular job . In the short run firm´s characteristics are fixed and finding
the correct worker can be difficult, thus the company may need to hire a worker whose skills differ
from .
Then, in the short run the problem is reduced to match the best worker to a given job. The capacity of
the workers (we can include here skills and level of school) is defined as , firms face a wage in
function of labor requirement ( ) and type of worker ( ), where . Firms are maximizing
profits when marginal product and marginal wage cost are equal: ⁄ ⁄ .
Where indicates the marginal productivity of a worker in a given job .
In the second part of the model, workers have to choose a job given the level of capability (in the
short run capability levels are assumed as fixed). The assumption is that the worker decides on type
of job, having into account the tradeoff between effort ( ) and earnings ( ). The individual’s utility
function is specified as which captures the idea that some jobs ( ) can be easier than
others depending on the individual skills ( ). The worker maximize his or her utility when marginal
change in effort is identical to the marginal increase in earnings, it is ⁄ ⁄ ⁄⁄ .
In terms of the empirical approach, it is important to note that employees also perform a
maximization to choose the type of job they want, this optimization depends on the individual’s
abilities. Therefore type of labor is an endogenous variable and depends on observed and unobserved
characteristics, this may produces two problems: selection bias because workers select themselves to
the job they are going to apply; and double causality because workers optimize considering wage and
at the same time wage is a function of the type of job and the type of worker.
The economy consists therefore in a numerous population of workers, for whom there is a
distribution function of abilities ( ) and a sufficiently large number of firms with distribution
function of labor requirements ( ). In this hypothetical world, companies look for the best worker
given and workers do the same thing for the companies given . There is a wage function that
guarantees the market equilibrium with the following theoretical implications: workers with the same
level of skills ( ) observed in different jobs are going to have different salaries in function of the job
characteristics ( ), the most suitable individuals for every job will receive a wage compensation. The
slope with respect to , represent the skills marginal productivity, to jobs with the same
characteristics ( ) are observed workers with different levels of abilities; the wage difference will
reflect the differences in productivity.
3. Determinants of the assignment model and types of mismatch
From the assignment model we can detach the fact that individuals with a set of heterogeneous
abilities are looking for positioning themselves in the best job given their characteristics. Individuals’
competencies may have natural divisions, for instance, one job may seek a worker with knowledge in
a specific discipline or field and at the same time, this individual should have ability to learn or solve
generic problems. Furthermore employers do not only look at those kinds of skills, employees may
have unobserved characteristics that help them to perform better in achieving employment like
persistence or motivation. Then, skills can be separated into following dimensions: cognitive and
noncognitive (Heckman, Stixrud, & Urzua, 2006) and within cognitive skills there is a sub set of
generic and vocational skills (Heijke, Meng, & Ris, 2003).
Therefore we assume that the set of individual characteristics at time of graduation is a combination
of noncognitive ( ), cognitive ( ), generic ( ), and vocational ( ) abilities, then the human
capital of an individual ( ) can be represented by . This paper will
emphasize on the effect of these abilities on the assignment process, which reflects the pertinence of
education, and at the same time we will measure the effect of this pertinence and different types of
abilities on salaries.
To understand the assignment process we have to keep in mind the existence of two types of
adjustment dimensions. On one side, the horizontal dimension involves the possibility that an
individual is matched to an occupation close to their own professional carrier; on the other hand, the
vertical dimension indicates whether workers have the required level of skills or they are under or
overcompetent (Heijke et al., 2003). In this paper, we are going to represent vertical mismatch with
skills mismatch (as stated in section 2.3), differing from (Heijke et al., 2003) whose representation is
only based on vocational competences. Meanwhile, the effect of educational mismatch will be
represented with the ORU model (Duncan & Hoffman, 1981) where attended education is
discomposed into three parts: , where denotes attained education, is the
requirement amount of education, is the amount of years of attained education above the job
requirements, and is the amount of years of attained education below job requirements.
Given the definitions of types of skills and mismatch is important to clarify the theoretical
interpretation of the relationship between this two set of variables. From the assignment model all
type of skills have a positive relationship with the probability to find a match in two assignment
dimensions, because workers with higher levels of human capital are going to have better
productivity given the job requirements, so they can easily find better jobs in terms of matching.
However (Heijke et al., 2003) proposed other type of interpretation, they concluded that generic
abilities have a negative effect in the probability of working inside a worker’s educational domain
(horizontal match), while vocational abilities have a positive relationship with this probability; this
happens because a worker with higher level of generic competencies can deal with new problems in
several fields, whereas higher vocational competencies are related to over-focusing in a particular
field, making their knowledge and skills limited.
4. Data
The data used in this paper comes from the Survey of Graduates of Higher Education Institutions
2014 (encuesta de seguimiento a graduados 2014 de instituciones de educación superior) provided
by the OLE. The survey was answered by 15,450 individuals graduated from higher education in
technical, technological and university levels. Individuals are observed in three different cohorts:
graduates one year before the survey, period between years 2012 and 2013. The second cohort
consists of graduates three years before survey, period between 2010 and 2011. Finally, the third
cohort contains graduates five years before the survey, between years 2008 and 2009. Furthermore,
graduates are divided into three groups depending on their occupational sector: employees, self-
employed and owners. We add the higher education graduates data base provided by the National
Information System of Higher Education in Colombia (SNIES, by its acronym in Spanish) to include
institutions and programs characteristics such as: code and name of the institution, sector and
character, department and municipality of location of the institution, code and name of the program,
level of education, methodology, area and basic core of knowledge, department and municipality
where the program is offered.
The Survey of Graduates of Higher Education Institutions is divided in 6 parts. The part A contains
information about personal and familiar situation of the graduates, including civil status, number of
children and characteristics of housing payment. The part B contains information about graduate’s
skills. The part C, talk about the plan of life and future plans, there is information about academic
activities, business creation and job search. The part D has information about internal and external
mobility, if the graduate has lived or studied abroad and if he is in the same city where he finished his
higher education studies. The part E is the employment situation of graduate, which as we mentioned
before, is divided into employees, self-employed and owners of farms, businesses or companies. Each
group is asked about employment situation, compliance with the activity they are performing at the
time of the survey and the industry which they currently belongs. Finally, the part F consists of
questions about the level of identity of the graduate with the educational institution he belongs to.
Since the objective of the research is to analyze the labor market and evaluate the congruence of
education to meet the demand for workers, the sample is restricted to 9,615 graduates that are into the
employees group, excluding of the study 3,266 graduates that are self-employed or owners.
Within the module of work activities we have questions that can be used to build mismatch variables.
To construct the horizontal mismatch indicator, we used the answer to the question about the
perception of the relevance of careers studied on the tasks doing in the workplace. Horizontal
mismatch is a dummy variable where one is nothing related (mismatch) and cero is direct and indirect
related (match), approximately 8% of graduates reported having a job outside their own educational
domain.
The vertical mismatch variable (related to skills mismatch) is constructed using the answer to two
question related with the possession of knowledge and skills. The first question asks about the job’s
usefulness of knowledge and skills learned in his or her career, and the second question asks whether
graduates believe they should be in another job to further develop their professional skills. Workers
responding negatively to the first question (little helpful or unhelpful) are classified as
undercompetent, workers answering affirmatively to the first question (useful or very useful) and
negatively to the second question are classified as match in competence, and workers answering
affirmatively to both questions are classified as overcompetent (Badillo-Amador et al., 2005). Within
the employees group approximately 60% of graduates consider themselves overcompetent, 8%
undercompetent and 32% matched in competence.
In terms of educational mismatch, we use the question of level of study required in the actual job and
compare it with the level of education attained by the graduate at the time of the survey; this way, we
can get years of required education, years of overeducation and years of undereducation.
Approximately 13% of the sample consider themself having years of overeducation, 34% having
years of undereducation and 53% perceives themselves matched in education. In average, workers
have 1.6 years of overeducation with a range between 1 and 7 years, meanwhile in terms of
undereducation, workers have in average 2 years of undereducation with a range between 1 and 8
years.
It is important to take into account the types of measures of mismatch and the advantages and
disadvantages of using one or the other. Hartog (2000) argues there are 3 classical ways to measure
the mismatch: (1) Job analysis: systematic evaluation by professionals who specify the required level
and type of education. For this process there is a lack of information in Colombia, precluding it´s use.
(2) Worker self-assessment: workers responded a survey with mismatch information. This is a
perception measure and can have problems related to the unobserved heterogeneity and inversed
causality because salary could be affecting the perception. (3) Realized match: “required education is
derived from what workers in the respondent’s job or occupation usually have attained, e.g. the mean
or the mode of that distribution” (Hartog, 2000). This measure is far from covering the technological
requirements of a job and it is an endogenous process. Considering the options, job analysis is
conceptually superior but the measurement is not available, worker self-assessment is therefore the
best available alternative. Given the above and the characteristics of our survey this article is going to
work with worker self-assessment measures, considering that it is the best method to which we can
access and also accepting the problems we may face.
The part B of the survey contains questions related with the individual’s skills, in the first part there is
variables with the level of reading, writing and listening of 8 different languages4. In the second part
there are 26 variables measuring the individual satisfaction with respect to a specific competence at
the time of graduation. We use the multivariate technique of exploratory factor analysis to reduce the
dimensionality of data regarding underlying structure caused by latent variables (See Appendix 1).
We find 2 significant latent constructs that explain the 95% of the total variance. We used as a
theoretical framework to lumping together the variables the articles by Ananiadou & Claro (2008)
and Beneitone et al. (2007). The outcome of the latter show a first factor called “interpersonal
dimension” explaining the information related to effective communication, solve problems and social
impact, the second factors is called “information dimension” which explains how graduates analyze
information and how they dominate the use of technological tools. Henceforth, interpersonal
dimension will be understood as generic abilities and information dimension as specific abilities.
Much of the individual heterogeneity comes from unobservable characteristics as individuals abilities
or intelligence (Heckman, Lochner, & Todd, 2006). To control the effect of these unobservable
variables we take additional abilities information comes from the standardized test SABER-115 and
SABER-PRO6 with which we can approximate individuals’ abilities, following Carneiro, Hansen, &
Heckman (2003) and Neumann, Olitsky, & Robbins (2009). Data about test scores is reported by
ICFES (Instituto Colombiano para la Evaluación de la Educación); with data available from year
2007 to year 2014. Using exploratory factor analysis to SABER-11 and SABER-PRO we find one
factor to each test representing individual’s abilities before and after higher education. Since the
Survey of Graduates of Higher Education Institutions is anonymized7 we cannot add directly the data
base with the estimated individual abilities, thus using hierarchical models we impute the individual
ability to the Survey of Graduates of Higher Education Institutions 2014 data base (See appendix 2).
Table 2 shows descriptive statistics for all variables used in the empirical analysis.
4 English, French, Italian, Portuguese, Mandarin, German, Japanese and Arabic
5 This test is performed at the end of secondary education and is required to enter to tertiary education
6 This test is performed at the end of higher education and is required to get the college degree
7 The law 1581 of 2012 and the resolution MEN N. 326 of 2014 not allow us have the data with individual
identification
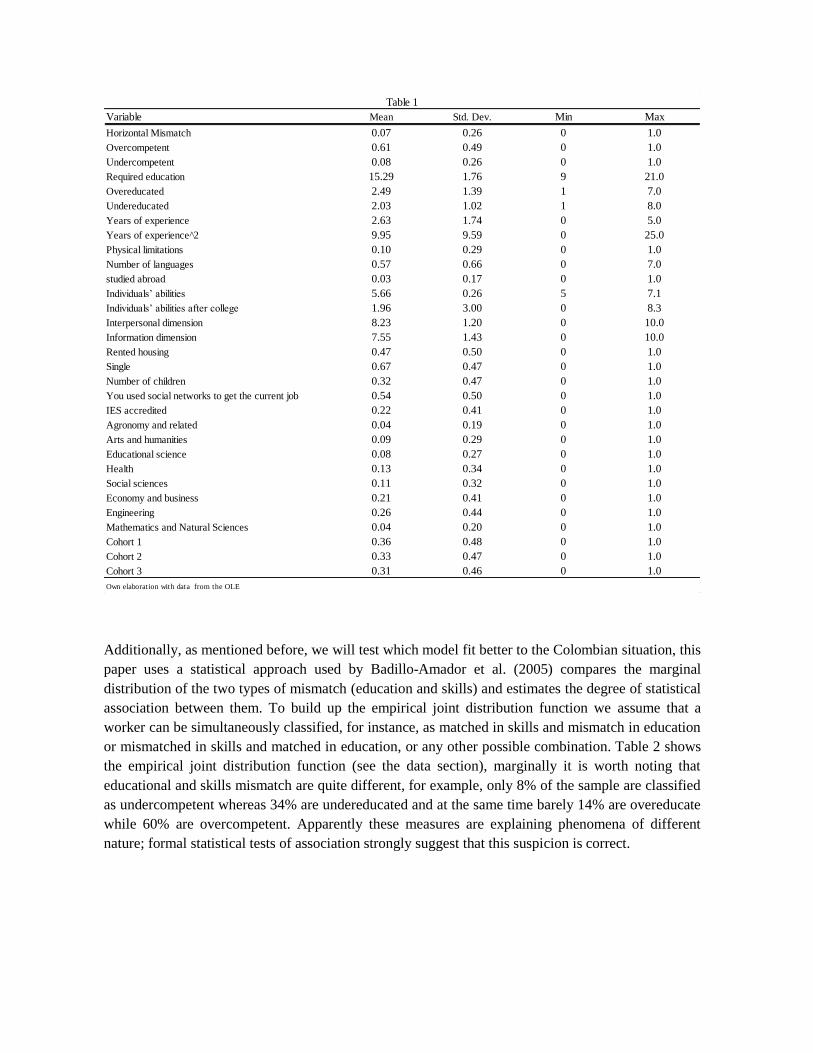
Additionally, as mentioned before, we will test which model fit better to the Colombian situation, this
paper uses a statistical approach used by Badillo-Amador et al. (2005) compares the marginal
distribution of the two types of mismatch (education and skills) and estimates the degree of statistical
association between them. To build up the empirical joint distribution function we assume that a
worker can be simultaneously classified, for instance, as matched in skills and mismatch in education
or mismatched in skills and matched in education, or any other possible combination. Table 2 shows
the empirical joint distribution function (see the data section), marginally it is worth noting that
educational and skills mismatch are quite different, for example, only 8% of the sample are classified
as undercompetent whereas 34% are undereducated and at the same time barely 14% are overeducate
while 60% are overcompetent. Apparently these measures are explaining phenomena of different
nature; formal statistical tests of association strongly suggest that this suspicion is correct.
Variable Mean Std. Dev. Min Max
Horizontal Mismatch 0.07 0.26 0 1.0
Overcompetent 0.61 0.49 0 1.0
Undercompetent 0.08 0.26 0 1.0
Required education 15.29 1.76 9 21.0
Overeducated 2.49 1.39 1 7.0
Undereducated 2.03 1.02 1 8.0
Years of experience 2.63 1.74 0 5.0
Years of experience^2 9.95 9.59 0 25.0
Physical limitations 0.10 0.29 0 1.0
Number of languages 0.57 0.66 0 7.0
studied abroad 0.03 0.17 0 1.0
Individuals’ abilities 5.66 0.26 5 7.1
Individuals’ abilities after college 1.96 3.00 0 8.3
Interpersonal dimension 8.23 1.20 0 10.0
Information dimension 7.55 1.43 0 10.0
Rented housing 0.47 0.50 0 1.0
Single 0.67 0.47 0 1.0
Number of children 0.32 0.47 0 1.0
You used social networks to get the current job 0.54 0.50 0 1.0
IES accredited 0.22 0.41 0 1.0
Agronomy and related 0.04 0.19 0 1.0
Arts and humanities 0.09 0.29 0 1.0
Educational science 0.08 0.27 0 1.0
Health 0.13 0.34 0 1.0
Social sciences 0.11 0.32 0 1.0
Economy and business 0.21 0.41 0 1.0
Engineering 0.26 0.44 0 1.0
Mathematics and Natural Sciences 0.04 0.20 0 1.0
Cohort 1 0.36 0.48 0 1.0
Cohort 2 0.33 0.47 0 1.0
Cohort 3 0.31 0.46 0 1.0
Own elaboration with data from the OLE
Table 1
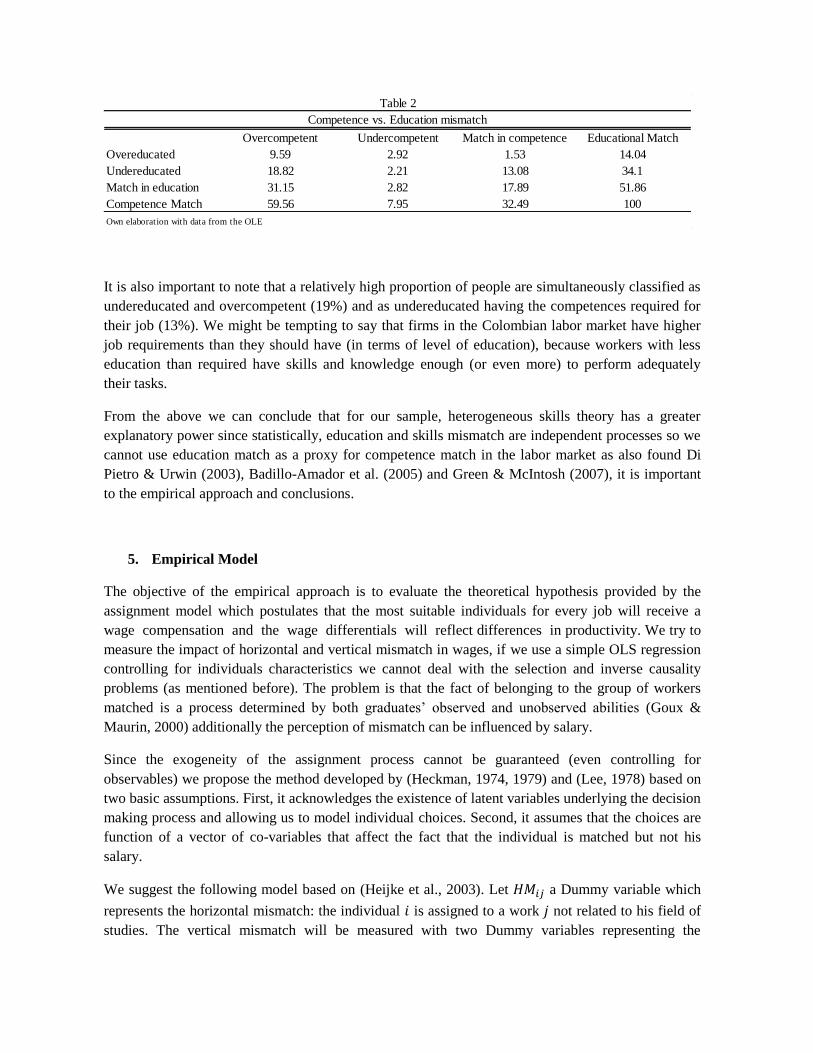
It is also important to note that a relatively high proportion of people are simultaneously classified as
undereducated and overcompetent (19%) and as undereducated having the competences required for
their job (13%). We might be tempting to say that firms in the Colombian labor market have higher
job requirements than they should have (in terms of level of education), because workers with less
education than required have skills and knowledge enough (or even more) to perform adequately
their tasks.
From the above we can conclude that for our sample, heterogeneous skills theory has a greater
explanatory power since statistically, education and skills mismatch are independent processes so we
cannot use education match as a proxy for competence match in the labor market as also found Di
Pietro & Urwin (2003), Badillo-Amador et al. (2005) and Green & McIntosh (2007), it is important
to the empirical approach and conclusions.
5. Empirical Model
The objective of the empirical approach is to evaluate the theoretical hypothesis provided by the
assignment model which postulates that the most suitable individuals for every job will receive a
wage compensation and the wage differentials will reflect differences in productivity. We try to
measure the impact of horizontal and vertical mismatch in wages, if we use a simple OLS regression
controlling for individuals characteristics we cannot deal with the selection and inverse causality
problems (as mentioned before). The problem is that the fact of belonging to the group of workers
matched is a process determined by both graduates’ observed and unobserved abilities (Goux &
Maurin, 2000) additionally the perception of mismatch can be influenced by salary.
Since the exogeneity of the assignment process cannot be guaranteed (even controlling for
observables) we propose the method developed by (Heckman, 1974, 1979) and (Lee, 1978) based on
two basic assumptions. First, it acknowledges the existence of latent variables underlying the decision
making process and allowing us to model individual choices. Second, it assumes that the choices are
function of a vector of co-variables that affect the fact that the individual is matched but not his
salary.
We suggest the following model based on (Heijke et al., 2003). Let a Dummy variable which
represents the horizontal mismatch: the individual is assigned to a work not related to his field of
studies. The vertical mismatch will be measured with two Dummy variables representing the
Overcompetent Undercompetent Match in competence Educational Match
Overeducated 9.59 2.92 1.53 14.04
Undereducated 18.82 2.21 13.08 34.1
Match in education 31.15 2.82 17.89 51.86
Competence Match 59.56 7.95 32.49 100
Competence vs. Education mismatch
Table 2
Own elaboration with data from the OLE
individual misallocation of abilities, one for overcompetent and one for undercompetent. is a
variable that indicates the graduate is overqualified for the job and indicates the individual
is underqualified for the job . It also defines as the wage logarithm of individual for the
job . We consider the following model of simultaneous equations:
Where , and are independent variable vectors that affect the vertical and horizontal
mismatches respectively do not necessarily have to be different. It is important to note that the
correlation between the two types of mismatch is allowed, since it is possible to think that the fact
that a person has skills different to those required for his job would affect his probability of being
outside of his vocational domain. , and identify the impact of the misallocation in the wages,
and are the parameters of interest.
The model is called the two-step treatment effect method; it starts by estimating the process of
mismatch using the multivariate probit model. Then, the inverse Mills ratio are built using the results
of the probit models for each estimation ( referred to the model for horizontal mismatch
model, referred to overcompetent and referred to undercompetent) and they are used as
independent variables to control for selection. If the coefficient of any inverse Mills ratio is equal to
zero there are no bias issues in the estimation of the effect of the variable that generates it, whereas if
the effect is positive and significant, there are non-observable factors that positively influence the
probability of the occurrence of the event (Hamilton & Nickerson, 2003).
The second assumption mentioned, which guarantees the identification of parameters, is that there are
variables that are supposed to be correlated with the assignment process but not with the non-
observable determinants of the wage. We used the same exogenous variable vector for the estimation
of the three processes of misallocations. First, we took into account the personal situation of the
individual as a proxy for his financial urgency to find a job. The number of children, rent housing,
and being married can be a pressure for the graduate to find a job quickly making it possible that he
gets a job not suitable for his characteristics. Second, following the argument used by (Heijke et al.,
2003) we used the interpersonal abilities (interpersonal dimension) related with the generic skills and
the abilities of the information related with technical or specific skills, reported by the individuals at
the moment of their graduation. The assumption to use these variables is that the level of skills of the
graduates increases with experience and training during their years in labor market, besides it is
expected that this raise differs between graduates, which means there is no expectation of correlation
between this latent constructs and non-observables variables of wage. It’s important to note that the
differences between the increments of skills among individuals can happen because of their initial
skills; therefore the general intelligence would mostly explain the changes of the wages. This variable
is included as control in the wage equation (the variable is measured by the Saber 11 and Saber Pro
tests). According to the latter, the interpersonal and information dimensions in their initial levels
affect only the assignment process.
The table 3 shows the results of the trivariate probit. First, by analyzing the horizontal mismatch, we
can see the importance of all the other mismatch measures by explaining the probability of an
individual being outside his educational domain. The vertical mismatch variables and the education
mismatch have a positive effects in the probability of the field of studies not being related with the
individual work field, it is interesting to note that not only the undercompetent and undereducated
increase the probability of vertical mismatch, but also the overcompetent and overeducated, which
indicates that the direction of the mismatch is not what is important, but the mismatch in itself. The
interpersonal and information skills dimensions also have a significant effect in this part of the
assignment process. The latent construct referred to the generic skills such as effective
communication, problem solving and social impact raises the probability of having a horizontal
mismatch; the construct referred to technical skills or specific abilities such as technological tools
decreases the probability of being outside the educational domain. These results confirm the
hypothesis that the specific knowledge focuses the skills in a particular field, making it more likely to
find a job in that area, while a more general knowledge allows the individual to deal with problems in
different fields, making him more likely to find jobs in different areas outside of his vocational
domain.

Independent Variables Coefficient S.E.
Overcompetent 0.173 ** 0.067
Undercompetent 1.239 *** 0.113
Interpersonal Dimension 0.114 ** 0.056
information Dimension -0.181 *** 0.049
Single -0.064 0.051
Number of Children -0.058 0.052
Rent Housing -0.085 ** 0.042
Required Education -0.217 *** 0.020
Overeducation 0.027 0.023
Undereducation 0.126 *** 0.024
Years of Experience -0.158 *** 0.043
Years of Experience^2 0.017 ** 0.008
Number of Languages 0.024 0.033
Lived Abroad 0.044 0.131
studied abroad -0.020 0.183
Individuals’ abilities -0.122 *** 0.034
Individuals’ abilities after college 0.076 0.057
Accredited University 0.000 0.124
Intercept 2.068 *** 0.366
Dependent Variable: Overcompetent
Interpersonal Dimension -0.004 0.034
information Dimension 0.078 *** 0.029
Single 0.048 * 0.030
Number of Children 0.029 0.031
Rent Housing -0.011 0.024
Required Education -0.040 *** 0.013
Overeducation -0.008 0.017
Undereducation -0.044 *** 0.013
Years of Experience 0.001 0.027
Years of Experience^2 -0.003 0.005
Number of Languages -0.030 0.019
Lived Abroad -0.079 0.075
studied abroad 0.017 0.098
Individuals’ abilities -0.012 0.018
Individuals’ abilities after college -0.093 *** 0.027
Accredited University 0.002 0.058
Intercept 0.727 ** 0.230
Table 3
Trivariate Probit Analysis
Dependent Variable: Horizontal Mismatch
Vertical Mismatch
Competencies

Noting the initial individual skills (measured as a general intelligence latent construct), it seems we
can confirm the result of the assignment model according to which the more competent individuals
have better opportunities to have a successful match, since that variable reduces the probability of an
individual being horizontally mismatched. It is to be expected, according to the results of the
searching model, that the years of experience decrease (seemingly exponentially during the first few
years in the labor market) the probability of being vertically mismatched. The graduates from Health
sciences, mathematics and natural sciences have, respectively, a bigger probability of finding an
occupation in those areas.
The skills involved in being overcompetent show similar results to the horizontal mismatch,
individuals with higher generic skills increase the probability of being overcompetent for their job.
Meanwhile, both, generic and specific skills significantly reduce the probability of being
undercompetent for the job. Having the required education for a job reduces both, the probability of
being overcompetent and undercompetent. The undereducation affects the probability of being
overcompetent in a negative way, which has a practical sense because it’s presumable that people
with fewer studies than those required will not declare that their skills are above those required. The
Independent Variables Coefficient S.E.
Dependent Variable: Undercompetent
Interpersonal Dimension -0.176 *** 0.046
information Dimension -0.196 *** 0.041
Single 0.004 0.045
Number of Children -0.091 ** 0.045
Rent Housing -0.032 0.035
Required Education -0.097 *** 0.018
Overeducation 0.070 *** 0.022
Undereducation 0.069 *** 0.020
Years of Experience -0.080 ** 0.038
Years of Experience^2 0.010 0.007
Number of Languages 0.081 ** 0.027
Lived Abroad 0.118 0.105
studied abroad 0.021 0.135
Individuals’ abilities 0.008 0.027
Individuals’ abilities after college 0.026 0.042
Accredited University -0.161 * 0.091
Intercept 1.693 *** 0.314
Correlation (missalocation and overcompetent) 0.017 0.031
Correlation (missalocation and undercompetent) -0.035 0.051
Correlation (overcompetent and undercompetent) -0.800 *** 0.009
* Significant at 10% level.
** Significant at 5% level.
*** Significant at 1% level.
Table 3 (continued )
The estimation also include dummies for employees own account, owners and
academic areas.

overeducartion, on the other hand, has no effect, which still suggests the success of using the
heterogeneous skills theory to understand the results. Any form of educational misallocation
increases the probability of an individual being undercompetent for a job, the relationship between
undereducation and being undercompetent is evident; the relationship between overeducation and
being undercompetent, not so much. This might have something to do with what we mention before
when we talked about the difference between assignment models and heterogeneous skills models.
That is: an individual who is apparently overeducated can appear to be so because he is in the lower
tail of the skills distribution in a specific academic level, which would increase the probability to
have fewer skills than those required for a job. As in the case of horizontal mismatch, in both over
and undercompetences, the years of experience reduce (in this case, linearly) the probability of
having a vertical mismatch. In the knowledge areas, Health sciences and Arts and humanities are the
ones that mostly decrease the probability of being overcompetent. Both, Health and Education
sciences are also involved in the decrease of the probability of being undercompetent.
5.1. Mismatches’ effects on wages
After the estimation of the selection process for the mismatch variables we proceed with the
consistent estimation of the wage equation. The results can be seen in table 4. These results include
the effect treatment procedure in two stages, which guarantees the identification of coefficients. The
results of this regression show that the effects of the horizontal and vertical mismatches are negative
and significant; this validates the prediction of the assignment model in which, for the wage function
that ensures the market equilibrium, the more competent individuals for each job (those well
matched) receive a wage premium due to the existence of comparative advantages. There’s evidence
in favor of the assignment models (Hartog, 1981, 1986a, 1986b, 2000; Heijke et al., 2003; Neumann
et al., 2009; Sattinger, 1975, 1993) regarding that the wage is determined not only by individual
characteristics but also by job characteristics.
About the educational mismatch, when using OLS (see table 5), we came up with the usual results
that can also be found in the literature (Dolton & Vignoles, 2000; Duncan & Hoffman, 1981; Hartog,
2000; Korpi & Tåhlin, 2009), the coefficients related to the required education and the overeducation
are positive and the coefficient of the undereducation is negative. Also, the coefficient of the required
education is higher than the overeducation coefficient, which means that a worker over educated
earns more than a worker in that same position, but properly matched, but less than another worker
properly matched with his same level of education. When using the two-step treatment effect method
the coefficient of the required education decreases quantitatively, which means there are non-
observable factors that affect that variable. This keeps the qualitative conclusions, but not the
quantitative ones.
The comparison between OLS and the model that corrects endogeneity can be seen in table 5. It
shows that there are no significant changes in the estimated coefficient in the case of the horizontal
mismatch, which can be explained by the lack of statistical significance of the inverse Mills ratio that
comes from the selection model of this variable. As mentioned before, this implies that the bias does
not seem to be a problem in the estimation of the effect of this variable.
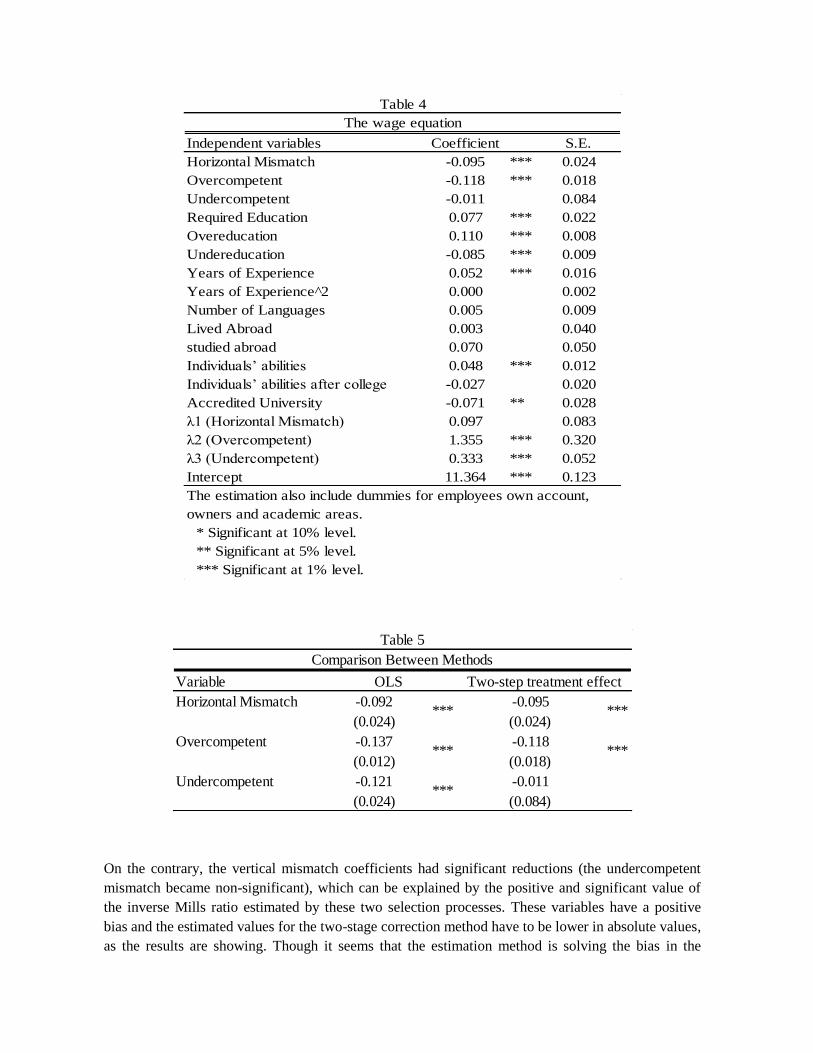
On the contrary, the vertical mismatch coefficients had significant reductions (the undercompetent
mismatch became non-significant), which can be explained by the positive and significant value of
the inverse Mills ratio estimated by these two selection processes. These variables have a positive
bias and the estimated values for the two-stage correction method have to be lower in absolute values,
as the results are showing. Though it seems that the estimation method is solving the bias in the
Independent variables Coefficient S.E.
Horizontal Mismatch -0.095 *** 0.024
Overcompetent -0.118 *** 0.018
Undercompetent -0.011 0.084
Required Education 0.077 *** 0.022
Overeducation 0.110 *** 0.008
Undereducation -0.085 *** 0.009
Years of Experience 0.052 *** 0.016
Years of Experience^2 0.000 0.002
Number of Languages 0.005 0.009
Lived Abroad 0.003 0.040
studied abroad 0.070 0.050
Individuals’ abilities 0.048 *** 0.012
Individuals’ abilities after college -0.027 0.020
Accredited University -0.071 ** 0.028
λ1 (Horizontal Mismatch) 0.097 0.083
λ2 (Overcompetent) 1.355 *** 0.320
λ3 (Undercompetent) 0.333 *** 0.052
Intercept 11.364 *** 0.123
* Significant at 10% level.
** Significant at 5% level.
*** Significant at 1% level.
The estimation also include dummies for employees own account,
owners and academic areas.
The wage equation
Table 4
Variable
Horizontal Mismatch -0.092 -0.095
(0.024) (0.024)
Overcompetent -0.137 -0.118
(0.012) (0.018)
Undercompetent -0.121 -0.011
(0.024) (0.084)
Two-step treatment effectOLS
Comparison Between Methods
Table 5
***
***
***
***
***

estimation of the parameters, this methodology still has two issues. First, it assumes that the terms of
error of the equations are jointly distributed; and second (and more important) the validity of the
instruments ( , y ), because if they were not correct, the estimations would be unstable and
the parameters unreliable.
6. Conclusions
The pertinence in education understood as the mismatch between individual skills and job
characteristics, to the Colombian case confirms the economic theory postulated by the assignment
model (Roy, 1951; Sattinger, 1975, 1993) where there is a wage penalty for mismatched
individuals. Then we can think this is a relevant topic for public policy within the country because it
has real effects on social welfare such as better wages, better productivity and better life quality due
to working in a job that matches his career. The results of this article are important because they
allow establishing knowledge fields and institutions for higher education that are doing things better
in terms of pertinence.
We included three types of abilities: first, the competences extracted from saber 11 that are
important in the empirical model to control for initial abilities. Differences in initial abilities may
generate unobserved heterogeneity. Second, competences taken from Saber Pro used to measure the
specific abilities and finally the Survey of Graduates of Higher Education Institutions 2014 to
measure generic abilities. Abilities variables created using these data sets, allowed us a better
understanding of the assignment process and it made easier to establish relationships between
human capital and the probability of being matched in the labor market. Mainly, we found
that generic abilities raise the probability of horizontal mismatch and diminish the probability of
vertical mismatch, while information competencies lower the probability of both horizontal and
vertical mismatch.
Although this methodology has certain important advantages dealing with the endogenity problem,
the results found should be look cautiously due to two disadvantages: the assumption of the
normality of the errors and the validity of the instruments. New data sets are is planned to be
included in the analysis to measure the mismatch variables trying to create a more objective indicator,
whit the objective to use systematic evaluation by professionals who specify the required level and
type of education. It is important to have into account these issues for further research.
Appendix 1: Factor analysis to abilities
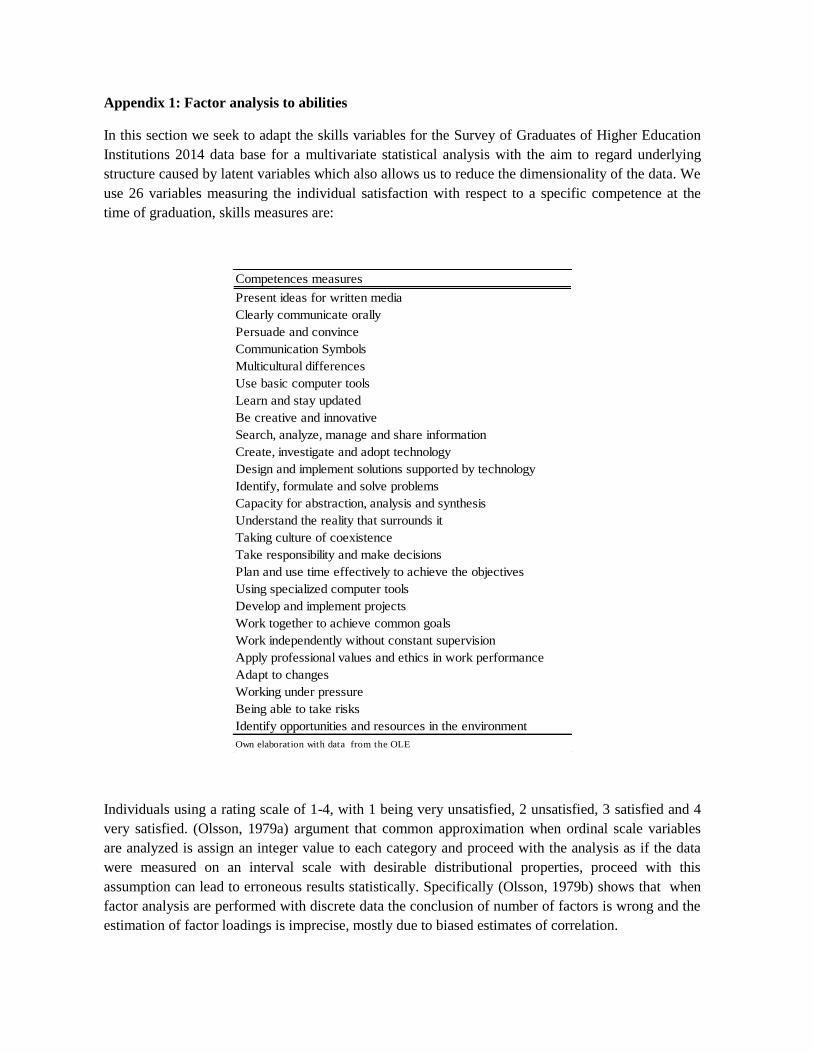
In this section we seek to adapt the skills variables for the Survey of Graduates of Higher Education
Institutions 2014 data base for a multivariate statistical analysis with the aim to regard underlying
structure caused by latent variables which also allows us to reduce the dimensionality of the data. We
use 26 variables measuring the individual satisfaction with respect to a specific competence at the
time of graduation, skills measures are:
Individuals using a rating scale of 1-4, with 1 being very unsatisfied, 2 unsatisfied, 3 satisfied and 4
very satisfied. (Olsson, 1979a) argument that common approximation when ordinal scale variables
are analyzed is assign an integer value to each category and proceed with the analysis as if the data
were measured on an interval scale with desirable distributional properties, proceed with this
assumption can lead to erroneous results statistically. Specifically (Olsson, 1979b) shows that when
factor analysis are performed with discrete data the conclusion of number of factors is wrong and the
estimation of factor loadings is imprecise, mostly due to biased estimates of correlation.
Competences measures
Present ideas for written media
Clearly communicate orally
Persuade and convince
Communication Symbols
Multicultural differences
Use basic computer tools
Learn and stay updated
Be creative and innovative
Search, analyze, manage and share information
Create, investigate and adopt technology
Design and implement solutions supported by technology
Identify, formulate and solve problems
Capacity for abstraction, analysis and synthesis
Understand the reality that surrounds it
Taking culture of coexistence
Take responsibility and make decisions
Plan and use time effectively to achieve the objectives
Using specialized computer tools
Develop and implement projects
Work together to achieve common goals
Work independently without constant supervision
Apply professional values and ethics in work performance
Adapt to changes
Working under pressure
Being able to take risks
Identify opportunities and resources in the environment
Own elaboration with data from the OLE
(Kolenikov & Angeles, 2004) argue that the most common way of dealing with discrete variables is
to assume that come from a continuous variable underlying . If observed variables are divided in
categories, it is assumed to be obtained by dividing the continuous variable ( ) according to
a set of thresholds , where . To obtain unbiased
estimates of correlation between two categorical variables and the correlation of the underlying
continuous variables and
should be found. This type of estimation is called polychorical
correlation (Olsson, 1979a) and is a generalization of tetrachorical correlation to variables with more
than two election options (Pearson, 1904).
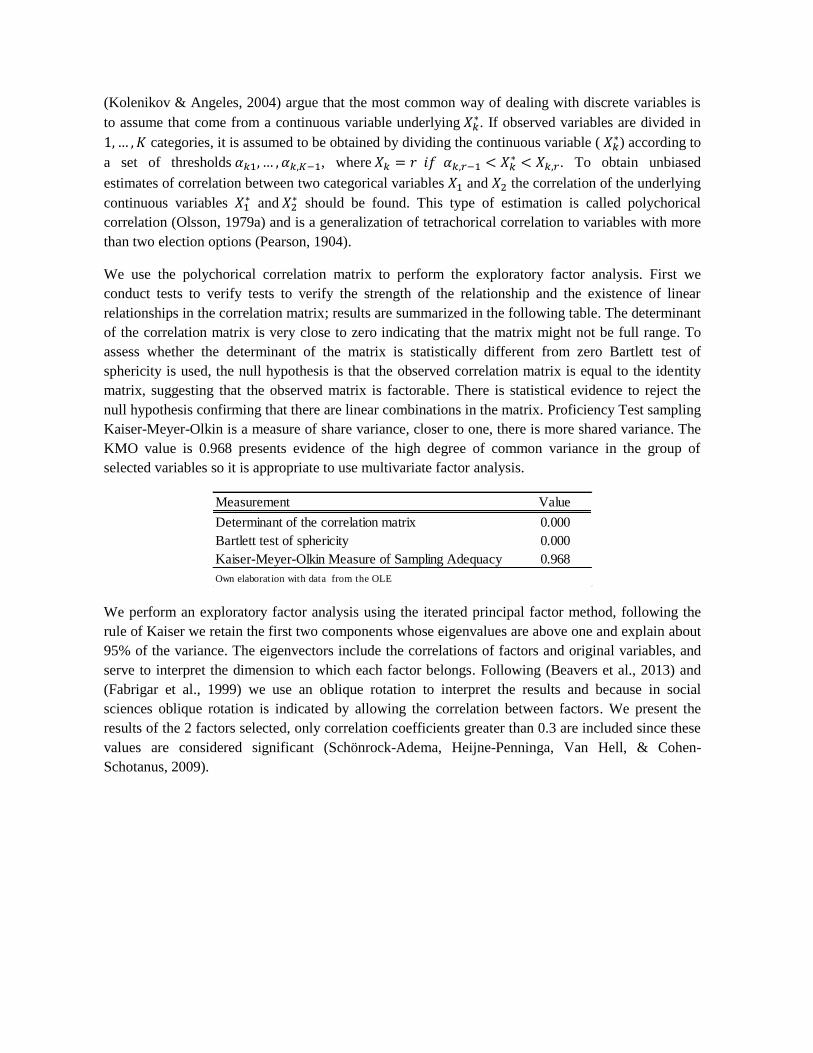
We use the polychorical correlation matrix to perform the exploratory factor analysis. First we
conduct tests to verify tests to verify the strength of the relationship and the existence of linear
relationships in the correlation matrix; results are summarized in the following table. The determinant
of the correlation matrix is very close to zero indicating that the matrix might not be full range. To
assess whether the determinant of the matrix is statistically different from zero Bartlett test of
sphericity is used, the null hypothesis is that the observed correlation matrix is equal to the identity
matrix, suggesting that the observed matrix is factorable. There is statistical evidence to reject the
null hypothesis confirming that there are linear combinations in the matrix. Proficiency Test sampling
Kaiser-Meyer-Olkin is a measure of share variance, closer to one, there is more shared variance. The
KMO value is 0.968 presents evidence of the high degree of common variance in the group of
selected variables so it is appropriate to use multivariate factor analysis.
We perform an exploratory factor analysis using the iterated principal factor method, following the
rule of Kaiser we retain the first two components whose eigenvalues are above one and explain about
95% of the variance. The eigenvectors include the correlations of factors and original variables, and
serve to interpret the dimension to which each factor belongs. Following (Beavers et al., 2013) and
(Fabrigar et al., 1999) we use an oblique rotation to interpret the results and because in social
sciences oblique rotation is indicated by allowing the correlation between factors. We present the
results of the 2 factors selected, only correlation coefficients greater than 0.3 are included since these
values are considered significant (Schönrock-Adema, Heijne-Penninga, Van Hell, & Cohen-
Schotanus, 2009).
Measurement Value
Determinant of the correlation matrix 0.000
Bartlett test of sphericity 0.000
Kaiser-Meyer-Olkin Measure of Sampling Adequacy 0.968
Own elaboration with data from the OLE
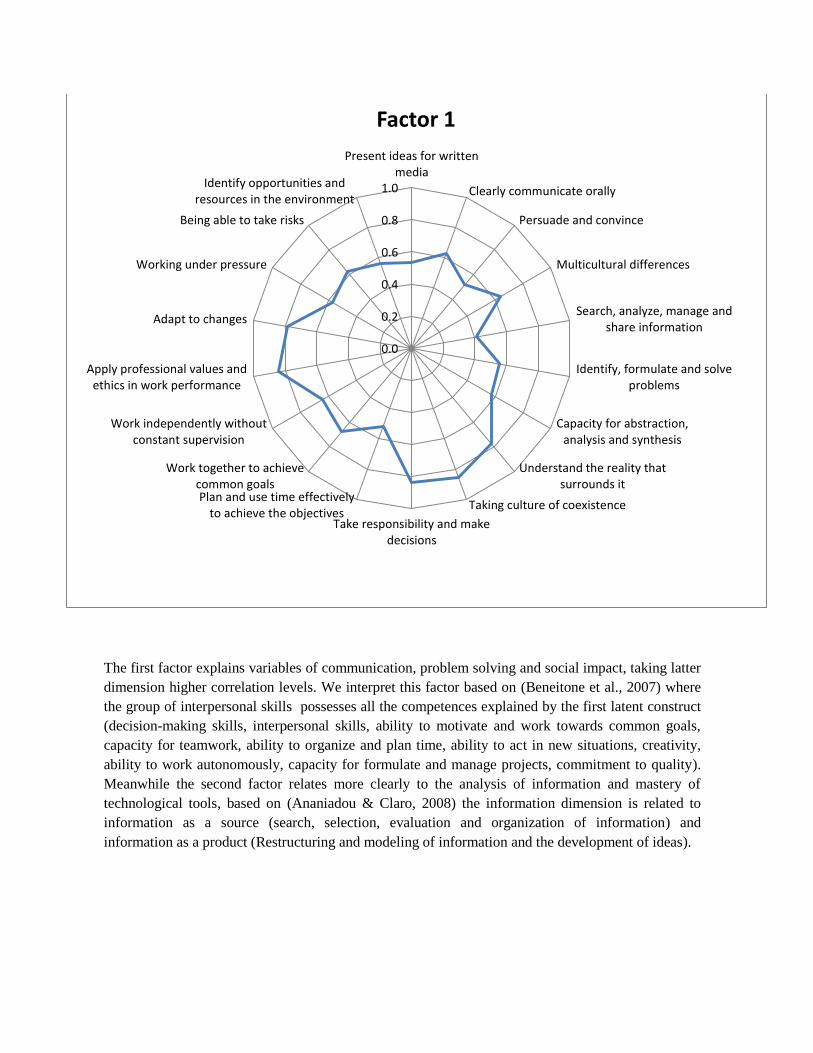
The first factor explains variables of communication, problem solving and social impact, taking latter
dimension higher correlation levels. We interpret this factor based on (Beneitone et al., 2007) where
the group of interpersonal skills possesses all the competences explained by the first latent construct
(decision-making skills, interpersonal skills, ability to motivate and work towards common goals,
capacity for teamwork, ability to organize and plan time, ability to act in new situations, creativity,
ability to work autonomously, capacity for formulate and manage projects, commitment to quality).
Meanwhile the second factor relates more clearly to the analysis of information and mastery of
technological tools, based on (Ananiadou & Claro, 2008) the information dimension is related to
information as a source (search, selection, evaluation and organization of information) and
information as a product (Restructuring and modeling of information and the development of ideas).
0.0
0.2
0.4
0.6
0.8
1.0
Present ideas for writtenmedia
Clearly communicate orally
Persuade and convince
Multicultural differences
Search, analyze, manage andshare information
Identify, formulate and solveproblems
Capacity for abstraction,analysis and synthesis
Understand the reality thatsurrounds it
Taking culture of coexistence
Take responsibility and makedecisions
Plan and use time effectivelyto achieve the objectives
Work together to achievecommon goals
Work independently withoutconstant supervision
Apply professional values andethics in work performance
Adapt to changes
Working under pressure
Being able to take risks
Identify opportunities andresources in the environment
Factor 1
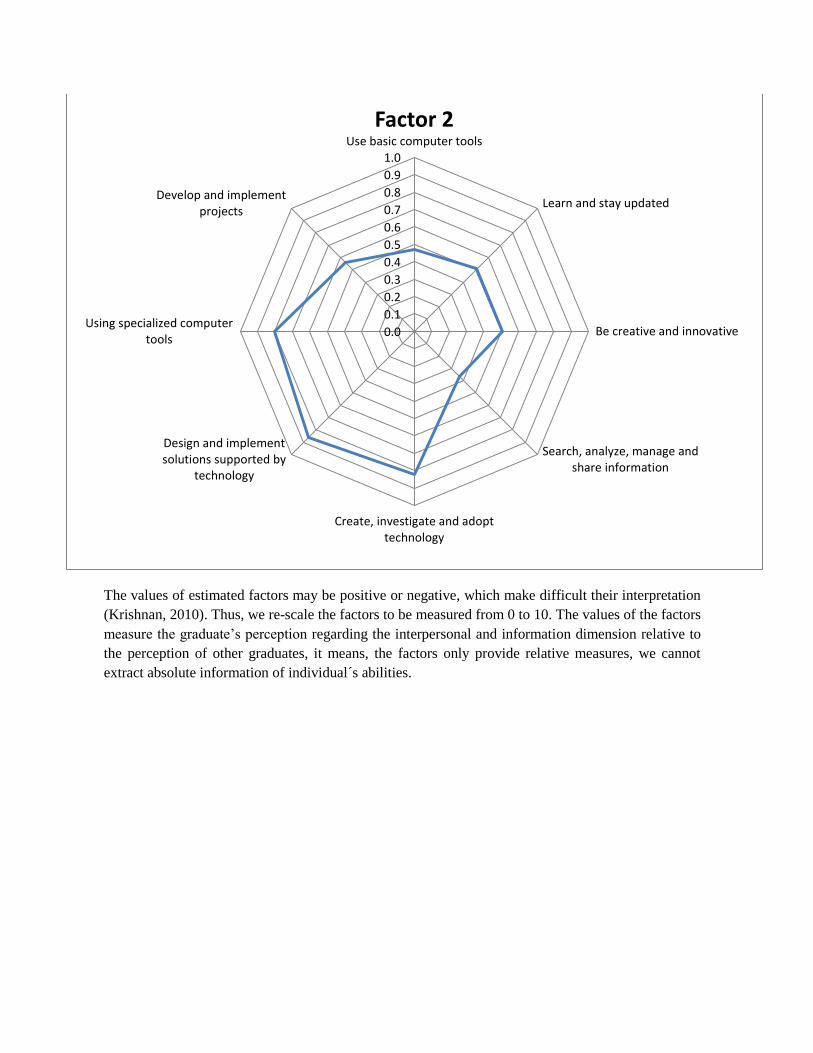
The values of estimated factors may be positive or negative, which make difficult their interpretation
(Krishnan, 2010). Thus, we re-scale the factors to be measured from 0 to 10. The values of the factors
measure the graduate’s perception regarding the interpersonal and information dimension relative to
the perception of other graduates, it means, the factors only provide relative measures, we cannot
extract absolute information of individual´s abilities.
0.0
0.1
0.2
0.3
0.4
0.5
0.6
0.7
0.8
0.9
1.0
Use basic computer tools
Learn and stay updated
Be creative and innovative
Search, analyze, manage andshare information
Create, investigate and adopttechnology
Design and implementsolutions supported by
technology
Using specialized computertools
Develop and implementprojects
Factor 2
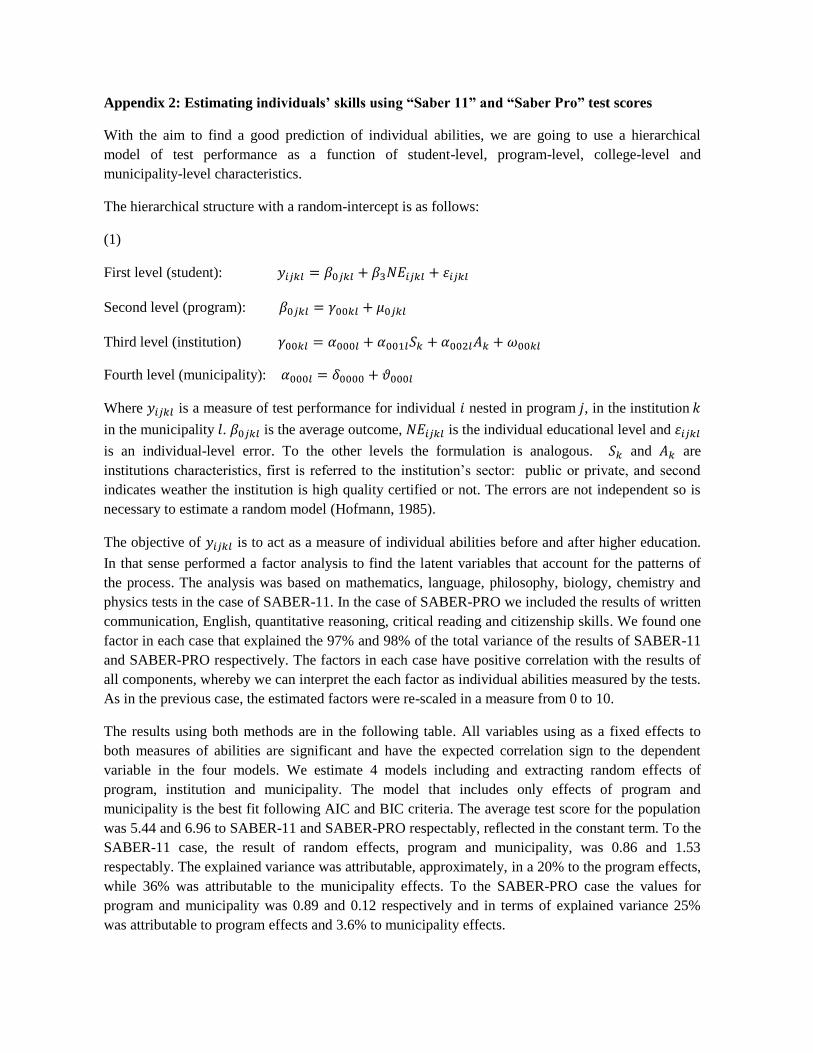
Appendix 2: Estimating individuals’ skills using “Saber 11” and “Saber Pro” test scores
With the aim to find a good prediction of individual abilities, we are going to use a hierarchical
model of test performance as a function of student-level, program-level, college-level and
municipality-level characteristics.
The hierarchical structure with a random-intercept is as follows:
(1)
First level (student):
Second level (program):
Third level (institution)
Fourth level (municipality):
Where is a measure of test performance for individual nested in program , in the institution
in the municipality . is the average outcome, is the individual educational level and
is an individual-level error. To the other levels the formulation is analogous. and are
institutions characteristics, first is referred to the institution’s sector: public or private, and second
indicates weather the institution is high quality certified or not. The errors are not independent so is
necessary to estimate a random model (Hofmann, 1985).
The objective of is to act as a measure of individual abilities before and after higher education.
In that sense performed a factor analysis to find the latent variables that account for the patterns of
the process. The analysis was based on mathematics, language, philosophy, biology, chemistry and
physics tests in the case of SABER-11. In the case of SABER-PRO we included the results of written
communication, English, quantitative reasoning, critical reading and citizenship skills. We found one
factor in each case that explained the 97% and 98% of the total variance of the results of SABER-11
and SABER-PRO respectively. The factors in each case have positive correlation with the results of
all components, whereby we can interpret the each factor as individual abilities measured by the tests.
As in the previous case, the estimated factors were re-scaled in a measure from 0 to 10.
The results using both methods are in the following table. All variables using as a fixed effects to
both measures of abilities are significant and have the expected correlation sign to the dependent
variable in the four models. We estimate 4 models including and extracting random effects of
program, institution and municipality. The model that includes only effects of program and
municipality is the best fit following AIC and BIC criteria. The average test score for the population
was 5.44 and 6.96 to SABER-11 and SABER-PRO respectably, reflected in the constant term. To the
SABER-11 case, the result of random effects, program and municipality, was 0.86 and 1.53
respectably. The explained variance was attributable, approximately, in a 20% to the program effects,
while 36% was attributable to the municipality effects. To the SABER-PRO case the values for
program and municipality was 0.89 and 0.12 respectively and in terms of explained variance 25%
was attributable to program effects and 3.6% to municipality effects.
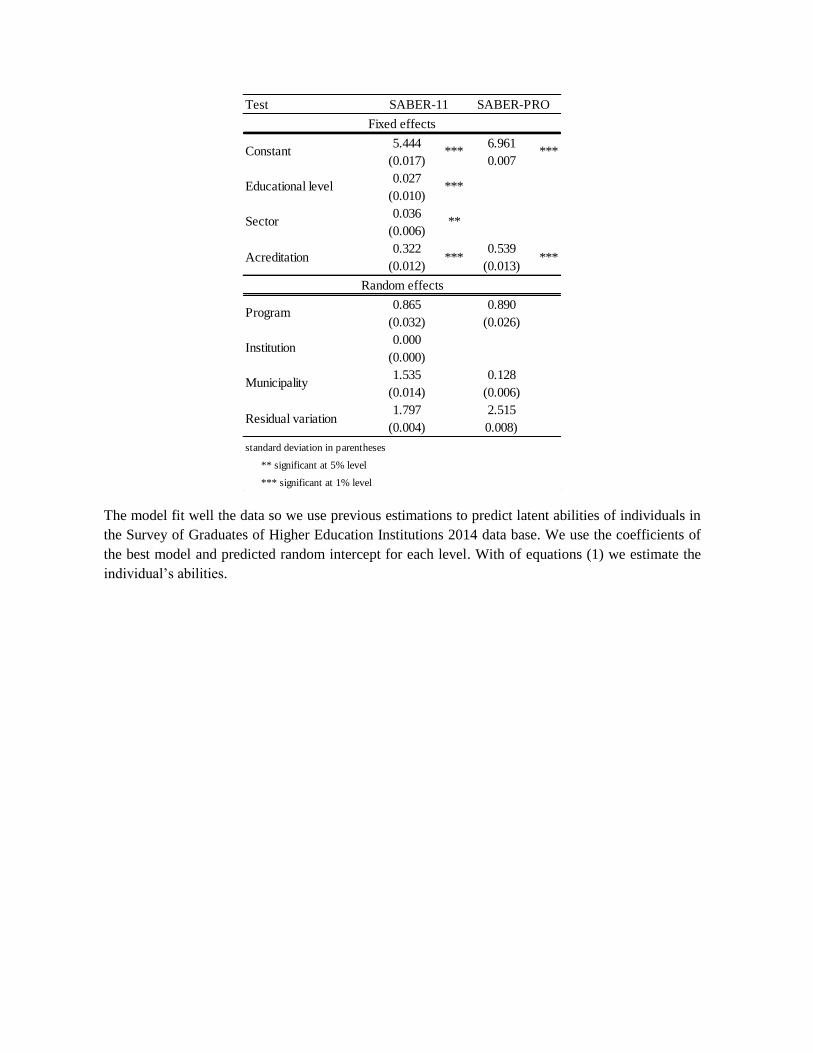
The model fit well the data so we use previous estimations to predict latent abilities of individuals in
the Survey of Graduates of Higher Education Institutions 2014 data base. We use the coefficients of
the best model and predicted random intercept for each level. With of equations (1) we estimate the
individual’s abilities.
Test
5.444 6.961
(0.017) 0.007
0.027
(0.010)
0.036
(0.006)
0.322 0.539
(0.012) (0.013)
0.865 0.890
(0.032) (0.026)
0.000
(0.000)
1.535 0.128
(0.014) (0.006)
1.797 2.515
(0.004) 0.008)
standard deviation in parentheses
** significant at 5% level
*** significant at 1% level
***
Constant
Educational level
Sector
Acreditation
Residual variation
Program
Institution
Municipality
SABER-11
Fixed effects
Random effects
SABER-PRO
***
***
***
***
**
References
Allen, J., & Van Der Velden, R. (2001). Educational mismatches versus skill mismatches: effects on
wages, job satisfaction, and on-the-job search. Oxford Economic Papers, 3, 434–452.
http://doi.org/10.1093/oep/53.3.434
Almond, D., & Currie, J. (2011). Human capital development before age five. Handbook of Labor
Economics (Vol. 4). Elsevier B.V. http://doi.org/10.1016/S0169-7218(11)02413-0
Ananiadou, K., & Claro, M. (2008). 21st Century Skills and Competencies for New Millenium
Learners in OECD, (41).
Badillo-Amador, L., García-Sánchez, A., & Vila, L. E. (2005). Mismatches in the Spanish labor
market: Education vs. competence match. International Advances in Economic Research, 11(1),
93–109. http://doi.org/10.1007/s11294-004-7491-z
Beavers, A. S., Lounsbury, J. W., Richards, J. K., Huck, S. W., Skolits, G. J., & Esquivel, S. L.
(2013). Practical Considerations for Using Exploratory Factor Analysis in Educational
Research. Practical Assessment, Research & Evaluation, 18(6).
Becker, G. S. (1975). Human capital: a theoretical and empirical analysis, with special reference.
Columbia University Press. Retrieved from
http://books.google.com/books?id=nowHzq2QoYsC&pgis=1
Beneitone, P., Esquetini, C., González, J., Maletá, M. M., Siufi, G., & Wagenaar, R. (2007).
Reflections on and outlook for higher education in Latin America. Final report - Tuning Latin
America Project 2004-2007, 1–420. Retrieved from
http://tuning.unideusto.org/tuningal/index.php?option=com_frontpage&Itemid=1
Benhabib, J., & Spiegel, M. (1994). The role of human capital in economic development evidence
from aggregate cross-country data. Journal of Monetary Economics, 34(2), 143–173.
http://doi.org/10.1016/0304-3932(94)90047-7
Burdett, K. (1978). A theory of employee job search and quit rates. American Economic Review,
68(1), p212. 9p.
Carneiro, P., Hansen, K. T., & Heckman, J. J. (2003). Estimating distributions of treatment effects
with an application to the returns to schooling and measurement of the effects of uncertainty on
college choice. International Economic Review, 44(2), 361–422. http://doi.org/10.1111/1468-
2354.t01-1-00074
Di Pietro, G., & Urwin, P. J. (2003). Education and skills mismatch in the Italian graduate labour
market. Applied Economics, 38, 79–93. http://doi.org/10.1080/00036840500215303
Dolton, P., & Vignoles, A. (2000). The incidence and effects of overeducation in the U . K . graduate
labour market. Economics of Education Review, 19, 179–198.
Duncan, G. J., & Hoffman, S. D. (1981). The incidence and wage effects of overeducation.
Economics of Education Review. http://doi.org/10.1016/0272-7757(81)90028-5
Eijs and Heijke. (2000). Mismatch between occupation and education and the cost and benefits of
job-related training.
Fabrigar, L. R., Fabrigar, L. R., Wegener, D. T., Wegener, D. T., MacCallum, R. C., MacCallum, R.
C., … Strahan, E. J. (1999). Evaluating the use of exploratory factor analysis in psychological
research. PSYCHOLOGICAL METHODS, 4(3), 272–299. http://doi.org/10.1037/1082-
989X.4.3.272
Goux, D., & Maurin, E. (2000). Returns to firm-provided training: evidence from French worker–
firm matched data. Labour Economics, 7(1), 1–19. http://doi.org/10.1016/S0927-
5371(99)00023-8
Green, F., & McIntosh, S. (2007). Is there a genuine under-utilization of skills amongst the over-
qualified? Applied Economics, 427–439. http://doi.org/10.1080/00036840500427700
Hamilton, B. H., & Nickerson, J. A. (2003). from the SAGE Social Science Collections . All Rights
Reserved . Strategic Organization, 1(1), 51–78. http://doi.org/0803973233
Harmon, C., & Walker, I. (2003). The returns to education: Microeconomics. Journal of Economic
Surveys, 17(2). http://doi.org/10.1111/1467-6419.00191
Hartog, J. (1981). WAGES AND ALLOCATION UNDER IMPERFECT INFORMATION. DE
ECONOMIST, 129(3).
Hartog, J. (1986a). Allocation and the earnings function. Empirical Economics, 11(2), 97–110.
http://doi.org/10.1007/BF01987507
Hartog, J. (1986b). Earnings functions: beyond human capital. Applied Economics.
http://doi.org/10.1080/00036848600000004
Hartog, J. (2000). Over-education and earnings: Where are we, where should we go? Economics of
Education Review, 19(2), 131–147. http://doi.org/10.1016/S0272-7757(99)00050-3
Heckman, J. J. (1974). Shadow Prices, Market Wages, and Labor Supply. Econometrica, 42(4), 679–
694. http://doi.org/10.2307/1913937
Heckman, J. J. (1979). Sample Selection Bias as a Specification Error. Econometrica, 47(1), 153–
161. http://doi.org/10.2307/1912352
Heckman, J. J., Lochner, L. J., & Todd, P. E. (2006). Chapter 7 Earnings Functions, Rates of Return
and Treatment Effects: The Mincer Equation and Beyond. Handbook of the Economics of
Education, 1(06), 307–458. http://doi.org/10.1016/S1574-0692(06)01007-5
Heckman, J. J., Stixrud, J., & Urzua, S. (2006). The Effects of Cognitive and Noncognitive Abilities
on Labor Market Outcomes and Social Behavior. Journal of Labor Economics, 24(3), 411–482.
http://doi.org/10.1086/504455
Heijke, H., Meng, C., & Ris, C. (2003). Fitting to the job: The role of generic and vocational
competencies in adjustment and performance. Labour Economics, 10(2), 215–229.
http://doi.org/10.1016/S0927-5371(03)00013-7
Hofmann, D. (1985). APPLICATIONS OF HIERARCHICAL LINEAR MODELS TO MULTI-
LEVEL DATA. Pennsylvania State University, 327–332.
Kolenikov, S., & Angeles, G. (2004). The Use of Discrete Data in PCA: Theory , Simulations , and
Applications to Socioeconomic Indices. Chapel Hill: Carolina Population Center, University of
North Carolina., 1–59.
Korpi, T., & Tåhlin, M. (2009). Educational mismatch, wages, and wage growth: Overeducation in
Sweden, 1974-2000. Labour Economics, 16(2), 183–193.
http://doi.org/10.1016/j.labeco.2008.08.004
Krishnan, V. (2010). Constructing an area-based socioeconomic status index: a principal components
analysis approach. Every Day in Every Way: Creating Learning Experiences for Every Child,
(May), 2–26. Retrieved from http://www.cup.ualberta.ca/wp-
content/uploads/2013/04/SEICUPWebsite_10April13.pdf
Krueger, A. B., & Lindahl, M. (2001). Education for Growth: Why and for Whom? Journal of
Economic Literature, 39(4), 1101–1136. http://doi.org/10.1257/jel.39.4.1101
Lee, L.-F. (1978). Unionism and Wage Rates: A Simultaneous Equations Model with Qualitative and
Limited Dependent Variables. International Economic Review. http://doi.org/10.2307/2526310
McCall, J. (1970). Economics of information and job search. The Quarterly Journal of Economics,
84(1), 113–126. Retrieved from http://www.jstor.org/stable/1879403
Mincer, J. (1958). Investment in Human Capital and Personal Income Distribution. Journal of
Political Economy. http://doi.org/10.1086/258055
Mincer, J. (1974). Schooling, Experience, and Earnings. Human Behavior & Social Institutions No.
2. NBER (Vol. I). Retrieved from
http://www.eric.ed.gov/ERICWebPortal/detail?accno=ED103621
Mortensen, D. (1970). Job search, the duration of unemployment, and the Phillips curve. The
American Economic Review, 60(5), 847–862. Retrieved from
http://www.jstor.org/stable/1818285
Mortensen, D. T., & Pissarides, C. a. (1999). New Developments in Models of Search in the Labour
Market. Handbook of Labour Economics, Volume 3B, Chapter 39, 3, 2567–2627.
Neumann, G., Olitsky, N., & Robbins, S. (2009). Job congruence, academic achievement, and
earnings. Labour Economics, 16(5), 503–509. http://doi.org/10.1016/j.labeco.2009.03.004
Olsson, U. (1979a). Maximum likelihood estimation of the polychoric correlation coefficient.
Psychometrika, 44(4), 443–460. http://doi.org/10.1007/BF02296207

Olsson, U. (1979b). On the robustness of factor analysis against crude clasifications of the
observations.pdf. Multivariate Behavioral Research, 13(4), 485–500.
Pearson, K. (1904). Mathematical Contributions to the Theory of Evolution. XII. On a Generalised
Theory of Alternative Inheritance, with Special Reference to Mendel’s Laws. Philosophical
Transactions of the Royal Society A: Mathematical, Physical and Engineering Sciences.
http://doi.org/10.1098/rsta.1904.0015
Porath, B. (1967). The Production of Human Capital and the Life Cycle of Earnings. Journal of
Political Economy, 75(4).
Roy, A. (1950). The Distribution of Earnings and of Individual Output. The Economic Journal,
60(239), 489–505. Retrieved from http://www.jstor.org/stable/10.2307/2226792
Roy, A. (1951). Some thoughts on the distribution of earnings. Oxford Economic Papers, 3(2), 135–
146.
Rubinstein, Y., & Weiss, Y. (2006). Chapter 1 Post Schooling Wage Growth: Investment, Search and
Learning. Handbook of the Economics of Education, 1(06), 1–67. http://doi.org/10.1016/S1574-
0692(06)01001-4
Sattinger, M. (1975). Comparative Advantage and the Distributions of Earnings and Abilities.
Econometrica, 43(3), 455–468. http://doi.org/10.2307/1914276
Sattinger, M. (1979). Differential Rents and the Distribution of Earnings. Oxford Economic Papers,
31(1), 60–71.
Sattinger, M. (1993). Assignment Models of the Distribution of Earnings. Journal of Economic
Literature, 31(2), 831–880.
Sattinger, M., & Hartog, J. (2013). Nash bargaining and the wage consequences of educational
mismatches. Labour Economics, 23, 50–56. http://doi.org/10.1016/j.labeco.2013.03.002
Schönrock-Adema, J., Heijne-Penninga, M., Van Hell, E. A., & Cohen-Schotanus, J. (2009).
Necessary steps in factor analysis: enhancing validation studies of educational instruments. The
PHEEM applied to clerks as an example. Medical Teacher, 31(6), e226–e232.
http://doi.org/10.1080/01421590802516756
Teulings, C. N. (1995). The wage distribution in a model of the assingment of skills to jobs. Journal
of Political Economy, 103(2), 280–315.
Willis, R. J., & Rosen, S. (1979). Education and Self-Selection. Journal of Political Economy,
85(S5), S7.