title: determinants of bank performance in mexico ... · title: determinants of bank performance in...
TRANSCRIPT
Centre for Global Finance Working Paper Series (ISSN 2041-1596) Paper Number: 03/11
Title: Determinants of Bank Performance in Mexico: Efficiency or Market Power Author(s): J.G. Garza-Garcia Centre for Global Finance Bristol Business School University of the West of England Coldharbour Lane Bristol BS16 1QY Telephone: 0117 32 83906 Email: [email protected] Website: http://www.uwe.ac.uk/bbs/research/cgf/

Determinants of Bank Performance in Mexico: Efficiency or Market Power
Jesus G. Garza-Garciab
Banco de México
Abstract
The Mexican banking sector has experienced a process of consolidation which has caused concerns of possible collusion effects. This paper analyzes the determinants of bank performance in the Mexican banking sector for 2001-2009. Two market power hypotheses, Structure-Conduct-Performance (SCP) and Relative-Market-Power (RMP) alongside two variants of the Efficient-Structure (ES) hypotheses are tested in order to find out whether bank performance has been driven by market structural effects or by greater efficiency. The results state that bank profits have been determined by greater market share, confirming the RMP hypothesis. At the same time, the findings show that profits persist over time but adjust slowly to their natural (average) level, suggesting that the banking sector is not very competitive. Moreover, there is no evidence of a positive relationship between greater efficiency and bank profits. Finally, while capitalization levels increase bank profits, liquidity risk decreases them.
Keywords: Bank Performance, Data Envelopment Analysis (DEA), Generalized Method of Moments (GMM), Structure-Conduct-Performance (SCP), Efficient-Structure Hypothesis (ES).
b Direction of Financial Stability, Banco de México, Ave. 5 de mayo # 1 piso 1, Del. Cuauhtémoc, México, D.F. Phone: + 52 (55)523723175, Email: [email protected]. Centre for Global Finance at Bristol Business School (UWE). Email: [email protected].

I. Introduction
During the last few decades, the Mexican banking system has experienced a process of
financial liberalization which was focused on generating a more competitive and efficient
banking sector. As a result, the banking sector in Mexico has become more consolidated
mainly through an increased activity in M&As. Many of the largest banks in the country are
now foreign owned and there are concerns about a more concentrated banking sector and its
implications towards consumers. At the same time, the banking sector has experienced a
trend of growing profitability alongside positive trends for both capital adequacy and total
loans. It is important therefore, to understand if the banking sector profitability is being
driven by market power considerations with its possible effects on final consumers. On the
other hand, banks could have been profitable due to greater efficiency and therefore the
implications of market structural effects on bank profits could be discarded.
This paper analyzes two market power hypotheses: the Structure-Conduct-Performance
(SCP) hypothesis and the Relative-Market-Power (RMP) hypothesis alongside two variants
of the Efficient-Structure (ES) hypothesis in order to find out whether greater market power
or efficiency has a positive influence on bank profits. Efficiency estimates are elaborated by
applying the non-parametric Data Envelopment Analysis (DEA) method and two different
efficiency measures are obtained: namely X-efficiency (ESX) and Scale-efficiency (ESS).
To the extent that the market power hypotheses are proven then policies should be aimed at
limiting further M&As in the banking sector since they could be costly to consumers. On
the other hand, if the efficiency hypothesis is sustained then limiting M&As could be
socially costly. The study of these hypotheses has been widely analyzed in developed
countries but there are few studies focused on emerging economies. Moreover, there are
only a handful of studies which analyze these hypotheses in the Mexican banking sector,
and to best of my knowledge none of them apply non-parametric methodologies to estimate
efficiency scores.
This paper is divided into five sections. Section 2 presents the background of the Mexican
banking sector; Section 3 introduces the methodology and data used in this study; Section 4
presents the main findings; and finally Section 5 concludes.
II. Background
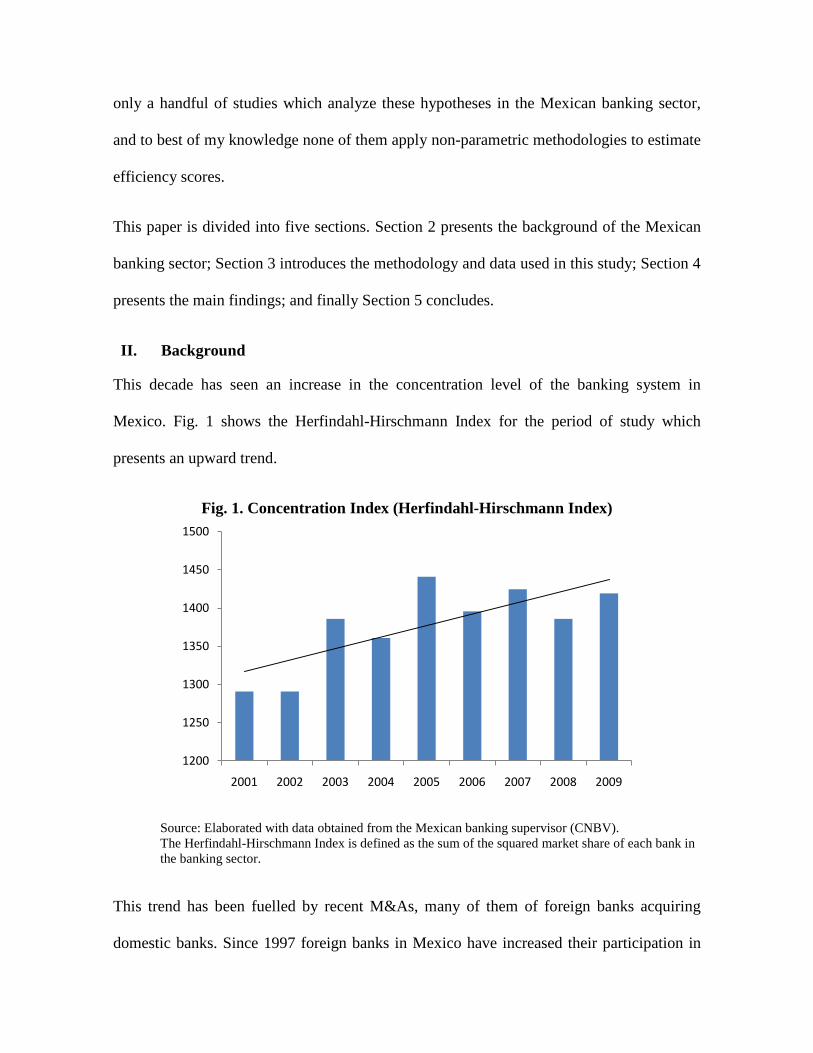
This decade has seen an increase in the concentration level of the banking system in
Mexico. Fig. 1 shows the Herfindahl-Hirschmann Index for the period of study which
presents an upward trend.
Fig. 1. Concentration Index (Herfindahl-Hirschmann Index)
Source: Elaborated with data obtained from the Mexican banking supervisor (CNBV). The Herfindahl-Hirschmann Index is defined as the sum of the squared market share of each bank in the banking sector.
This trend has been fuelled by recent M&As, many of them of foreign banks acquiring
domestic banks. Since 1997 foreign banks in Mexico have increased their participation in
1200
1250
1300
1350
1400
1450
1500
2001 2002 2003 2004 2005 2006 2007 2008 2009

the banking sector, by 2004 they controlled 82% of bank assets (Haber and Musacchio,
2004). In particular, a big rise in the HHI is observed from 2002 onwards. At the same
time, the profitability of the banking sector has increased for the period of study. Fig. 2
shows the return on assets (ROA) and return on equity (ROA) for the banks under study.
Fig. 2. Profitability Measures (ROA and ROE)
Source: CNBV. ROA is defined as total returns over total assets; ROE is defined as total return over total equity. As observed in Fig. 2, there is an upward trend in both profitability measures from 2003 to
2007, and then a sudden drop afterwards probably due to the worldwide financial crisis.
Moreover, both lineal measures of ROA and ROE show a general positive trend. In terms
of the degree of capitalization and the number of loans, Fig. 3 shows its trends.
0
2
4
6
8
10
12
14
16
18
20
0
0.2
0.4
0.6
0.8
1
1.2
1.4
2001 2002 2003 2004 2005 2006 2007 2008 2009
ROA ROE Linear (ROA) Linear (ROE)

Fig. 3. Capital adequacy (equity over total assets) and liquidity risk (total loans over total assets)
Source: Elaborated with data from CNBV.
It is clear from Fig. 3 that both measures of capitalization and liquidity have increased for
the period of study. In terms of the degree of capital adequacy, there is a downturn in this
ratio from 2002 to 2005 but a stiff recovery afterwards. With regards to the degree of loans
over assets there is a slight drop from 2004 to 2006 but a gradual increase soon after. These
ratios suggest that the banking system in Mexico has increased its capital level and has
increased its overall loan levels during the last decade.
35
36
37
38
39
40
41
42
43
2001
2002
2003
2004
2005
2006
2007
2008
2009
Liquidity risk
7
7.5
8
8.5
9
9.520
01
2002
2003
2004
2005
2006
2007
2008
2009
Capital adequacy

Fig. 4. Non-performing loans over total loans
Source: Elaborated with data from CNBV.
Fig. 4 shows the trend for the overall level of non-performing loans with respect to total
loans in the Mexican banking system. Although the ratio fell from 2001 to 2006 it has
increased afterwards, probably absorbing the financial crisis effects, which increased the
level of non-performing loans in the banking sector.
Overall, the degree of banking concentration has increased during the last decade alongside
a positive trend in the profitability measures of the Mexican banking sector. However, it is
important to test whether there is a direct structural effect on the performance of Mexican
banks or whether their profitability is driven by greater efficiency.
III. Literature Review
Earlier Industrial Organization studies have argued about a causal link between market
concentration and the performance of firms, supporting the collusion hypothesis of the
Structure-Conduct-Performance (SCP) paradigm (Goddard et al., 2001). According the
1.6
1.8
2
2.2
2.4
2.6
2.8
3
3.2
3.4
2001 2002 2003 2004 2005 2006 2007 2008 2009

collusion hypothesis, when few numbers of banks control the banking sector, it is easier for
them to collude (Goddard et al., 2001). Collusion can then be observed by higher interest
rates on loans, lower deposit rates and higher fees and commissions charged on consumers.
Moreover, firms may earn abnormal profits when banks enjoy large market shares and well
differentiated products (Shepherd, 1982). Berger (1995) suggests two market power
hypotheses to explain bank performance: Structure-Conduct-Performance (SCP), where
prices are less favorable to consumers due to more concentrated markets and the Relative-
Market Hypothesis (RMP), where banks with greater market share exercise higher pricing
resulting in greater than competitive profits (Berger, 1995). However, Berger (1995) also
states that in contrast to the market power hypotheses, profitability in banks can be driven
by greater managerial and scale efficiency. He proposes two alternative hypotheses: 1) X-
efficiency hypothesis (ESX), where firms with greater managerial efficiency or better
technologies have lower costs and therefore higher profits; 2) Scale-efficiency (ESS),
where firms produce at more efficient levels than others and therefore have lower unit costs
and higher profits (Berger, 1995). It is important to note that greater efficiency may
increase both profits and market share, thus resulting in a spurious relationship. It is
therefore necessary to test the market power and efficiency hypotheses altogether in order
to find which hypothesis determines greater profitability (Claeys and Vander Vennet,
2009). To the extent that market power hypotheses are proven then M&As should be
limited since they are setting unfavorable prices to consumers. On the other hand, if ES
hypotheses are proven, then M&As shouldn’t be limited since they are motivated by
efficiency gains, which are then transmitted as more favorable prices to consumers (Berger,
1995).

The empirical evidence on the market power and efficiency hypotheses is mixed and the
majority of the studies focus on developed countries. Gilbert (1984) reviewed over 44
banking studies and found that over half supported the SCP hypothesis. Lloyd-Williams
and Molyneux (1994) and Molyneux and Forbes (1995) find evidence supporting the SCP
paradigm for Spanish and European banks respectively. Berger and Hannan (1997) study
the US and find support for the SCP hypothesis and also test the “quiet life”1
In Mexico there are only a handful of studies which have analyzed the determinants of bank
performance. Arteaga (2001) studies the Mexican banking sector for the period 1995-1999
in order to test the SCP and ES hypotheses. His findings argue in favor of the SCP
hypothesis, finding a positive relationship between the concentration index and
profitability. However, he does not include any efficiency variables in the model.
Rodriguez-Montemayor (2003) studies the determinants of bank performance in Mexico for
the period 1995-2000 for 16 commercial banks. He tests both the SCP and ES hypotheses
and concludes that both help to determine bank performance. He suggests that regulatory
hypothesis.
They conclude that firms with greater market share are more inefficient. Other authors find
evidence of the ES hypothesis. Goldberg and Rai (1996) found evidence for the ESX
hypothesis in countries with low concentration ratios, but supported the RMP hypothesis
otherwise. Maudos (1998) finds support for both the X-efficiency and RMP hypotheses in
Spain for the period 1990-1993. Berger (1995) shows that X-efficiency is consistently
associated with higher profits for a large sample of US banks. More recently, Fu and
Heffernan (2005) test the SCP hypothesis for China and find support it but only before
economic and financial reforms were imposed (before 1992).
1 The “quiet life” hypothesis suggests that firms with greater market shares have no incentives to become more cost efficient, even at the expense of somewhat lower profits (Berger and Hannan, 1997).

entities should limit M&As only when efficiency gains are low and when the concentration
levels reduce the degree of market competition. In order to measure the efficiency variable
he uses two financial ratios: net interest margin over financial income and the inverse of the
cost over income ratio. Guerrero and Villalpando (2003) analyze whether the SCP, RMP or
ES hypotheses explain bank performance for 18 banks in Mexico during 1997-2005. They
obtain X-efficiency and Scale-efficiency estimators by applying the parametric Distribution
Free Approach (DFA). Their findings suggest that the market power hypotheses (namely
SCP and RMP) are responsible for explaining bank profitability in Mexico. As seen above,
there are only a few studies which have studied the market power and efficiency hypotheses
for the Mexican banking sector.
IV. Methodology and Data
Methodology
The methodology in this study follows two steps: first, the two efficiency estimators (ESX
and ESS) are computed by applying the non-parametric Data Envelopment Analysis (DEA)
method. Afterwards, a dynamic panel system GMM regression is run, including the market
power and efficiency variables, in order to obtain the main determinants of bank
profitability.
Data Envelopment Analysis
Data Envelopment Analysis (DEA) is a mathematical program which is used to develop
relative efficiency measures by generating an efficiency frontier and measuring the distance
of a Decision Making Unit (DMU) to this frontier. Any measurable distance between the

relative efficiency measures of each DMU with the efficiency frontier is considered as
inefficiency, whereas a DMU that lies alongside the efficiency frontier is considered fully
efficient. The DEA methodology follows an input-oriented (intermediation) approach since
commercial banks are considered as acting as financial intermediaries following previous
studies (e.g. Hasan and Morton, 2003; Ray, 2007; Berger at al., 2009; among others). Thus,
the DEA input-oriented methodology seeks to identify any levels of inefficiency as a
proportional reduction of inputs (Casu and Molyeneux, 2003).
The original DEA model was proposed by Charnes et al. (1978) and assumed that the
model followed Constant Returns to Scale (CRS). However, some authors argue that CRS
is appropriate only when all DMUs are operating at an optimal scale. However, factors such
as imperfect competition and constraints on finance may impede a DMU from operating at
an optimal scale (Casu and Molyneux, 2003). Banker et al. (1984) suggested the alternative
Variable Returns to Scale (VRS) model which incorporates these factors into the model.
The VRS linear programme can be defined as:
011́
00
,min ,
≥=
≥−≥+−
λ
λθλ
θλθ
NXx
Yyst
i
i
(1)
Where θ is a scalar which represents the efficiency score for the ith bank and will range
from 0 to 1, λ is a vector of 1×N constants, y is the output vector for the i-th DMU, Y is
the matrix of outputs of the other DMUs and the number of DMUs ranges from i=1…n ; x
is a vector of input of the i-th DMU and X is the matrix of input of the other DMUs. When
the convexity constraint λ =1 is omitted from (1) we obtain the CRS based efficiency

scores. On the other hand, SE = CRS / VRS, and when SE = 1 then the bank is efficient
under both CRS and VRS, when SE < 1 the bank is not scale efficient. This paper computes
the efficiency scores considering VRS and SE, which are interpreted as managerial
efficiency (ESX) and Scale-efficiency (ESS) respectively.
The selection of inputs and outputs was considered by analyzing previous studies (Sealey
and Lindley, 1977; Becalli et al., 2006). The study considers two inputs: the total costs
(personnel expenses, administrative expenses and interest rate expenses) and total deposits,
and two outputs: total loans and other earning assets. Table 1 presents the descriptive
statistics of the inputs and outputs selected.
Table 1. Input/output descriptive statistics (in millions of pesos)
Mean Std. Dev. Min Max Inputs
Tot. Costs 5,223.691 10,277.26 3.397 76,237.48 Deposits 57,448.27 102,862.5 .0189 556,147.3
Outputs Loans 49,140.21 87,740.23 0 526,530.4 Other Earning Assets
52,093.58 96,881.81 0.022 572,355.9
Source: CNBV (banking supervisor in Mexico).
Generalized Method of Moments (GMM)
After computing the ESX and ESS efficiency scores, the next step is to run a dynamic panel
data Generalized Method of Moments (GMM) in order to test the market power and
efficiency hypotheses. One of the main advantages of using GMM is that it controls for
endogeneity in the model. According to Roodman (2009), system GMM estimators are
suitable for panels with large number of observations and short-periods of time. Moreover,

it gives the best estimator when dealing with explanatory variables which are not strictly
exogenous.
The exogenous variables, the lagged dependent variable and the lagged endogenous
variables are used as instruments in the system GMM equation. The equation is defined as:
itiitititit
itititititttiitit
INTGDPCPIESSESXCAPNPLLOATAMSHHI
νµββββ
ββββββπβαπ
+++++
++++++++= −
111098
7654321,1 (2)
where:
π = is a measure of bank performance, e.g. ROA or ROE. α = is the constant term. HHI = is the measure of concentration. MS = is a measure of market share. LOATA = is a measure of liquidity risk. NPL = is a measure of credit risk. CAP = is a measure of capital adequacy. ESX = is a measure of X-efficiency. ESS = is a measure of Scale-efficiency. CPI = is the annual inflation rate. GDP = is the annual GDP growth. INT = is a measure of interest rate volatility. µ = unobserved bank-specific time invariant effect. ν = a disturbance effect independent across banks.
The coefficient of the lagged dependent variable, 1, −tiπ , represents the level of profit
persistence. According to Berger at al. (2000), the persistence of profits in banks is the
tendency of a firm remaining in the same profit distribution. “Without market power,
relatively high performance by a firm would be eliminated reasonably quickly as other
firms enter its local market, imitate its transparent techniques or strategies, bid for its most
profitable customers, or bid up the price of its managerial talent” (Berger et al., 2000: pp.
1). Athanasoglou et al. (2005) argue that the coefficient of the lagged profitability measure,

in this case 1β , is the speed of adjustment to equilibrium profits. They state that a value of
this coefficient between 0 and 1 suggests that profits persist, but they eventually return to
their natural level. A value close to 0 suggests that the speed of adjustment is very high
meaning that the banking industry is highly competitive, and when the value is close to 1,
the speed of adjustment is very low suggesting an industry with a low competitive
structure.
The HHI is the measure of the degree of market concentration (in terms of assets) and if a
positive relationship is found, then the SCP hypothesis would be accepted. The MS is the
market share in terms of assets and a positive relationship with bank profitability would
suggest the acceptance of the RMP hypothesis (Berger, 1995). From the remaining bank-
specific variables, LOATA is a measure of liquidity risk and the literature has found mixed
evidence on the expected sign of this variable with regards to profitability. Garcia-Herrero
et al. (2007) argue that greater loans imply more interest revenue but overall higher risks.
However, they also acknowledge that a higher number of loans have higher operational
costs which need to be originated, serviced and monitored. Therefore, they state that
profitability should increase as long as interest rates on loans are liberalized and the bank
applies mark-up pricing (Garcia-Herrero et al., 2007). NPL is a measure of credit risk and a
negative relationship is expected since non-performing loans are costly to banks. Garcia-
Herrero et al. (2007) argue that poor asset quality reduces bank profits as it reduces the
number of profitable loans that could be used. Bourke (1989) and Miller and Noulas (1997)
find that a higher accumulation of unpaid loans contributes to lower banking returns. CAP
is a measure of capital adequacy and the literature mainly finds a positive relationship with
regards to bank profitability. According to Garcia-Herrero et al. (2007) the degree of

capitalization could affect bank profitability through several channels: a) greater capital
may increase the share of loans which increases profitability, b) banks with a high franchise
value have incentives the remain well capitalized, c) greater amount of capital is an
important parameter of creditworthiness, and d) well capitalized banks need to borrow less
than their counterparts, thus reducing their funding costs. The empirical evidence has found
a positive relationship between CAP and bank profitability in the US (Berger, 1995),
Europe (Goddard et al., 2004b), 80 industrialized and emerging economies (Demirguc-
Kunt, 1999), Mexico (Guerrero and Villalpando, 2009) among others.
The efficiency estimators, ESX and ESS, if positive should support the ES hypothesis
where bank profitability is driven by greater banking efficiency (Berger, 1995). Turning to
the macroeconomic variables, CPI is the inflation rate and the expected sign is ambiguous.
According to Perry (1992) the inflation rate should affect the real value of costs and
revenue in banks depending on whether it is anticipated by the bank. GDP is the measure of
GDP growth and a positive relationship is expected if bank profits are correlated with the
business cycle (Demirguc-Kunt and Huizinga, 2000; and Bikker and Hu, 2002). The
measure for interest rate volatility, INT, measures the risk of market interest rates.
According to many authors, interest rate volatility fosters bank profits since banks transfer
these risks to consumers (Ho and Saunders, 1981; and, Maudos and Fernandez de Guevara,
2004) particularly in developing countries (Demirguc-Kunt and Huizinga, 1999). Thus a
positive sign is expected.

Data
The data for this study was obtained from the Mexican banking supervisor (CNBV) and
from the International Financial Statistics from the IMF. The bank-specific data obtained
from the CNBV is monthly and the IFS data has a yearly periodicity. Table 2 presents the
description of the variables used in this study.
Table 2. Description of Variables Variables Description
ROA Measure of bank performance. Return on average assets. ROE Measure of bank performance. Return on average equity. HHI Measure of degree of concentration. Herfirndahl-Hirschmann
Index: the sum of squared market shares (assets) in each period.
MS Market share in terms of assets. LOATA Measure of liquidity risk. Loans over total assets. NPL Measure of credit risk. Non-performing loans over total
loans. CAP Measure of capital adequacy. Total capital over total assets. ESX Measure of X-efficiency (managerial efficiency). ESS Measure of Scale-efficiency. CPI Inflation rate. Annual change in the Consumer Price Index. GDP GDP growth. Annual GDP growth. INT Interest rate volatility. Annual standard deviation of the
money market interest rate.
Table 3 shows the description of the variables used in this study.
Table 3. Descriptive Statistics Mean Std. Dev. Min Max ROA .939 1.25 -5.902 5.612 ROE 13.405 15.141 -99.146 112.527 HHI 1 385.266 73.924 985.308 1 489.999 MS 5.573 7.226 .116 25.7 LOATA 39.972 15.575 10.318 88.813 NPL 2.565 2.035 .007 11.247 CAP 8.229 4.55 .325 32.746 ESX .876 .146 .4 1 ESS .884 .13 .465 1

CPI 6.223 1.497 4.276 8.546 GDP 1.564 3.23 -6.538 4.933 INT .77 .647 .144 4.136
From Table 2 there are interesting insights on the descriptive statistics of the variables used
in this study. The ROA and ROE show averages of 0.94 and 13.41 respectively; the HHI
shows a minimum value of 985 compared to its highest value of 1 490; the market share
average is 5.6% although with a minimum value is 0.12% and a highest value of 26%. The
efficiency scores show inefficiencies averages of 12% for both efficiency scores for the
period of study. Finally, the macroeconomic variables show a reduction in the CPI from
2001 (8.5%) to 2009 (4.3%); GDP which varies from 4.9% to -6.5%; and interest rate
volatility which varied from 0.144 to 4.1.
V. Results
The results in this study are divided into two, first the estimation of the efficiency scores,
both ESX and ESS, and then running the system GMM dynamic panel data regression
including the efficiency scores and market power variables. Fig. 5 presents the trends for
the ESX and ESS efficiency scores.

Fig. 5. X-efficiency and Scale-efficiency estimators
The efficiency variables are the average efficiencies of all the banks each year.
Fig. 5 above shows a clear positive trend when considering X-efficiency, from
approximately 0.80% (2001) to 0.93% (2009). On the other hand, the Scale-efficiency
estimator shows a decreasing trend, from 0.90% (2001) to 0.83 (2008), but a swift recovery
to 0.88% (2009). If compared to other studies, Guerrero and Negrin (2006) find
inefficiency averages for the period 1997-2004 of 15% and 19% for ESX and ESS
respectively. In this study the inefficiency averages for the period 2001-2004 are 11% and
16% for ESX and ESS respectively.
The next step is to run the system GMM dynamic panel data. Table 4 shows the results of
this regression where ROA and ROE are the dependent variables.
Table 4. System GMM dynamic panel data ROA
(1) ROA (2)
ROE (3)
ROE (4)
L.DEP .823*** .799*** .937*** .97*** HHI .001 .0002 .003 .002 MS .088* .089* 1.043* 1.102* LOATA -.012* -.013** -.108 -.105 NPL .057 .049 .775** .132
0.79
0.81
0.83
0.85
0.87
0.89
0.91
0.93
0.95
2001 2002 2003 2004 2005 2006 2007 2008 2009
ESX ESS
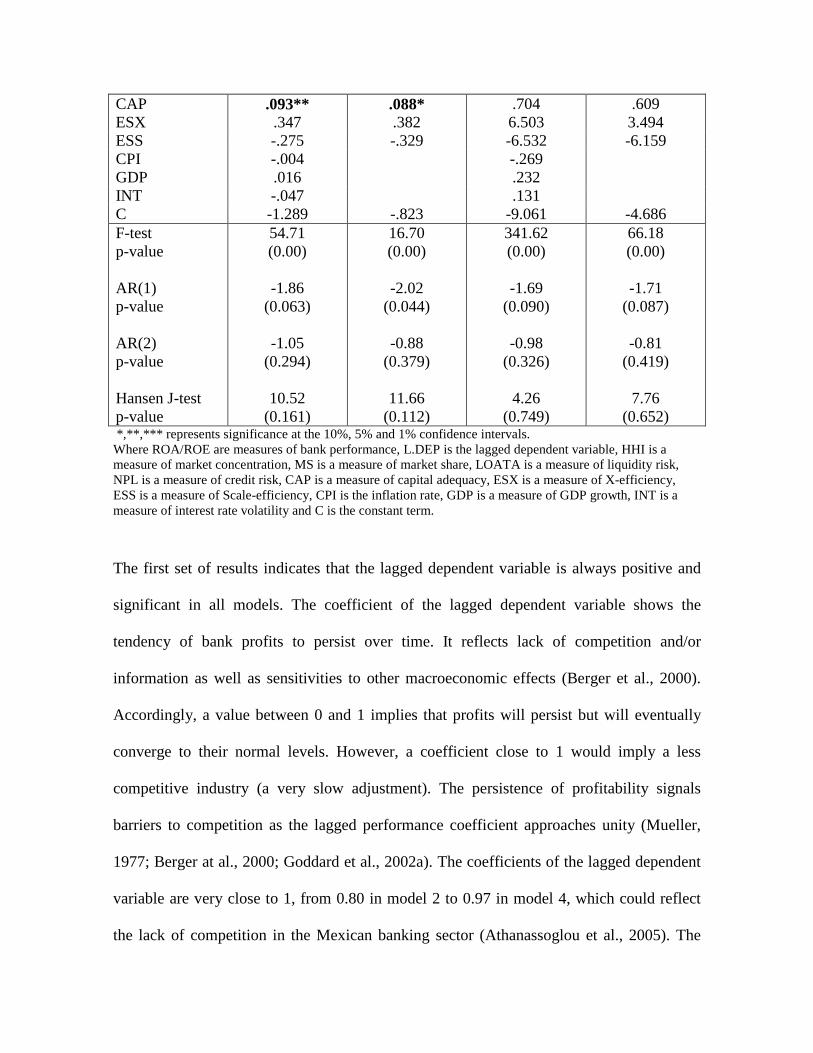
CAP .093** .088* .704 .609 ESX .347 .382 6.503 3.494 ESS -.275 -.329 -6.532 -6.159 CPI -.004 -.269 GDP .016 .232 INT -.047 .131 C -1.289 -.823 -9.061 -4.686 F-test p-value AR(1) p-value AR(2) p-value Hansen J-test p-value
54.71 (0.00)
-1.86
(0.063)
-1.05 (0.294)
10.52
(0.161)
16.70 (0.00)
-2.02
(0.044)
-0.88 (0.379)
11.66
(0.112)
341.62 (0.00)
-1.69
(0.090)
-0.98 (0.326)
4.26
(0.749)
66.18 (0.00)
-1.71
(0.087)
-0.81 (0.419)
7.76
(0.652) *,**,*** represents significance at the 10%, 5% and 1% confidence intervals. Where ROA/ROE are measures of bank performance, L.DEP is the lagged dependent variable, HHI is a measure of market concentration, MS is a measure of market share, LOATA is a measure of liquidity risk, NPL is a measure of credit risk, CAP is a measure of capital adequacy, ESX is a measure of X-efficiency, ESS is a measure of Scale-efficiency, CPI is the inflation rate, GDP is a measure of GDP growth, INT is a measure of interest rate volatility and C is the constant term.
The first set of results indicates that the lagged dependent variable is always positive and
significant in all models. The coefficient of the lagged dependent variable shows the
tendency of bank profits to persist over time. It reflects lack of competition and/or
information as well as sensitivities to other macroeconomic effects (Berger et al., 2000).
Accordingly, a value between 0 and 1 implies that profits will persist but will eventually
converge to their normal levels. However, a coefficient close to 1 would imply a less
competitive industry (a very slow adjustment). The persistence of profitability signals
barriers to competition as the lagged performance coefficient approaches unity (Mueller,
1977; Berger at al., 2000; Goddard et al., 2002a). The coefficients of the lagged dependent
variable are very close to 1, from 0.80 in model 2 to 0.97 in model 4, which could reflect
the lack of competition in the Mexican banking sector (Athanassoglou et al., 2005). The

HHI shows no significance in any case so the SCP hypothesis is rejected in all cases.
Nevertheless, the MS coefficient is always positive and significant, accepting the RMP
hypothesis. Therefore, banks with greater market share obtain higher profits by pricing
above competitive levels. At the same time, the ESX and ESS variables are not significant
in any case, thus rejecting the ES hypothesis. Accordingly, bank profits are not determined
by greater managerial and/or scale efficiencies. A similar result is obtained by Guerrero and
Villalpando (2009) when analyzing the determinants of bank performance in Mexico,
accepting both market power hypotheses and rejecting the ES hypothesis.
Turning to the remaining bank-specific variables, LOATA is negative and significant in
models 1 and 2. Thus, greater liquidity risk reduces bank profits in Mexico. According to
Garcia-Herrero et al. (2007) greater amount of loans do not necessarily imply greater
revenues, since these loans have to be serviced and monitored. Thus, profitability should
increase when the revenue from these loans is greater than the cost of operating them. NPL
is only significant and positive in model 3, suggesting that credit risk increases profits,
maybe by transferring this cost to the final consumer. Finally, CAP is positive and
significant as expected since greater capital in banks reduces its funding costs and releases
them more resources to find profitable investments. Similarly, Guerrero and Villalpando
(2009) find a positive relationship between CAP and bank profitability in their study of the
Mexican banking sector. The macroeconomic variables do not show any significance
whatsoever, thus the banking sector performance is not affected by its macroeconomic
environment. Some authors have argued that the macroeconomic environment is not
necessarily correlated with the financial sector, a result which can interpreted with the main
the findings in this study.

VI. Conclusions
The Mexican banking sector has experienced a process of financial liberalization during the
last decades which was focused on generating a more competitive and efficient banking
sector. As a result, the banking sector has become more consolidated and the degree of
market concentration has increased. At the same time, the banking sector has experienced
growing profitability trends. As such, it is important to determine if bank profits have
increased due to market power considerations or if banks have become more efficient and
therefore more profitable. This paper tests two market power (Structure-Conduct-
Performance and the Relative-Market-Power) hypotheses and two variants of the Efficient-
Structure (X-efficiency and scale efficiency) hypothesis in order to find whether bank
performance is driven by market power or by efficiency considerations. In order to estimate
the efficiency variables, the non-parametric Data Envelopment Analysis (DEA) method is
applied, and then a system GMM regression is run including the market power and
efficiency variables.
The first set of results suggest that the banking sector in Mexico has experienced average
inefficiencies of around 12% for both measures of efficiency estimated for the period of
study. Moreover, the results indicate that the banking sector has become more X-efficient
during the last decade. The second set of results indicate that profits persist and that they
adjust to their natural level (average) slowly, which suggests that the banking sector is not
very competitive (Athanassoglou, 2005). Furthermore, there is evidence that greater market
share increases bank profits, accepting the RMP hypothesis. However, the concentration
index is never significant rejecting the SCP hypothesis. On the other hand, the efficiency
variables are not significant in any case so there is no evidence to support the ES

hypothesis. Finally, while the degree of capitalization increases bank profits, liquidity risk
decreases them.
References
Arteaga, J. C. (2001) “Poder de mercado o eficiencia: Origen de las utilidades del sistema bancario mexicano de 1995 a 1999.” Ensayos, 20, 35-48. Athanassoglou, P., S. Brissimis and M. Delis (2005) “Bank-Specific, Industry-Specific and Macroeconomic Determinants of Bank Profitability.” Bank of Greece Working Paper No. 25. Beccalli, E., B. Casu and C. Girardone (2006) “Efficiency and Stock Performance in European Banking.” Journal of Business Finance and Accounting, 33, 245- 262.
Berger, A.N. (1995) “The Profit-Structure Relationship in Banking – Tests of Market-Power and Efficient-Structure Hypotheses.” Journal of Money, Credit and Banking, 27, 404-431. Berger, A.N. and T.H. Hannan (1997) “Using Efficiency Measures to Distinguish among Alternative Explanations of the Structure-Performance Relationship in Banking.” Managerial Finance, 23, 6-31. Berger, A., I. Hasan and M. Zhou (2009) “Bank Ownership and Efficiency in China: What Will Happen in the World's Largest Nation?” Journal of Banking and Finance, 33, 113-130. Berger, A. N., Seth, B. D., Covitz, D. M. and Hancock, D. (2000) “Why are Bank Profits so Persistent? The Roles of Product Market Competition, Informational Opacity, and Regional/Macroeconomic Shocks.” Journal of Banking & Finance, 24, 1203-1235.
Bikker, J.A. and H. Hu (2002) “Cyclical Patterns in Profits, Provisioning and Lending of Banks and Procyclicality of the new Basel Capital Requirements.” BNL Quarterly Review, 221, 143-175. Bourke, P. (1989) “Concentration and Other Determinants of Bank Profitability in Europe, North America and Australia.” Journal of Banking and Finance, 13, 65-79.
Casu, B. and P. Molyneux (2003) “A Comparative Study of Efficiency in European Banking.” Applied Economics, 35, 1865-1876.
Charnes, A., W.W. Cooper and E. Rhodes (1978) “Measuring the Efficiency of Decision Making Units.” European Journal of Operational Research, 2, 429-444. Claeys, Sophie and Rudi Vander Vennet (2008) “Determinants of Bank Interest Margins in Central and Eastern Europe: A Comparison with the West.” Economic Systems, 32.

Demirguc-Kunt, A. and H. Huizinga (1999) “Determinants of Commercial Bank Interest Margins and Profitability: Some International Evidence.” World Bank Economic Review, 13, 379-408. Demirguc-Kunt, A. and H. Huizinga (2000) “Financial Structure and Bank Profitability.” World Bank Working Paper No. 2430. Fu, X. and S. Heffernan (2005) “China: The Effects of Bank Reform on Structure and Performance.” Cass Faculty of Finance Working Paper #WP-FF-19. Garcia-Herrero, A., S. Gavilá and D. Santabárbara (2009) “What Explains the Low Profitability of Chinese Banks.” Banco de España Working Paper No. 0910. Gilbert, Alton (1984) “Studies of Bank Market Structure and Competition: A Review and Evaluation.” Journal of Money, Credit, and Banking, 16, 17-44. Goddard, J., Phil Molyneux, and J.O.S. Wilson (2001) European banking: Efficiency, Technology and Growth, Wiley & Sons Ltd, England.
Goddard, J., P. Molyneux and J.O.S. Wilson (2004a) “Dynamics of Growth and Profitability in Banking.” Journal of Money, Credit and Banking, 36, 1069-1090. Goddard, J., P. Molyneux, P. and J.O.S. Wilson (2004b) “The Profitability of European Banks: A Cross-Sectional and Dynamic Panel Analysis.” Manchester School, 72, 363-381. Goldberg, L.G. and A. Rai (1996) “The Structure-Performance Relationship for European Banking.” Journal of Banking and Finance, 20, 745-771. Guerrero, R. and J. Negrin (2006) “Eficiencia del Sistema Bancario Mexicano 1997-2004: Una Estimación Dinámica.” Monetaria, 29.
Guerrero, R. and M. Villalpando (2009) “Rentabilidad, concentración y eficiencia en el sistema bancario mexicano.” El Trimestre Económico, 76, 237-263. Haber, S. and A. Musacchio (2004) “Foreign Banks and the Mexican Economy, 1997-2004.” Stanford Center for International Development, Working paper No. 228. Hasan, I. and K. Marton (2003) “Development and Efficiency of the Banking Sector in a Transitional Economy: Hungarian Experience.” Journal of Banking and Finance, 27, 2249-2271.
Ho, T. and A. Saunders (1981) “The Determinants of Bank Interest Margins: Theory and Empirical Evidence.” Journal of Financial and Quantitative Analysis, 16, 581–600. Lloyd-Willians, D.M., and P. Molyneux (1994) “Market Structure and Performance in Spanish Banking.” Journal of Banking and Finance, 18, 433-443.

Maudos, J. (1998) “Market Structure and Performance in Spanish Banking Using a Direct Measure of Efficiency.” Applied Financial Economics, 8, 191-201. Maudos, J. and J. Fernandez de Guevara (2004) “Factors Explaining the Evolution of the Interest Margin in the Banking Sectors of the European Union.” Journal of Banking and Finance, 28, 2259-2281. Miller, S.M. and A.G. Noulas (1997) “Portfolio Mix and Large-Bank Profitability in the USA.” Applied Economics, 29, 505-512. Molyneux, P. and W. Forbes (1995) “Market Structure and Performance in European Banking”Applied Economics, 27, 155-159. Mueller, D. (1977) “The persistence of profits above the norm.” Economica, 44, 369-380. Perry, P. (1992) “Do Banks Gain or Lose from Inflation.” Journal of Retail Banking, 14, 25-30. Ray, S. (2007) “Are Some Indian Banks Too Large? An Examination of Size Efficiency in Indian Banking.” Journal of Productivity Analysis, 27, 41-56. Rodríguez-Montemayor, E. (2003) “Concentración industrial y rentabilidad de la banca en México: Evaluación posterior a la crisis de 1995.” El Trimestre Económico, 70, 371-404. Roodman, D. (2009) “How to do xtabond2: An Introduction to Difference and System GMM in Stata.” Stata Journal, 9, 86-136. Sealey, C.W. and J.T. Lindley (1977) “Inputs, Outputs, and Theory of Production Cost at Depository Financial Institutions.” Journal of Finance, 32, 1251-1266.
Shepherd, W.G. (1982) “Economies of Scale and Monopoly Profits,” in Industrial Organization, Antitrust, and Public Policy, edited by J.V. Craven. Boston: Klumer Nijhoff.