connected - diversified financial services group
TRANSCRIPT

Connected Growth through connected solutions
Business Luncheon with Key Institutional Investors
5 May 2014

Presentation Outline
2
Introduction
1
Macroeconomic & Regulatory Environment Overview
2
FBN Holdings Performance Review
3
FBN Holdings Strategic Initiatives
4

• Established 120 years ago, FirstBank is the oldest bank in West Africa
• FirstBank is the #1 banking franchise in Nigeria by total assets, loans,
deposits, and branches
• The Group employs about 9,849 staff, has over 8.5 million active
customer accounts, through about 760 branches and over 2,437 ATMs
• Through its subsidiaries, the Group offers products and services across
commercial banking in eleven countries. Other business groups include
investment banking, insurance and microfinance businesses.
• During 2012, the Group underwent a restructuring to establish a holding
company structure comprising four business groups
• FBN Holdings is listed on the Nigerian Stock Exchange with a market
capitalisation of c.N1.6 trillion
Introduction to FBN Holdings Plc
Source: Company data, IFRS financial statements and Bloomberg
1 Includes N(3.2)bn attributable to Other Financial Services.
2 Includes the recently completed acquisition of Oasis Insurance
3
Business Description Group Structure
Business Split
Revenue by Business Group PBT by Business Group
Total: N395bn Total: N91bn1
FBN Holdings PLC
FBN
Microfinance
Bank Limited
FBN Capital
Limited
First Trustees
Nigeria Limited
First Funds
Limited
FBN Securities
Limited
First Bank of
Nigeria Limited
FBN Bank (UK)
Limited
Banque
International
De Credit (BIC)
First Pension
Custodian
Limited
FBN
Mortgages
Limited
FBN
Insurance2
ICB Ghana
ICB Gambia
ICB Guinea
ICB Sierra
Leone
ICB
West A
frica
FBN Capital
Asset
Management
Limited
FBN Insurance
Brokers Limited
Commercial Banking 93.7%
IBAM 4.9%
Insurance 0.9%
Other Financial Services
0.5%
Commercial Banking 94.9%
IBAM 7.4%
Insurance 1.2%

4
Macroeconomic & Regulatory Environment Overview
2

OVERVIEW SUMMARY/
OUTLOOK STRATEGY BUSINESS GROUPS FINANCIAL REVIEW APPENDIX
Stable macroeconomic environment buoyed by ongoing reforms……..
Macro Factors Impact on FBN Holdings
GLOBAL
• Global economic growth was revised to 2.9% as at October 2013, dipping by 0.3% in comparison to 2012; emerging and developing markets remain key drivers with improvements in advanced economies
• Global oil prices closed at $107.67 per barrel in 2013 (FY 2012: $109.28) averaging $105.94 per barrel in 2013
• The US Federal Reserve announced plans to taper the quantitative easing program to bring the stimulus to an end in 2014
√ Gross earnings growth of +7% in 2013 in spite of challenging regulatory and operating environment
NIGERIA
• Real GDP growth estimated at 6.2% (FY 2012: 6.6%), as non-oil sector continued to drive growth through agriculture, manufacturing , building & construction while oil production declined to 1.88mbpd as at end of the year as a result of increased oil theft and pipeline vandalisation
• Steady decline in inflation rate all through the year closing at 8.0% as at Dec 2013 (2013 av: 8.5%, Dec 2012: 12.0%)
• External reserves dipped by 1.3% y-o-y to close at $43.6bn at end of FY 2013 (FY 2012: $44.2bn) albeit reaching its peak of $48.9bn in April 2013
• High interest rate environment sustained as liquidity further tightened and exchange rate came under pressure
• Progress with power reforms as the Federal Government transferred assets to new owners
√ Continuous improvement in inflation enhancing return on investments
× Growth in cost of funds × Reduction in loanable funds × Reduction in government revenue × Increased government borrowing
requirements
BANKING
• Commencement of the CBN’s revised bank charges in April 2013 • Status quo maintained on monetary policy for first half of 2013 but tightened from Q3
with sterilisation of 50% (upward review to 75% in Q1 2014) of eligible local currency public sector deposits as CRR on public deposits (previously 12%), leading to a withdrawal of an estimated N1tn from the banking system as at Dec 2013
• Extension of CBN cashless policy to 5 states of the Federation and FCT (Abia , Anambra, Kano, Ogun, Rivers and Abuja) in Q3 2013
• Re-introduction of Retail Dutch Auction System to curb round tripping on the exchange rate
× Increased funding cost × Pressure on yields & NIMs × Pressure on interest income × Pressure on non fixed income
5

Macroeconomic trend supported by a growing population…….. The Largest and Most Diversified Economy in Sub-Saharan Africa
Source: IMF WEO database as of 8-Apr-2014
GDP Growth (%) 2013-18E Real GDP Growth ($bn)
Nigerian Gross Value Added Breakdown by
Industry (2013) Population Age Structure (2013)
6.6%
6.3%
7.1% 7.0%
6.9%
2012 2013 2014E 2015E 2016E
0-14 yrs 46.7%
15-24 yrs 9.8%
25-54 yrs 33.1%
55-64 yrs 4.5%
65+ yrs 5.9%
Agriculture
34.5%
Mining & Quarrying/
Manufacturing
36.0%
Wholesale and
Retail Trade
19.6%
$135bn
$80bn
$50bn
$19bn
$18bn
$17bn
$14bn
$14bn
$12bn
$10bn
Nigeria
South Africa
Angola
Ethiopia
Kenya
Ghana
Tanzania
Côte d'Ivoire
Zambia
Cameroon
Other
9.9%
6

7
FBN Holdings Performance Review
3

The impressive growth trend in the last planning cycle hampered by regulatory challenges in 2013
FY……….
8
Summary of industry policy changes 2013 Financial Impact Remedial Steps
Upward Review of CRR — 75% on Public Sector Deposits — 12% on Private Sector Deposit
Upward Review of Interest of Savings Account — Minimum of 30% of MPR – 3.6%
Gradual Phase out of COT — From N5 to N3 in 2013 and N2 in 2014
Removal of Charges on ATM Transactions
Increase in AMCON Levy — from 0.3% to 0.5% of Total Assets; plus — 1/3 of Contingencies
1
2
3
4
5
Loss of N3.4bn in COT income in 2013
Net Payout for On-US transactions of N2bn in 2013
Increase in AMCON fee from N7.4bn in 2012 to N13.9bn in 2013
Increased interest cost of N9.2bn as a result of increased interest from 1% to 3.6%
N389b of FBN deposit sterilized, earning 0% (assets with yield of 13%)
Loss of N7bn in revenue
An estimated N32.5bn revenue loss in 2013 as a result of regulatory headwinds
Remodeling of the public sector business to include related businesses e.g. Contractors
Aggressively driving value chain banking (Transaction Banking)
Deepening and expanding the scope of commercial banking business to include greater focus on middle market
Geographical diversification of earnings base by increasing contributions from regional banking subsidiaries and trade finance transaction through FBN Bank UK
Improving workforce productivity/ Earnings per employee measurement
Implementation of cost containment measures

In spite of the regulatory headwinds, FBN Holdings recorded significant growth across all
financial metrics………
9
Business Growth, 2009 - 2013
Total Assets (N tn) 2.2 2.4 2.9 3.2 3.9
2009 2010 2011 2012 2013
1.1 1.2 1.3 1.5 1.8
1.3 1.4 2.0 2.4 2.9
12 34 40 92 91
Gross
Earnings (N bn)
Loans (N tn)
Deposits (N tn)
PBT (N bn)
+13%
+20%
+22%
+66%
194 232 274 369 396
Significantt revenue
loss due to CBN
policy changes (tariff /
charges, CRR, etc.)
+15%
ROE 4% 10% 13% 19% 16%
+43%
CAGR

Solid Financial Performance and Growth Metrics Low Operating Leverage and Strong, Resilient Performance
Source: Company data and IFRS financial statements
Cost Income Ratio Net Interest Margin
RoAE Non-Interest Income as a % of Operating Income
Non-interest Income Profit after Tax and Return on Average Equity
Net Interest Income and Margin Operating Expenses and Cost Income Ratio
8.8% 8.0% 7.7% 64.3 % 62.5% 66.0%
N226.6bn N230.1bn
N58.8bn
Dec-2012 Dec-2013 Q1-2014
N193.5bn N185.0bn
N51.5bn
Dec-2012 Dec-2013 Q1-2014
24.5% 22.6% 24.8% 19.0% 15.5% 17.9%
N73.9bn N67.0bn
N19.3bn
Dec-2012 Dec-2013 Q1-2014
N76.8bn N70.6bn
N21.6bn
Dec-2012 Dec-2013 Q1-2014
10

…………..driven by Stable Funding, Capital Base and Liquidity Position
Source: Company data and IFRS financial statements
1 For Commercial Banking Group
34% 32% 30%
23% 23% 24%
20% 24% 27%
23% 21% 19%
N2,395bn N2,929bn N2,855bn
Dec-2012 Dec-2013 Q1-2014
Current Savings Term Domiciliary
47.1% 44.2%
38.0%
Dec-2012 Dec-2013 Q1-2014
17.5%
15.0% 14.4%
19.1%
17.7% 16.8%
Dec-2012 Dec-2013 Q1-2014
Tier 1 Ratio Capital Adequacy Ratio
66.0% 61.9%
66.3%
Dec-2012 Dec-2013 Q1-2014
Liquidity Ratio Deposit Evolution
Capital Ratios1 Loan / Deposit Ratio
11

……..and Prudent Asset, Liability and Risk Management Policies Robust Loan Book Quality Supported by Best-in-Class Control Environment and Strong Monitoring Process
1 General Includes: capital market (3.3%), general commerce (2.6%), real estate (2.2%), manufacturing (0.9%), construction (0.5%), government (0.2%), transportation and
storage (0.1%), finance and insurance (0.1%), hotels & leisure, logistics, religious bodies, retail others.
2 Including Statutory Credit Reserve.
NPL Sector Exposure (First Bank of Nigeria Only) NPL Ratio (First Bank of Nigeria Only)
Coverage Ratio² Cost of Risk
General¹ 42.5%
Information and Communication
27.3%
Oil & Gas - Downstream
11.2%
Consumer 8.6%
Agriculture 5.3%
Oil & Gas - Services 5.1%
2.8% 3.1%
3.9%
Dec-2012 Dec-2013 Q1-2014
133.1%
97.7% 84.2%
Dec-2012 Dec-2013 Q1-2014
0.9%
1.2%
0.4%
Dec-2012 Dec-2013 Q1-2014
12
Total: N62 billion

……..anchored on Cutting Edge Technology Cutting Edge Mobile and Online Platforms with Advanced Security and Functionality
Source: Company data
Key Facts and Recent Innovations
• First-to-market in Nigeria with the multi-factor authentication technology,
which enhanced the security of online transactions
• Cutting edge mobile and online platforms with advanced security and
functionality
— FirstMobile (mobile banking service) and Firstmonie® (mobile payment
product) enabling customers and non-customers to conduct a growing
variety of banking transactions through mobile phones
— Firstmonie® received an award of Mobile Payment Product of the
Year 2013 in Nigeria from Cards and ePayment Africa Awards in
March, 2014
— Secured $12mn grant from Bill & Melinda Gates Foundation
— FirstContact is a 24-hour, interactive, multilingual customer service
centre offering support to the Bank’s customers
• Upgrade of the core banking application from Finacle 7 to Finacle 10 in 2013
• Implementation of Internal Control & Anti-Fraud Automated Solution
(―ICAFAS‖), a world-class enterprise fraud management system
• First institution in Nigeria to attain the ISO27001 Information Security
Certification
• First organisation in Nigeria to be awarded the ISO/IEC 27001:2005
Information Security Management Systems certification by the British
Standards Institution
FirstMonie Key Figures
13
1 Million+ Subscribers
N3.5 billion Transaction at 31 March 2014
11,529+ Registered Agents at 31 March 2014
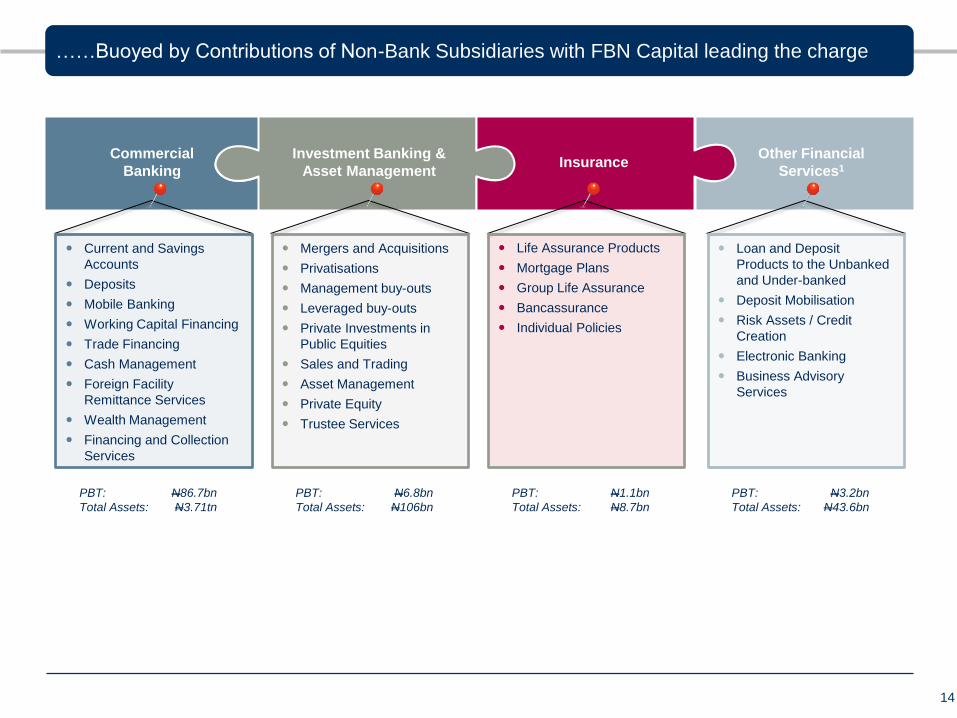
Commercial
Banking
Investment Banking &
Asset Management Insurance
Other Financial
Services1
Current and Savings
Accounts
Deposits
Mobile Banking
Working Capital Financing
Trade Financing
Cash Management
Foreign Facility
Remittance Services
Wealth Management
Financing and Collection
Services
Mergers and Acquisitions
Privatisations
Management buy-outs
Leveraged buy-outs
Private Investments in
Public Equities
Sales and Trading
Asset Management
Private Equity
Trustee Services
Loan and Deposit
Products to the Unbanked
and Under-banked
Deposit Mobilisation
Risk Assets / Credit
Creation
Electronic Banking
Business Advisory
Services
……Buoyed by Contributions of Non-Bank Subsidiaries with FBN Capital leading the charge
14
PBT: N6.8bn
Total Assets: N106bn
PBT: N1.1bn
Total Assets: N8.7bn
PBT: N3.2bn
Total Assets: N43.6bn
PBT: N86.7bn
Total Assets: N3.71tn
Life Assurance Products
Mortgage Plans
Group Life Assurance
Bancassurance
Individual Policies

……Evidenced by our recent accolades FBN Holdings Adheres to the Highest Standards of Corporate Governance
Best Bank Brand in
Nigeria 2013
#1 Banking Brand
in Nigeria 2012
Most Innovative SR!50
Company 2013
Sectoral Leadership
Award 2013
Best Local Bank in
Nigeria 2013
Bisi Onasanya
CEO of the Year 2012
Recent Accolades
15
Pearl Awards
Best Bank in
West Africa 2013
Best Retail Bank in
Nigeria 2012

FBN Holdings in Figures The Largest Retail Banking Network in Nigeria – Figures as at 31 March 2014
Source: Company data and IFRS financial statements
1 FBN Holdings vs. other listed Nigerian banks; by total assets, total customer loans, total deposits, and number of branches as at latest published IFRS financial statements.
2 Annualised based on Q1 2014 results. Net interest margin calculated net interest income divided by the average balance of interest bearing assets during the period, in accordance with IFRS
3 Calculated as FBN Holdings NPLs divided by its gross loans to customers.
4 Calculated as FBN Holdings gross loans to customers divided by customer deposits.
5 For Commercial Banking Group
6 Return on average equity computed as profit after tax attributable to shareholders divided by the average opening and closing balances attributable to equity holders.
Net Interest
Margin2
7.7%
NPL Ratio3
3.6%
Net Interest
Income2
N225.2 bn
ATMs in Nigeria
2,437
RoAE6
17.9%
Ranking among
Nigerian Banks1
#1
Total Assets
N3,861 bn
Active Customer
Accounts
8.5 million+
CAR5
16.8%
Loans/Deposits4
66.3%
Branches in Nigeria
760
Employees
9,849
16

17
FBN Holdings Strategic Initiatives
4

Our strategic initiatives derive from our quest to remain dominant in our four business
groups……..
18
Minimize country-specific risks
through diversification
— Acquisition of 4 banks in West
African Countries
— Enhancing contribution of BIC,
Congo
Refocus the public sector
business of the Bank and drive
Transaction Banking proposition
Extractemaximum value from the
Trade Finance capabilities of FBN
Bank UK
Improve workforce productivity
and implement cost containment
measures
Strengthen the pre-
eminence of our
Commercial Banking Group
1
Obtain a merchant banking
licence
— Enhance our project finance
capabilities/ underwriting
— Access to the fixed income
and FX trading segment of
the investment banking
market
Leverage the retail banking
platform of FirstBank for sale of
Asset Management products
Diversify brokerage business to
include penetrate retail market
Enhance the
competitiveness of IBAM
2
Gain access to the general
insurance segment of the
market through the acquisition
of Oasis
Drive Bancassurance products
through the retail platform of the
FirstBank Group
Leverage on-going collaboration
with Telcos to drive deeper
penetration of the insurance
market through mobile
insurance products
Increase our share of the
insurance market
3
Enhance the financial base of
the Microfinance business
through additional capital
injection of N1b
Enhance penetration of the
market through the upgrade of
our microfinance business to a
National Licensed Microfinance
Bank
— This will enable roll-out in all
the states of the Federation
Enhance penetration of
our Microfinance
Business
4
Commercial Banking IBAM Insurance Microfinance
Drive greater group coordination
Institutionalize cross-sell and synergy extraction across the Group
Implement structured shared services – HR, IT, Risk Management,
Corporate Communication and General Services
FBN Holdings Plc

2014 – 2016 Bank Strategic Initiatives
19
Branch
Transformation 4
Slow down branch expansion and continuous appraisal of branch performance
Closure of non-performing branches and migration of transactions to e-banking
platforms and other touch points
• Self-service rate
• Customer TAT
• Sales per RM
RM Sales
Excellence 8
Cost
Containment 5
Transaction
Banking 1
NPL
Management 6
Commercial
Banking 2
Service
Excellence 7
Improve RM productivity through account planning and performance management
tools/ Earnings per staff
Increase market facing staff as a percentage of total staff
Significantly contain cost growth and drive efficiency by maximizing the use of the
Bank’s assets through shred services
Focus on managing non-people cost and staff productivity
Enhance value chain banking (revenue from cash collections, liquidity management,
payments, trade, etc.), which holds a significant revenue and client-franchise upside
opportunity for FirstBank
Banking the fast growing middle segment of the commercial banking market within the
wholesale banking arena
Drive growth through tailored value proposition and strong operational excellence
Review processes, systems, organizational set-up currently supporting collection
management
Trigger management process to augment ongoing NPL management
Continue to deliver outstanding customer experience for every customer segment
Focus on ensuring clear service proposition, managing customer expectations, and
creating a culture that empowers employees to own customer experience
• RM Productivity
• Customer concentration ratio
• Customer conversion ratio
• Cost-to-income ratio
• Growth rate in costs by category
• Non-interest revenue
• Cross-sell ratio
• Product profitability
• Total revenue from Commercial SBU
• Commercial Banking trade volume
• NPL ratio
• Recoveries/Bank’s PBT
• Industry customer satisfaction ratings
Expected areas of impact
Public Sector
Business 3
Remodeling the public sector business to bank contractors to government and
government agencies • Mix of public sector portfolio
• Share public sector related business

The FBN Holdings proposition is hinged on…..
• Our growing Pan African footprints which diversifies our earnings streams thereby hedging country-specific risks
— Recent acquisition in 4 West African Countries — Growing performance of our Congo operation increasing contribution to the Banking Group PBT from 1.03% in
2012 to 1.64% in 2013 — Leveraging the trade finance capabilities of FBN Bank (UK) which has driven its contribution to the Banking Group
PBT from 7.5% in 2012 to 8.7% in 2013 — Implementation of cost containment measures which saw OPEX drop by N5b in 2013 — Implementing other initiatives to drive the performance of the Banking Group in the short to medium term
• Enhancing the IBAM Performance through acquisition of Merchant Banking
— IBAM Contribution to the Group grew from 5% in 2012 to 7.3% in 2013 — Reinforcing our project finance leadership
• Expanding the business focus of our insurance business to include general services, leveraging the technical expertise of Sanlam
• Operationalizing MoUs among subsidiaries and SBUs for cross-sell across the Group in an effort to surpass the target incremental PBT of N12.3b in 2016
• Driving group coordination and shared services across the FBN Holdings Group
20
FBN Holdings currently trading at a discount remains an attractive and compelling investment proposition (DY 8.3%, PE ratio 6X, PB ratio 0.9X)

Contact Details
Head, Investor Relations Oluyemisi Lanre-Phillips
Email: [email protected]
Phone: +234 (1) 9052720
Investor Relations Team
Phone: +234 (1) 9051146-7
21