diversified investing - financial planningfinancialplanning.tamu.edu/wp-content/uploads/...why...
TRANSCRIPT

www.7TwelvePortfolio.com 1
Diversified InvestingBuilding a Diversified, Low Correlation Portfolio
Financial Planning ConferenceTexas A&M University
November 20, 2015
Craig L. Israelsen, Ph.D.7Twelve® Portfolio
www.7TwelvePortfolio.com
Financial Planning ProgramUtah Valley University

0
200,000
400,000
600,000
800,000
1,000,000
1,200,000
1,400,000
1,600,000
30
32
34
36
38
40
42
44
46
48
50
52
54
56
58
60
62
64
66
68
70
72
74
76
78
80
82
84
86
88
90
92
94
96
98
10
0
Retirement Account Balance from Age 30-100
35 Years of Accumulation 35 Years of Distribution
BIG PICTUREThe General Idea of Investing for Retirement

In 1970 you started investing:
For 45 years you invested money into…
In 2014 your account balance was…
(you saved 10% of your income each year)
Bucket in your room earning 0% interest $324,520
$35,000 starting salary in 1970, 3% annual increase over 45 years

In 1970 you started investing:
For 45 years you invested money into…
In 2014 your account balance was…
(you saved 10% of your income each year)
Bucket in your room earning 0% interest $324,520
Savings account (“Cash”) $758,950
$35,000 starting salary in 1970, 3% annual increase over 45 years

In 1970 you started investing:
For 45 years you invested money into…
In 2014 your account balance was…
(you saved 10% of your income each year)
Bucket in your room earning 0% interest $324,520
Savings account (“Cash”) $758,950
7-Asset Diversified Portfolio of Stock, Bonds, Cash, Real
Estate, Commodities
$3,460,087
$35,000 starting salary in 1970, 3% annual increase over 45 years
The Key is Saving 10%

In 1970 you started investing:
For 45 years you invested money into…
In 2014 your account balance was…
(you saved 10% of your income each year)
Bucket in your room earning 0% interest $324,520
Savings account (“Cash”) $758,950
7-Asset Diversified Portfolio of Stock, Bonds, Cash, Real
Estate, Commodities
$3,460,087
$35,000 starting salary in 1970, 3% annual increase over 45 years
and diversifying

Main Insights
• Start investing early in career
• Set a goal to save 10% of your income each year
• Invest in a diversified portfolio

What’s in a
diversified portfolio?

www.7TwelvePortfolio.com 10
Building an investment portfolio is like making salsa…we
add different ingredients together.

Minimal DiversificationThe S&P 500 Index
Large US Stock

Two-Asset Diversification60/40 Portfolio
Large US Stock
US Bonds

Diversified Portfolio7-Asset Portfolio
Large US Stock
Developed Non-US
Stock
Real Estate
US Bonds
Cash
Commodities
Small CapUS Stock

Why invest in a diversified, multi-asset portfolio?
www.7TwelvePortfolio.com 14

Why invest in a diversified, multi-asset portfolio?
To achieve equity-like returns while cutting volatility & downside in half.
www.7TwelvePortfolio.com 15

45 Year History
1970 - 2014

Diversified Multi-Asset Portfolio…Salsa
1970-2014Large US
StockSmall US
StockNon-US
StockUS
BondsCash
Real Estate
Commodities
EquallyWeighted
7-AssetPortfolio
45-Year Average Annualized %
Return10.48 11.17 9.02 7.89 5.11 11.68 8.03 10.12
www.7TwelvePortfolio.com17

Diversified Multi-Asset Portfolio…Salsa
1970-2014Large US
StockSmall US
StockNon-US
StockUS
BondsCash
Real Estate
Commodities
EquallyWeighted
7-AssetPortfolio
45-Year Average Annualized %
Return10.48 11.17 9.02 7.89 5.11 11.68 8.03 10.12
45-Year Standard Deviation of
Annual Returns 17.43 21.87 22.19 6.57 3.45 19.27 24.93 10.18
www.7TwelvePortfolio.com18

Diversified Multi-Asset Portfolio…Salsa
1970-2014Large US
StockSmall US
StockNon-US
StockUS
BondsCash
Real Estate
Commodities
EquallyWeighted
7-AssetPortfolio
45-Year Average Annualized %
Return10.48 11.17 9.02 7.89 5.11 11.68 8.03 10.12
45-Year Standard Deviation of
Annual Returns 17.43 21.87 22.19 6.57 3.45 19.27 24.93 10.18
Number of Yearswith Negative
Returns9 13 13 3 0 9 13 5
Worst Three-YearCumulative %
Return(37.61) (42.24) (43.32) 6.15 0.17 (35.61) (39.72) (13.40)
www.7TwelvePortfolio.com19

Indexes Used in Performance CalculationsData Source: Lipper
• Large-cap US equity represented by the S&P 500 Index.
• Small-cap US equity represented by the Ibbotson Small Companies Index from 1970-1978, and the Russell 2000 Index starting in 1979.
• Non-US equity represented by the MSCI EAFE Index.
• Real estate represented by the NAREIT Index from 1970-1977 and the Dow Jones US Select REIT Index starting in 1978.
• Commodities represented by the Goldman Sachs Commodities Index (GSCI). As of February 6, 2007, the GSCI became the S&P GSCI Commodity Index.
• U.S. Aggregate Bonds represented by the Ibbotson Intermediate Term Bond Index from 1970-75 and the Barclays Capital Aggregate Bond index starting in 1976.
• Cash represented by 3-month Treasury Bills.
www.7TwelvePortfolio.com 20

www.7TwelvePortfolio.com 21
Large US Equity
Small US Equity
Non-US Equity
Bonds Commodities
REIT
Cash
0
2
4
6
8
10
12
14
-60-50-40-30-20-10010
Ave
rage
An
nu
aliz
ed
% R
etu
rn (
19
70
-20
14
)
Worst Three-Year Cumulative % Return (1970-2014)
45-Year Risk/Return Analysis: 1970-2014

www.7TwelvePortfolio.com 22
Large US Equity
Small US Equity
Non-US Equity
Bonds Commodities
REIT
Cash
0
2
4
6
8
10
12
14
-60-50-40-30-20-10010
Ave
rage
An
nu
aliz
ed
% R
etu
rn (
19
70
-20
14
)
Worst Three-Year Cumulative % Return (1970-2014)
45-Year Risk/Return Analysis: 1970-2014
Ideal risk and return “zone”

www.7TwelvePortfolio.com 23
Large US Equity
Small US Equity
Non-US Equity
Bonds Commodities
Multi-Asset Portfolio
REIT
Cash
0
2
4
6
8
10
12
14
-60-50-40-30-20-10010
Ave
rage
An
nu
aliz
ed
% R
etu
rn (
19
70
-20
14
)
Worst Three-Year Cumulative % Return (1970-2014)
45-Year Risk/Return Analysis: 1970-2014

www.7TwelvePortfolio.com 24
Large US Equity
Small US Equity
Non-US Equity
Bonds Commodities
Multi-Asset Portfolio
REIT
Cash0
2
4
6
8
10
12
14
-60-50-40-30-20-10010
Ave
rage
An
nu
aliz
ed
% R
etu
rn (
19
70
-20
14
)
Worst Three-Year Cumulative % Return (1970-2014)
45-Year Risk/Return Analysis: 1970-2014
Inflation Adjusted Returns

Will a diversified, multi-asset portfolio always win?
No. It is a long-term strategy—not a get-rich-quick approach.
www.7TwelvePortfolio.com 25
Will a diversified, multi-asset portfolio always win?
No. It is a long-term strategy—not a get-rich-quick approach.
www.7TwelvePortfolio.com 26

www.7TwelvePortfolio.com 27
(50)
(40)
(30)
(20)
(10)
0
10
20
30
40
50
197
0
197
1
197
2
197
3
197
4
197
5
197
6
197
7
197
8
197
9
198
0
198
1
198
2
198
3
198
4
198
5
198
6
198
7
198
8
198
9
199
0
199
1
199
2
199
3
199
4
199
5
199
6
199
7
199
8
199
9
200
0
200
1
200
2
200
3
200
4
200
5
200
6
200
7
200
8
200
9
201
0
201
1
201
2
201
3
201
4
Annual Returns for Multi-Asset Portfolio45-year Period: 1970-2014
www.7TwelvePortfolio.com 28
(50)
(40)
(30)
(20)
(10)
0
10
20
30
40
50
197
0
197
1
197
2
197
3
197
4
197
5
197
6
197
7
197
8
197
9
198
0
198
1
198
2
198
3
198
4
198
5
198
6
198
7
198
8
198
9
199
0
199
1
199
2
199
3
199
4
199
5
199
6
199
7
199
8
199
9
200
0
200
1
200
2
200
3
200
4
200
5
200
6
200
7
200
8
200
9
201
0
201
1
201
2
201
3
201
4
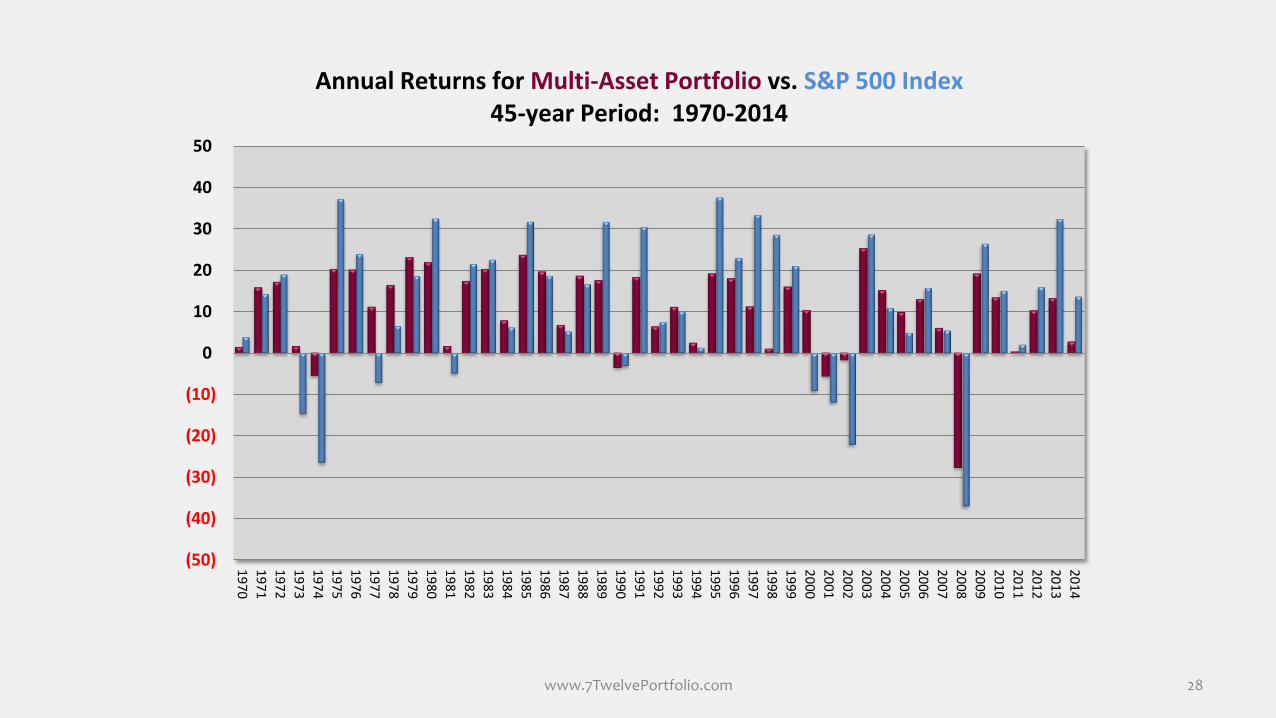
Annual Returns for Multi-Asset Portfolio vs. S&P 500 Index45-year Period: 1970-2014

www.7TwelvePortfolio.com 29
(50)
(40)
(30)
(20)
(10)
0
10
20
30
40
50
197
0
197
1
197
2
197
3
197
4
197
5
197
6
197
7
197
8
197
9
198
0
198
1
198
2
198
3
198
4
198
5
198
6
198
7
198
8
198
9
199
0
199
1
199
2
199
3
199
4
199
5
199
6
199
7
199
8
199
9
200
0
200
1
200
2
200
3
200
4
200
5
200
6
200
7
200
8
200
9
201
0
201
1
201
2
201
3
201
4
Annual Returns for Multi-Asset Portfolio vs. S&P 500 Index45-year Period: 1970-2014
The S&P 500 is not the correct benchmark for a multi-asset portfolio… but it will used by many investors

www.7TwelvePortfolio.com 30
(50)
(40)
(30)
(20)
(10)
0
10
20
30
40
50
197
0
197
1
197
2
197
3
197
4
197
5
197
6
197
7
197
8
197
9
198
0
198
1
198
2
198
3
198
4
198
5
198
6
198
7
198
8
198
9
199
0
199
1
199
2
199
3
199
4
199
5
199
6
199
7
199
8
199
9
200
0
200
1
200
2
200
3
200
4
200
5
200
6
200
7
200
8
200
9
201
0
201
1
201
2
201
3
201
4
Annual Returns for Multi-Asset Portfolio vs. S&P 500 Index45-year Period: 1970-2014
S&P 500 is better 56% of the time…but when it’s worse it is much worse

www.7TwelvePortfolio.com 31
(50)
(40)
(30)
(20)
(10)
0
10
20
30
40
50
197
0
197
1
197
2
197
3
197
4
197
5
197
6
197
7
197
8
197
9
198
0
198
1
198
2
198
3
198
4
198
5
198
6
198
7
198
8
198
9
199
0
199
1
199
2
199
3
199
4
199
5
199
6
199
7
199
8
199
9
200
0
200
1
200
2
200
3
200
4
200
5
200
6
200
7
200
8
200
9
201
0
201
1
201
2
201
3
201
4
Annual Returns for Multi-Asset Portfolio vs. S&P 500 Index45-year Period: 1970-2014
Both have about the same return over the past 45 years
Multi-Asset Portfolio Annualized Return = 10.12%S&P 500 Index Annualized Return = 10.48%

The Math of Losses and Needed GainsNeeded % Gain = [1 / (1 – % Loss)] – 1
Percentage
Loss in PortfolioPortfolios
Needed Percentage
Gain to Restore
Portfolio
-5% 5.3%
-10% 11.1%
-15% 17.6%
-20% 25.0%
-27% Multi-Asset Portfolio in 2008 37.0%
-30% 42.9%
-35% 53.8%
-37% S&P 500 Index in 2008 58.7%
-40% 66.7%
-45% 81.8%
-50%141 equity funds lost 50%
or more in 2008
(funds with at least 60% equity)
100.0%
-55% 122.2%
-60% 150.0%
-65% 185.7%
-70% 233.3%
-75% 300.0%
www.7TwelvePortfolio.com 32

Rolling 3-Year Returns1970-2014
www.7TwelvePortfolio.com 33
-20
-10
0
10
20
30
40
19
72
19
73
19
74
19
75
19
76
19
77
19
78
19
79
19
80
19
81
19
82
19
83
19
84
19
85
19
86
19
87
19
88
19
89
19
90
19
91
19
92
19
93
19
94
19
95
19
96
19
97
19
98
19
99
20
00
20
01
20
02
20
03
20
04
20
05
20
06
20
07
20
08
20
09
20
10
20
11
20
12
20
13
20
14
S&P 500
S&P 500 Index Average 3-Year Return = 10.83%

Rolling 3-Year Returns1970-2014
www.7TwelvePortfolio.com 34
-20
-10
0
10
20
30
40
19
72
19
73
19
74
19
75
19
76
19
77
19
78
19
79
19
80
19
81
19
82
19
83
19
84
19
85
19
86
19
87
19
88
19
89
19
90
19
91
19
92
19
93
19
94
19
95
19
96
19
97
19
98
19
99
20
00
20
01
20
02
20
03
20
04
20
05
20
06
20
07
20
08
20
09
20
10
20
11
20
12
20
13
20
14
S&P 500 Multi-Asset Portfolio
S&P 500 Index Average 3-Year Return = 10.83%
Multi-Asset Portfolio Average 3-Year Return = 10.45%

Diversified Portfolio “Core”Smoother ride
Fewer periods with negative returns
www.7TwelvePortfolio.com 35
-20
-10
0
10
20
30
40
19
72
19
73
19
74
19
75
19
76
19
77
19
78
19
79
19
80
19
81
19
82
19
83
19
84
19
85
19
86
19
87
19
88
19
89
19
90
19
91
19
92
19
93
19
94
19
95
19
96
19
97
19
98
19
99
20
00
20
01
20
02
20
03
20
04
20
05
20
06
20
07
20
08
20
09
20
10
20
11
20
12
20
13
20
14
S&P 500 Multi-Asset Portfolio
S&P 500 Index Average 3-Year Return = 10.83%
Multi-Asset Portfolio Average 3-Year Return = 10.45%

Portfolio Torture Test
1970-2014
The Withdrawal Phase
During Retirement
www.7TwelvePortfolio.com 36

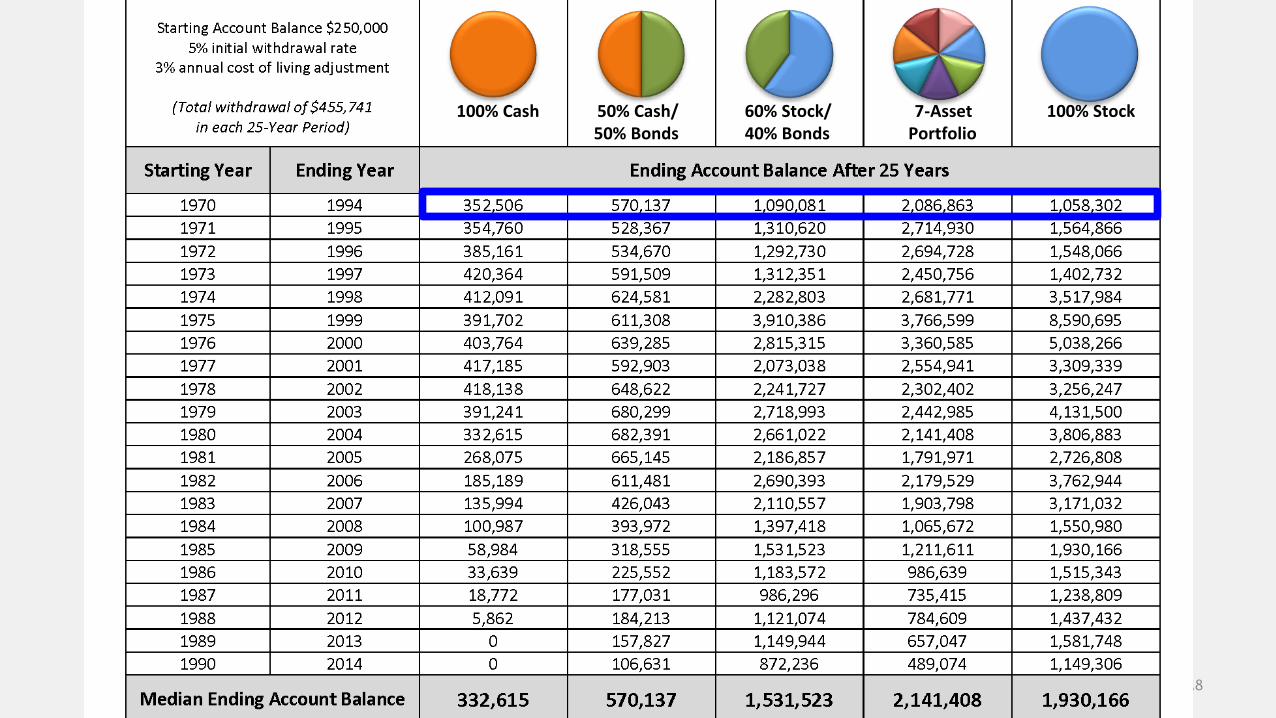
Assumptions
$250,000 starting balance
5% initial withdrawal rate
3% annual cost of living (COLA) increase in withdrawal
Analysis
Ending Balance over Rolling 25-Year Periods
www.7TwelvePortfolio.com 37
www.7TwelvePortfolio.com 38
100% Cash 50% Cash/ 60% Stock/ 7-Asset 100% Stock50% Bonds 40% Bonds Portfolio

www.7TwelvePortfolio.com 39
100% Cash 50% Cash/ 60% Stock/ 7-Asset 100% Stock50% Bonds 40% Bonds Portfolio

Moving from 7 assets to Twelve assets
in a portfolio “core”
www.7TwelvePortfolio.com 40

Good Diversification7-Asset Portfolio
Large US Stock
Developed Non-US
Stock
Real Estate
US Bonds
Cash
Commodities
Small CapUS Stock

Superior Diversification12-Asset Portfolio “Core”
Large US Stock
Developed Non-US
Stock
Real Estate
Natural Resources
US Bonds
Non-US Bonds
Cash
MidcapUS Stock
Emerging Non-US
Stock
CommoditiesInflation
Protected Bonds
Small CapUS Stock

7Twelve®
Large US Stock
Developed Non-US
Stock
Real Estate
Natural Resources
US Bonds
Non-US Bonds
Cash
MidcapUS Stock
Emerging Non-US
Stock
CommoditiesInflation
Protected Bonds
Small CapUS Stock
7 Core Asset Classes Twelve Actual Holdings
US Stock Non-US Stock Real Estate Resources US Bonds Non-US Bonds Cash

www.7TwelvePortfolio.com 44
Large US Stock 8.33%
Mid Cap US Stock 8.33%
Small US Stock 8.33%
Non-US Stock 8.33%
Emerging Markets 8.33%Real Estate
8.33%
Natural Resources 8.33%
Commodities 8.33%
US Bonds 8.33%
International Bonds 8.33%
TIPS 8.33%
Cash 8.33%
7Twelve®
Equally-weighted exposure to 12 asset classes

45
15-Year Growth of $10,0002000-2014
US Large Stock
60% Large Stock40% Bonds
7-Asset Portfolio7Twelve® Portfolio
$0
$5,000
$10,000
$15,000
$20,000
$25,000
$30,000
$35,000
Using underlying indexes

www.7TwelvePortfolio.com46
Eight Equity and Diversifying Holdings
The “Engines” of the Portfolio
US Stock Non-US Stock Real Estate Resources US Bonds Non-US Bonds Cash
7Twelve®

www.7TwelvePortfolio.com47
Four Fixed Income HoldingsThe “Safety Brakes” of the Portfolio
US Stock Non-US Stock Real Estate Resources US Bonds Non-US Bonds Cash
7Twelve®

Brakes Have Outperformed 1/3 of the time
Year7Twelve Brakes
(4 ETFs)
2000 6.86
2001 3.93
2002 12.36
2003 7.67
2004 6.29
2005 -0.34
2006 4.01
2007 8.58
2008 3.73
2009 4.65
2010 4.06
2011 6.30
2012 4.05
2013 -3.53
2014 -0.65
3-Year Return -0.09
5-Year Return 1.98
10-Year Return 3.03
15-Year Return 4.46

Brakes Have Outperformed 1/3 of the timeEngines Have Outperformed 2/3 of the time
Year7Twelve Brakes
(4 ETFs)
7Twelve Engines
(8 ETFs)
2000 6.86 6.72
2001 3.93 -4.46
2002 12.36 -7.35
2003 7.67 36.80
2004 6.29 23.50
2005 -0.34 18.42
2006 4.01 20.72
2007 8.58 12.67
2008 3.73 -38.79
2009 4.65 35.03
2010 4.06 19.72
2011 6.30 -4.66
2012 4.05 14.25
2013 -3.53 16.08
2014 -0.65 2.40
3-Year Return -0.09 10.74
5-Year Return 1.98 9.16
10-Year Return 3.03 7.51
15-Year Return 4.46 8.27

50
Equities and Diversifiers: 8 ENGINES
65% of Overall Portfolio Allocation
Fixed Income: 4 BRAKES
35% of Overall Portfolio Allocation
US Stock Non-US Stock Real Estate Resources US Bonds Non-US Bonds Cash
7Twelve®
A Multi-Asset Balanced Strategy

www.7TwelvePortfolio.com 51
Rebalancing Comparison Performance as of December 31, 2014
6.57%
7.47%
5.88%
7.13%
4%
5%
5%
6%
6%
7%
7%
8%
8%
10-Year Annualized Return 15-Year Annualized Return
7Twelve with Annual Rebalancing 7Twelve with No Rebalancing

Rebalancing Frequency
Monthly Rebalancing
Quarterly Rebalancing
Annual Rebalancing
7.23 7.41 7.47
www.7TwelvePortfolio.com52
7Twelve®
15-Year Annualized Return from 2000-2014Passive 7Twelve® model
www.7TwelvePortfolio.com 53
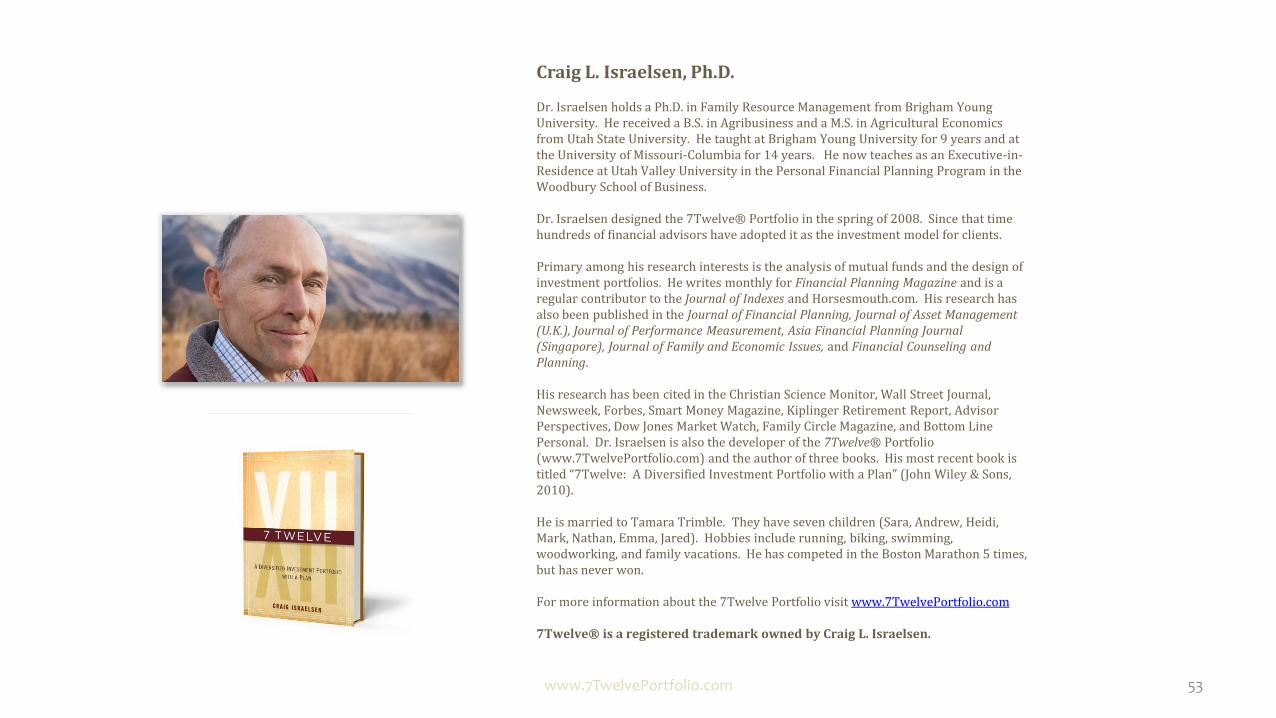
Craig L. Israelsen, Ph.D.
Dr. Israelsen holds a Ph.D. in Family Resource Management from Brigham Young University. He received a B.S. in Agribusiness and a M.S. in Agricultural Economics from Utah State University. He taught at Brigham Young University for 9 years and at the University of Missouri-Columbia for 14 years. He now teaches as an Executive-in-Residence at Utah Valley University in the Personal Financial Planning Program in the Woodbury School of Business.
Dr. Israelsen designed the 7Twelve® Portfolio in the spring of 2008. Since that time hundreds of financial advisors have adopted it as the investment model for clients.
Primary among his research interests is the analysis of mutual funds and the design of investment portfolios. He writes monthly for Financial Planning Magazine and is a regular contributor to the Journal of Indexes and Horsesmouth.com. His research has also been published in the Journal of Financial Planning, Journal of Asset Management (U.K.), Journal of Performance Measurement, Asia Financial Planning Journal (Singapore), Journal of Family and Economic Issues, and Financial Counseling and Planning.
His research has been cited in the Christian Science Monitor, Wall Street Journal, Newsweek, Forbes, Smart Money Magazine, Kiplinger Retirement Report, Advisor Perspectives, Dow Jones Market Watch, Family Circle Magazine, and Bottom Line Personal. Dr. Israelsen is also the developer of the 7Twelve® Portfolio (www.7TwelvePortfolio.com) and the author of three books. His most recent book is titled “7Twelve: A Diversified Investment Portfolio with a Plan” (John Wiley & Sons, 2010).
He is married to Tamara Trimble. They have seven children (Sara, Andrew, Heidi, Mark, Nathan, Emma, Jared). Hobbies include running, biking, swimming, woodworking, and family vacations. He has competed in the Boston Marathon 5 times, but has never won.
For more information about the 7Twelve Portfolio visit www.7TwelvePortfolio.com
7Twelve® is a registered trademark owned by Craig L. Israelsen.

This presentation was developed by Craig L. Israelsen, Ph.D. and is a document presenting portfolio research and analysis.
This document is neither investment advice nor an investment solicitation.
Implementation of the 7Twelve® portfolio is no guarantee of performance.
As we all know past performance is no guarantee of future performance.
---------------------------------------------------------------------------------------------
This is a copyrighted document, copying for redistribution is prohibited unless written permission is
obtained from Craig L. Israelsen
7Twelve® is a registered trademark belonging to Craig L. Israelsen
Copyright © 2008-2015 Craig L. IsraelsenAll rights reserved
www.7TwelvePortfolio.com 54

Craig L. Israelsen, Ph.D.
Email: [email protected]
Web: www.7TwelvePortfolio.com
www.7TwelvePortfolio.com
The 7Twelve®
Portfolio
55