connecting mountains to oceans from the arctic to the
TRANSCRIPT

This project has received funding from the European Union’s Horizon 2020 research and innovation programme under grant agreement No 731065
Responsibility for the information and views set out in this report lies entirely with the authors. The European Commission is not responsible for any use that may be made of the information it contains.
Deliverable No 8.3:
Final Report AquaBox
Project Title: AQUACOSM: Network of Leading European AQUAtic MesoCOSM Facilities
Connecting Mountains to Oceans from the Arctic to the Mediterranean
Project number: 731065
Project Acronym: AQUACOSM
Proposal full title: Network of Leading European AQUAtic MesoCOSM Facilities
Connecting Mountains to Oceans from the Arctic to the Mediterranean
Type: Research and innovation actions
Work program topics addressed:
H2020-INFRAIA-2016-2017: Integrating and opening research infrastructures of European interest
Due date of deliverable:
30 September 2020 (M45)
Actual submission date:
09 October 2020
Version: v1
Main Authors: Robert Ptacnik (WCL), Timo Tamminen (SYKE)

This project has received funding from the European Union’s Horizon 2020 research and innovation programme under grant agreement No 731065
Responsibility for the information and views set out in this report lies entirely with the authors. The European Commission is not responsible for any use that may be made of the information it contains.
Project ref. number 731065
Project title AQUACOSM: NETWORK OF LEADING EUROPEAN AQUATIC MESOCOSM FACILITIES
Deliverable title Final Report AquaBox
Deliverable number D8.3
Deliverable version V1
Contractual date of delivery 30 September 2020
Actual date of delivery 09 October 2020
Document status
Document version Final
Online access Yes
Diffusion Public
Nature of deliverable Report
Workpackage WP8
Partner responsible WCL
Author(s) Robert Ptacnik (WCL), Timo Tamminen (SYKE), Pasi Ylöstalo (SYKE), Sami Kielosto (SYKE), Jani Ruohola (SYKE), Jukka Seppälä (SYKE), Anne-Mari Lehto (SYKE), Niko Aarnio (SYKE), Noora Haavisto (SYKE), Pirjo Kuuppo (SYKE)
Editor Katharina Makower, Jens Nejstgaard
Approved by Jens Nejstgaard (IGB)
EC Project Officer Agnès Robin
Abstract AquaBox is an automated, multichannel and multiparameter sampling and measurement unit developed in AQUACOSM for mesocosm experimentation. The aim was to enhance and largely automate high-frequency data collection from multiple experimental units, in order to address the dynamic responses and interactions within the microbial food web of planktonic systems. This document describes the aims, development steps, and final status of AquaBox achieved during the AQUACOSM project.
Keywords mesocosm experiments, high-frequency data, automated sampling, automated measurement, plankton imaging, pigments, CDOM, fluorometry, fast repetition rate fluorometry, oxygen, pCO2, pH, data transfer, visualization, Python software

D8.3 Final Report AquaBox
AQUACOSM – H2020 INFRAIA-2016-2017- No. 731065 Page 3 of 29
Co-funded by the European Union
Table of Contents
1. Executive summary ...................................................................................................................................... 4
2. What is “AquaBox”? ..................................................................................................................................... 5
2.1 Task description (8.2.2) – aims and their evolution ......................................................................... 5
2.2 Background and synergies in AquaBox R&D .................................................................................... 6
3. AquaBox R&D plan and initial test schedule ............................................................................................... 8
4. AquaBox for mesocosm experiments ........................................................................................................ 12
4.1 Development steps ........................................................................................................................ 12
4.1.1 Initial tests, construction of electronics and data retrieval ...................................................... 12
4.1.2 AquaBox for mesocosm scale – main components and overall setup ..................................... 13
4.1.3 AquaBox software: main features ............................................................................................ 15
4.1.4 Sample flow modes: fast, slow, acclimation ............................................................................. 17
4.1.5 From lab to the field ................................................................................................................. 18
4.2 AquaBox in mesocosm experiments .............................................................................................. 19
4.2.1 Examples of data created by AquaBox ..................................................................................... 19
4.2.2 AquaBox applications to mesocosm experiments .................................................................... 22
4.2.2.1 Indoor test experiment, May 2019 ...................................................................................... 22
4.2.2.2 JOMEX field experiment, June-July 2019 ............................................................................. 22
4.2.2.3 Indoor microplastic TA experiment, August-September 2019 ............................................ 23
4.2.2.4 Indoor POC-DOC experiment, September 2020 .................................................................. 23
5. Summary and conclusions ......................................................................................................................... 23
6. Dissemination activities related with the Deliverable ............................................................................... 24
7. Appendix 1 ................................................................................................................................................. 25
8. Appendix 2 ................................................................................................................................................. 28

D8.3 Final Report AquaBox
AQUACOSM – H2020 INFRAIA-2016-2017- No. 731065 Page 4 of 29
Co-funded by the European Union
1. Executive summary
AquaBox is an automated, multichannel and multiparameter sampling and measurement unit developed in AQUACOSM for mesocosm experimentation. The aim was to enhance and largely automate high-frequency data collection from multiple experimental units, in order to address the dynamic responses and interactions within the microbial food web of planktonic systems.
AquaBox was designed as a central unit, incorporating a modular suite of measurement probes and analysers. This basic concept allows for flexible set-ups in experimentation with different scientific targets, requiring specific sets of measured parameters. It aimed at cost-efficiency, as measurement probes need not to be replicated for each experimental unit. Instead, the automated sampling would introduce sequentially water from each mesocosm to a flow-through system, guiding the sample through a selected set of probes and analysers.
This document describes the aims, development steps, and final status of AquaBox achieved during the AQUACOSM project, including schematics, photographs and exemplary data from tests and 4 full-scale mesocosm experiments during its development.

D8.3 Final Report AquaBox
AQUACOSM – H2020 INFRAIA-2016-2017- No. 731065 Page 5 of 29
Co-funded by the European Union
2. What is “AquaBox”?
2.1 Task description (8.2.2) – aims and their evolution
Based largely on the Ferrybox technology that emerged from previous projects (among them FP7 JERICO), and has been further developed at SYKE (e.g. H2020 projects JERICO-NEXT, JERICO-S3), we set out to design during the AQUACOSM project a compact and modular flow-through system (AquaBox) suitable for high-precision and high-frequency monitoring of multiple mesocosms.
AquaBox was planned as a central unit, incorporating a modular suite of measurement probes and analysers. This basic concept allows for flexible set-ups in experimentation with different scientific targets, requiring specific sets of measured parameters. It aimed at cost-efficiency, as measurement probes need not to be replicated for each experimental unit. Instead, the automated sampling would introduce sequentially water from each mesocosm to a flow-through system, guiding the sample through a set of analysers.
The basic restraint of the system is the necessity to have the experimental units within reasonable reach from the AquaBox central unit, to allow for automated sample retrieval via a stationary tubing array. Dead volume in sampling tubes cannot be excessive, and the pressure differentials introduced by long tubing and the pump suction must not arise harmful for planktonic organisms. Therefore, the system would be suited for medium-sized mesocosms situated either in a laboratory setting, or on a pier or floating rack in the field.
The AquaBox concept combines peristaltic pumps and multichannel valves, flow cells and sequential flow technology, performing autonomous measurements successively from several mesocosms installed nearby or in a joint rig. By employing flow-through sensors/analysers and OA software for system control, data retrieval, data QA/QC, and wireless data transfer, the system would be able to perform multiple measurements on automatically retrieved water samples, allowing for high precision and reproducibility, as well as semi-continuous measurement frequencies hitherto unobtained in mesocosm studies.
A key task in 8.2.2 was to establish a stepwise program for tests and developing the AquaBox. A modular, readily expandable system structure and basic control software (Python) was to be first developed and tested in lab scale, with a basic set of sensors for key properties most prone to temporal variation in planktonic systems during mesocosm experiments. From there, we aimed to proceed to upscaling to mesocosm volumes, including pressure differential tests for extended tubing to optimize the flow rate, and then to integration of additional functions into the physical and control architecture. The measurements from basic to advanced were originally listed as:
• initial selection: temperature, oxygen, in vivo phytoplankton pigment fluorescence at several wavelengths
• Fast Repetition Rate Fluorometry (FRRF) and Pulse Amplification Modulated (PAM) fluorometry as primary productivity proxies,
• fluorescence of dissolved organic matter (CDOM),
• in-water carbonate system chemistry (pCO2, pH),
• inorganic nutrient analyses (miniaturized wet chemistry),
• interphase for gas exchange measurements across water surface,
• automated water sample retrieval,
• flow cytometry,
• image analysis of individual cells of phytoplankton and zooplankton species (e.g. FlowCAM, CytoSense, FlowCytobot).

D8.3 Final Report AquaBox
AQUACOSM – H2020 INFRAIA-2016-2017- No. 731065 Page 6 of 29
Co-funded by the European Union
It was foreseen that a large share of these analysers would be temporarily obtained within the AQUACOSM partnership for basic functional tests and demonstration. The selected advanced features/analysers, chosen on the basis of the development work and laboratory and field tests, would then be acquired and incorporated into a high-end AquaBox pilot version by the end of the project. This deliverable describes how these original targets were reached or evolved during the project.
2.2 Background and synergies in AquaBox R&D
Partner SYKE possessed extensive experience in developing and running flow-through automated measurements onboard Ferrybox systems in ships-of-opportunity, as well as in developing a complex flow-through measurement system for the Utö Marine Research Station (Finland) in collaboration with the Finnish Meteorological Institute. The scheme of the development version of Ferrybox system is presented in Fig. 1, and main measurements for the Utö flow-through system are depicted in Figs. 2 and 3.
Figure 1: The 2017 version of SYKE Ferrybox R&D (“Algaline 2.0”) takes advantage of small computers and open-source electronics; data acquisition and automatic controls done with Raspberry Pi and Arduino. It utilizes simple DAQ software with a GUI, written in Python and Python’s Qt5 bindings

D8.3 Final Report AquaBox
AQUACOSM – H2020 INFRAIA-2016-2017- No. 731065 Page 7 of 29
Co-funded by the European Union
Figure 2: Basic scheme of the automated Utö Marine Research Station. Control and data acquisition software are scripted in Python. All data are remotely accessible in real time except for notifications in red
Figure 3: And in reality, it looks like this (part of the automated Utö Marine Research Station). AquaBox would require considerable downscaling, but the control and data acquisition software are scale-independent, so synergy with previous systems is essential for AquaBox R&D work.

D8.3 Final Report AquaBox
AQUACOSM – H2020 INFRAIA-2016-2017- No. 731065 Page 8 of 29
Co-funded by the European Union
These automated measurement systems were developed within the H2020 INFRAIA project JERICO-NEXT by partner SYKE, and the experience gained from these was directly available for AquaBox R&D work in AQUACOSM. The specific challenges in the AquaBox development were partly connected to the arrangement of sample rotation with multiple sample input streams required in mesocosm experimentation (as opposed to a single flow-through stream in Ferryboxes or at a station system), and partly to accommodation of measurements requiring different temporal scales (from microseconds up to several minutes) in the same system architecture and control.
3. AquaBox R&D plan and initial test schedule
The AquaBox development plan was based on addressing 3 conceptually different measurement types within a modular, automated sample transfer/measurement framework:
- “immediate”: directly from flow-through stream in sequential arrangements (sample streams to waste); response times of measurement probes <<seconds
- “delayed”: collection of sample stream to temporary reservoirs or acclimation chambers, for parameters requiring >>seconds time window because of e.g. probe response times, analyser measurement cycle times, or a need for sample dark acclimation in bio-optical measurements (sample streams to waste)
- “catch & release”: sampling loops from experimental units to non-invasive measurement(s) and back to units – for measurements requiring larger volumes and ~minutes of sample stream (potentially pCO2, imaging of larger particles)
The conceptual version of the automated multiple sample retrieval/measurement system was presented in the AQUACOSM kick-off meeting (Month 1), and the development of system architecture and control scripts (in Python) for pumps, multichannel valves and measuring instruments started immediately. The nucleus version of the scripts was tested in a small lab-scale installment (tissue culture bottle scale – Fig. 4), which was demonstrated for the WP8 partnership in a workshop arranged by SYKE in Helsinki, November 2017.
The R&D schedule for the following steps was outlined as follows:
Ver. 0.2 (lab scale; concept demo in Helsinki WS, November 2017): 1. basic control software architecture (Python) 2. automated sampling module from X experimental units (102 ml scale)
a. µl-scale peristaltic pump/tubing b. multichannel valve for input stream
3. dark acclimation loop 4. “immediate” flow-through measurement module
a. variable fluorescence parameters (PSI AquaPen)
D8.3 Final Report AquaBox
AQUACOSM – H2020 INFRAIA-2016-2017- No. 731065 Page 9 of 29
Co-funded by the European Union
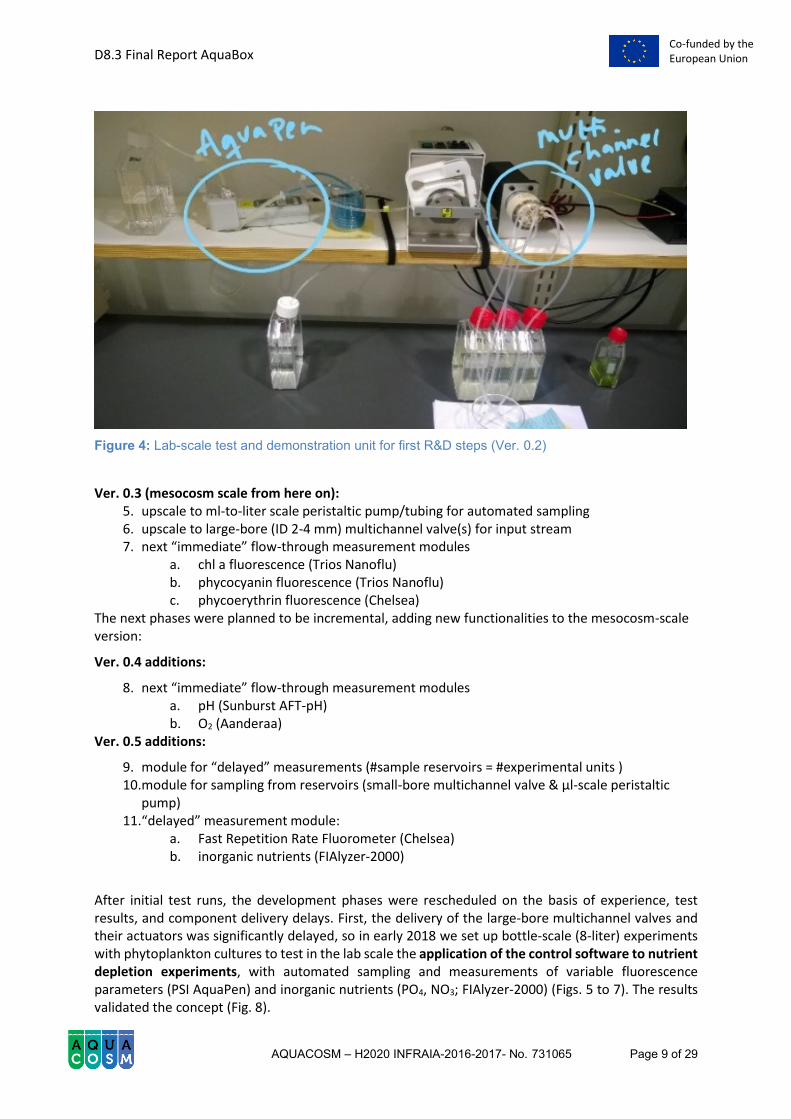
Figure 4: Lab-scale test and demonstration unit for first R&D steps (Ver. 0.2)
Ver. 0.3 (mesocosm scale from here on):
5. upscale to ml-to-liter scale peristaltic pump/tubing for automated sampling 6. upscale to large-bore (ID 2-4 mm) multichannel valve(s) for input stream 7. next “immediate” flow-through measurement modules
a. chl a fluorescence (Trios Nanoflu) b. phycocyanin fluorescence (Trios Nanoflu) c. phycoerythrin fluorescence (Chelsea)
The next phases were planned to be incremental, adding new functionalities to the mesocosm-scale version:
Ver. 0.4 additions:
8. next “immediate” flow-through measurement modules a. pH (Sunburst AFT-pH) b. O2 (Aanderaa)
Ver. 0.5 additions:
9. module for “delayed” measurements (#sample reservoirs = #experimental units ) 10. module for sampling from reservoirs (small-bore multichannel valve & µl-scale peristaltic
pump) 11. “delayed” measurement module:
a. Fast Repetition Rate Fluorometer (Chelsea) b. inorganic nutrients (FIAlyzer-2000)
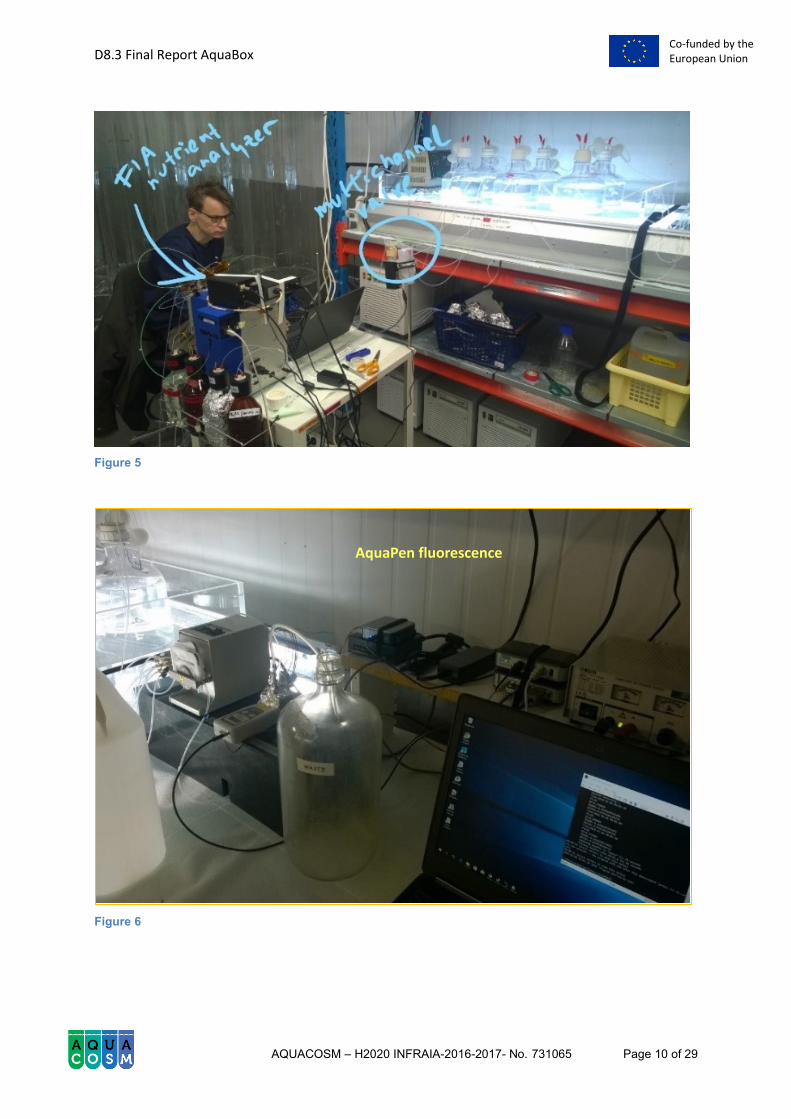
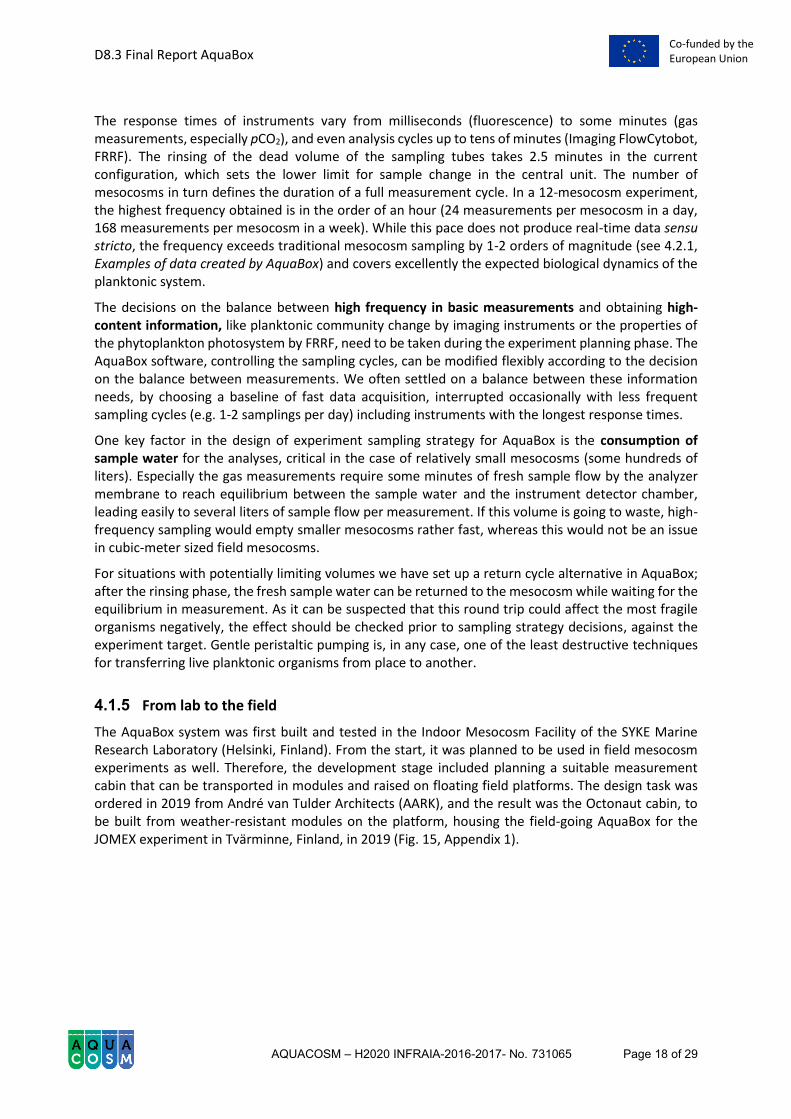
After initial test runs, the development phases were rescheduled on the basis of experience, test results, and component delivery delays. First, the delivery of the large-bore multichannel valves and their actuators was significantly delayed, so in early 2018 we set up bottle-scale (8-liter) experiments with phytoplankton cultures to test in the lab scale the application of the control software to nutrient depletion experiments, with automated sampling and measurements of variable fluorescence parameters (PSI AquaPen) and inorganic nutrients (PO4, NO3; FIAlyzer-2000) (Figs. 5 to 7). The results validated the concept (Fig. 8).
D8.3 Final Report AquaBox
AQUACOSM – H2020 INFRAIA-2016-2017- No. 731065 Page 10 of 29
Co-funded by the European Union
Figure 5
Figure 6
AquaPen fluorescence

D8.3 Final Report AquaBox
AQUACOSM – H2020 INFRAIA-2016-2017- No. 731065 Page 11 of 29
Co-funded by the European Union
Figure 7
Figure 5 – Figure 7: Lab-scale (8-l units) test of initial control software with nutrient and PAM fluorescence analyses.
FIAlab PO4, NO
3

D8.3 Final Report AquaBox
AQUACOSM – H2020 INFRAIA-2016-2017- No. 731065 Page 12 of 29
Co-funded by the European Union
Figure 8: 6-day time series of nutrient depletion (PO4, NO3) and phytoplankton growth (Fm’ fluorescence with AquaPen), in cultures of Phaeodactylum sp. and Monoraphidium contortum (3 replicates each). Automated flow-through sampling and measurements from 6 experimental units (à 8 liters). After the exponential growth phase and nutrient depletion, PAM fluorescence shows distinct diel periodicity (l/d cycle 14/10). Note: nutrient concentrations (weight units, right y-axis) are scaled to Redfield ratio.
4. AquaBox for mesocosm experiments
4.1 Development steps
4.1.1 Initial tests, construction of electronics and data retrieval
The upgrading of the AquaBox concept to mesocosm scale involved numerous R&D steps that were carried out during 2018 and up to April 2019, briefly summarized as:

D8.3 Final Report AquaBox
AQUACOSM – H2020 INFRAIA-2016-2017- No. 731065 Page 13 of 29
Co-funded by the European Union
• planning of the sample flow diagrams, including sample selection, flushing of dead volumes, return flows to waste or mesocosms
• selection, acquisition and testing of the key flow system components (multichannel valves, actuators, pinch solenoid valves, tubing, peristaltic pump, flow and pressure sensors)
• constructing the electronics for component control and power, data transfer
• basic tests for sample flow speeds vs. pressure, calculating respective time windows for programming the flow control
• building the sample tubing network based on the tests
• planning the architecture of the Python code and writing and testing the actual code, computer demands, wireless data transfer for field installments
The SYKE-MRC core team for resolving all these multiple parallel tasks and their integration consisted of Sami Kielosto (key responsibility electronics, flow architecture), Pasi Ylöstalo (key responsibility instrument integration, flow architecture) and Jani Ruohola (key responsibility programming).
4.1.2 AquaBox for mesocosm scale – main components and overall setup
Based on the R&D outlined above, the central AquaBox unit was constructed into a rack on wheels (for field installment, 2 racks; Fig. 9), with computers and auxiliary units for component control, power, UPS, and data transfer built into water-resistant units, placed on nearby shelves.
Figure 9: The core components of AquaBox flow control installed onto a rack-on-wheels, in JOMEX field experiment 2019: peristaltic pump, multichannel valves and their actuators, pinch solenoid valves, silicone tubing from and back to mesocosms. See schematics in Figs. 13 and 14 for the functionalities of the components

D8.3 Final Report AquaBox
AQUACOSM – H2020 INFRAIA-2016-2017- No. 731065 Page 14 of 29
Co-funded by the European Union
Figure 10: Flow control diagram of AquaBox (September 2020 experiment).
Figure 11: Basic instrumentation flow diagram of AquaBox (September 2020 experiment).
At the heart of the AquaBox system, a peristaltic pump sucks water successively from mesocosms and delivers it to a chain of flow-through instruments for measurements, or to a temperature-controlled reservoir bottle for measurements demanding longer analysis time and/or dark acclimation. The sampling flow in the silicone tubing circuit is controlled by a custom-built software (see 4.3.1) through multichannel valves and solenoid pinch valves.
The basic instruments along the flow-through loop have been:

D8.3 Final Report AquaBox
AQUACOSM – H2020 INFRAIA-2016-2017- No. 731065 Page 15 of 29
Co-funded by the European Union
• chlorophyll a fluorescence (Trios Nanoflu)
• phycocyanin fluorescence (Trios Nanoflu)
• CDOM fluorescence (Trios Nanoflu)
• oxygen (Aanderaa 4330)
• phycoerythrin fluorescence (Chelsea Unilux)
• CO2 partial pressure (Contros FT/Kongsberg)
• thermosalinograph (SBE45)
• pH (Sunburst AFT)
Instruments sampling from the acclimation reservoir have included:
• Pulse Amplitude Modulation fluorescence (PSI AquaPen)
• Fast Repetition Rate fluorometry (FRRF; Chelsea FastTrack)
• Imaging FlowCytobot (IFCB; McLane)
In addition to the measuring instruments along the main flow outlined in Fig. 11, AquaBox master code thus controls delivery of sample water to instruments that operate remotely on their own software, and require variable time intervals for analysis. So far, Fast Repetition Rate fluorometer (Chelsea), Imaging FlowCytobot (McLane) have been successfully employed in mesocosm experiments in this mode.
4.1.3 AquaBox software: main features
AquaBox control software is coded in Python, and is composed of several scripts:
• main.py starts AquaBox by creating Framework and GUI
• framework.py the main script, links other parts and contains data on the state of the program
• gui.py contains elements and descriptors of the operating system
• devices.py contains drivers for instruments (pump, multichannel valves and relay cards)
• sensors.py contains drivers for sensors (Lauda, Aquapen, LISST, NanoFlu, Unilux, SBE45) and remotely operated instruments (IFCB, Chelsea)
• config.py reads the configuration file and root directory into parameters for other scripts
• include.py includes auxiliary functions for other scripts
• about.py creates the README file
• main.ini configuration file
The software produces log files, main log recording the basic system operation, state and functions (Fig. 12), and the status log (Fig. 13) recording detailed system status at 0.5 second intervals for performance analysis and troubleshooting.

D8.3 Final Report AquaBox
AQUACOSM – H2020 INFRAIA-2016-2017- No. 731065 Page 16 of 29
Co-funded by the European Union
Figure 12: Screen capture from AquaBox main log file (JOMEX experiment, 2019).
Figure 13: Screen capture from AquaBox status log file (JOMEX experiment, 2019).

D8.3 Final Report AquaBox
AQUACOSM – H2020 INFRAIA-2016-2017- No. 731065 Page 17 of 29
Co-funded by the European Union
Figure 14: Screen capture of the software graphical interface
In operation, the software includes a graphical interface (Fig. 14), visualizing the status of the system, with time series of measurements and other key household data (flow rate, inlet and outlet pressures). The program can be run in manual, continuous, or timed mode. In the continuous mode, the measurement cycle, consisting of rinsing and measurements phases, is run for all mesocosms (in pre-defined or random order), either continuously or with pre-set pause intervals between cycles. The timed mode allows pre-defined, irregular sampling frequencies over the diel cycle, if uneven sampling is required e.g. between the light and dark periods.
The software collects and time-stamps measurement data from all instruments controlled by the main code.
The AquaBox program can be run remotely (via TeamViewer), and the dedicated computers running proprietary software for specific analyzers (Imaging FlowCytobot, Chelsea FRRF) can be remotely controlled in an internal network through Remote Desktop Connection.
4.1.4 Sample flow modes: fast, slow, acclimation
The original plan to accommodate 3 measurement/sampling modes in AquaBox (immediate, delayed, catch & release) evolved in steps during the development work. Decisions to choose and modify the measurement modes are always dependent on the priorities of each experiment, as several trade-offs need to be decided upon.
D8.3 Final Report AquaBox
AQUACOSM – H2020 INFRAIA-2016-2017- No. 731065 Page 18 of 29
Co-funded by the European Union
The response times of instruments vary from milliseconds (fluorescence) to some minutes (gas measurements, especially pCO2), and even analysis cycles up to tens of minutes (Imaging FlowCytobot, FRRF). The rinsing of the dead volume of the sampling tubes takes 2.5 minutes in the current configuration, which sets the lower limit for sample change in the central unit. The number of mesocosms in turn defines the duration of a full measurement cycle. In a 12-mesocosm experiment, the highest frequency obtained is in the order of an hour (24 measurements per mesocosm in a day, 168 measurements per mesocosm in a week). While this pace does not produce real-time data sensu stricto, the frequency exceeds traditional mesocosm sampling by 1-2 orders of magnitude (see 4.2.1, Examples of data created by AquaBox) and covers excellently the expected biological dynamics of the planktonic system.
The decisions on the balance between high frequency in basic measurements and obtaining high-content information, like planktonic community change by imaging instruments or the properties of the phytoplankton photosystem by FRRF, need to be taken during the experiment planning phase. The AquaBox software, controlling the sampling cycles, can be modified flexibly according to the decision on the balance between measurements. We often settled on a balance between these information needs, by choosing a baseline of fast data acquisition, interrupted occasionally with less frequent sampling cycles (e.g. 1-2 samplings per day) including instruments with the longest response times.
One key factor in the design of experiment sampling strategy for AquaBox is the consumption of sample water for the analyses, critical in the case of relatively small mesocosms (some hundreds of liters). Especially the gas measurements require some minutes of fresh sample flow by the analyzer membrane to reach equilibrium between the sample water and the instrument detector chamber, leading easily to several liters of sample flow per measurement. If this volume is going to waste, high-frequency sampling would empty smaller mesocosms rather fast, whereas this would not be an issue in cubic-meter sized field mesocosms.
For situations with potentially limiting volumes we have set up a return cycle alternative in AquaBox; after the rinsing phase, the fresh sample water can be returned to the mesocosm while waiting for the equilibrium in measurement. As it can be suspected that this round trip could affect the most fragile organisms negatively, the effect should be checked prior to sampling strategy decisions, against the experiment target. Gentle peristaltic pumping is, in any case, one of the least destructive techniques for transferring live planktonic organisms from place to another.
4.1.5 From lab to the field
The AquaBox system was first built and tested in the Indoor Mesocosm Facility of the SYKE Marine Research Laboratory (Helsinki, Finland). From the start, it was planned to be used in field mesocosm experiments as well. Therefore, the development stage included planning a suitable measurement cabin that can be transported in modules and raised on floating field platforms. The design task was ordered in 2019 from André van Tulder Architects (AARK), and the result was the Octonaut cabin, to be built from weather-resistant modules on the platform, housing the field-going AquaBox for the JOMEX experiment in Tvärminne, Finland, in 2019 (Fig. 15, Appendix 1).

D8.3 Final Report AquaBox
AQUACOSM – H2020 INFRAIA-2016-2017- No. 731065 Page 19 of 29
Co-funded by the European Union
Figure 15: AquaBox built into the Octonaut cabin on a floating raft during the Tvärminne JOMEX experiment, 2019, with 12 experimental mesocosms. See details in Appendix 1.
4.2 AquaBox in mesocosm experiments
4.2.1 Examples of data created by AquaBox
To illustrate the basic data automatically produced by AquaBox in real mesocosm experiments, the chlorophyll a and CDOM fluorescence responses are presented below from the first trial in a 14-day indoor mesocosm experiment, May 2019.
Other examples come from more variable field conditions during the JOMEX experiment in Tvärminne, 2019 (Fig. 17), with identical treatments to Fig. 16. The basic data were here collected less frequently than in Fig. 16, as the sampling strategy was optimized to include also sampling for several instruments with the longest response times (pCO2, Imaging Flow Cytobot, Fast Repetition Rate Fluorometry).
The data in Fig. 17 clearly show diel light/dark cycles for fluorescence measurements, but also the technical problems occasionally encountered in field experiments: several mesocosms were injured during a storm incident during the experiment and started to progressively leak (departing from replicates). In Fig. 18, the dissolved gases (O2, CO2) measured with AquaBox show clearly the contrasting effects of nutrient and organic carbon treatments of the autotrophy/heterotrophy balance of the planktonic system.

D8.3 Final Report AquaBox
AQUACOSM – H2020 INFRAIA-2016-2017- No. 731065 Page 20 of 29
Co-funded by the European Union
Figure 16: AquaBox raw data on chlorophyll a and CDOM for 14 days in an indoor mesocosm experiment, May 2019, with addition of DOC (HuminFeed) and inorganic nutrients (PO4 and NO3) as treatments with 3 replicates.

D8.3 Final Report AquaBox
AQUACOSM – H2020 INFRAIA-2016-2017- No. 731065 Page 21 of 29
Co-funded by the European Union
Figure 17: AquaBox raw data on chlorophyll a and CDOM for 14 days in a field mesocosm experiment in Tvärminne, June-July 2019, with addition of DOC (HuminFeed) and inorganic nutrients (PO4 and NO3) as treatments with 3 replicates. See explanations on p. 16.

D8.3 Final Report AquaBox
AQUACOSM – H2020 INFRAIA-2016-2017- No. 731065 Page 22 of 29
Co-funded by the European Union
Figure 18: AquaBox raw data on O2 (upper panel) and pCO2 (lower panel) for 14 days in a field mesocosm experiment in Tvärminne, June-July 2019, with addition of DOC (C: HuminFeed) and inorganic nutrients (N: PO4 and NO3) as treatments with 3 replicates. The contrasting effects of nutrient and organic carbon treatments of the autotrophy/heterotrophy balance are evident.
4.2.2 AquaBox applications to mesocosm experiments
During 2019-2020, AquaBox has been used in slightly modified configurations in 4 full-scale mesocosm experiments. One has been in a field setting, and three in an indoor facility. Here we present some specificities of each experiment, relevant for AquaBox development.
4.2.2.1 Indoor test experiment, May 2019
This was the first run of the AquaBox in a real experiment setting, and to everyone’s surprise, the amount of troubleshooting of the rather complex system - in terms of both the physical setup and programming - was very moderate. This was a serious tribute to the development team. The basic flow-through instrumentation was tested and found functioning. Different sampling frequencies were experimented with along the experiment, and their effect on volume consumption and the output data were assessed. The experiment followed the joint JOMEX design (Fig. 16), with DOC (HuminFeed) additions as the backbone. We replicated the design by including also inorganic nutrient (PO4+NO3) treatment.
4.2.2.2 JOMEX field experiment, June-July 2019
The first field experiment (Fig. 15, 17, 18; Appendix 1) included a laborious but successful first run with the measurement cabin Octonaut, and adjusting the indoor-developed tubing network to the demands of a floating rack. The fast-track flow-through measurements were joined with slower gas measurements and the acclimation system for FRRF, IFCB and Aquapen samples in a lower frequency. The main program was markedly developed further during the experiment.

D8.3 Final Report AquaBox
AQUACOSM – H2020 INFRAIA-2016-2017- No. 731065 Page 23 of 29
Co-funded by the European Union
The experimental design was identical to the May experiment. AquaBox performed for the largest part well or excellently, troubleshooting with the connected ‘autonomous’ instruments were occasionally encountered though. The weather conditions caused the floating mesocosms to perform inferior to the AquaBox system.
4.2.2.3 Indoor microplastic TA experiment, August-September 2019
A Transnational Access experiment was run at the Indoor Mesocosm Facility of SYKE-MRC in the fall 2019, with the theme of effects of microplastics on the planktonic food web. AquaBox was used to produce the basic data for the experiment focusing on higher food web effects.
4.2.2.4 Indoor POC-DOC experiment, September 2020
During this experiment, new temperature control and mixing solutions for individual mesocosms were tested for the first time (Appendix 2), as the experimental design was based on a temperature gradient design. We are looking forward to utilize this feature in forthcoming AquaBox experiments, including some covid-postponed TA activities for 2021.
5. Summary and conclusions
The current status of AquaBox fulfils the targets set out in Task 8.2.2 in all essential respects, and the current version has proved to be functional, modular, and thus readily applicable to a variety of research interests in a mesocosm setting. The frequency and depth of the data generated automatically, for practically any number of experimental mesocosms, exceeds any existing alternative to our knowledge. The current outcome is not exactly a light-weight setup, and requires a small number of experienced users to be modified and run for each purpose, but the solutions reached here are largely scale-independent, and are openly available for the scientific community. We foresee high demand for the mesocosm-scale AquaBox principle, to intensify and widen the data retrieval from the dynamic planktonic system, but also generally, to enhance lab-independent mobility in mesocosm experimentation, as well as possibly for other related purposes such as “smart stations” for AQUATIC LTER stations.

D8.3 Final Report AquaBox
AQUACOSM – H2020 INFRAIA-2016-2017- No. 731065 Page 24 of 29
Co-funded by the European Union
6. Dissemination activities related with the Deliverable
National television news coverage of AquaBox in action in the Tvärminne/Baltic Sea JOMEX experiment, June-July 2019 (in Finnish):
https://www.mtvuutiset.fi/artikkeli/tutkimuslautta-taynna-koesakkeja-ja-mittalaitteita-itameren-roolia-ilmastonmuutoksessa-selvitetaan-hangossa/7468660#gs.gwdez7

D8.3 Final Report AquaBox
AQUACOSM – H2020 INFRAIA-2016-2017- No. 731065 Page 25 of 29
Co-funded by the European Union
7. Appendix 1
A photo collage from employing the AquaBox in a field mesocosm experiment at the Tvärminne Zoological Station, University of Helsinki (AQUACOSM JOMEX experiments, WP9).

D8.3 Final Report AquaBox
AQUACOSM – H2020 INFRAIA-2016-2017- No. 731065 Page 26 of 29
Co-funded by the European Union

D8.3 Final Report AquaBox
AQUACOSM – H2020 INFRAIA-2016-2017- No. 731065 Page 27 of 29
Co-funded by the European Union

D8.3 Final Report AquaBox
AQUACOSM – H2020 INFRAIA-2016-2017- No. 731065 Page 28 of 29
Co-funded by the European Union
8. Appendix 2
A photo collage from employing the AquaBox in an indoor experiment on POC-DOC interactions in the planktonic food web, SYKE-MRC laboratory in September 2020. The experiment was based on a temperature gradient, and represented the first real-life test of the facility’s new warming and mixing solutions for individual mesocosms.

D8.3 Final Report AquaBox
AQUACOSM – H2020 INFRAIA-2016-2017- No. 731065 Page 29 of 29
Co-funded by the European Union