conoscere i social media - introduzione a #smem
TRANSCRIPT

Consulting · Training · Air Broking

aviation����������� ������������������ &����������� ������������������ beyond...

Rieti 9 novembre 2013

Colum Donnelly
#SMEMRI

#SMEM

Social Media

Diffusione informazioni

Internet

Cosa significa per te?

THE SOCIAL MEDIA REPORTSTATE OF THE MEDIA:
2012

of consumers’ PC time is spent on Facebook, the most popular web brand in the U.S.
More and more people are connecting to the Internet—and for longer amounts of time
TOTAL MINUTES SPENT ON MOBILE AND PC
Overall Unique U.S. Audience JULY 2011 JULY 2012
Total Minutes, U.S.JULY 2011 | JULY 2012
Whether through a computer or mobile phone, consumers continue to spend increasing amounts of time on the Internet. Time spent on PCs and smartphones was up 21 percent from July 2011 to July 2012. App time more than doubled during this period as more smartphone owners entered the market and the number of available apps multiplied.
People continue to spend more time on social networks than any other category of sites—20% of their time spent on PCs and 30% of their mobile time.
17%
PC
MOBILE APPS
MOBILE WEB
TOTAL
129.4 B
28.1 B
362.7 B
520.1 B
348.6 B
58.8 B
23.0 B
430.4 B
52,435,000 | 95,176,000 82%MOBILE WEB MOBILE APPS
55,001,000 | 101,802,00085%
213,253,000 | 204,721,000
PC
4%
4%
22%
120%
21%
© Nielsen 2012© Nielsen 20123 4

SOCIAL NETWORKING
IS ALL ABOUT MOBILE
When it comes to accessing social content, it's all about mobile—particularly apps. App usage now accounts for more than a third of social networking time across PCs and mobile devices. Compared to last year, consumers increased their social app time by 76 percent, spending more than seven times more minutes on apps than the mobile web.
While the social media audience via PC declined a slight five percent from a year ago, time spent increased 24 percent over the same period, suggestinging that users are more deeply engaged.
MOBILE WEB
MOBILE APPS
JULY 2011 | JULY 2012
Unique U.S. Audience for Social Networking
PC MOBILE WEB & APP
163.6M | 171.8M
43.0
M
44.8
M
85.8
M
81.1M
TIME SPENT ON SOCIAL MEDIA
ASIAN
HISPANIC
AFRICAN-AMERICAN
WHITE 7:24
8:07
7:19
7:49
7:47
8:20
11:13
6:42
AGES 25-34
FEMALE
AGES 35-44
AGES 45-54
AGES 55-64
AGES 65+
AGES 18-24
MALE
4:18
6:13
8:37
11:01
9:04
8:128:34
6:57
3:42
6:44
9:43
10:15
11:05
8:46
5:20
4:06
5%
5.7B 74.0B40.8B
4.4B 59.5B23.2B
TotalMinutes
JULY 2012
61%
34%
5%
Distribution of Social Media Time Spent
Social Networking Time per Person in HH:MM
121.1B
88.4BJULY 2011
YOY CHANGE
© Nielsen 2012© Nielsen 2012 6

A LOOK AT THE TOP SOCIAL NETWORKS
+13%
-3%
-4%
-13%
+10%
0%
+1,047%
+80%*
+55%
+20%
YOY CHANGEAUDIENCE (000)
The list of most-visited social networking sites is pretty much the same whether people are going online through a PC browser, through their mobile web browser or using an app. Mobile usage once again proves to be a key component of social as each of the top networks via mobile web saw significantly greater growth compared to its PC audience over the last year.
*Google+ is July 2012 v. Sept 2011, the first month the site became public
TOTAL MINUTES SPENT
1 5 2 2 2 6
5 8 5 1 8
3 7 0 3 3
3 0 9 4 5
2 8 1 1 3
2 7 2 2 3
2 6 2 0 1
2 5 6 3 4
1 9 6 8 0
1 2 5 9 4
UNIQUE PC VISITORS, U.S.(AUDIENCE 000)
Blogger
Wordpress
Tumblr
Wikia
Myspace
85%
140%
100%
4,225%
96%
114%
162%
n/a
153%
57%
foursquare
Google+
88%
134%
118%
86%
1,698%
MOBILE WEB
MOBILE APP
2012 PinterestMobile Web2011
PinterestMobile Web
BLOGGER
WORDPRESS
GOOGLE+
TUMBLR
MYSPACE
WIKIA
Unique U.S. Audience (in millions)
7 8 3 8 8
2 2 6 2 0
1 0 3 8 8
9 7 1 8
4 9 4 6
YOY CHANGEAUDIENCE (000)
7 4 2 7 4
4 2 3 6 6
1 9 9 7 9
1 4 3 1 6
1 1 9 9 5
9 6 7 1
8 5 1 2
5 3 2 5
4 2 7 5
3 5 0 1
YOY CHANGE
Top 5 U.S. Social Networking Sites via PC Ranked on Total Minutes
Total Minutes YOY % Change
Facebook 62.2B 23%
Tumblr 2.1B 65%
Twitter 1.8B 72%
Pinterest 1.3B N/A
Blogger 816.1M -17%
Top 5 U.S. Social Networking Sites via Mobile Web Ranked on Total Minutes
Total Minutes YOY % Change
Facebook 4.1B 9%
Twitter 486.2M 139%
Blogger 170.0M 89%
Tumblr 164.6M 78%
Reddit 138.0M 342%
Top 5 U.S. Social Networking Apps Ranked on Total Minutes
Total Minutes YOY % Change
Facebook 27.0B 61%
Twitter 3.6B 48%
foursquare 1.9B 154%
Pinterest 721.0M 6,056%Google
Latitude 599.2M -2%
© Nielsen 2012© Nielsen 2012 8

WHO IS USING PINTEREST?A SPOTLIGHT ON PINTEREST Pinterest has experienced exponential growth since bursting on the scene last year. Although that growth has leveled over the last few months, Pinterest had the largest year-over-year increase in audience and time spent of any social network, across PC, mobile web and apps.
0
5,000,000
10,000,000
15,000,000
20,000,000
25,000,000
30,000,000
JUL 12JUN 12MAY 12APR 12MAR 12FEB 12JAN 12DEC 11NOV 11OCT 11SEP 11AUG 11JUL 11
720,973,000 1,255,225,000 120,486,000
2012 Total Minutes Spent
Unique U.S. AudienceU.S. Audience Composition
79% 74%
10%5%6%
8% 22% 22%
86%
7%
24%
31%
24%
14%
4%
5%
33%
37%
22%
1%
18%
31%
31%
20%
70% 84% 72%
28%16%30%
AFRICAN-AMERICAN
HISPANIC
3%ASIAN 7% 7%
WHITE
AGES 65+
AGES 50-64
AGES 35-49
AGES 25-34
AGES 18-24
FEMALE
MALE
PC
MOBILEWEB
MOBILEAPPS
27,223,000
14,316,000
4,946,000
© Nielsen 2012© Nielsen 20129 10

HOW, WHERE AND WHY WE CONNECTWhile the computer is still the primary device used to access social media, the last year saw significant increases in usage, most notably through tablets and Internet-enabled TVs.
It may be fun to follow celebrities, but actually knowing someone still matters when deciding to connect on social networks.
CONNECTEDINFORMEDAMUSED
INDIFFERENT HAP
PYCONTENT
WASTED TIME
GENERAL FEELINGS AFTER PARTICIPATING IN SOCIAL NETWORKING
HOW WE CONNECT
76%
positive
24%
neutral
21%
negative
COMPUTER MOBILE PHONE
TABLET INTERNET ENABLEDTELEVISION
E-READERGAMECONSOLE
HANDHELDMUSIC PLAYER
94%97%
46%
37%
16%
3% 7%7%
4%3% 4%
2% 3%2%
Person’s number of connections
Quality of profile photo
Acccess to business networks
Want to increaseconnection count
Know person in real life
Mutual friends
Person’s physical attractiveness
Interested in keeping up
Always accept all requests
63%60% 65%
50% 52%48%
42% 41% 44%
13% 16% 10%
9% 14%
4%
8% 10%6%
5% 7% 4% 6% 7% 4%6% 8%4% TOTAL
MEN
WOMEN
WHERE WE CONNECT
WHY WE CONNECT
2011 | 2012
AGES 18-24
51%
AGES 25-34
TMI? Nearly a third (32%) of people aged 18-24 use social networking in the bathroom.
More than half of people aged 25-34 use social networking in the office, more than any other age group.
OVERWHELMED
ENG
ERG
IZED EXCITED
ANXIOUS EAGER
SADANGRYJEALOUS
© Nielsen 2012© Nielsen 201211 12

Twitter has emerged as a key driver of social TV interaction. During June 2012, a third of active Twitter users tweeted about TV-related content, an increase of 27 percent from the beginning of the year.
TWITTER DRIVES SOCIAL TV
Visited a social networking site during the program
38% 44%
Looked up information related to the TV program being watched
23% 35%
Looked up product information for an advertisement seen on TV
15% 26%
Looked up coupons or deals related to an advertisement seen on TV
12% 24%
Shopping
22% 45%
SIMULTANEOUS SMARTPHONE AND TABLET USAGE WHILE WATCHING TVHaving a mobile device on-hand while watching TV has become an integral part of consumer routines—41 percent of tablet owners and 38 percent of smartphone owners use their device daily while in front of their TV screen. Not surprisingly, social networking is a top activity on both devices, but people aren’t just chatting with their social connections, they’re also shopping and looking up relevant program and product info.
Nearly a quarter of people aged 18-34 use social media to comment on what they like/dislike about a storyline while watching TV
SPOILER ALERT
Adults aged 35-44 are the most likely to discuss television programming with their social connections
TALKING TV
Simultaneous TV/Mobile Device Usage, U.S.
JANUARY FEBRUARY MARCH APRIL MAY JUNE
33%
29%30%
27%28%
26%
% of Active Twitter Users Tweeting about TV, U.S.
© Nielsen 2012© Nielsen 201213 14

FREQUENCY OF SOCIAL CARE USE AMONG USERS
SOCIAL CARE VSCUSTOMER SERVICE BY PHONE
CHANNELS USED TO ACCESS SOCIAL CARE
SOCIAL CARESocial care, i.e. customer service via social media, has become an immediate imperative for global brands. Customers choose when and where they voice their questions, issues and complaints, blurring the line between marketing and customer service. Brands should consider this evolution and ensure they are ready to react on all channels.
ON AVERAGE, 47% OF SOCIAL MEDIA USERSENGAGE IN SOCIAL CARE
9% Daily
21% Weekly
70% Monthly
One in three social media users prefer social care to contacting a company by phone
30%TOTALP 18-24
P 25-34
P 35-44
P 45-54P 55-64
P 65+
37%35%
31%
26%24%
17%
Facebook | Company’s Page
Facebook | User’s Personal Page
Official Company Blog
Twitter | Personal Handle (no @ mention of company)
Twitter | Company’s Handle (tweet from user’s personal handle including an @mention of company)
YouTube | Company’s Channel
YouTube | User’s Personal Channel
Non-company Blog
Consumers turn to a wide variety of social media platforms for social care. Social media users are most likely to comment on or ask a question about a company’s product or service on Facebook, both on the company’s page (29%) and on their personal page (28%).
29%
28%
15%
14%
13%
12%
11%
11%
© Nielsen 2012© Nielsen 201215 16
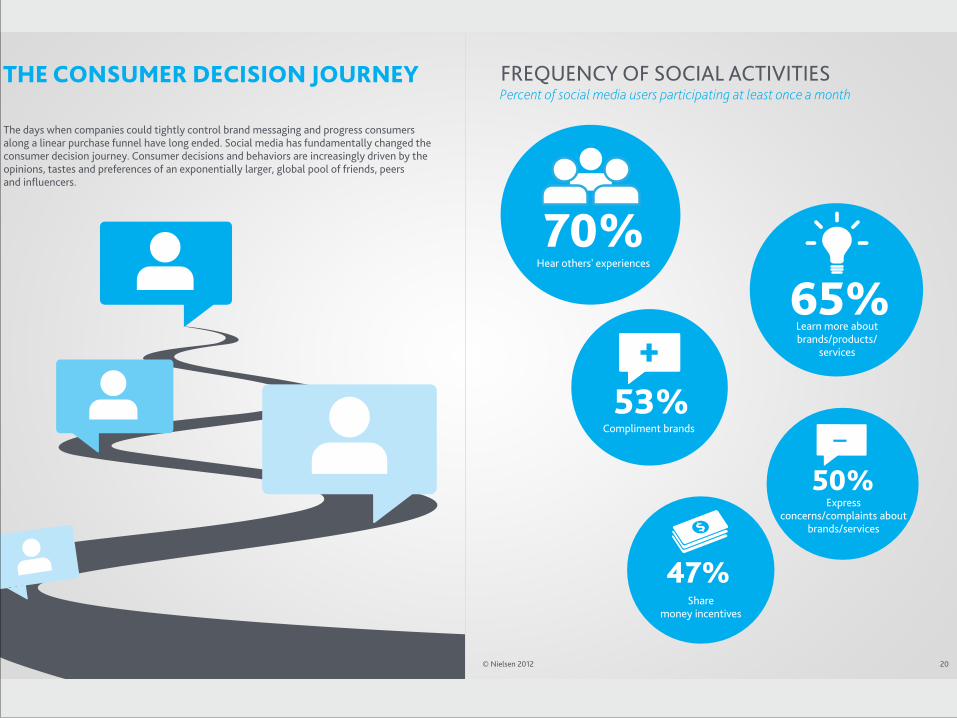
FREQUENCY OF SOCIAL ACTIVITIESTHE CONSUMER DECISION JOURNEYPercent of social media users participating at least once a month
65%70%
53%
47%
Hear others' experiences
Learn more about brands/products/
services
Compliment brands
Express concerns/complaints about
brands/services
Share money incentives
The days when companies could tightly control brand messaging and progress consumers along a linear purchase funnel have long ended. Social media has fundamentally changed the consumer decision journey. Consumer decisions and behaviors are increasingly driven by the opinions, tastes and preferences of an exponentially larger, global pool of friends, peers and influencers.
++
50%
_
© Nielsen 2012© Nielsen 2012 20

THE GLOBAL SOCIAL CONSUMER
INTERNETENABLED
TV
GAMECONSOLE
HANDHELDMUSIC PLAYER
ASIA-PACIFIC
EUROPE
M. EAST/AFRICA
LATIN AMERICA
ASIA-PACIFIC
EUROPE
M. EAST/AFRICA
LATIN AMERICA
ASIA-PACIFIC
EUROPE
M. EAST/AFRICA
LATIN AMERICA
9%
4%
9%
4%
5%
3%
2%
3%
5%
2%
2%
2%
COMPUTER
MOBILE PHONE TABLET
93%ASIA-PACIFIC
EUROPE
M. EAST/AFRICA
LATIN AMERICA
ASIA-PACIFIC
EUROPE
M. EAST/AFRICA
LATIN AMERICA
ASIA-PACIFIC
EUROPE
M. EAST/AFRICA
LATIN AMERICA
96%
91%
96%
59%
33%
48%
33%
28%
8%
10%
6%
A recent Nielsen survey of more than 28,000 global consumers with Internet access explored social media’s global reach and impact. From how consumers connect and interact with social media to social’s influence on what people buy, there are noticeable differences across regions, which are highlighted in the following special section focusing on the global social consumer.
HOW DO YOU ACCESS SOCIAL NETWORKING SITES?
© Nielsen 2012© Nielsen 201221 22

47%ASIA-PACIFIC
63%MIDDLE EAST/
AFRICA
THE GLOBAL CONSUMER DECISION JOURNEY
ARE YOU INTERACTING WITH SOCIAL MEDIA WHILE WATCHING TV?
38%EUROPE
52%LATIN
AMERICA
YES NO
The role of social media in the consumer decision journey extends beyond North America, and indeed is even more pronounced in other regions. Social media’s influence on purchase intent is strong across all regions, but strongest among online consumers in the Asia-Pacific, Latin America and Middle East / Africa markets. Thirty percent of online consumers in the Middle East / Africa region and 29 percent in Asia-Pacific use social media on a daily basis to learn more about brands/products/services, with one-third of respondents in both regions connecting on a weekly basis. Across all regions, social media has the potential to influence consumers’ entertainment and home electronics purchase decisions. These categories are
© Nielsen 2012© Nielsen 201223 24
followed closely by: Travel/Leisure (60%), Appliances (58%), Food/Beverages (58%), Clothing/Fashion (58%) and Restaurants (57%). These categories were also the most discussed products/services via social networking. Social media represents a huge opportunity for brands to gain positive favor with consumers. With growing disposable income in emerging markets, savvy marketers can harness the growing adoption and influence of social media to impact business.

Social Media vs Social Network

Social Media

Social Network

Integration

Storia.

30 anni di età (almeno)

Siti Internet

Interazione


CompuServe

1978

BBS Bulletin Board System

19841984

ProdigyProdigy

19851985

AOLAOL
1991

Tim Berners-Lee

Mosaic & Browsers warwww
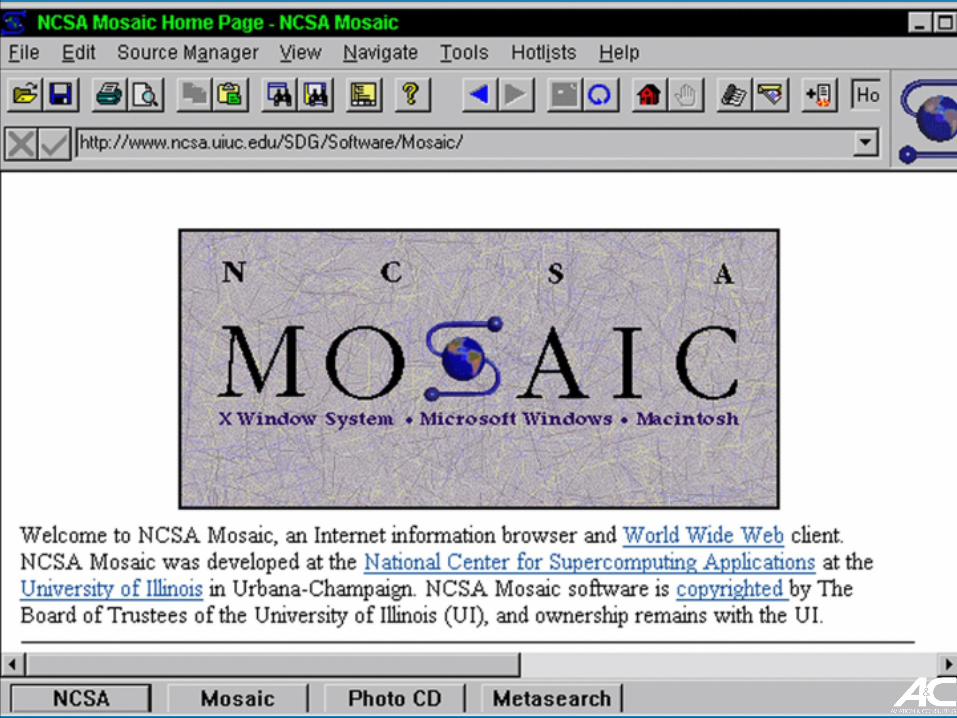
Mosaic & Browsers war

1995

GeocitiesGeoCities

1997

AIM chatAIM Chat

SixDegrees.comSixDegrees

Blackboard.com

1998


1999

Friendsriunited.com

2k

iPod

2002

Friendster

2003

MySpace

Second Life


iTunes

2004


Flickr

Digg

Podcasting

2005

BeBo blog early, blog often

YouTube

2006


2007

iPhone

2008
Facebook #1 USA
2009

unfriend

2010

Google Buzz

Obama & SM

2011.....
Pintrest

Google +

Non basta fare il bene, bisogna anche farlo bene
!(Denis Diderot)

VareseNews.it Roberto Morandi

#SoMe & PC
4 fasi della PC
Riduzione del Rischio

Focus on technology and the future of humanitarian action
World Disasters Report
#WDR2013

#WDR2013 #DigitalDivide

#Resilienza

#Resilienza e #Preparazione

Battaglia d’Inghilterra WWII

#Resilienza e #Preparazione Italia, 2013

#PA & #SoMe Italia, 2013Vademecum
Pubblica Amministrazione e social media

#Resilienza e #Preparazione Italia, 2013

I loghi, i marchi e tutti i materiali multimediali utilizzati appartengono ai legittimi proprietari che ne detengono ogni diritto e sono qui riportati ad esclusivo fine didattico
Logos, trademarks and any other content belong to the respective owners; since this presentation was made for educational and research purposes, we believe that this constitutes a fair use of the copyrighted material