consider the possibilities - lowes.com · lowe’s 2010 annual report 5 seasonal living customers...
TRANSCRIPT

CONSIDER THE POSSIBILITIES2010 ANNUAL REPORT
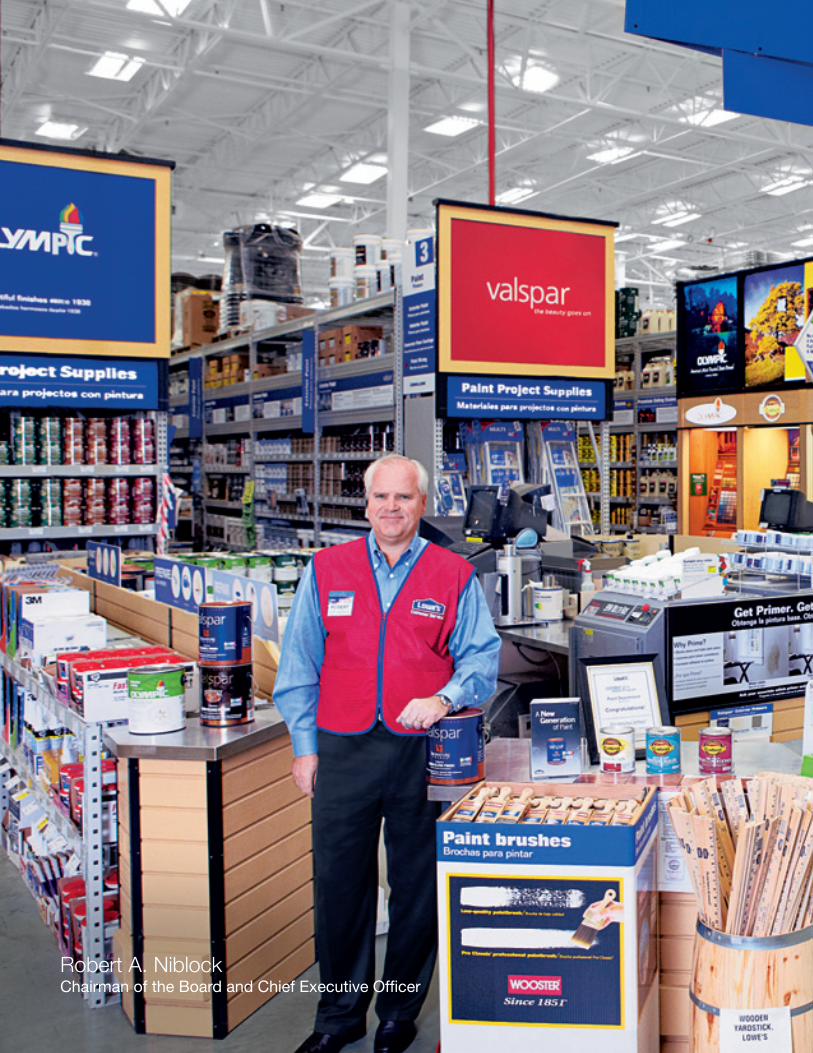
Robert A. NiblockChairman of the Board and Chief Executive Officer

In 2010, we generated solid earnings and cash flow as we grew our unit market share in 10 of 19 product
categories. We delivered on our brand promise by helping customers take advantage of government stimulus
programs like cash for appliances and energy tax credits. We also offered great values with national brands like
StainMaster® carpet and Valspar® paint, and with our private brands like allen + roth® home décor and Kobalt®
tools that offer exceptional style and function at a great price. Additionally, we provided strong credit offers
and affordable delivery and installation options. Further, we completed the roll-out of our District Commercial
Account Specialist (DCAS) and Project Specialist Exteriors (PSE) programs to more effectively reach customers
at their job site or home. Finally, while we further tempered our store expansion, we invested in new capabilities
that will help us generate more sales in our existing stores.
Looking forward, we expect customers will increase their spending as the cycle of declining home values ends
and as they become more confident in the employment outlook. But we can’t rely solely on the strengthening
economy. Strong employment growth and the bottom in home values are not expected until later in 2011.
We believe we can grow market share by focusing on the opportunity we have with existing customers – in other
words, garnering a greater share of wallet. Our research tells us customers are spending cautiously, stretching
out projects or buying only a few items instead of many, but they are still highly engaged in home improvement.
To win their business, we have to give them a sense of control, recognizing their personal needs and their desire
FinanCial HigHligHtsin MilliOns, EXCEPt PER sHaRE Data
CHangE OvER 2009 FisCal 2010 FisCal 2009
Net Sales 3.4% $48,815 $47,220
Gross Margin 28 bps1 35.14% 34.86%
Pre-Tax Earnings 14.2% $ 3,228 $ 2,825
Diluted Earnings Per Share 17.4% $ 1.42 $ 1.21
Cash Dividends Per Share 18.3% $ 0.42 $ 0.36
1 Basis Points
We are growing again. lowe’s 2010 comparable store sales increased 1.3% – the first such
increase since 2005. From 2005 to 2010 our total U.s. sales increased by 12.9%, while the
home improvement market defined by the north american industrial Classification system
(naiCs) 444 declined 10.4%, indicating that we increased our market share during this
period of contraction. During that time, we continued to focus on the strengths that have
differentiated us as a home improvement retailer: great service, operational excellence and
innovative merchandising.

COngRatUlatiOnslarry stone, President and
COO, will retire this year on his
42nd anniversary with lowe’s.
larry has served in virtually
every leadership position in store
operations, merchandising and
store environment during his
career. through dedication and
professionalism, he has made
many important and lasting
contributions to lowe’s and is
admired throughout our industry.
it is an understatement to say
he will be missed, and we wish
him the best as he begins the
next chapter in his life.
larry D. stonePresident and Chief Operating Officer
for simplicity and value. Our commitment is to deliver better customer experiences by pulling together the best
combination of possibilities, support and value for customers.
In 2010, we took the first steps in our journey to transform Lowe’s from a home improvement retailer to a home
improvement company. What’s the difference? To my mind, a successful home improvement retailer stocks
shelves with the inventory customers want and provides great service. A home improvement
company stretches beyond the confines of brick and mortar stores to provide inspiration,
products and support to customers whenever and wherever they choose, often still in their
local store – or perhaps through our contact center, on the Web, or with a Lowe’s representative
in their home or at their job site. As you can see, being a home improvement company quickly
expands the possibilities available to customers, and I invite you to further consider those
possibilities with us in this report. Some possibilities are already in place while others are still
under development, but they all are part of a coordinated effort to provide better experiences
to the more than 15 million customers who visit our stores weekly, or experience Lowe’s from
their homes or wherever else they choose.
We’ve made some important first steps, but we know we still have a long journey to fully
realize our promise to provide better experiences to customers. I am very appreciative of
our more than 234,000 employees for their resilience throughout the recession and the
sluggish start to the recovery. I am certain they will continue to display teamwork, creativity
and flexibility as we implement new systems and processes that will transform Lowe’s from
a great home improvement retailer to an even better home improvement company.
Thank you for your interest in Lowe’s and for considering the possibilities with us.
Sincerely,
Robert A. Niblock
Chairman of the Board and Chief Executive Officer

Our customers never stop finding ways to make their
homes even better. Lowe’s shares that same passion to
constantly look for ways to make the home improvement
experience an even better one for our customers – to
always consider the possibilities.

2 consider the possibilities

loWe’s 2010 AnnuAl report 3
it’s possible to…
desiGn A room Without ever leAvinG it
Each person’s home has an identity – one that is as unique as its
owner. At Lowe’s, we are dedicated to helping bring customers’
home improvement ideas to life.
Utilizing Lowe’s Creative Ideas™ magazine and website, customers
are able to view ideas and tips that will make their project unique.
Then they can easily purchase the products that appeal to them
by referring to the product number listed for each item. With nearly
three million readers, Lowe’s Creative Ideas magazine is a trusted
source for the latest styles and trends.
On Lowes.com, customers can use inspirational tools that will
help them discover possibilities for their homes. Product selection
is easy online, as customers can compare similar products
and then complete their purchases without ever leaving their
homes. With over 140,000 items available online, customers
can be confident they will find everything required for their
projects. They can also choose to have their items delivered –
or scheduled for pick up at the store of their choice in as little
as 20 minutes, guaranteed.

4 consider the possibilities
it’s possible to…
hAve A shoWroom experience With biG box vAlue
Nursery
Customers can find inspiration for a simple weekend
project that will beautify their yard.
Fashion Plumbing
Customers can experience the interactive feel of a designer
showroom while taking advantage of Lowe’s low prices.

loWe’s 2010 AnnuAl report 5
Seasonal Living
Customers can view and experience the
complete patio set in the store, giving them
confidence in its look, feel and durability.
Cabinets & Countertops
When shopping for cabinets and countertops, customers
can explore different colors and materials to create a unique
look and feel. Customers can interact with coordinating
vignettes to see how these products would look in their
own homes.
Paint
With a broad spectrum of paint colors to choose from, and with the
availability of our advanced color matching system, customers can find
a color that matches any inspirational item. By selecting Valspar® HI-DEF™
paint, customers can ensure exceptional color accuracy, ultimate hide,
and superior fade resistance.
Flooring
Whether they are looking for carpet, ceramic, hardwoods
or laminates, customers can experience hundreds of alter-
native textures and colors, many available for immediate
purchase or on a quick-ship basis. We also offer installation
at a great price.

6 consider the possibilities

loWe’s 2010 AnnuAl report 7
it’s possible to…
tAckle A complex exterior project With A simple solution
We make it simple and easy to improve the outside of customers’
homes. Our knowledgeable employees have the tools and skills
necessary to help customers plan for and complete a wide
range of exterior projects for their homes, including windows,
doors, roofs, gutters, siding, decks and fences.
Many customers want the convenience to shop, obtain expert
advice, make selections and purchase from the comfort of their
homes – that’s where our more than 1,300 Project Specialist
Exteriors (PSE) come in. PSEs visit customers’ homes and
explore possibilities with them by discussing ideas and sharing
product samples. They also explain the installation process and,
if the customer is ready, provide a quote and complete the
transaction within the same visit.
Afterwards, Lowe’s follows up to schedule the installation and
keeps the customer up to date on the progress of the installation,
making a potentially overwhelming project a simple experience
for the customer.

8 consider the possibilities

loWe’s 2010 AnnuAl report 9
it’s possible to…
support A homeoWner With A community of expertise
We know that our customers’ time is precious. This is why we
continue to identify more ways to assist them both inside and
outside the store. In 2010, our store employees began using
a business community portal that puts them in touch with fellow
employees throughout our chain. Through this portal they are
able to communicate with one another and offer solutions to
the questions they encounter every day.
In early 2011, we launched a tool for all product categories on
Lowes.com that gives customers the ability to ask product-
specific questions and receive answers from a variety of sources,
including the Lowes.com community, Lowe’s employees or
product vendors.
With these systems, our employees can provide more
in-depth advice in the store or wherever the customer
needs, allowing customers to more easily complete their
home improvement projects.
We know that customers expect simplicity and want the
shopping experience to be as seamless as possible. This is
why we are focused on providing the support customers want
in the format that is most convenient for them.
PHOTO: millennial couple painting
room after consulting with Lowe’s paint
specialist in photoa bove
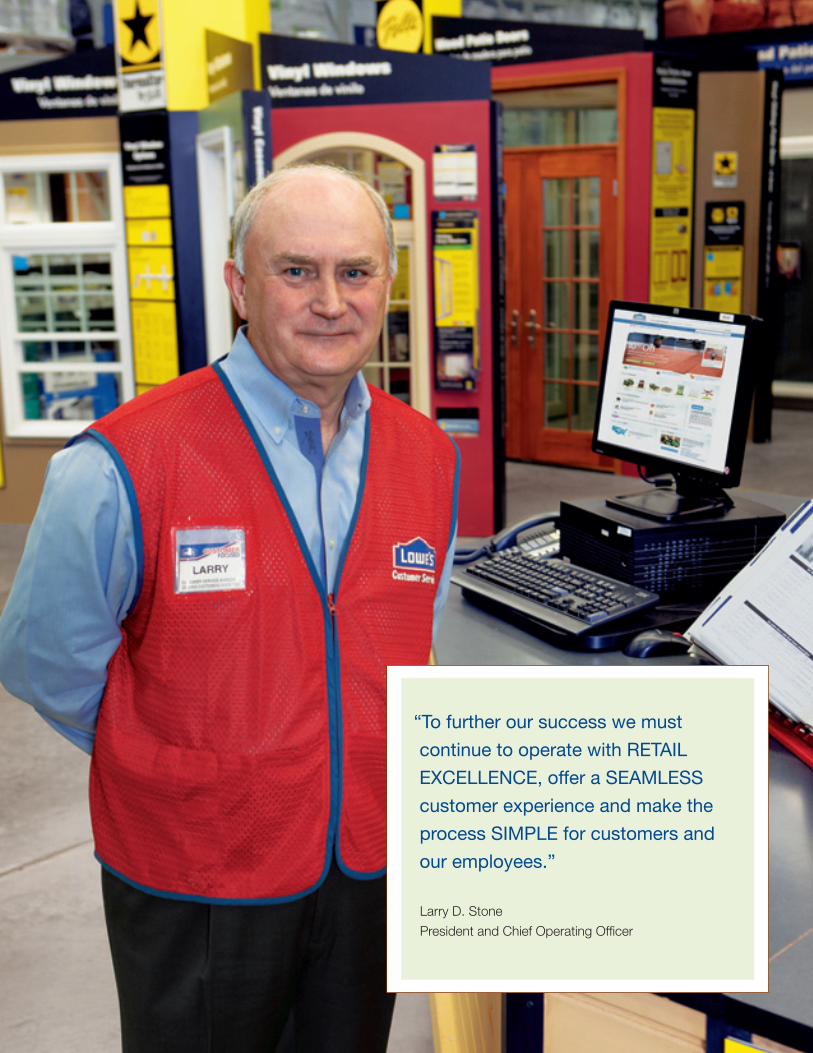
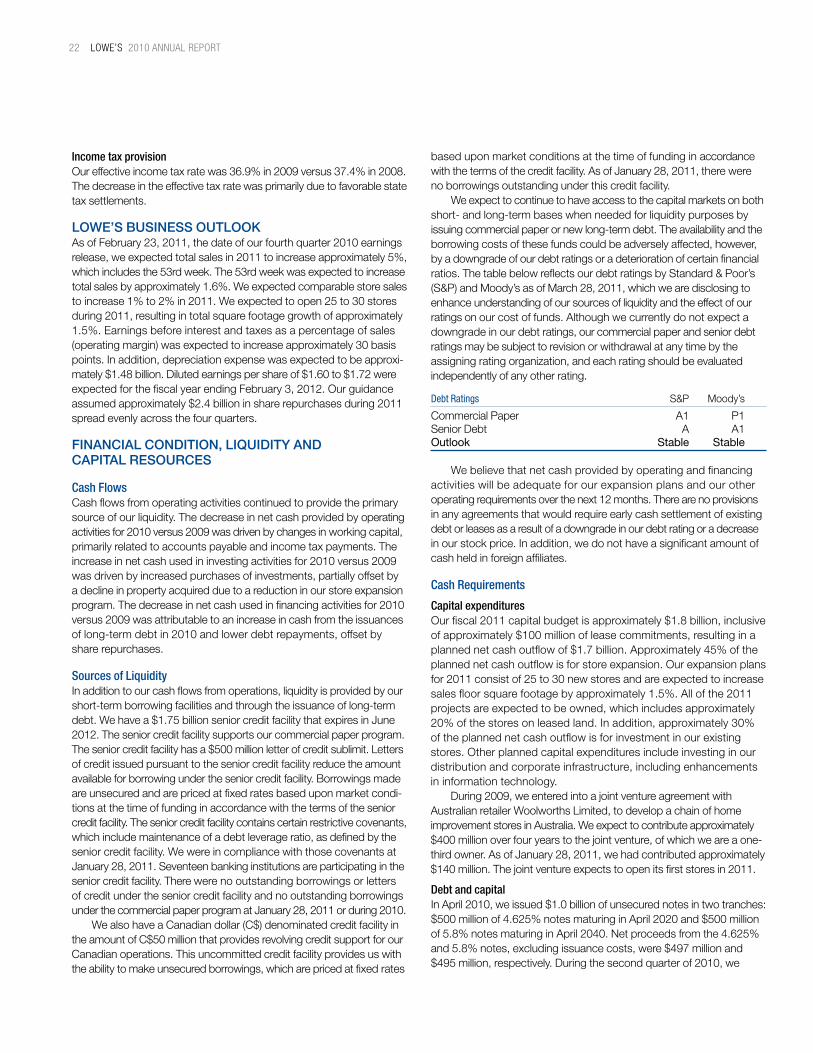
“To further our success we must
continue to operate with RETAIL
EXCELLENCE, offer a SEAMLESS
customer experience and make the
process SIMPLE for customers and
our employees.”
Larry D. Stone
President and Chief Operating Officer

loWe’s 2010 AnnuAl report 11
RETAIL EXCELLENCE
We continue to deliver the great values that
customers have come to expect while main-
taining our reputation for offering innovative
products and always striving to create a
superior shopping experience.
To deliver an even better experience at a value,
we continually look for opportunities within our
corporate office, field support and stores to
work more efficiently. For example, we refine
our product categories based on the role each
plays in our overall merchandising portfolio. This
allows us to allocate resources, like inventory
and marketing dollars, to optimize the portfolio.
We have identified four roles that we will focus
on in the coming years: destination, core, proj-
ect completer and opportunistic.
In addition to defining the role of the categories,
we continue to focus on our “go local” strategy.
“Go local” means that we adapt our assortments,
pricing and advertising to each market we serve,
while always adhering to the fundamentals of
customer service and store environment that
make Lowe’s unique. We made two important
changes to our pricing strategy in 2010. First,
we increased the number of patch areas, or
competitive pricing zones, from under 90 to
more than 210. This allowed us to price more
competitively in each market. In addition, we
implemented Base Price Optimization, which
determines the best price, by item and patch
area, to optimize positive price perception and
total basket profitability.
In 2011, we will further implement Integrated
Planning and Execution (IP&E). IP&E will com-
plement the judgment and creativity of our
merchants, helping them realize the objectives of
category management and our “go local” strategy.
In simple terms, these tools and processes
will help us to get the right product to the right
place at the right time – even more efficiently
and effectively than we do today. We will use
IP&E to more specifically determine what
executinG onour promise

12 operAtions updAte
Lowes.com/Mobile Site We are excited about our updated Lowes.com platform and the mobile site we
launched in December 2010. Our Lowes.com platform has improved search
capabilities, new navigation and expanded marketing reach. With our mobile site,
we have built a foundation that will allow customers to start or continue their
multichannel shopping experiences on mobile devices, regardless of location.

loWe’s 2010 AnnuAl report 13
products and quantities to offer in each store
based on market requirements, demographics,
customer shopping preferences and local store
employee knowledge. We expect to begin realiz-
ing the benefits of IP&E’s clustering and assorting
capabilities as we perform line reviews and
product resets in 2011. Further benefits will
be realized when we tie together assortment
planning, store layout and planograms, as well
as our financial models and logistics systems,
to even more efficiently supply the right products
and inventory to meet customer demand.
Further, during the economic downturn we have
effectively managed payroll while maintaining
the service levels customers expect in our stores.
To further improve our staffing efficiency we
are implementing a new staffing software tool,
which provides detailed scheduling forecasts
based on each store’s customer traffic patterns,
incorporates each store’s penetration of specialty
business into that forecast and provides managers
with improved visibility to daily staffing needs
by department.
Finally, we also continue to refine our supply chain.
Over the past six years, on a comparable-volume
basis, we have increased our trailer utilization
and have reduced over-the-road miles by over
550 million. Over that same period, these
efficiencies have reduced our fuel consumption
by over 100 million gallons and our carbon
emissions by over one million tons.
SEAMLESS
We must provide customers the ability to shop
Lowe’s wherever and whenever they choose,
creating a seamless customer experience.
Customers are shopping at Lowe’s, whether
that includes a single store, multiple stores,
Lowes.com, over the phone or with an in-home
sales specialist.
Lowes.com is important as an independent sales
channel and also because a large portion of our
sales are influenced online. Customers can now
find over 350 how-to videos to start them on their
next project or help them complete one they have
already started. We offer the full continuum of
products on Lowes.com, from opening price
points to premium quality products. We have
over 140,000 items online, and each week we
are adding over 1,000 items. Further, customers
shopping Lowes.com can have the item shipped
GOInG LOCAL AnD OPTIMIzInG
OPErATIOnS DrIVE PErFOrMAnCE
retail excellence

14 operAtions updAte
to them or they can purchase it online and
pick it up at the store of their choice within
20 minutes – guaranteed.
But a truly seamless experience requires more
than systems. Particularly for large and complex
projects, customers often want to meet with an
expert who can walk them through the project
requirements and coordinate key steps. The
Project Specialist Exteriors (PSE) model allows
the PSE to discuss the project, take the
measurements and complete the transaction in
the same visit, and all in the customer’s home.
There are now over 1,300 PSEs in the market.
Finally, a seamless experience also involves a
fulfillment model that results in a better customer
experience and lower cost of product delivery.
Today, if customers are shopping in one store
and want to ship from another, the order has to
be called into the other store. In the future, we
will capture customers’ orders in the Lowe’s
stores where they are shopping. Then we will
automatically transmit the orders to the stores
or warehouses for shipping in the most efficient
and cost-effective manner. This approach will be
facilitated by our highly developed distribution
system, which not only provides us with the lowest
landed cost, but also gives us ready capacity and
capabilities for flexible fulfillment. Customers will
only know that they were able to easily purchase
the product they wanted from the location or
method they chose and have it efficiently delivered
where they needed it – that’s seamless.
SIMPLE
Our focus is also on simplifying customers’
experiences when planning projects and buying
products. We want to make the process simpler
for our employees, too. So, we have embarked on
an initiative called Services Platform, which will
replace legacy systems with package applications
that are more efficient to maintain and offer best-in-
class functionality. For instance, we are implement-
ing a customer relationship management solution,
a knowledge management tool, a discrete order
management system and an improved contact
center voice system. We believe that these tools
will help us better manage customers’ projects
from lead generation through job completion, which
will lead to improved customer satisfaction.
Our repair services program for major appliances
is another way we are simplifying customers’
FLExIBLE OPTIOnS EnHAnCE THE
CUSTOMEr ExPErIEnCE
seamless & simple

loWe’s 2010 AnnuAl report 15
District Commercial Account Specialist Our District Commercial Account Specialist (DCAS) serves the role of account
representative, cultivating existing relationships as well as building new relation-
ships with commercial customers. DCASs leverage stores within their districts
to ensure we can meet customer needs for products and resources. We now
have 135 DCAS positions in markets where we have our best opportunities for
additional commercial business.

16 operAtions updAte
HI – 3
AK – 6
VT – 2NH – 16MA – 28
RI – 6CT – 16NJ – 40DE – 10MD – 29
WA37
ID8
MT5
WY1
NV17
UT16 CO
28
AZ32 NM
13OK29
KS11
NE5
SD3
ND3
MN13 WI
9
IA11
MO45
IL41
IN44
MI48
OH83
KY42
TN60
NC111
SC48
GA64
FL118
VA68
WV18
PA79
NY66
ME13
AL39
MS24
LA32
TX141
AR20
OR13
CA109
ALBERTA – 2
ONTARIO – 22
NUEVO LEON – 2
experiences. With a goal to increase our share
position in major appliances, we surveyed cus-
tomers and found that after-sales service was
important to them. Therefore, we now own the
repair experience, including taking the phone
call, diagnosing the problem and facilitating the
resolution. One of the most important benefits of
this program is improving customer satisfaction
by managing the experience. We tested this model
in more than 100 stores for over a year and found
that it positively affected customer satisfaction
and resulted in incremental repeat visits to make
purchases across the store. In addition, we expect
to realize cost savings through lower appliance
return rates and identification of quality concerns
that we can work with our vendors to resolve.
We will also provide a personalized approach to
project management and information sharing
through the early 2011 foundational release of
MyLowe’s, a Web portal that allows customers
to manage their home and their relationship with
Lowe’s. MyLowe’s will provide ways to more
dynamically share project information between
customers and our employees, and will allow
customers to directly access their transaction
history and extended protection plan informa-
tion. Additionally, they will be able to subscribe
to have certain maintenance products shipped
directly to their homes at selected intervals.
We have reached another point in our lifecycle
where we must adapt to maintain our growth
in the home improvement business. Our entire
organization is focused on making the promise
of a better, more seamless customer experience
a reality. We are executing this strategy today,
and we have the plans in place to better execute
in the future.
LOWE’S STORES U.S. – 1,723 CAnADA – 24 MExICO – 2
TOTAL – 1,749
as of 1/28/2011
Store Expansion Strategy
Our focus is on underpenetrated
urban markets where we can
identify favorable site costs,
reasonable municipal require-
ments and attractive return
on our investment.

LOWE’S 2010 AnnuAL REpORt 17
Lowe’s Companies, inC.2010 FinanCiaL Review
18 ManageMent’s Discussion anD analysis
of financial conDition anD Results of opeRations
27 ManageMent’s RepoRt on inteRnal contRol oveR financial RepoRting
28 RepoRts of inDepenDent RegisteReD public accounting fiRM
30 consoliDateD stateMents of eaRnings
31 consoliDateD balance sheets
32 consoliDateD stateMents of shaReholDeRs’ equity
33 consoliDateD stateMents of cash flows
34 notes to consoliDateD financial stateMents
47 selecteD financial Data
48 stock peRfoRMance
49 quaRteRly Review of peRfoRMance
50 10-yeaR financial histoRy

18 LOWE’S 2010 AnnuAL REpORt
the following discussion and analysis summarizes the significant factors affecting our consolidated operating results, financial condition, liquidity and capital resources during the three-year period ended January 28, 2011 (our fiscal years 2010, 2009 and 2008). each of the fiscal years presented contains 52 weeks of operating results. unless otherwise noted, all references herein for the years 2010, 2009 and 2008 repre-sent the fiscal years ended January 28, 2011, January 29, 2010 and January 30, 2009, respectively. we intend for this discussion to provide the reader with information that will assist in understanding our financial statements, the changes in certain key items in those financial statements from year to year, and the primary factors that accounted for those changes, as well as how certain accounting principles affect our financial statements. this discussion should be read in conjunction with the consolidated financial statements and notes to the consolidated financial statements included in this annual report that have been prepared in accordance with accounting principles generally accepted in the united states of america. this discussion and analysis is presented in seven sections:
•ExecutiveOverview•Operations•Lowe’sBusinessOutlook•FinancialCondition,LiquidityandCapitalResources•Off-BalanceSheetArrangements•ContractualObligationsandCommercialCommitments•CriticalAccountingPoliciesandEstimates
EXECUTIVE OVERVIEW
External Factors Impacting Our BusinessDuring 2010, the economy showed signs of recovery, but the home improvement industry continued to be challenged by high unemployment, declining home values, tighter consumer credit, modest growth in personal disposable income, and low housing turnover. since 2008, households in the u.s. have been borrowing less and saving more as they have struggled to cope with the effects of the worst national recession in decades. household spending increased modestly in 2010 over the prior year, but consumers continued to rationalize the scope of their housing projects, focusing on mini projects and small enhancements versus major renovations. we saw evidence of this constrained growth, as our comparable store sales increased by 1.3% versus the prior year, which was our first comparable store sales increase for the year since 2005. although quantitative measures of consumer sentiment and confidence are up from their low points during the depths of the recession, they remain below their historical means. according to our fourth quarter consumer survey, fewer homeowners feel the economy will get worse before it gets better. however, the number of homeowners who indicated they feel the recession is not over remains high,andapproximately45%ofthosehomeownerstoldusthattheydo not anticipate changing their spending plans in 2011. consumers are increasingly concerned about inflation as the prices of raw materials, oil and foreign manufacturing wages continue to increase. Despite the economic uncertainty, we are prepared to operate effectively in this slow growth environment. we are committed to growing market share 1% – 2% faster than the overall home improvement marketbyadaptingtochangesincustomerexpectationsandthroughincreasedpenetrationofourexistingcustomerbase.Byproviding
customers with alternative methods to engage with us and through enhancements in product assortments and pricing, our plan is to delivercustomersabetterexperienceandbettersolutionstomeettheir needs to drive profitable sales. although at a slower pace, we also continue to see growth opportunities through future store expansioninunder-penetratedurbanmarketsintheU.S.andinwesterncanada. in addition, we have implemented changes that set the foundation for longer-term improvements in efficiency and cost control.
Business Strategies
Driving profitable salesInourresearch,customershavesaidtheyexpectmorefromahomeimprovement company and want home improvement companies to be more relevant to their lifestyles. they desire a simplified approach to homeimprovementandexpectustoprovidethemwithproductsandservices that meet their desire for ease, intuitiveness and convenience all in one solution. by engaging customers whenever, wherever and however they wish to engage, our goal is to increase profitable sales by doing a better job of closing every transaction. this means meetingourcustomers’expectationsinourstoresthroughbettercustomer service, at the customer’s home or job site through the ProjectSpecialistExterior(PSE)orDistrictCommercialAccountspecialist (Dcas) programs, and online through a more personalized Lowes.comexperience. During2010,weexperiencedpositiveresultsfromtheadditionof the pse and Dcas programs, which are designed to better meet the needs of our customers by simplifying the process and allowing them to complete transactions where it is most convenient. initially launched in 2009, the pse program helped to increase our 2010 comparable store installed sales by over 10%. likewise, the Dcas program also helped to drive our commercial business customer comparable store sales above the company average for the year. customer service continues to be a primary focus for driving profitable sales and market share gains. in an effort to enhance the customerexperienceanddrivegreaterticketprofitabilitywearefocused on increasing customer-facing hours in our stores. late in 2010, we announced plans to implement weekend teams to the existingstorestructuretoputmoresalesemployeesonthefloorduring peak days. these weekend teams are in addition to our normal seasonal hires and are an addition to our base staffing model. Tofurtherenhancethecustomerexperience,wealsorevampedourstore employee training to focus on consultative skills, which will help them to identify the customers’ needs in order to help them find the right solutions. as our business evolves, we continue to look for opportunities to leverage emerging technologies and online trends to build stronger relationships with consumers. at the end of 2010, we introduced the mobile version of lowes.com to give customers the ability to continuetheirshoppingexperienceregardlessoftheirlocation.Duringthefirstmonthofthelaunchweexperiencedoveronemillionvisits to the site. scheduled for the first half of 2011, we will also launch our first mobile application as well as Mylowe’s, an innovative online tool that aims to simplify the home improvement process by helping customers manage their homes and home improvement projects more effectively. by providing customers with cross-channel access
ManageMent’s Discussion anD analysis of financial conDition anD Results of opeRations

LOWE’S 2010 AnnuAL REpORt 19
to new content, online communities, project planning and product subscriptions,weexpecttoincreaseourinvolvementintheirhomeimprovementexperiences,whichwillleadtoincreasedsales. to further meet our customers’ desire for a simplified and seamlessexperience,welaunchedourrepairservicesprograminthesecond half of 2010 to provide after-sale service on major appliances. Byhavinggreatercontroloverthisservice,weexpectmorepositivecustomerexperiences,whichwillhelpdriveincrementalrepeatbusinessandadditionalpurchasesacrossthestore.Wealsoexpecttorealizecost savings through lower appliance return rates and identification of quality concerns that we can work with our vendors to resolve.
Improving efficiency and controlling costsDuring 2010, we implemented additional programs in our operations, supply chain and customer support centers to increase operational efficiency and control costs. late in 2010, we modified a portion of our mid-level store management structure from a tiered structure into a single-level assistant store Manager position. on average, this change resulted in a reduction of one management position per store. although the primary purpose of this change was to make our store management structure more effective by fully empowering our assistant store Managers to drive the business, the net savings from these changes will also largely offset the cost of 2011 wage increases. to further drive operational efficiency and profitable sales, we are focused on providing the right products in the right markets at the right price. During 2010, we implemented two important changes to our pricing strategy. first, we increased our number of competitive pricing zones, from under 90 to more than 210, allowing us to price products more competitively in each market. second, we implemented base price optimization, which determines the best price, by item and competitive pricing zone, to improve price perception and profitability. Theseinitiativeshelpedtodrivemarginincreasesofapproximately25 basis points for the third and fourth fiscal quarters of 2010 as compared to the same quarters in 2009. in 2011, we will also begin implementing integrated planning andExecution(IP&E),whichwillhelpusmorespecificallydeterminewhat products and quantities to offer in each store based on market demographics, customer requirements, customer shopping prefer-encesandlocalstoreemployeeknowledge.Weexpectthisinitiativeto enable us to better align with customer demand while managing our inventory levels. Overthepastsixyears,wehavealsorefinedoursupplychain,which resulted in increased trailer utilization, an elimination of over 550 million road miles on a comparable volume basis and a high number of mode conversions from truckload to intermodal routings. these combined changes resulted in savings of over 100 million gallonsofdieselfuelandoverallsavingsofapproximately$490millionoverthesix-yearperiod. Tobetterleverageourexistingresourcesandcapabilitiesatourcustomer support centers, during 2010 we significantly reduced the use of third-party information technology (it) service technicians to makeonsiterepairsinourstoresbyleveragingexistingITsupportteams to manage the process. by shipping replacement parts to stores and repairing returned defective units in our technology service centerweexpectongoingsavingsofapproximately$14million per year.
we are focused on making the promise of a better, simpler customer experienceareality.Weknowthereareopportunitiestogrowourbusiness through deeper customer relationships. we will continue to focus on driving profitable sales, market share growth and controlling costs while recommitting to our vision to deliver customer-valued solutions that make lowe’s the first choice in home improvement.
OPERATIONSthe following tables set forth the percentage relationship to net sales of each line item of the consolidated statements of earnings, as well as the percentage change in dollar amounts from the prior year. this table should be read in conjunction with the following discussion and analysis and the consolidated financial statements, including the related notes to the consolidated financial statements.
basis point percentage increase/ increase/ (Decrease) (Decrease) in percentage in Dollar of net sales amounts from from prior year prior year
2010 vs. 2010 vs. 2010 2009 2009 2009
Net sales 100.00% 100.00% N/A 3.4%Gross margin 35.14 34.86 28 4.2 Expenses:selling, general and administrative 24.60 24.85 (25) 2.3 Depreciation 3.25 3.42 (17) (1.7)interest – net 0.68 0.61 7 15.7Total expenses 28.53 28.88 (35) 2.1Pre-tax earnings 6.61 5.98 63 14.2Incometaxprovision 2.49 2.20 29 16.9Net earnings 4.12% 3.78% 34 12.7%EBIT margin 1 7.29% 6.59% 70 14.4%
basis point percentage increase/ increase/ (Decrease) (Decrease) in percentage in Dollar of net sales amounts from from prior year prior year 2009 vs. 2009 vs. 2009 2008 2008 2008
Net sales 100.00% 100.00% N/A (2.1)%Gross margin 34.86 34.21 65 (0.2)Expenses:selling, general and administrative 24.85 23.17 168 5.0Depreciation 3.42 3.19 23 4.9interest – net 0.61 0.58 3 2.4Total expenses 28.88 26.94 194 4.9Pre-tax earnings 5.98 7.27 (129) (19.4)Incometaxprovision 2.20 2.72 (52) (20.5)Net earnings 3.78% 4.55% (77) (18.8)%EBIT margin 1 6.59% 7.85% (126) (17.8)%
20 LOWE’S 2010 AnnuAL REpORt
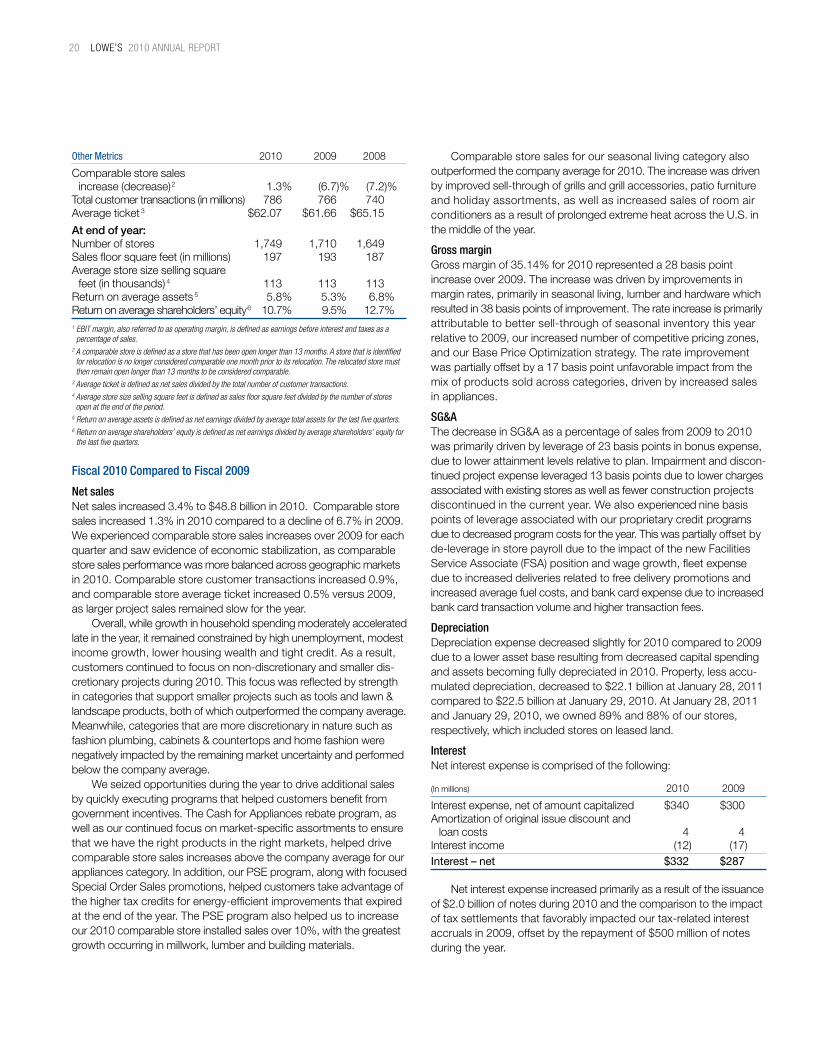
Other Metrics 2010 2009 2008
comparable store sales increase (decrease) 2 1.3% (6.7)% (7.2)%total customer transactions (in millions) 786 766 740average ticket 3 $62.07 $61.66 $65.15
At end of year:number of stores 1,749 1,710 1,649 Salesfloorsquarefeet(inmillions) 197 193 187average store size selling square feet (in thousands) 4 113 113 113 Return on average assets 5 5.8% 5.3% 6.8%Return on average shareholders’ equity 6 10.7% 9.5% 12.7%1 EBIT margin, also referred to as operating margin, is defined as earnings before interest and taxes as a
percentage of sales.2 A comparable store is defined as a store that has been open longer than 13 months. A store that is identified for relocation is no longer considered comparable one month prior to its relocation. The relocated store must then remain open longer than 13 months to be considered comparable.
3 Average ticket is defined as net sales divided by the total number of customer transactions.4 Average store size selling square feet is defined as sales floor square feet divided by the number of stores open at the end of the period.
5 Return on average assets is defined as net earnings divided by average total assets for the last five quarters.6 Return on average shareholders’ equity is defined as net earnings divided by average shareholders’ equity for
the last five quarters.
Fiscal 2010 Compared to Fiscal 2009
Net sales Netsalesincreased3.4%to$48.8billionin2010.Comparablestoresales increased 1.3% in 2010 compared to a decline of 6.7% in 2009. Weexperiencedcomparablestoresalesincreasesover2009foreachquarter and saw evidence of economic stabilization, as comparable store sales performance was more balanced across geographic markets in 2010. comparable store customer transactions increased 0.9%, and comparable store average ticket increased 0.5% versus 2009, as larger project sales remained slow for the year. overall, while growth in household spending moderately accelerated late in the year, it remained constrained by high unemployment, modest income growth, lower housing wealth and tight credit. as a result, customers continued to focus on non-discretionary and smaller dis-cretionaryprojectsduring2010.Thisfocuswasreflectedbystrengthincategoriesthatsupportsmallerprojectssuchastoolsandlawn&landscape products, both of which outperformed the company average. Meanwhile, categories that are more discretionary in nature such as fashionplumbing,cabinets&countertopsandhomefashionwerenegatively impacted by the remaining market uncertainty and performed below the company average. we seized opportunities during the year to drive additional sales byquicklyexecutingprogramsthathelpedcustomersbenefitfromgovernment incentives. the cash for appliances rebate program, as well as our continued focus on market-specific assortments to ensure that we have the right products in the right markets, helped drive comparable store sales increases above the company average for our appliances category. in addition, our pse program, along with focused special order sales promotions, helped customers take advantage of thehighertaxcreditsforenergy-efficientimprovementsthatexpiredat the end of the year. the pse program also helped us to increase our 2010 comparable store installed sales over 10%, with the greatest growth occurring in millwork, lumber and building materials.
comparable store sales for our seasonal living category also outperformed the company average for 2010. the increase was driven by improved sell-through of grills and grill accessories, patio furniture and holiday assortments, as well as increased sales of room air conditionersasaresultofprolongedextremeheatacrosstheU.S.inthe middle of the year.
Gross margingross margin of 35.14% for 2010 represented a 28 basis point increase over 2009. the increase was driven by improvements in margin rates, primarily in seasonal living, lumber and hardware which resulted in 38 basis points of improvement. the rate increase is primarily attributable to better sell-through of seasonal inventory this year relative to 2009, our increased number of competitive pricing zones, and our base price optimization strategy. the rate improvement was partially offset by a 17 basis point unfavorable impact from the mixofproductssoldacrosscategories,drivenbyincreasedsalesin appliances.
SG&A ThedecreaseinSG&Aasapercentageofsalesfrom2009to2010wasprimarilydrivenbyleverageof23basispointsinbonusexpense,due to lower attainment levels relative to plan. impairment and discon-tinuedprojectexpenseleveraged13basispointsduetolowerchargesassociatedwithexistingstoresaswellasfewerconstructionprojectsdiscontinuedinthecurrentyear.Wealsoexperiencedninebasispoints of leverage associated with our proprietary credit programs due to decreased program costs for the year. this was partially offset by de-leverage in store payroll due to the impact of the new facilities ServiceAssociate(FSA)positionandwagegrowth,fleetexpensedue to increased deliveries related to free delivery promotions and increasedaveragefuelcosts,andbankcardexpenseduetoincreasedbank card transaction volume and higher transaction fees.
DepreciationDepreciationexpensedecreasedslightlyfor2010comparedto2009due to a lower asset base resulting from decreased capital spending and assets becoming fully depreciated in 2010. property, less accu-mulateddepreciation,decreasedto$22.1billionatJanuary28,2011comparedto$22.5billionatJanuary29,2010.AtJanuary28,2011and January 29, 2010, we owned 89% and 88% of our stores, respectively, which included stores on leased land.
Interest Netinterestexpenseiscomprisedofthefollowing:
(in millions) 2010 2009
Interestexpense,netofamountcapitalized $340 $300amortization of original issue discount and loan costs 4 4interest income (12) (17)Interest – net $332 $287
Netinterestexpenseincreasedprimarilyasaresultoftheissuanceof$2.0billionofnotesduring2010andthecomparisontotheimpactoftaxsettlementsthatfavorablyimpactedourtax-relatedinterestaccrualsin2009,offsetbytherepaymentof$500millionofnotesduring the year.

LOWE’S 2010 AnnuAL REpORt 21
Income tax provisionOureffectiveincometaxratewas37.7%in2010versus36.9%in2009.Thelowereffectivetaxratein2009wasprimarilyduetocertainprioryearfavorablestatetaxsettlements,whichdecreasedtheeffectivetaxratebyapproximately70basispoints.
Fiscal 2009 Compared to Fiscal 2008
Net salesReflectiveofthecontinuedchallengingsalesenvironment,netsalesdecreased2.1%to$47.2billionin2009.Comparablestoresalesdeclined 6.7% in 2009 compared to a decline of 7.2% in 2008. total customer transactions increased 3.4% compared to 2008, driven by ourstoreexpansionprogram.However,averageticketdecreased5.4%to$61.66,primarilyasaresultoffewerprojectsales.Comparablestore customer transactions declined 1.0%, and comparable store average ticket declined 5.7% compared to 2008. customers continued to focus on routine maintenance and repairs insteadoflargerdiscretionaryprojectsduringfiscal2009.Weexperi-enced solid sales performance in paint and nursery as a result of the continued willingness of homeowners to take on smaller do-it-yourself projects to maintain their homes and improve their outdoor space. the paint category had positive comparable store sales performance for each quarter during 2009. appliances also performed better than our average comparable store sales change, driven by attractive value and customers’ willingness to invest in products that increase energy efficiency. however, certain of our other categories, including home fashion,cabinets&countertopsandmillwork,whicharemorediscre-tionaryinnature,experienceddouble-digitdeclinesincomparablestoresalesfortheyear.Wealsoexperiencedcontinuedweaknessin other categories, including rough electrical, lumber and outdoor powerequipment,whichalsoexperienceddouble-digitdeclinesincomparable store sales driven by comparisons to hurricane-related spending in 2008. Due to consumers’ continued hesitancy to take on larger discretionaryprojects,weexperiencedhigherthanaveragedeclineswithin all specialty sales categories during 2009. special order sales had a 15.8% decline in comparable store sales, due to weakness in cabinets &countertops,homefashion,lightingandmillwork.Comparablestoreinstalled sales declined 11.4% for 2009. however, both special order SalesandInstalledSalesexperiencedsequentialimprovementinthethird quarter of 2009, and positive comparable store sales in the fourth quarter of 2009, as the economic pressures lessened. sales to commercial business customers declined 9.1% in 2009, driven by continued project delays within the remodel and repair businesses. Fromageographicmarketperspective,weexperiencedcontinuedpressure from the declining housing market, with the most pronounced declines in the Mid-atlantic and florida markets for the year. Many areas were impacted by several years of housing pressure as well as the financial markets. however, we saw evidence of broad-based stabiliza-tion,asweexperiencedsequentialimprovementincomparablestoresales for all 50 states from the third to the fourth quarter, and 26 states had positive comparable results in the fourth quarter. for 2009, the northeast and north-central markets performed above the company average, and for the fourth quarter of 2009 these areas delivered positivecomparablestoresalesresults.Asaresult,weexperienceda comparable store sales decline of 1.6% for the fourth quarter, compared to a decline of 6.7% for the year.
Gross marginfor 2009, gross margin of 34.86% represented a 65 basis point increase from2008.Marginrateimprovementcontributedapproximately52 basis points of this increase, primarily driven by a moderating promotional environment and decreased seasonal markdowns. the seasonallivingcategoryexperiencedstrongmarginincreasescomparedto the prior year driven by reduced markdowns as a result of rational-izingpurchaselevelsearlierintheyear.Theflooringandlightingproductcategoriesalsoexperiencedstrongimprovementcomparedtotheprioryear driven by the more rational promotional environment and our decision to not repeat certain prior year promotions. in addition, margin was positively impacted by lower inventory shrink, which provided 12 basis points of leverage.
SG&A TheincreaseinSG&Aasapercentageofsalesfrom2008to2009wasprimarily driven by de-leverage of 61 basis points in store payroll. as sales per store declined, an increased number of stores met the base staffinghoursthreshold,whichincreasedtheproportionoffixed-to-totalpayroll.Wealsoexperiencedde-leverageofapproximately40basispointsinbonusexpenseattributabletohigherachievementagainstperformance targets in 2009. as a result of 2009 performance and continuedexpansionrationalization,weexperienced20basispointsofde-leverage associated with the write-off of new store projects that we are no longer pursuing and long-lived asset impairment charges. employee insurance costs also de-leveraged 18 basis points as a result of rising healthcareexpenses,higherenrollmentandhigheradministrativecosts.in 2009, credit programs de-leveraged 16 basis points due to increases in aged losses and bankruptcies as a result of higher unemployment andcreditmarkettightening.Additionally,weexperiencedde-leverageofapproximately16basispointsinfixedexpensessuchaspropertytaxes,utilitiesandrentduring2009asaresultofsalesdeclines.Thesechanges were offset slightly by leverage of 11 basis points related to store opening costs associated with the opening of fewer stores in 2009 than in 2008.
Depreciation Depreciation de-leveraged 23 basis points as a percentage of sales in 2009. this de-leverage was driven by the comparable store sales declines and the addition of 62 new stores in 2009. property, less accumulateddepreciation,decreasedto$22.5billionatJanuary29,2010,comparedto$22.7billionatJanuary30,2009.AtJanuary29,2010, and January 30, 2009, we owned 88% of our stores, which included stores on leased land.
InterestNetinterestexpenseiscomprisedofthefollowing:
(in millions) 2009 2008
Interestexpense,netofamountcapitalized $300 $314amortization of original issue discount and loan costs 4 6interest income (17) (40)Interest – net $287 $280
Netinterestexpenseincreasedprimarilyasaresultoflowerinterest income due to lower interest rates and lower capitalized interest associated with fewer stores under construction, partially offset by lowerinterestassociatedwithfavorabletaxsettlementsduring2009.
22 LOWE’S 2010 AnnuAL REpORt
Income tax provisionOureffectiveincometaxratewas36.9%in2009versus37.4%in2008.Thedecreaseintheeffectivetaxratewasprimarilyduetofavorablestatetaxsettlements.
LOWE’S BUSINESS OUTLOOKas of february 23, 2011, the date of our fourth quarter 2010 earnings release,weexpectedtotalsalesin2011toincreaseapproximately5%,whichincludesthe53rdweek.The53rdweekwasexpectedtoincreasetotalsalesbyapproximately1.6%.Weexpectedcomparablestoresalestoincrease1%to2%in2011.Weexpectedtoopen25to30storesduring2011,resultingintotalsquarefootagegrowthofapproximately1.5%.Earningsbeforeinterestandtaxesasapercentageofsales(operatingmargin)wasexpectedtoincreaseapproximately30basispoints.Inaddition,depreciationexpensewasexpectedtobeapproxi-mately$1.48billion.Dilutedearningspershareof$1.60to$1.72wereexpectedforthefiscalyearendingFebruary3,2012.Ourguidanceassumedapproximately$2.4billioninsharerepurchasesduring2011spread evenly across the four quarters.
FINANCIAL CONDITION, LIQUIDITY AND CAPITAL RESOURCES
Cash FlowsCashflowsfromoperatingactivitiescontinuedtoprovidetheprimarysource of our liquidity. the decrease in net cash provided by operating activities for 2010 versus 2009 was driven by changes in working capital, primarilyrelatedtoaccountspayableandincometaxpayments.Theincrease in net cash used in investing activities for 2010 versus 2009 was driven by increased purchases of investments, partially offset by adeclineinpropertyacquiredduetoareductioninourstoreexpansionprogram. the decrease in net cash used in financing activities for 2010 versus 2009 was attributable to an increase in cash from the issuances of long-term debt in 2010 and lower debt repayments, offset by share repurchases.
Sources of LiquidityInadditiontoourcashflowsfromoperations,liquidityisprovidedbyourshort-term borrowing facilities and through the issuance of long-term debt.Wehavea$1.75billionseniorcreditfacilitythatexpiresinJune2012. the senior credit facility supports our commercial paper program. Theseniorcreditfacilityhasa$500millionletterofcreditsublimit.Lettersof credit issued pursuant to the senior credit facility reduce the amount available for borrowing under the senior credit facility. borrowings made areunsecuredandarepricedatfixedratesbaseduponmarketcondi-tions at the time of funding in accordance with the terms of the senior credit facility. the senior credit facility contains certain restrictive covenants, which include maintenance of a debt leverage ratio, as defined by the senior credit facility. we were in compliance with those covenants at January 28, 2011. seventeen banking institutions are participating in the senior credit facility. there were no outstanding borrowings or letters of credit under the senior credit facility and no outstanding borrowings under the commercial paper program at January 28, 2011 or during 2010. WealsohaveaCanadiandollar(C$)denominatedcreditfacilityintheamountofC$50millionthatprovidesrevolvingcreditsupportforourcanadian operations. this uncommitted credit facility provides us with theabilitytomakeunsecuredborrowings,whicharepricedatfixedrates
based upon market conditions at the time of funding in accordance with the terms of the credit facility. as of January 28, 2011, there were no borrowings outstanding under this credit facility. Weexpecttocontinuetohaveaccesstothecapitalmarketsonbothshort- and long-term bases when needed for liquidity purposes by issuing commercial paper or new long-term debt. the availability and the borrowing costs of these funds could be adversely affected, however, by a downgrade of our debt ratings or a deterioration of certain financial ratios.ThetablebelowreflectsourdebtratingsbyStandard&Poor’s(S&P)andMoody’sasofMarch28,2011,whichwearedisclosingtoenhance understanding of our sources of liquidity and the effect of our ratingsonourcostoffunds.Althoughwecurrentlydonotexpectadowngrade in our debt ratings, our commercial paper and senior debt ratings may be subject to revision or withdrawal at any time by the assigning rating organization, and each rating should be evaluated independently of any other rating.
Debt Ratings S&P Moody’s
commercial paper a1 p1senior Debt a a1Outlook Stable Stable
we believe that net cash provided by operating and financing activitieswillbeadequateforourexpansionplansandourotheroperatingrequirementsoverthenext12months.Therearenoprovisionsinanyagreementsthatwouldrequireearlycashsettlementofexistingdebt or leases as a result of a downgrade in our debt rating or a decrease in our stock price. in addition, we do not have a significant amount of cash held in foreign affiliates.
Cash Requirements
Capital expendituresOurfiscal2011capitalbudgetisapproximately$1.8billion,inclusiveofapproximately$100millionofleasecommitments,resultinginaplannednetcashoutflowof$1.7billion.Approximately45%oftheplannednetcashoutflowisforstoreexpansion.Ourexpansionplansfor2011consistof25to30newstoresandareexpectedtoincreasesalesfloorsquarefootagebyapproximately1.5%.Allofthe2011projectsareexpectedtobeowned,whichincludesapproximately20%ofthestoresonleasedland.Inaddition,approximately30%oftheplannednetcashoutflowisforinvestmentinourexistingstores.Otherplannedcapitalexpendituresincludeinvestinginourdistribution and corporate infrastructure, including enhancements in information technology. During 2009, we entered into a joint venture agreement with australian retailer woolworths limited, to develop a chain of home improvementstoresinAustralia.Weexpecttocontributeapproximately$400millionoverfouryearstothejointventure,ofwhichweareaone-thirdowner.AsofJanuary28,2011,wehadcontributedapproximately$140million.Thejointventureexpectstoopenitsfirststoresin2011.
Debt and capitalInApril2010,weissued$1.0billionofunsecurednotesintwotranches:$500millionof4.625%notesmaturinginApril2020and$500millionof 5.8% notes maturing in april 2040. net proceeds from the 4.625% and5.8%notes,excludingissuancecosts,were$497millionand$495million,respectively.Duringthesecondquarterof2010,we
LOWE’S 2010 AnnuAL REpORt 23
used a portion of the net proceeds from these notes to repay our $500million8.25%notesdueJune1,2010.InNovember2010,weissued$1.0billionofunsecurednotes,intwotranches:$475millionof2.125%notesmaturinginApril2016and$525millionof3.75%notes maturing in april 2021. net proceeds from the 2.125% and 3.75% notes,excludingissuancecosts,were$473millionand$522million,respectively. interest on the 2010 notes is payable semiannually in arrears in april and october of each year until maturity. net proceeds were available for general corporate purposes, including capital expendituresandworkingcapitalneeds,andtofundrepurchasesof our common stock. Dividendsdeclaredduringfiscal2010totaled$588million.Inthefourth quarter of 2009 the dividend payment dates were shifted such that dividends are paid in the subsequent quarter to their declaration.Dividends declared in the fourth quarter of 2010 were paid in fiscal 2011 andtotaled$148million. Wehaveasharerepurchaseprogramthatisexecutedthroughpurchases made from time to time in the open market or through private transactions. shares purchased under the share repurchase program are retired and returned to authorized and unissued status. as of January 28, 2011, we had a remaining repurchase authorization of $2.4billionwithnoexpirationdate.Weexpecttoutilizetheremainingauthorization by the end of fiscal 2011. the ratio of debt to equity plus debt was 26.6% and 21.0% as of January 28, 2011, and January 29, 2010, respectively.
OFF-BALANCE SHEET ARRANGEMENTSOtherthaninconnectionwithexecutingoperatingleases,wedonothaveany off-balance sheet financing that has, or is reasonably likely to have, amaterial,currentorfutureeffectonourfinancialcondition,cashflows,resultsofoperations,liquidity,capitalexpendituresorcapitalresources.
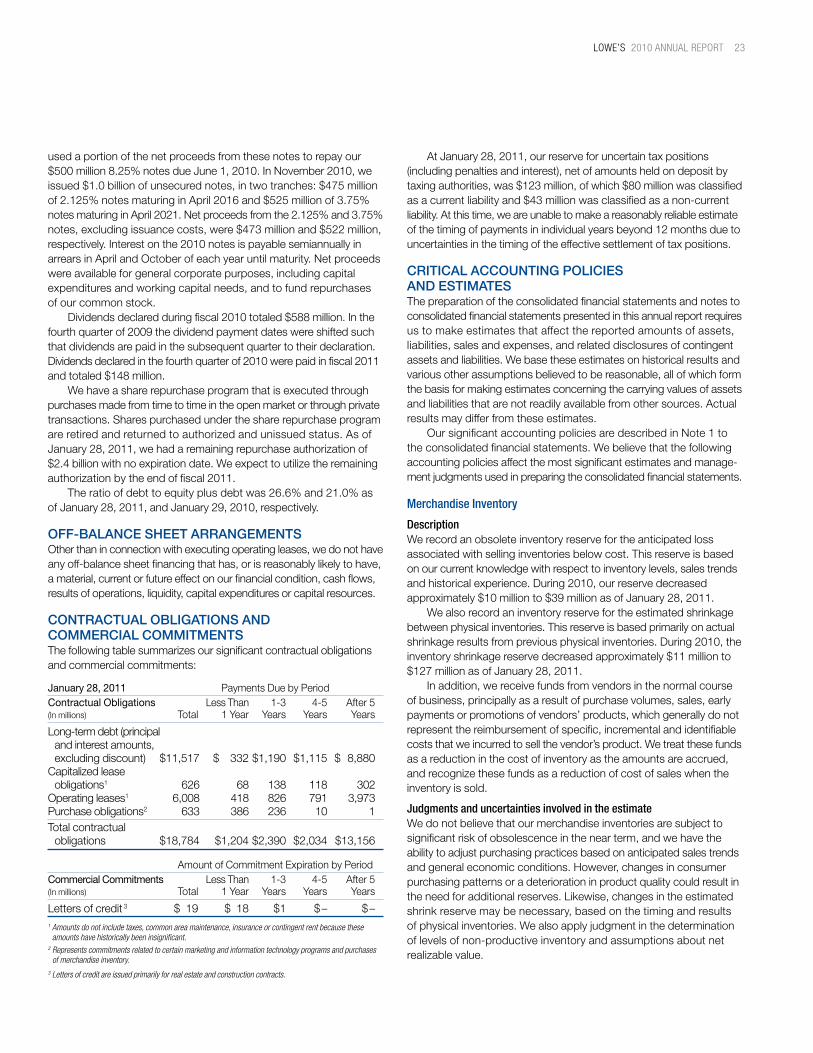
CONTRACTUAL OBLIGATIONS AND COMMERCIAL COMMITMENTSthe following table summarizes our significant contractual obligations and commercial commitments:
January 28, 2011 payments Due by periodContractual Obligations less than 1-3 4-5 after 5 (in millions) total 1 year years years years
long-term debt (principal and interest amounts, excludingdiscount) $11,517 $ 332$1,190 $1,115 $ 8,880capitalized lease obligations1 626 68 138 118 302operating leases1 6,008 418 826 791 3,973purchase obligations2 633 386 236 10 1total contractual obligations $18,784 $1,204$2,390 $2,034 $13,156
AmountofCommitmentExpirationbyPeriodCommercial Commitments less than 1-3 4-5 after 5 (in millions) total 1 year years years years
letters of credit 3 $ 19 $ 18 $1 $– $–1 Amounts do not include taxes, common area maintenance, insurance or contingent rent because these
amounts have historically been insignificant.2 Represents commitments related to certain marketing and information technology programs and purchases
of merchandise inventory.3 Letters of credit are issued primarily for real estate and construction contracts.
AtJanuary28,2011,ourreserveforuncertaintaxpositions(including penalties and interest), net of amounts held on deposit by taxingauthorities,was$123million,ofwhich$80millionwasclassifiedasacurrentliabilityand$43millionwasclassifiedasanon-currentliability. at this time, we are unable to make a reasonably reliable estimate of the timing of payments in individual years beyond 12 months due to uncertaintiesinthetimingoftheeffectivesettlementoftaxpositions.
CRITICAL ACCOUNTING POLICIES AND ESTIMATESthe preparation of the consolidated financial statements and notes to consolidated financial statements presented in this annual report requires us to make estimates that affect the reported amounts of assets, liabilities,salesandexpenses,andrelateddisclosuresofcontingentassets and liabilities. we base these estimates on historical results and various other assumptions believed to be reasonable, all of which form the basis for making estimates concerning the carrying values of assets and liabilities that are not readily available from other sources. actual results may differ from these estimates. our significant accounting policies are described in note 1 to the consolidated financial statements. we believe that the following accounting policies affect the most significant estimates and manage-ment judgments used in preparing the consolidated financial statements.
Merchandise Inventory
Descriptionwe record an obsolete inventory reserve for the anticipated loss associated with selling inventories below cost. this reserve is based on our current knowledge with respect to inventory levels, sales trends andhistoricalexperience.During2010,ourreservedecreasedapproximately$10millionto$39millionasofJanuary28,2011. we also record an inventory reserve for the estimated shrinkage between physical inventories. this reserve is based primarily on actual shrinkage results from previous physical inventories. During 2010, the inventoryshrinkagereservedecreasedapproximately$11millionto$127millionasofJanuary28,2011. in addition, we receive funds from vendors in the normal course of business, principally as a result of purchase volumes, sales, early payments or promotions of vendors’ products, which generally do not represent the reimbursement of specific, incremental and identifiable costs that we incurred to sell the vendor’s product. we treat these funds as a reduction in the cost of inventory as the amounts are accrued, and recognize these funds as a reduction of cost of sales when the inventory is sold.
Judgments and uncertainties involved in the estimatewe do not believe that our merchandise inventories are subject to significant risk of obsolescence in the near term, and we have the ability to adjust purchasing practices based on anticipated sales trends and general economic conditions. however, changes in consumer purchasing patterns or a deterioration in product quality could result in the need for additional reserves. likewise, changes in the estimated shrink reserve may be necessary, based on the timing and results of physical inventories. we also apply judgment in the determination of levels of non-productive inventory and assumptions about net realizable value.
24 LOWE’S 2010 AnnuAL REpORt
for vendor funds, we develop accrual rates based on the provisions oftheagreementsinplace.Duetothecomplexityanddiversityoftheindividual vendor agreements, we perform analyses and review historical purchase trends and volumes throughout the year, adjust accrual rates as appropriate and confirm actual amounts with select vendors to ensure the amounts earned are appropriately recorded. amounts accrued throughout the year could be impacted if actual purchase volumes differ from projected purchase volumes, especially in the case of programs that provide for increased funding when graduated purchase volumes are met.
Effect if actual results differ from assumptionswe have not made any material changes in the methodology used to establish our inventory valuation or the related reserves for obsolete inventory or inventory shrinkage during the past three fiscal years. we believe that we have sufficient current and historical knowledge to record reasonable estimates for both of these inventory reserves. however, it is possible that actual results could differ from recorded reserves. a 10% change in the amount of products considered obso-lete and therefore included in the calculation of our obsolete inventory reservewouldhaveaffectednetearningsbyapproximately$2millionfor 2010. a 10% change in the estimated shrinkage rate included in the calculation of our inventory shrinkage reserve would have affected netearningsbyapproximately$8millionfor2010. we have not made any material changes in the methodology used to recognize vendor funds during the past three fiscal years. if actual results are not consistent with the assumptions and estimates used, wecouldbeexposedtoadditionaladjustmentsthatcouldpositivelyornegatively impact gross margin and inventory. however, substantially all receivables associated with these activities do not require subjective long-term estimates because they are collected within the following fiscal year. adjustments to gross margin and inventory in the following fiscal year have historically not been material.
Long-Lived Asset Impairment – Operating Stores
DescriptionAtJanuary28,2011,$19.0billionofourlong-livedassetswereassociated with stores currently in operation. we review the carrying amounts of operating stores whenever certain events or changes in circumstances indicate that the carrying amounts may not be recoverable. when evaluating operating stores for impairment, our asset group is at an individual store level, as that is the lowest level for whichcashflowsareidentifiable.Cashflowsforindividualoperatingstores do not include an allocation of corporate overhead. we evaluate operating stores for triggering events relating to long-lived asset impairment on a quarterly basis to determine when store assets may not be recoverable. our primary indicator that operating storeassetsmaynotberecoverableisconsistentlynegativecashflowfor a 12-month period for those stores that have been open in the same location for a sufficient period of time to allow for meaningful analysis of ongoing operating results. Management also monitors other factors when evaluating operating stores for impairment, including individual stores’executionoftheiroperatingplansandlocalmarketconditions,including incursion, which is the opening of either other lowe’s stores or direct competitors’ stores within the same market. for operating stores, a potential impairment has occurred if projectedfutureundiscountedcashflowsexpectedtoresultfromthe use and eventual disposition of the store assets are less than
the carrying amount of the assets. when determining the stream ofprojectedfuturecashflowsassociatedwithanindividualoperatingstore, management makes assumptions, incorporating local market conditions, about key store variables including sales growth rates, grossmarginandcontrollableexpenses,suchasstorepayrollandoccupancyexpense. an impairment loss is recognized when the carrying amount oftheoperatingstoreisnotrecoverableandexceedsitsfairvalue.we generally use an income approach to determine the fair value of our individual operating stores, which requires discounting projected futurecashflows.Thisinvolvesmakingassumptionsregardingbothastore’sfuturecashflows,asdescribedabove,andanappropriatediscount rate to determine the present value of those future cash flows.Wediscountourcashflowestimatesataratecommensuratewith the risk that selected market participants would assign to the cashflows.Theselectedmarketparticipantsrepresentagroupofother retailers with a store footprint similar in size to ours. During2010,15storesexperiencedatriggeringeventandwereevaluated for recoverability. four of these stores were determined to be impaired. we recorded operating store impairment losses of $36millionduring2010comparedto$53millionduring2009.
Judgments and uncertainties involved in the estimateour impairment loss calculations require us to apply judgment in estimatingexpectedfuturecashflows,includingestimatedsales,marginandcontrollableexpenses,andassumptionsaboutmarketperformance. we also apply judgment in estimating asset fair values, including the selection of an appropriate discount rate.
Effect if actual results differ from assumptionswe have not made any material changes in the methodology used toestimatethefuturecashflowsofoperatingstoresduringthepastthree fiscal years. if the actual results of our operating stores are not consistent with the assumptions and judgments we have made in estimatingfuturecashflowsanddeterminingassetfairvalues,ouractual impairment losses could vary positively or negatively from our estimated impairment losses. Elevenofthestoresthatexperiencedatriggeringeventduring2010were determined to be recoverable and therefore were not impaired. for tenofthesestorestheexpectedundiscountedcashflowssubstantiallyexceededthenetbookvalueofthestoreassets.Forthesetenstores,a10%reductioninprojectedsalesusedtoestimatefuturecashflowsatthe latest date that the operating stores were evaluated for impairment would have resulted in the impairment of certain of these stores and increasedrecognizedimpairmentlossesby$39million. Oneofthestoreswithanetbookvalueof$21millionhadexpectedundiscountedcashflowsthatexceededthenetbookvalueofitsassetsby less than a substantial amount. a 10% reduction in projected sales usedtoestimatefuturecashflowsatthedatethisstorewasevaluatedfor impairment would have increased recognized impairment losses by$15million. we analyzed other assumptions made in estimating the future cashflowsoftheoperatingstoresevaluatedforimpairment,butthesensitivity of those assumptions was not significant to the estimates.
Self-InsuranceDescriptionwe are self-insured for certain losses relating to workers’ compensation; automobile;property;generalandproductliability;extendedprotection

LOWE’S 2010 AnnuAL REpORt 25
plan; and certain medical and dental claims. self-insurance claims filed and claims incurred but not reported are accrued based upon our estimates of the discounted ultimate cost for self-insured claims incurred using actuarial assumptions followed in the insurance industry and historical experience.During2010,ourself-insuranceliabilityincreasedapproxi-mately$43millionto$835millionasofJanuary28,2011.
Judgments and uncertainties involved in the estimate these estimates are subject to changes in the regulatory environment; utilizeddiscountrate;projectedexposuresincludingpayroll,salesandvehicle units; as well as the frequency, lag and severity of claims.
Effect if actual results differ from assumptionswe have not made any material changes in the methodology used to establish our self-insurance liability during the past three fiscal years. although we believe that we have the ability to reasonably estimate losses related to claims, it is possible that actual results could differ from recorded self-insurance liabilities. a 10% change in our self-insuranceliabilitywouldhaveaffectednetearningsbyapproximately$52millionfor2010.A100basispointchangeinourdiscountratewouldhaveaffectednetearningsbyapproximately$17millionfor2010.
Revenue Recognition
Descriptionsee note 1 to the consolidated financial statements for a discussion of our revenue recognition policies. the following accounting estimates relating to revenue recognition require management to make assumptions and apply judgment regarding the effects of future events that cannot be determined with certainty. Wesellseparately-pricedextendedprotectionplancontractsundera lowe’s-branded program for which the company is ultimately self-insured.TheCompanyrecognizesrevenuesfromextendedprotectionplan sales on a straight-line basis over the respective contract term. Extendedprotectionplancontracttermsprimarilyrangefromonetofour years from the date of purchase or the end of the manufacturer’s warranty, as applicable. the company consistently groups and evaluates extendedprotectionplancontractsbasedonthecharacteristicsoftheunderlying products and the coverage provided in order to monitor for expectedlosses.Alossontheoverallcontractwouldberecognizediftheexpectedcostsofperformingservicesunderthecontractsexceededtheamountofunamortizedacquisitioncostsandrelateddeferred revenue associated with the contracts. Deferred revenues associatedwiththeextendedprotectionplancontractsincreased$82millionto$631millionasofJanuary28,2011. we defer revenue and cost of sales associated with transactions for which customers have not yet taken possession of merchandise or for which installation has not yet been completed. Revenue is deferred based on the actual amounts received. we use historical gross margin rates to estimate the adjustment to cost of sales for these transactions. During 2010, deferred revenues associated with these transactions increased$17millionto$371millionasofJanuary28,2011.
Judgments and uncertainties involved in the estimate Forextendedprotectionplans,thereisjudgmentinherentinourevaluationofexpectedlossesasaresultofourmethodologyforgroupingandevaluatingextendedprotectionplancontractsandfromtheactuarialdetermination of the estimated cost of the contracts. there is also judgment inherent in our determination of the recognition pattern of costs of performing services under these contracts.
for the deferral of revenue and cost of sales associated with transactions for which customers have not yet taken possession of merchandise or for which installation has not yet been completed, there is judgment inherent in our estimates of gross margin rates.
Effect if actual results differ from assumptionswe have not made any material changes in the methodology used to recognizerevenueonourextendedprotectionplancontractsduringthe past three fiscal years. we currently do not anticipate incurring anyoverallcontractlossesonourextendedprotectionplancontracts.although we believe that we have the ability to adequately monitor andestimateexpectedlossesundertheextendedprotectionplancontracts, it is possible that actual results could differ from our estimates. in addition, if future evidence indicates that the costs of performing services under these contracts are incurred on other than a straight-line basis, the timing of revenue recognition under these contracts could change. a 10% change in the amount of revenue recognized in 2010 under these contracts would have affected net earnings by approximately$11million. we have not made any material changes in the methodology used to reverse net sales and cost of sales related to amounts received for which customers have not yet taken possession of merchandise or for which installation has not yet been completed. we believe we have sufficient current and historical knowledge to record reasonable estimates related to the impact to cost of sales for these transactions. however, if actual results are not consistent with our estimates or assumptions, we may incur additional income orexpense.A10%changeintheestimateofthegrossmarginratesapplied to these transactions would have affected net earnings by approximately$6millionin2010.
QUANTITATIVE AND QUALITATIVE DISCLOSURES ABOUT MARKET RISKInadditiontotherisksinherentinouroperations,weareexposedtocertain market risks, including changes in interest rates, commodity pricesandforeigncurrencyexchangerates.
Interest Rate Riskfluctuations in interest rates do not have a material impact on our financial condition and results of operations because our long-term debtiscarriedatamortizedcostandprimarilyconsistsoffixed-rateinstruments. therefore, providing quantitative information about interest rate risk is not meaningful for financial instruments.
Commodity Price Riskwe purchase certain commodity products that are subject to price volatility caused by factors beyond our control. we believe that the price volatility of these products is mitigated by our selling prices and throughfixed-pricesupplyagreementswithvendors.Thesellingpricesofthesecommodityproductsareinfluenced,inpart,bythemarketprice we pay, which is determined by industry supply and demand.
Foreign Currency Exchange Rate RiskAlthoughwehaveinternationaloperatingentities,ourexposuretoforeigncurrencyexchangeratefluctuationsisnotmaterialtoourfinancial condition and results of operations.

26 LOWE’S 2010 AnnuAL REpORt
we speak throughout this annual Report to lowe’s shareholders in forward-looking statements about our future, particularly in the “letter to shareholders” and “Management’s Discussion and analysis of financial ConditionandResultsofOperations.”Thewords“believe,”“expect,”“will,”“should,”andothersimilarexpressionsareintendedtoidentifythoseforward-lookingstatements.Whilewebelieveourexpectationsare reasonable, they are not guarantees of future performance. our actualresultscoulddiffersubstantiallyfromourexpectationsbecause,forexample:
•Oursalesaredependentuponthehealthandstabilityofthegeneral economy, which is still recovering slowly from a prolonged period of recession that was made worse by a severe accompany-ing financial/credit crisis. sustained high rates of unemployment, the psychological effect of falling home prices, consumer deleveraging and reduced access to credit, through mortgage financing and otherwise, and reduced consumer confidence are continuing to constrain consumer spending, particularly on many of the discre-tionary, bigger-ticket products we sell.
•Salesinmanyofourproductcategoriesaredrivenbytheactivitylevel of home improvement projects. adverse changes in economic factors specific to the home improvement industry may negatively affect the rate of growth of our total sales and comparable store sales.
•Oursales,particularlyofseasonalmerchandise,maybeimpactedby unseasonable weather.
•Changesinexistingornewlawsandregulationsthataffectemployment/labor, trade, product safety, transportation/ logistics,energycosts,healthcare,taxorenvironmentalissuescould have an adverse impact, directly or indirectly, on our financial condition and results of operations.
•Ourbusinessishighlycompetitive,andourmanycompetitorscould take sales and market share from us if we fail to effectively executeourmerchandising,marketinganddistributionstrategies.
•Thesuccessofourstrategicbusinessinitiativesdesignedtoincrease our sales and capture a greater percentage of our customers’expendituresonhomeimprovementprojectsisdependent in varying degrees on the timely delivery and func-tionality of information technology systems to support them.
•Wemaynotbeabletorealizethefullbenefitsofsomeofourstrategic business initiatives if our employees or third-party installers and repair technicians are unable to accept and embrace changes in our business model.
•Thefailuretoeffectivelymanageourrelationshipswithsuppliersof brand name products that are popular with our customers could negatively impact our business plan and financial results.
•Expandinginternationallypresentsuniquechallengesthatwillrequire us to continue to adapt our store operations, merchan-dising and distribution functions and to work effectively with our joint venture partner in australia.
•Thefailuretoproperlymaintainourcriticalinformationsystemsora serious disruption of those systems could negatively impact our financial performance. performance issues with new customer-facing technology systems could negatively affect our strategic business initiatives that are dependent on those systems.
•Oursalesareimpactedbyourabilitytosecureandretainahighlyqualifiedandadaptableworkforcewithexpandedskillsetswhocan work effectively and collaboratively in an increasingly culturally diverse environment which is an important element of our future growth strategy.
•Thefailureofakeyvendororserviceproviderthatwecannotquickly replace could disrupt our operations and negatively impact our business.
•Theabilitytocontinueoureveryday,lowpricingstrategyandprovide the products that customers want depends on our vendors providing a reliable supply of products at competitive prices and our ability to effectively manage our inventory. if the domestic or interna-tional supply chain for our products is disrupted, our sales and gross margin would be adversely impacted.
•Productandservicequalityissuescouldnegativelyaffectcustomerconfidence in lowe’s and the company’s brand image and, in some instances, also result in product recalls and potential product liability and product warranty claims.
for more information about these and other risks and uncertainties thatweareexposedto,youshouldreadthe“RiskFactors”includedinour annual Report on form 10-k to the united states securities and ExchangeCommission.Allforward-lookingstatementsinthisAnnualReport to lowe’s shareholders speak only as of the date of this report or, in the case of any document incorporated by reference, the date of that document. all subsequent written and oral forward-looking statements attributable to us or any person acting on our behalf are qualified by the cautionary statements in this section and in the “Risk factors” included in our annual Report on form 10-k. we do not undertake any obligation to update or publicly release any revisions to forward-looking statements toreflectevents,circumstancesorchangesinexpectationsafterthedate of this report.
DisclosuRe RegaRDing foRwaRD-looking stateMents
LOWE’S 2010 AnnuAL REpORt 27
Management of lowe’s companies, inc. and its subsidiaries is responsible for establishing and maintaining adequate internal control over financial reporting (internal control) as defined in Rule13a-15(f)undertheSecuritiesExchangeActof1934,asamended. our internal control was designed to provide reasonable assurance to our management and the board of Directors regarding the reliability of financial reporting and the preparation and fair presentation of published financial statements. all internal control systems, no matter how well designed, have inherent limitations, including the possibility of human error and the circumvention or overriding of controls. therefore, even those systems determined to be effective can provide only reasonable assurance with respect to the reliability of financial reporting and financial statement preparation and presentation. further, because of changes in conditions, the effectiveness may vary over time.
Ourmanagement,withtheparticipationoftheChiefExecutiveofficer and chief financial officer, evaluated the effectiveness of our internal control as of January 28, 2011. in evaluating our internal control, we used the criteria set forth by the committee of sponsoring organizations of the treadway commission (coso) in Internal Control – Integrated Framework. based on our manage-ment’s assessment, we have concluded that, as of January 28, 2011, our internal control is effective. Deloitte&ToucheLLP,theindependentregisteredpublicaccounting firm that audited the financial statements contained in this report, was engaged to audit our internal control. their report appears on page 29.
ManageMent’s RepoRt on inteRnal contRol oveR financial RepoRting

28 LOWE’S 2010 AnnuAL REpORt
RepoRt of inDepenDent RegisteReD public accounting fiRM
To the Board of Directors and Shareholders of Lowe’s Companies, Inc. Mooresville, North Carolina
we have audited the accompanying consolidated balance sheets of lowe’s companies, inc. and subsidiaries (the “company”) as of January 28, 2011 and January 29, 2010, and the related consolidated statementsofearnings,shareholders’equity,andcashflowsforeachof the three fiscal years in the period ended January 28, 2011. these financial statements are the responsibility of the company’s manage-ment.Ourresponsibilityistoexpressanopiniononthesefinancialstatements based on our audits. we conducted our audits in accordance with the standards of the public company accounting oversight board (united states). those standards require that we plan and perform the audit to obtain reasonable assurance about whether the financial statements are freeofmaterialmisstatement.Anauditincludesexamining,onatestbasis, evidence supporting the amounts and disclosures in the finan-cial statements. an audit also includes assessing the accounting principles used and significant estimates made by management, as well as evaluating the overall financial statement presentation. we believe that our audits provide a reasonable basis for our opinion.
in our opinion, such consolidated financial statements present fairly, in all material respects, the financial position of the company at Janu-ary 28, 2011 and January 29, 2010, and the results of its operations anditscashflowsforeachofthethreefiscalyearsintheperiodendedJanuary 28, 2011, in conformity with accounting principles generally accepted in the united states of america. we have also audited, in accordance with the standards of the public company accounting oversight board (united states), the company’s internal control over financial reporting as of January 28, 2011, based on the criteria established in Internal Control – Integrated Framework issued by the committee of sponsoring organizations of the treadway commission and our report dated March 28, 2011 expressedanunqualifiedopinionontheCompany’sinternalcontrolover financial reporting.
charlotte, north carolina March 28, 2011

LOWE’S 2010 AnnuAL REpORt 29
RepoRt of inDepenDent RegisteReD public accounting fiRM
To the Board of Directors and Shareholders of Lowe’s Companies, Inc. Mooresville, North Carolina
we have audited the internal control over financial reporting of lowe’s companies, inc. and subsidiaries (the “company”) as of January 28, 2011, based on criteria established in Internal Control – Integrated Framework issued by the committee of sponsoring organizations of the treadway commission. the company’s management is responsible for maintaining effective internal control over financial reporting and for its assessment of the effectiveness of internal control over financial reporting, included in the accompanying Management’s Report on internal control over financial Reporting. OurresponsibilityistoexpressanopinionontheCompany’sinternalcontrol over financial reporting based on our audit. we conducted our audit in accordance with the standards of the public company accounting oversight board (united states). those standards require that we plan and perform the audit to obtain reasonable assurance about whether effective internal control over financial reporting was maintained in all material respects. our audit included obtaining an understanding of internal control over financial reporting,assessingtheriskthatamaterialweaknessexists,testingand evaluating the design and operating effectiveness of internal control based on the assessed risk, and performing such other procedures as we considered necessary in the circumstances. we believe that our audit provides a reasonable basis for our opinion. a company’s internal control over financial reporting is a process designed by, or under the supervision of, the company’s principal executiveandprincipalfinancialofficers,orpersonsperformingsimilar functions, and effected by the company’s board of directors, management, and other personnel to provide reasonable assurance regarding the reliability of financial reporting and the preparation of financialstatementsforexternalpurposesinaccordancewithgenerally accepted accounting principles. a company’s internal control over financial reporting includes those policies and procedures that (1) pertain to the maintenance of records that, in reasonable detail,accuratelyandfairlyreflectthetransactionsanddispositions
of the assets of the company; (2) provide reasonable assurance that transactions are recorded as necessary to permit preparation of financial statements in accordance with generally accepted accounting principles,andthatreceiptsandexpendituresofthecompanyarebeing made only in accordance with authorizations of management and directors of the company; and (3) provide reasonable assurance regarding prevention or timely detection of unauthorized acquisition, use, or disposition of the company’s assets that could have a material effect on the financial statements. because of the inherent limitations of internal control over financial reporting, including the possibility of collusion or improper management override of controls, material misstatements due to error or fraud may not be prevented or detected on a timely basis. also, projections of any evaluation of the effectiveness of the internal control over financial reporting to future periods are subject to the risk that the controls may become inadequate because of changes in conditions, or that the degree of compliance with the policies or procedures may deteriorate. in our opinion, the company maintained, in all material respects, effective internal control over financial reporting as of January 28, 2011, based on the criteria established in Internal Control – Integrated Framework issued by the committee of sponsoring organizations of the treadway commission. we have also audited, in accordance with the standards of the public company accounting oversight board (united states), the consolidated financial statements as of and for the fiscal year ended January 28, 2011 of the company and our report dated March 28, 2011expressedanunqualifiedopiniononthosefinancialstatements.
charlotte, north carolina March 28, 2011

30 LOWE’S 2010 AnnuAL REpORt
lowe’s coMpanies, inc.consoliDateD stateMents of eaRnings
(Inmillions,exceptpershareandpercentagedata) January 28, % January 29, % January 30, %fiscal years ended on 2011 sales 2010 sales 2009 sales
Net sales $ 48,815 100.00% $ 47,220 100.00% $ 48,230 100.00%
cost of sales 31,663 64.86 30,757 65.14 31,729 65.79
Gross margin 17,152 35.14 16,463 34.86 16,501 34.21
Expenses:
selling, general and administrative 12,006 24.60 11,737 24.85 11,176 23.17
Depreciation 1,586 3.25 1,614 3.42 1,539 3.19
interest – net 332 0.68 287 0.61 280 0.58
Total expenses 13,924 28.53 13,638 28.88 12,995 26.94
Pre-tax earnings 3,228 6.61 2,825 5.98 3,506 7.27
Incometaxprovision 1,218 2.49 1,042 2.20 1,311 2.72
Net earnings $ 2,010 4.12% $ 1,783 3.78% $ 2,195 4.55%
Basic earnings per common share $ 1.42 $ 1.21 $ 1.50
Diluted earnings per common share $ 1.42 $ 1.21 $ 1.49Cash dividends per share $ 0.420 $ 0.355 $ 0.335See accompanying notes to consolidated financial statements.
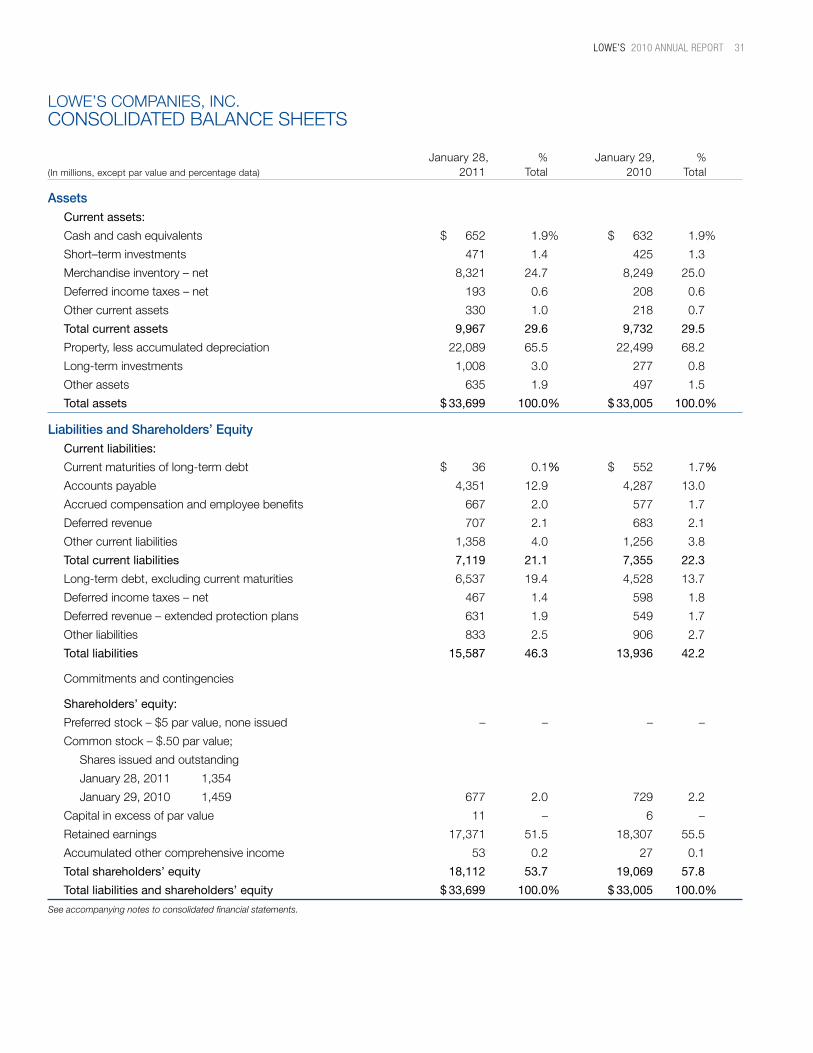
LOWE’S 2010 AnnuAL REpORt 31
lowe’s coMpanies, inc.consoliDateD balance sheets
January 28, % January 29, %(Inmillions,exceptparvalueandpercentagedata) 2011 total 2010 total
Assets Current assets:
Cashandcashequivalents $ 652 1.9% $ 632 1.9%
short–term investments 471 1.4 425 1.3
Merchandise inventory – net 8,321 24.7 8,249 25.0
Deferredincometaxes–net 193 0.6 208 0.6
other current assets 330 1.0 218 0.7
Total current assets 9,967 29.6 9,732 29.5
property, less accumulated depreciation 22,089 65.5 22,499 68.2
long-term investments 1,008 3.0 277 0.8
other assets 635 1.9 497 1.5
Total assets $ 33,699 100.0% $ 33,005 100.0%
Liabilities and Shareholders’ Equity Current liabilities:
Currentmaturitiesoflong-termdebt $ 36 0.1% $ 552 1.7%
accounts payable 4,351 12.9 4,287 13.0
accrued compensation and employee benefits 667 2.0 577 1.7
Deferred revenue 707 2.1 683 2.1
other current liabilities 1,358 4.0 1,256 3.8
Total current liabilities 7,119 21.1 7,355 22.3
Long-termdebt,excludingcurrentmaturities 6,537 19.4 4,528 13.7
Deferredincometaxes–net 467 1.4 598 1.8
Deferredrevenue–extendedprotectionplans 631 1.9 549 1.7
other liabilities 833 2.5 906 2.7
Total liabilities 15,587 46.3 13,936 42.2
commitments and contingencies
Shareholders’ equity:
Preferredstock–$5parvalue,noneissued – – – –
Commonstock–$.50parvalue;
shares issued and outstanding
January 28, 2011 1,354
January 29, 2010 1,459 677 2.0 729 2.2
Capitalinexcessofparvalue 11 – 6 –
Retained earnings 17,371 51.5 18,307 55.5
accumulated other comprehensive income 53 0.2 27 0.1
Total shareholders’ equity 18,112 53.7 19,069 57.8
Total liabilities and shareholders’ equity $ 33,699 100.0% $ 33,005 100.0%
See accompanying notes to consolidated financial statements.

32 LOWE’S 2010 AnnuAL REpORt
lowe’s coMpanies, inc.consoliDateD stateMents of shaReholDeRs’ equity
Accumulated Capital in Other total Common Stock Excess of Retained Comprehensive Shareholders’(in millions) Shares Amount par Value Earnings Income (Loss) Equity
Balance February 1, 2008 1,458 $ 729 $ 16 $ 15,345 $ 8 $ 16,098
comprehensive income: net earnings 2,195 foreign currency translation (13) net unrealized investment losses (1)total comprehensive income 2,181Taxeffectofnon-qualifiedstockoptionsexercised and restricted stock vested 5 5cash dividends declared (491) (491)Share-basedpaymentexpense 95 95Repurchase of common stock – – (8) (8)conversion of debt to common stock – – 1 1issuance of common stock under share-based payment plans 12 6 168 174
Balance January 30, 2009 1,470 $ 735 $ 277 $ 17,049 $ (6) $ 18,055
comprehensive income: net earnings 1,783 foreign currency translation 32 net unrealized investment gains 1 total comprehensive income 1,816Taxeffectofnon-qualifiedstockoptionsexercised and restricted stock vested (6) (6)cash dividends declared (522) (522)Share-basedpaymentexpense 102 102Repurchase of common stock (22) (11) (490) (3) (504)issuance of common stock under share-based payment plans 11 5 123 128
Balance January 29, 2010 1,459 $ 729 $ 6 $ 18,307 $ 27 $ 19,069
comprehensive income: net earnings 2,010 foreign currency translation 28 net unrealized investment losses (2)total comprehensive income 2,036Taxeffectofnon-qualifiedstockoptionsexercised and restricted stock vested (6) (6)cash dividends declared (588) (588)Share-basedpaymentexpense 115 115Repurchase of common stock (113) (56) (204) (2,358) (2,618)issuance of common stock under share-based payment plans 8 4 100 104
Balance January 28, 2011 1,354 $ 677 $ 11 $ 17,371 $ 53 $ 18,112See accompanying notes to consolidated financial statements.
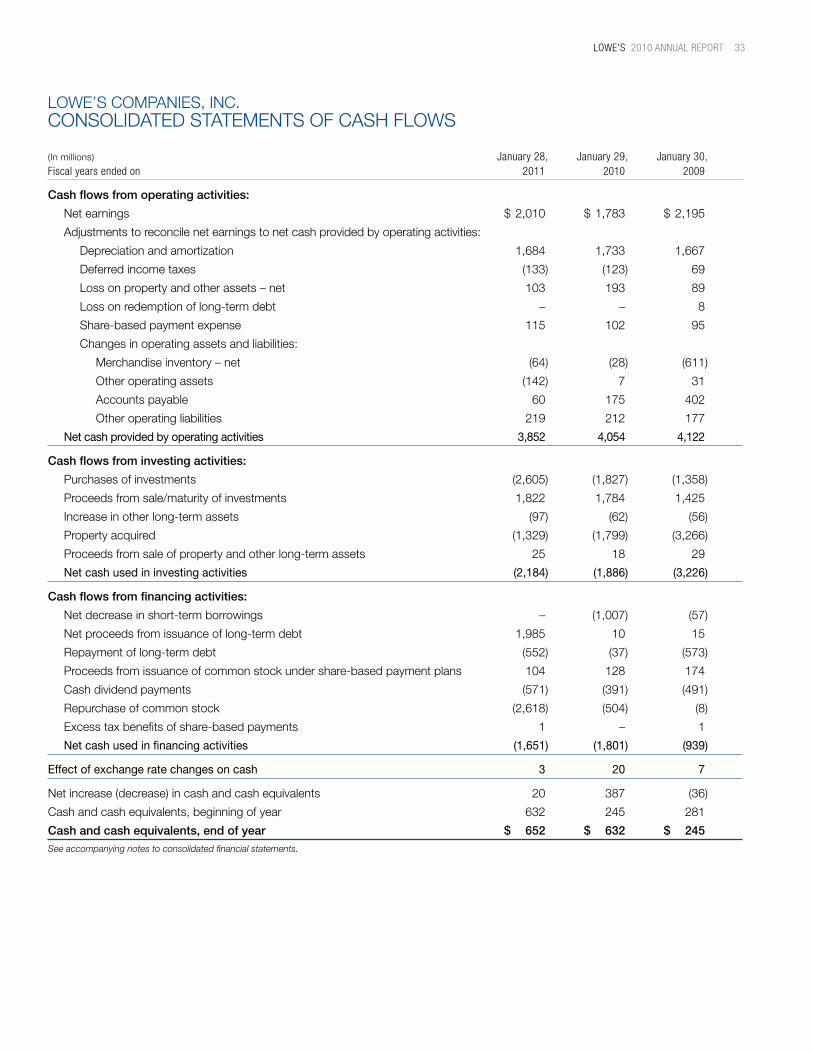
LOWE’S 2010 AnnuAL REpORt 33
lowe’s coMpanies, inc.consoliDateD stateMents of cash flows
(in millions) January 28, January 29, January 30,Fiscal years ended on 2011 2010 2009
Cash flows from operating activities:
Netearnings $2,010 $1,783 $2,195
adjustments to reconcile net earnings to net cash provided by operating activities:
Depreciation and amortization 1,684 1,733 1,667
Deferredincometaxes (133) (123) 69
loss on property and other assets – net 103 193 89
loss on redemption of long-term debt – – 8
Share-basedpaymentexpense 115 102 95
changes in operating assets and liabilities:
Merchandise inventory – net (64) (28) (611)
other operating assets (142) 7 31
accounts payable 60 175 402
other operating liabilities 219 212 177
Net cash provided by operating activities 3,852 4,054 4,122
Cash flows from investing activities:
purchases of investments (2,605) (1,827) (1,358)
proceeds from sale/maturity of investments 1,822 1,784 1,425
increase in other long-term assets (97) (62) (56)
property acquired (1,329) (1,799) (3,266)
proceeds from sale of property and other long-term assets 25 18 29
Net cash used in investing activities (2,184) (1,886) (3,226)
Cash flows from financing activities:
net decrease in short-term borrowings – (1,007) (57)
net proceeds from issuance of long-term debt 1,985 10 15
Repayment of long-term debt (552) (37) (573)
proceeds from issuance of common stock under share-based payment plans 104 128 174
cash dividend payments (571) (391) (491)
Repurchase of common stock (2,618) (504) (8)
Excesstaxbenefitsofshare-basedpayments 1 – 1
Net cash used in financing activities (1,651) (1,801) (939)
Effect of exchange rate changes on cash 3 20 7
net increase (decrease) in cash and cash equivalents 20 387 (36)
cash and cash equivalents, beginning of year 632 245 281
Cash and cash equivalents, end of year $ 652 $ 632 $ 245See accompanying notes to consolidated financial statements.

34 LOWE’S 2010 AnnuAL REpORt
notes to consoliDateD financial stateMentsyeaRs enDeD JanuaRy 28, 2011, JanuaRy 29, 2010 anD JanuaRy 30, 2009
NOTE 1 SuMMAry OF SIGNIFICANT ACCOuNTING POLICIES
lowe’s companies, inc. and subsidiaries (the company) is the world’s second-largest home improvement retailer and operated 1,749 stores in theUnitedStates,CanadaandMexicoatJanuary28,2011.Belowarethose accounting policies considered by the company to be significant. fiscal year – the company’s fiscal year ends on the friday nearest the end of January. each of the fiscal years presented contained 52 weeks. all references herein for the years 2010, 2009 and 2008 represent the fiscal years ended January 28, 2011, January 29, 2010, and January 30, 2009, respectively. principles of consolidation – the consolidated financial statements include the accounts of the company and its wholly-owned or controlled operating subsidiaries. all intercompany accounts and transactions have been eliminated. foreign currency – the functional currencies of the company’s international subsidiaries are the local currencies of the countries in which the subsidiaries are located. foreign currency denominated assets andliabilitiesaretranslatedintoU.S.dollarsusingtheexchangeratesin effect at the consolidated balance sheet date. Results of operations andcashflowsaretranslatedusingtheaverageexchangeratesthroughouttheperiod.Theeffectofexchangeratefluctuationsontranslation of assets and liabilities is included as a component of shareholders’ equity in accumulated other comprehensive income (loss). gains and losses from foreign currency transactions, which are includedinselling,generalandadministrative(SG&A)expense,havenot been significant. use of estimates – the preparation of the company’s financial statements in accordance with accounting principles generally accepted in the united states of america requires management to make estimates thataffectthereportedamountsofassets,liabilities,salesandexpenses,and related disclosures of contingent assets and liabilities. the company bases these estimates on historical results and various other assump-tions believed to be reasonable, all of which form the basis for making estimates concerning the carrying values of assets and liabilities that are not readily available from other sources. actual results may differ from these estimates. cash and cash equivalents – cash and cash equivalents include cash on hand, demand deposits and short-term investments with original maturities of three months or less when purchased. cash and cash equivalents are carried at amortized cost on the consolidated balance sheets. the majority of payments due from financial institutions for the settlement of credit card and debit card transactions process within two business days and are, therefore, classified as cash and cash equivalents. investments – as of January 28, 2011, investments consisted primarilyofmunicipalobligations,floatingratemunicipalobligations,money market funds and mutual funds. the company classifies as investments restricted balances pledged as collateral for the company’s extendedprotectionplanprogramandforaportionoftheCompany’scasualty insurance and installed sales program liabilities. investments, exclusiveofcashequivalents,withastatedmaturitydateofoneyearorlessfromthebalancesheetdateorthatareexpectedtobeusedin current operations, are classified as short-term investments. the company’s trading securities are also classified as short-term invest-ments. all other investments are classified as long-term.
the company maintains investment securities in conjunction with certain employee benefit plans that are classified as trading securities. these securities are carried at fair value with unrealized gains and lossesincludedinSG&Aexpense.Allotherinvestmentsecuritiesareclassified as available-for-sale and are carried at fair value with unreal-ized gains and losses included in accumulated other comprehensive income (loss) in shareholders’ equity. Merchandise inventory – inventory is stated at the lower of cost or market using the first-in, first-out method of inventory accounting. the cost of inventory also includes certain costs associated with the preparation of inventory for resale, including distribution center costs, and is net of vendor funds. the company records an inventory reserve for the anticipated loss associated with selling inventories below cost. this reserve is based on management’s current knowledge with respect to inventory levels,salestrendsandhistoricalexperience.Managementdoesnotbelieve the company’s merchandise inventories are subject to signifi-cant risk of obsolescence in the near term, and management has the ability to adjust purchasing practices based on anticipated sales trends and general economic conditions. however, changes in consumer purchasing patterns could result in the need for additional reserves. the company also records an inventory reserve for the estimated shrinkage between physical inventories. this reserve is based primarily on actual shrink results from previous physical inventories. changes in the estimated shrink reserve may be necessary based on the timing and results of physical inventories. the company receives funds from vendors in the normal course of business, principally as a result of purchase volumes, sales, early payments or promotions of vendors’ products, which generally do not represent the reimbursement of specific, incremental and identifiable costs incurred by the company to sell the vendor’s product. these funds are treated as a reduction in the cost of inventory as the amounts are accrued, and are recognized as a reduction of cost of sales when the inventory is sold. the company develops accrual rates for vendor funds based ontheprovisionsoftheagreementsinplace.Duetothecomplexityanddiversity of the individual vendor agreements, the company performs analyses and reviews historical trends throughout the year and confirms actual amounts with select vendors to ensure the amounts earned are appropriately recorded. amounts accrued throughout the year could be impacted if actual purchase volumes differ from projected annual purchase volumes, especially in the case of programs that provide for increased funding when graduated purchase volumes are met. Derivative financial instruments – the company occasionally utilizes derivative financial instruments to manage certain business risks. however, the amounts were not material to the company’s consolidated financial statements in any of the years presented.the company does not use derivative financial instruments for trading purposes. credit programs – the majority of the company’s accounts receivable arises from sales of goods and services to commercial business customers. the company has an agreement with ge Money bank (ge) under which ge purchases at face value commercial business accounts receivable originated by the company and services theseaccounts.ThisagreementexpiresinDecember2016,unlessterminated sooner by the parties. the company accounts for these transfers as sales of the accounts receivable. when the company sells its commercial business accounts receivable, it retains certain

LOWE’S 2010 AnnuAL REpORt 35
interests in those receivables, including the funding of a loss reserve and its obligation related to ge’s ongoing servicing of the receivables sold. any gain or loss on the sale is determined based on the previous carrying amounts of the transferred assets allocated at fair value between the receivables sold and the interests retained. fair value is based on thepresentvalueofexpectedfuturecashflows,takingintoaccountthe key assumptions of anticipated credit losses, payment rates, late fee rates, ge’s servicing costs and the discount rate commensurate with the uncertainty involved. Due to the short-term nature of the receivables sold, changes to the key assumptions would not materially impact the recorded gain or loss on the sales of receivables or the fair value of the retained interests in the receivables. total commercial business accounts receivable sold to ge were $1.7billionin2010,$1.6billionin2009and$1.7billionin2008.TheCompanyrecognizedlossesof$31millioninboth2010and2009,and$38millionin2008onthesereceivablesalesasSG&Aexpense,whichprimarily relates to the fair value of the obligations incurred related to servicing costs that are remitted to ge monthly. at January 28, 2011 and January 29, 2010, the fair value of the retained interests was determinedbasedonthepresentvalueofexpectedfuturecashflowsand was insignificant. sales generated through the company’s proprietary credit cards arenotreflectedinreceivables.UnderanagreementwithGE,creditisextendeddirectlytocustomersbyGE.Allcreditprogram-relatedservicesare performed and controlled directly by ge. the company has the option, but no obligation, to purchase the receivables at the end of the agreement in December 2016. tender costs, including amounts associated with accepting the company’s proprietary credit cards, are recordedinSG&Aexpenseintheconsolidatedstatementsofearnings. the total portfolio of receivables held by ge, including both receivables originated by ge from the company’s proprietary credit cards and commercial business accounts receivable originated by the CompanyandsoldtoGE,approximated$5.8billionatJanuary28,2011,and$6.5billionatJanuary29,2010. property and Depreciation – property is recorded at cost. costs associated with major additions are capitalized and depreciated. Capitalassetsareexpectedtoyieldfuturebenefitsandhaveusefulliveswhichexceedoneyear.Thetotalcostofacapitalassetgenerallyincludesallapplicablesalestaxes,deliverycosts,installationcostsandother appropriate costs incurred by the company, including interest in the case of self-constructed assets. upon disposal, the cost of properties and related accumulated depreciation is removed from the accounts,withgainsandlossesreflectedinSG&Aexpenseontheconsolidated statements of earnings. Depreciation is provided over the estimated useful lives of the depreciable assets. assets are depreciated using the straight-line method. leasehold improvements and assets under capital lease are depreciated over the shorter of their estimated useful lives or the term of the related lease, which may include one or more option renewal periods where failuretoexercisesuchoptionswouldresultinaneconomicpenaltyinsuch amount that renewal appears, at the inception of the lease, to be reasonably assured. During the term of a lease, if leasehold improve-ments are placed in service significantly after the inception of the lease, the company depreciates these leasehold improvements over the shorter of the useful life of the leasehold assets or a term that includes lease renewal periods deemed to be reasonably assured at the time the leasehold improvements are placed into service. the amortization
oftheseassetsisincludedindepreciationexpenseontheconsolidatedfinancial statements. Long-LivedAssetImpairment/ExitActivities – the carrying amounts of long-lived assets are reviewed whenever certain events or changes in circumstances indicate that the carrying amounts may not be recoverable. long-lived assets held-for-use includes operating stores as well asexcessproperties,suchasrelocatedstores,closedstoresandother properties that do not meet the held-for-sale criteria. a potential impairment has occurred for long-lived assets held-for-use if projected futureundiscountedcashflowsexpectedtoresultfromtheuseandeventual disposition of the assets are less than the carrying amounts of the assets. an impairment loss is recorded for long-lived assets held-for-use when the carrying amount of the asset is not recoverable andexceedsitsfairvalue. Excesspropertiesthatareexpectedtobesoldwithinthenext 12 months and meet the other relevant held-for-sale criteria are classi-fied as long-lived assets held-for-sale. an impairment loss is recorded for long-lived assets held-for-sale when the carrying amount of the assetexceedsitsfairvaluelesscosttosell.Along-livedassetisnotdepreciated while it is classified as held-for-sale. for long-lived assets to be abandoned, the company considers the asset to be disposed of when it ceases to be used. until it ceases to be used, the company continues to classify the asset as held-for-use and tests for potential impairment accordingly. if the company commits to a plan to abandon a long-lived asset before the end of its previously estimated useful life, its depreciable life is re-evaluated. ImpairmentlossesareincludedinSG&Aexpense.TheCompanyrecordedlong-livedassetimpairmentlossesof$71millionduring2010,including$36millionforoperatingstores,$26millionforexcesspropertiesclassifiedasheld-for-useand$9million,includingcoststosell,forexcesspropertiesclassifiedasheld-for-sale.TheCompanyrecordedlong-livedassetimpairmentlossesof$114millionduring2009,including$53millionforoperatingstores,$40millionforexcesspropertiesclassifiedasheld-for-useand$21million,includingcoststosell,forexcesspropertiesclassifiedasheld-for-sale.TheCompanyrecordedlong-livedassetimpairmentlossesof$21millionduring2008,including$16millionforoperatingstoresand$5millionforexcesspropertiesclassifiedasheld-for-use. Thenetcarryingamountofexcesspropertiesthatdonotmeetthe held-for-sale criteria is included in other assets (non-current) on the consolidatedbalancesheetsandtotaled$239millionand$205millionat January 28, 2011 and January 29, 2010, respectively. when locations under operating leases are closed, a liability is recognized for the fair value of future contractual obligations, including futureminimumleasepayments,propertytaxes,utilitiesandcommonarea maintenance, net of estimated sublease income. amounts accrued were not material for any of the periods presented. leases – for lease agreements that provide for escalating rent payments or free-rent occupancy periods, the company recognizes rentexpenseonastraight-linebasisoverthenon-cancelableleasetermandoptionrenewalperiodswherefailuretoexercisesuchoptionswould result in an economic penalty in such amount that renewal appears, at the inception of the lease, to be reasonably assured. the lease term commences on the date that the company takes possession of or controls the physical use of the property. Deferred rent is included in other liabilities (non-current) on the consolidated balance sheets.

36 LOWE’S 2010 AnnuAL REpORt
accounts payable – the company has an agreement with a third party to provide an accounts payable tracking system which facilitates participating suppliers’ ability to finance payment obligations from the company with designated third-party financial institutions. participating suppliers may, at their sole discretion, make offers to finance one or more payment obligations of the company prior to their scheduled due dates at a discounted price to participating financial institutions. the company’s goal in entering into this arrangement is to capture overall supply chain savings, in the form of pricing, payment terms or vendor funding, created by facilitating suppliers’ ability to finance payment obligations at more favorable discount rates, while providing themwithgreaterworkingcapitalflexibility. the company’s obligations to its suppliers, including amounts due and scheduled payment dates, are not impacted by suppliers’ decisions to finance amounts under this arrangement. however, the company’s right to offset balances due from suppliers against pay-ment obligations is restricted by this arrangement for those payment obligations that have been financed by suppliers. as of January 28, 2011andJanuary29,2010,$645millionand$602million,respec-tively, of the company’s outstanding payment obligations had been placed on the accounts payable tracking system, and participating suppliershadfinanced$476millionand$253million,respectively,of those payment obligations to participating financial institutions. other current liabilities – other current liabilities on the consolidated balance sheets consist of:
January 28, January 29, (in millions) 2011 2010
Self-insuranceliabilities $ 311 $ 300accrued dividends 148 131accrued interest 115 102Accruedpropertytaxes 113 103Salestaxliabilities 112 131other 559 489
Total $1,358 $1,256
self-insurance – the company is self-insured for certain losses relating to workers’ compensation, automobile, property, and general and product liability claims. the company has stop-loss coverage to limittheexposurearisingfromtheseclaims.TheCompanyisalsoself-insuredforcertainlossesrelatingtoextendedprotectionplanandmedical and dental claims. self-insurance claims filed and claims incurred but not reported are accrued based upon management’s estimates of the discounted ultimate cost for self-insured claims incurred using actuarial assumptions followed in the insurance industry and historical experience.Althoughmanagementbelievesithastheabilitytoreason-ably estimate losses related to claims, it is possible that actual results could differ from recorded self-insurance liabilities. the company provides surety bonds issued by insurance companies to secure payment of workers’ compensation liabilities as required in certain states where the company is self-insured. outstanding surety bondsrelatingtoself-insurancetotaled$235millionatJanuary28,2011. IncomeTaxes–TheCompanyestablishesdeferredincometaxassetsandliabilitiesfortemporarydifferencesbetweenthetaxandfinancialaccountingbasesofassetsandliabilities.Thetaxeffectsofsuchdifferencesarereflectedintheconsolidatedbalancesheetsattheenactedtaxratesexpectedtobeineffectwhenthedifferencesreverse. a valuation allowance is recorded to reduce the carrying
amountofdeferredtaxassetsifitismorelikelythannotthatalloraportionoftheassetwillnotberealized.ThetaxbalancesandincometaxexpenserecognizedbytheCompanyarebasedonmanagement’sinterpretationofthetaxstatutesofmultiplejurisdictions. TheCompanyestablishesaliabilityfortaxpositionsforwhichthere is uncertainty as to whether or not the position will be ultimately sustained.TheCompanyincludesinterestrelatedtotaxissuesaspartof net interest on the consolidated financial statements. the company recordsanyapplicablepenaltiesrelatedtotaxissueswithintheincometaxprovision. Revenue Recognition – the company recognizes revenues, netofsalestax,whensalestransactionsoccurandcustomerstakepossession of the merchandise. a provision for anticipated merchandise returns is provided through a reduction of sales and cost of sales in the period that the related sales are recorded. Revenues from product installation services are recognized when the installation is completed. Deferred revenues associated with amounts received for which customers have not yet taken possession of merchandise or for which installation hasnotyetbeencompletedwere$371millionand$354millionatJanuary 28, 2011, and January 29, 2010, respectively. Revenues from stored-value cards, which include gift cards and returned merchandise credits, are deferred and recognized when the cards are redeemed. the liability associated with outstanding stored-valuecardswas$336millionand$329millionatJanuary28,2011,and January 29, 2010, respectively, and these amounts are included in deferred revenue on the consolidated balance sheets. the company recognizes income from unredeemed stored-value cards at the point at which redemption becomes remote. the company’s stored-value cardshavenoexpirationdateordormancyfees.Therefore,todeterminewhen redemption is remote, the company analyzes an aging of the unredeemed cards based on the date of last stored-value card use. ExtendedProtectionPlans – the company sells separately-priced extendedprotectionplancontractsunderaLowe’s-brandedprogramfor which the company is ultimately self-insured. the company recognizesrevenuefromextendedprotectionplansalesonastraight-linebasisovertherespectivecontractterm.Extendedprotectionplancontract terms primarily range from one to four years from the date of purchase or the end of the manufacturer’s warranty, as applicable.Changesindeferredrevenueforextendedprotectionplancontractsare summarized as follows:
(in millions) 2010 2009
Deferredrevenue–extendedprotectionplans, beginningofyear $549 $479additions to deferred revenue 253 220 Deferred revenue recognized (171) (150)Deferredrevenue–extendedprotectionplans, endofyear $631 $549
incremental direct acquisition costs associated with the sale of extendedprotectionplansarealsodeferredandrecognizedasexpenseon a straight-line basis over the respective contract term. Deferred costs associatedwithextendedprotectionplancontractswere$166millionand$150millionatJanuary28,2011andJanuary29,2010,respectively.TheCompany’sextendedprotectionplandeferredcostsareincludedinother assets (non-current) on the consolidated balance sheets. all other costs, such as costs of services performed under the contract, general andadministrativeexpensesandadvertisingexpensesareexpensedas incurred.
LOWE’S 2010 AnnuAL REpORt 37
Theliabilityforextendedprotectionplanclaimsincurredisincludedin other current liabilities on the consolidated balance sheets. changes in theliabilityforextendedprotectionplanclaimsaresummarizedasfollows:
(in millions) 2010 2009
Liabilityforextendedprotectionplanclaims, beginningofyear $23 $17accrual for claims incurred 80 67 claim payments (83) (61)Liabilityforextendedprotectionplanclaims, endofyear $20 $23
CostofSalesandSelling,GeneralandAdministrativeExpenses – Thefollowingliststheprimarycostsclassifiedineachmajorexpensecategory:
Cost of Sales • Totalcostofproductssold,including: - purchase costs, net of vendor funds; -Freightexpensesassociatedwithmovingmerchandise
inventories from vendors to retail stores; - costs associated with operating the company’s distribution
network, including payroll and benefit costs and occupancy costs; • Costsofinstallationservicesprovided; • Costsassociatedwithdeliveryofproductsdirectlyfromvendors
to customers by third parties; • Costsassociatedwithinventoryshrinkageandobsolescence.
Selling, General and Administrative • Payrollandbenefitcostsforretailandcorporateemployees; • Occupancycostsofretailandcorporatefacilities; • Advertising; • Costsassociatedwithdeliveryofproductsfromstores
to customers; • Third-party,in-storeservicecosts; • Tendercosts,includingbankcharges,costsassociatedwith
credit card interchange fees and amounts associated with accepting the company’s proprietary credit cards;
• Costsassociatedwithself-insuredplans,andpremiumcostsfor stop-loss coverage and fully insured plans;
• Long-livedassetimpairmentlossesandgains/losseson disposal of assets;
• Otheradministrativecosts,suchassupplies,andtravel and entertainment.
advertising – costs associated with advertising are charged to expenseasincurred.Advertisingexpenseswere$790million,$750millionand$789millionin2010,2009and2008,respectively. shipping and handling costs – the company includes shipping and handling costs relating to the delivery of products directly from vendors to customers by third parties in cost of sales. shipping and handling costs, which include third-party delivery costs, salaries, and vehicleoperationsexpensesrelatingtothedeliveryofproductsfromstorestocustomers,areclassifiedasSG&Aexpense.ShippingandhandlingcostsincludedinSG&Aexpensewere$431million,$371millionand$378millionin2010,2009and2008,respectively. store opening costs – costs of opening new or relocated retail stores, which include payroll and supply costs incurred prior to store openingandgrandopeningadvertisingcosts,arechargedtoexpenseas incurred.
comprehensive income – the company reports comprehensive income on its consolidated statements of shareholders’ equity. comprehensive income represents changes in shareholders’ equity from non-owner sources and is comprised primarily of net earnings plus or minus unrealized gains or losses on available-for-sale securities, as well as foreign currency translation adjustments. net unrealized gains,netoftax,onavailable-for-salesecuritiesclassifiedinaccumu-lated other comprehensive income on the consolidated balance sheets wereinsignificantatJanuary28,2011and$2millionatJanuary29,2010.Foreigncurrencytranslationgains,netoftax,classifiedinaccumulatedothercomprehensiveincomewere$53millionand$25millionatJanuary28,2011andJanuary29,2010,respectively.the reclassification adjustments for gains/losses included in net earnings were not significant for any of the periods presented. segment information – the company’s home improvement retail stores represent a single operating segment based on the way the company manages its business. operating decisions are made at the company level in order to maintain a consistent retail store presentation. the company’s home improvement retail stores sell similar products and services, use similar processes to sell those products and services, and sell their products and services to similar classes of customers. the amounts of long-lived assets and net sales outside of the u.s. were not significant for any of the periods presented. Reclassifications – certain prior period amounts have been reclassified to conform to current classifications. store opening costs, which were previously reported as a separate line item on the consoli-datedstatementsofearnings,havebeencombinedwithSG&Aexpense.in addition, activity that was previously separately presented for short-term and long-term investments on the consolidated statements of cashflowswascombinedintosinglelineitemsforpurchasesofinvest-ments and proceeds from the sale/maturity of investments. proceeds from the issuance of common stock under the employee stock purchase planandfromstockoptionsexercised,whichwerepreviouslyreportedasseparatelineitemsontheconsolidatedstatementsofcashflows,were also combined into a single line item. in addition, deferred revenue–extendedprotectionplans,whichwaspreviouslyincludedin other liabilities (noncurrent), is now a separate line item on the consolidated balance sheets.
NOTE 2 FAIr VALuE MEASurEMENTS AND FINANCIAL INSTruMENTS
fair value is defined as the price that would be received to sell an asset or paid to transfer a liability in an orderly transaction between market participants at the measurement date. the authoritative guidance for fair value measurements establishes a three-level hierarchy, which encouragesanentitytomaximizetheuseofobservableinputsandminimize the use of unobservable inputs when measuring fair value. the three levels of the hierarchy are defined as follows:
• Level1–inputstothevaluationtechniquesthatarequotedprices in active markets for identical assets or liabilities
• Level2–inputstothevaluationtechniquesthatareotherthanquoted prices but are observable for the assets or liabilities, either directly or indirectly
• Level3–inputstothevaluationtechniquesthatareunobservablefor the assets or liabilities

38 LOWE’S 2010 AnnuAL REpORt
Assets and Liabilities That are Measured at Fair Value on a Recurring Basisthe following tables present the company’s financial assets measured at fair value on a recurring basis as of January 28, 2011 and January 29, 2010, classified by fair value hierarchy:
fair value Measurements at Reporting Date using quoted prices significant in active other significant Markets for observable unobservable January 28, identical assets inputs inputs(in millions) 2011 (level 1) (level 2) (level 3)
available-for-sale securities: Municipal obligations $ 190 $ – $ 190 $ – Municipalfloating rate obligations 163 – 163 – Money market funds 66 66 – – other 2 2 – –trading securities: Mutual funds 50 50 – – Total short-term investments $ 471 $118 $ 353 $ – available-for-sale securities: Municipalfloating rateobligations $ 765 $ – $ 765 $ – Municipal obligations 208 – 208 – other 35 – 35 –Total long-term investments $1,008 $ – $1,008 $ –
fair value Measurements at Reporting Date using quoted prices significant in active other significant Markets for observable unobservable January 29, identical assets inputs inputs(in millions) 2010 (level 1) (level 2) (level 3)
available-for-sale securities: Municipal obligations $296 $ – $296 $ – Municipalfloating rate obligations 7 – 7 – Money market funds 68 68 – – other 12 2 10 –trading securities: Mutual funds 42 42 – –Total short-term investments $425 $112 $313 $ –available-for-sale securities: Municipalfloating rateobligations $141 $ – $141 $ – Municipal obligations 136 – 136 –Total long-term investments $277 $ – $277 $ –
when available, quoted prices are used to determine fair value. when quoted prices in active markets are available, investments are classified within level 1 of the fair value hierarchy. when quoted prices in active markets are not available, fair values are determined using pricing models, and the inputs to those pricing models are based on observable market inputs. the inputs to the pricing models are typically benchmark yields, reported trades, broker-dealer quotes, issuer spreads and benchmark securities, among others.
Assets and Liabilities That are Measured at Fair Value on a Non-recurring Basis for the years ended January 28, 2011 and January 29, 2010, the company’s only significant assets or liabilities measured at fair value on a non-recurring basis subsequent to their initial recognition were certain assets subject to long-lived asset impairment. the company reviews the carrying amounts of long-lived assets whenever events or changes in circumstances indicate that the carrying amounts may not be recoverable. an impairment loss is recognized when the carrying amount of the long-lived asset is not recoverable andexceedsitsfairvalue.TheCompanyestimatedthefairvaluesoflong-lived assets based on the company’s own judgments about the assumptions that market participants would use in pricing the asset and on observable market data, when available. the company classified these fair value measurements as level 3. in the determination of impairment for operating stores, the company determined the fair values of individual operating stores using an income approach, which required discounting projected futurecashflows.Whendeterminingthestreamofprojectedfuturecashflowsassociatedwithanindividualoperatingstore,managementmade assumptions, incorporating local market conditions, about key store variables, including sales growth rates, gross margin and controllableexpensessuchasstorepayrollandoccupancyexpense.Inordertocalculatethepresentvalueofthosefuturecashflows,theCompanydiscountedcashflowestimatesataratecommensuratewith the risk that selected market participants would assign to the cashflows.Theselectedmarketparticipantsrepresentagroupofother retailers with a store footprint similar in size to the company’s. Inthedeterminationofimpairmentforexcesspropertiesheld-for-use and held-for-sale, which consist of retail outparcels and property associated with relocated or closed stores, the fair values were determined using a market approach based on estimated selling prices. the company determined the estimated selling prices by obtaining information from brokers in the specific markets being evaluated. the information included comparable sales of similar assets and assumptions about demand in the market for these assets. the following tables present such assets measured at fair value on a non-recurring basis and any resulting realized losses included in earnings. because long-lived assets are not measured at fair value on a recurring basis, certain carrying amounts and fair value measurements presentedinthetablemayreflectvaluesatearliermeasurementdatesand may no longer represent the fair values at January 28, 2011 and January 29, 2010.

LOWE’S 2010 AnnuAL REpORt 39
Fair Value Measurements – Non-Recurring Basis
January 28, 2011
previous fair value carrying impairment(in millions) Measurements amounts losses
operating stores: long-lived assets held-for-use $15 $51 $(36)Excessproperties: long-lived assets held-for-use $45 $71 $(26) long-lived assets held-for-sale $36 $44 $ (8)
January 29, 2010
previous fair value carrying impairment(in millions) Measurements amounts losses
operating stores: long-lived assets held-for-use $6 $59 $(53)Excessproperties: long-lived assets held-for-use $74 $114 $(40) long-lived assets held-for-sale $25 $46 $(21)
Fair Value of Financial Instrumentsthe company’s financial instruments not measured at fair value on a recurring basis include cash and cash equivalents, accounts receivable, short-term borrowings, accounts payable, accrued liabilities and long-termdebtandarereflectedinthefinancialstatementsatcost.Withtheexceptionoflong-termdebt,costapproximatesfairvaluefortheseitems due to their short-term nature. estimated fair values for long-term debt have been determined using available market information, including reported trades, benchmark yields and broker-dealer quotes. carrying amounts and the related estimated fair value of the Company’slong-termdebt,excludingcapitalizedleaseobligations,are as follows:
January 28, 2011 January 29, 2010 carrying fair carrying fair (in millions) amount value amount value
long-term debt (excludingcapitalized leaseobligations) $6,209 $6,715 $4,737 $5,127
NOTE 3 INVESTMENTSthe amortized costs, gross unrealized holding gains and losses, and fair values of the company’s investment securities classified as available-for-sale at January 28, 2011, and January 29, 2010, are as follows:
January 28, 2011 gross gross type amortized unrealized unrealized fair (in millions) costs gains losses values
Municipalobligations $ 189 $1 $– $ 190Municipalfloatingrate obligations 163 – – 163Money market funds 66 – – 66other 2 – – 2Classified as short-term 420 1 – 421Municipalfloatingrate obligations 765 – – 765Municipal obligations 209 – (1) 208other 35 – – 35Classified as long-term 1,009 – (1) 1,008Total $1,429 $ 1 $(1) $1,429
January 29, 2010 gross gross type amortized unrealized unrealized fair (in millions) costs gains losses values
Municipalobligations $294 $2 $– $296Municipalfloatingrate obligations 7 – – 7Money market funds 68 – – 68other 12 – – 12Classified as short-term 381 2 – 383Municipalfloatingrate obligations 141 – – 141Municipal obligations 134 2 – 136Classified as long-term 275 2 – 277Total $656 $4 $ – $660
the proceeds from sales of available-for-sale securities were $814million,$1.2billionand$1.0billionfor2010,2009and2008,respectively. gross realized gains and losses on the sale of available-for-sale securities were not significant for any of the periods presented. the investments classified as long-term at January 28, 2011, will mature in one to 41 years, based on stated maturity dates. the company has elected the fair value option for certain investments maintained in conjunction with certain employee benefit plans. these investments are reported as trading securities, which are includedinshort-terminvestments,andwere$50millionand$42millionat January 28, 2011 and January 29, 2010, respectively. for the years ended January 28, 2011, January 29, 2010, and January 30, 2009, netunrealizedgainsfortradingsecuritiestotaled$6million,$7million,and$14million,respectively.UnrealizedgainsandlossesontradingsecuritieswereincludedinSG&Aexpense.Cashflowsfrompurchases,salesandmaturitiesoftradingsecuritiesareincludedincashflowsfrominvestingactivitiesintheconsolidatedstatementsofcashflowsbasedon the nature and purpose for which the securities were acquired.
40 LOWE’S 2010 AnnuAL REpORt
short-term and long-term investments include restricted balances pledgedascollateralfortheCompany’sextendedprotectionplanprogram and for a portion of the company’s casualty insurance and installed sales program liabilities. Restricted balances included in short-terminvestmentswere$102millionatJanuary28,2011and$186millionatJanuary29,2010.Restrictedbalancesincludedinlong-terminvestmentswere$260millionatJanuary28,2011,and$202millionatJanuary29,2010.
NOTE 4 PrOPErTy AND ACCuMuLATED DEPrECIATION
property is summarized by major class in the following table:
estimated Depreciable January 28, January 29,(in millions) lives, in years 2011 2010
Cost:Land N/A $6,742 $ 6,519buildings and building improvements 5-40 16,531 15,887 equipment 3-15 9,142 8,826 construction in progress n/a 930 1,036 Total cost 33,345 32,268 accumulated depreciation (11,256) (9,769)Property, less accumulated depreciation $ 22,089 $22,499
included in net property are assets under capital lease of $567million,lessaccumulateddepreciationof$353million,at January28,2011,and$519million,lessaccumulateddepreciation of$333million,atJanuary29,2010.
NOTE 5 ShOrT-TErM BOrrOwINGS AND LINES OF CrEDIT
TheCompanyhasa$1.75billionseniorcreditfacilitythatexpiresinJune 2012. the senior credit facility also supports the company’s commercialpaperprogram.Theseniorcreditfacilityhasa$500millionletter of credit sublimit. letters of credit issued pursuant to the senior credit facility reduce the amount available for borrowing under the senior credit facility. borrowings made are unsecured and are priced atfixedratesbaseduponmarketconditionsatthetimeoffundinginaccordance with the terms of the senior credit facility. the senior credit facility contains certain restrictive covenants, which include maintenance of a debt leverage ratio as defined by the senior credit facility. the company was in compliance with those covenants at January 28, 2011. seventeen banking institutions are participating in the senior credit facility. as of January 28, 2011 and January 29, 2010, there were no outstanding borrowings or letters of credit under the senior credit facility and no outstanding borrowings under the commercial paper program. TheCompanyalsohasaCanadiandollar(C$)denominatedcreditfacilityintheamountofC$50millionthatprovidesrevolvingcreditsupport for our canadian operations. this uncommitted credit facility provides the company with the ability to make unsecured borrowings whicharepricedatfixedratesbaseduponmarketconditionsatthetime of funding in accordance with the terms of the credit facility. as of January 28, 2011 and January 29, 2010, there were no outstanding borrowingsundertheC$creditfacility.
NOTE 6 LONG-TErM DEBT weighted-average Debt category interest Rate at January 28, January 29, (in millions) January 28, 2011 2011 2010
Secured debt: 1
Mortgage notes due fiscal2010-2018 6.11% $ 17 $ 35unsecured debt:notes due fiscal 2010-2015 5.31% 1,047 1,546notes due fiscal 2016-2020 4.40% 1,767 796notes due fiscal 2021-2025 3.87% 537 15notes due fiscal 2026-2030 6.76% 812 812notes due fiscal 2031-2035 5.50% 493 493notes due fiscal 2036-20402 6.16% 1,536 1,040capitalized lease obligations due fiscal 2011 to 2035 364 343Total long-term debt 6,573 5,080less current maturities (36) (552)Long-term debt, excluding current maturities $6,537 $4,5281 Real properties with an aggregate book value of $52 million were pledged as collateral at January 28, 2011,
for secured debt.
2 Amount includes $100 million of notes issued in 1997 that may be put at the option of the holder on the 20th anniversary of the issue at par value. None of these notes are currently puttable.
Debtmaturities,exclusiveofunamortizedoriginalissuediscountsandcapitalizedleaseobligations,forthenextfiveyearsandthereafterareasfollows:2011,$1million;2012,$551million;2013,$1million;2014,$1million;2015,$508million;thereafter,$5.2billion. the company’s unsecured notes are issued under indentures that have generally similar terms and therefore have been grouped by maturity date for presentation purposes in the table above. the notes contain certainrestrictivecovenants,noneofwhichisexpectedtoimpactthecompany’s capital resources or liquidity. the company was in compli-ance with all covenants of these agreements at January 28, 2011. InApril2010,theCompanyissued$1.0billionofunsecurednotesintwotranches:$500millionof4.625%notesmaturinginApril2020(the2020notes)and$500millionof5.8%notesmaturinginApril2040(the 2040 notes). the 2020 and 2040 notes were issued at discounts ofapproximately$3millionand$5million,respectively.Interestonthenotes is payable semiannually in arrears in april and october of each year until maturity. InNovember2010,theCompanyissued$1.0billionofunsecurednotesintwotranches:$475millionof2.125%notesmaturinginApril2016(the2016notes)and$525millionof3.75%notesmaturinginapril 2021 (the 2021 notes). the 2016 and 2021 notes were issued atdiscountsofapproximately$2millionand$3million,respectively.interest on these notes is payable semiannually in arrears in april and october of each year until maturity, beginning in april 2011. the discount associated with these issuances is included in long-term debt and is being amortized over the respective terms of the notes.
LOWE’S 2010 AnnuAL REpORt 41
the indenture governing the notes issued in 2010 contains a provision that allows the company to redeem the notes at any time, in whole or in part, at specified redemption prices plus accrued interest to the date of redemption. the indenture also contains a provision that allows the holders of the notes to require the company to repurchase all or any part of their notes if a change of control triggering event occurs. if elected under the change of control provisions, the repurchase of the notes will occur at a purchase price of 101% of the principal amount, plus accrued and unpaid interest, if any, on such notes to the date of purchase. the indenture governing the notes does not limit the aggre-gate principal amount of debt securities that the company may issue, nor is the company required to maintain financial ratios or specified levels of net worth or liquidity. however, the indenture contains various restrictivecovenants,noneofwhichisexpectedtoimpacttheCompany’sliquidity or capital resources.
NOTE 7 ShArEhOLDErS’ EquITy Authorizedsharesofpreferredstockwere5.0million($5parvalue)at January 28, 2011 and January 29, 2010, none of which have been issued. the board of Directors may issue the preferred stock (without action by shareholders) in one or more series, having such voting rights, dividend and liquidation preferences, and such conversion and other rights as may be designated by the board of Directors at the time of issuance. Authorizedsharesofcommonstockwere5.6billion($.50parvalue)at January 28, 2011 and January 29, 2010. TheCompanyhasasharerepurchaseprogramthatisexecutedthrough purchases made from time to time either in the open market or through private transactions. shares purchased under the share repurchase program are retired and returned to authorized and unissued status.TheCompany’sBoardofDirectorsauthorizedupto$5.0billionofsharerepurchasesonJanuary29,2010withnoexpiration,afterthepriorauthorizationexpiredonthatdate.AsofJanuary28,2011theCompanyhad$2.4billionofauthorizationremainingunderthesharerepurchase program. the company repurchased 111.7 million shares and 21.9 million sharesunderthesharerepurchaseprogramatatotalcostof$2.6billionand$500millionfortheyearsendedJanuary28,2011andJanuary29,2010,respectively.Areductionof$2.4billionand$3millionwasrecordedtoretainedearnings,aftercapitalinexcessofparvaluewasdepleted, for the years ended January 28, 2011 and January 29, 2010, respectively. the company also repurchased 0.7 million and 0.2 million sharesfromemployeesatatotalcostof$18millionand$4million,forthe years ended January 28, 2011 and January 29, 2010, respectively, tosatisfyeithertheexercisepriceofstockoptionsexercisedorthestatutorywithholdingtaxliabilityresultingfromthevestingofrestrictedstock awards.
NOTE 8 ACCOuNTING FOr ShArE-BASED PAyMENT
Overview of Share-Based Payment Plansthe company has equity incentive plans (the incentive plans) under which the company may grant share-based awards to key employees and non-employee directors. the company also has an employee stock purchase plan (the espp) that allows employees to purchase company shares at a discount through payroll deductions. these plans contain a nondiscretionary anti-dilution provision that is designed to equalize the value of an award as a result of an equity restructuring. share-based awards were authorized under the incentive plans for grant to key employees and non-employee directors for up to 169.0 million shares of common stock. in addition, up to 45.0 million shares were authorized under the espp. at January 28, 2011, there were 24.0 million shares remaining available for grant under the incentive plans and 10.7 million shares available under the espp. TheCompanyrecognizedshare-basedpaymentexpenseinSG&Aexpenseontheconsolidatedstatementsofearningstotaling$115million,$102millionand$95millionin2010,2009and2008,respectively.Thetotalassociatedincometaxbenefitrecognized was$38million,$27millionand$31millionin2010,2009and 2008, respectively. Totalunrecognizedshare-basedpaymentexpenseforall share-basedpaymentplanswas$106millionatJanuary28,2011,ofwhich$69millionwillberecognizedin2011,$34millionin2012and$3millionthereafter.Thisresultsintheseamountsbeing recognized over a weighted-average period of 1.6 years. Forallshare-basedpaymentawards,theexpenserecognizedhas been adjusted for estimated forfeitures where the requisite serviceisnotexpectedtobeprovided.Estimatedforfeiturerates are developed based on the company’s analysis of historical forfeiture data for homogeneous employee groups. general terms and methods of valuation for the company’s share-based awards are as follows:
Stock Optionsstock options generally have terms of seven years, with one-third of each grant vesting each year for three years, and are assigned anexercisepriceequaltotheclosingmarketpriceofashareofthecompany’s common stock on the date of grant. these options are expensedonastraight-linebasisoverthegrantvestingperiod, which is considered to be the requisite service period.
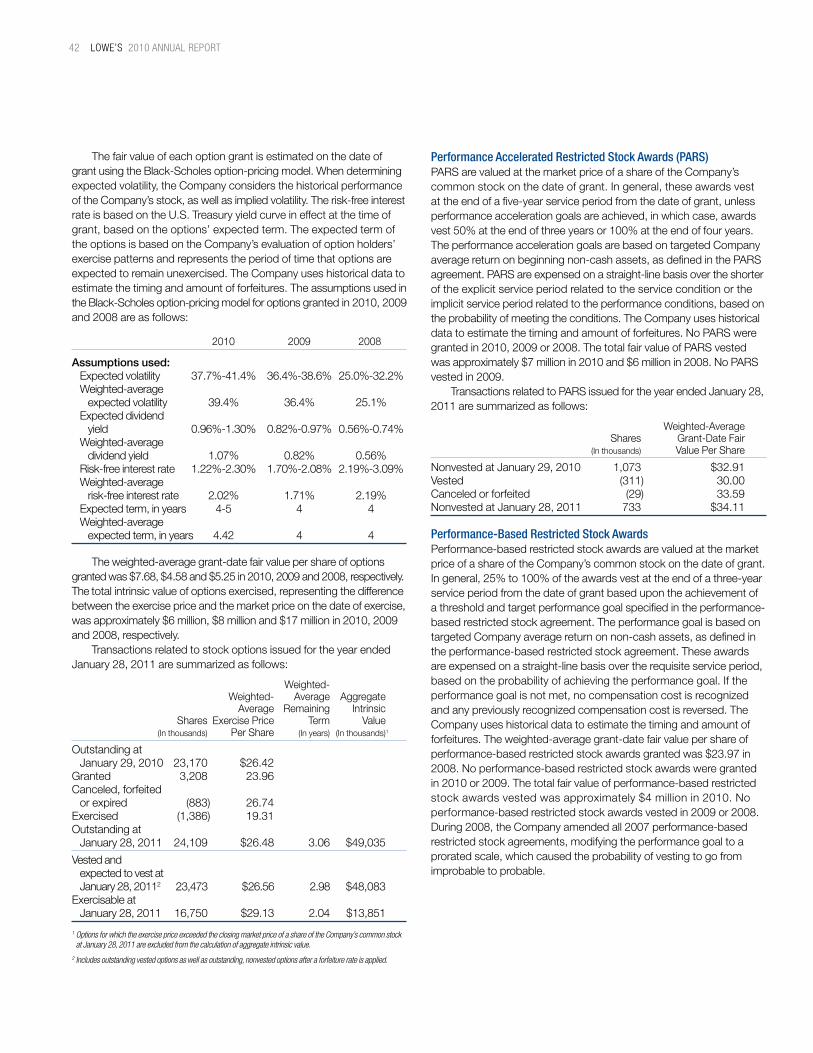
42 LOWE’S 2010 AnnuAL REpORt
the fair value of each option grant is estimated on the date of grant using the black-scholes option-pricing model. when determining expectedvolatility,theCompanyconsidersthehistoricalperformanceof the company’s stock, as well as implied volatility. the risk-free interest rate is based on the u.s. treasury yield curve in effect at the time of grant,basedontheoptions’expectedterm.Theexpectedtermofthe options is based on the company’s evaluation of option holders’ exercisepatternsandrepresentstheperiodoftimethatoptionsareexpectedtoremainunexercised.TheCompanyuseshistoricaldatatoestimate the timing and amount of forfeitures. the assumptions used in the black-scholes option-pricing model for options granted in 2010, 2009 and 2008 are as follows:
2010 2009 2008
Assumptions used: Expectedvolatility 37.7%-41.4% 36.4%-38.6% 25.0%-32.2% weighted-average expectedvolatility 39.4% 36.4% 25.1% Expecteddividend yield 0.96%-1.30% 0.82%-0.97% 0.56%-0.74% weighted-average dividend yield 1.07% 0.82% 0.56% Risk-free interest rate 1.22%-2.30% 1.70%-2.08% 2.19%-3.09% weighted-average risk-free interest rate 2.02% 1.71% 2.19% Expectedterm,inyears 4-5 4 4 weighted-average expectedterm,inyears 4.42 4 4
the weighted-average grant-date fair value per share of options grantedwas$7.68,$4.58and$5.25in2010,2009and2008,respectively.Thetotalintrinsicvalueofoptionsexercised,representingthedifferencebetweentheexercisepriceandthemarketpriceonthedateofexercise,wasapproximately$6million,$8millionand$17millionin2010,2009and 2008, respectively. transactions related to stock options issued for the year ended January 28, 2011 are summarized as follows:
weighted- weighted- average aggregate average Remaining intrinsic Shares ExercisePrice Term Value (in thousands) per share (in years) (in thousands)1
outstanding at January29,2010 23,170 $26.42granted 3,208 23.96canceled, forfeited orexpired (883) 26.74Exercised (1,386) 19.31outstanding at January28,2011 24,109 $26.48 3.06 $49,035
vested and expectedtovestat January 28, 20112 23,473 $26.56 2.98 $48,083Exercisableat January28,2011 16,750 $29.13 2.04 $13,851
1 Options for which the exercise price exceeded the closing market price of a share of the Company’s common stock at January 28, 2011 are excluded from the calculation of aggregate intrinsic value.
2 Includes outstanding vested options as well as outstanding, nonvested options after a forfeiture rate is applied.
Performance Accelerated Restricted Stock Awards (PARS)paRs are valued at the market price of a share of the company’s common stock on the date of grant. in general, these awards vest at the end of a five-year service period from the date of grant, unless performance acceleration goals are achieved, in which case, awards vest 50% at the end of three years or 100% at the end of four years. the performance acceleration goals are based on targeted company average return on beginning non-cash assets, as defined in the paRs agreement.PARSareexpensedonastraight-linebasisovertheshorteroftheexplicitserviceperiodrelatedtotheserviceconditionortheimplicit service period related to the performance conditions, based on the probability of meeting the conditions. the company uses historical data to estimate the timing and amount of forfeitures. no paRs were granted in 2010, 2009 or 2008. the total fair value of paRs vested wasapproximately$7millionin2010and$6millionin2008.NoPARSvested in 2009. transactions related to paRs issued for the year ended January 28, 2011 are summarized as follows:
weighted-average shares grant-Date fair (in thousands) value per share
NonvestedatJanuary29,2010 1,073 $32.91vested (311) 30.00 canceled or forfeited (29) 33.59 NonvestedatJanuary28,2011 733 $34.11
Performance-Based Restricted Stock Awardsperformance-based restricted stock awards are valued at the market price of a share of the company’s common stock on the date of grant. in general, 25% to 100% of the awards vest at the end of a three-year service period from the date of grant based upon the achievement of a threshold and target performance goal specified in the performance-based restricted stock agreement. the performance goal is based on targeted company average return on non-cash assets, as defined in the performance-based restricted stock agreement. these awards areexpensedonastraight-linebasisovertherequisiteserviceperiod,based on the probability of achieving the performance goal. if the performance goal is not met, no compensation cost is recognized and any previously recognized compensation cost is reversed. the company uses historical data to estimate the timing and amount of forfeitures. the weighted-average grant-date fair value per share of performance-basedrestrictedstockawardsgrantedwas$23.97in2008. no performance-based restricted stock awards were granted in 2010 or 2009. the total fair value of performance-based restricted stockawardsvestedwasapproximately$4millionin2010.Noperformance-based restricted stock awards vested in 2009 or 2008. During 2008, the company amended all 2007 performance-based restricted stock agreements, modifying the performance goal to a prorated scale, which caused the probability of vesting to go from improbable to probable.

LOWE’S 2010 AnnuAL REpORt 43
transactions related to performance-based restricted stock awards issued for the year ended January 28, 2011 are summarized as follows:
weighted-average shares grant-Date fair (in thousands) value per share
NonvestedatJanuary29,2010 1,484 $27.30vested (151) 32.18canceled or forfeited (475) 31.77NonvestedatJanuary28,2011 858 $23.97
Restricted Stock AwardsRestricted stock awards are valued at the market price of a share of the company’s common stock on the date of grant. in general, these awards vest at the end of a three- to five-year period from the date of grantandareexpensedonastraight-linebasisoverthatperiod,whichis considered to be the requisite service period. the company uses historical data to estimate the timing and amount of forfeitures. the weighted-average grant-date fair value per share of restricted stock awardsgrantedwas$23.88,$16.03and$23.75in2010,2009,and2008, respectively. the total fair value of restricted stock awards vested wasapproximately$37million,$12millionand$18millionin2010,2009and 2008, respectively. transactions related to restricted stock awards issued for the year ended January 28, 2011 are summarized as follows:
weighted-average shares grant-Date fair (in thousands) value per share
NonvestedatJanuary29,2010 8,457 $20.86granted 3,458 23.88 vested (1,554) 30.23 canceled or forfeited (506) 20.45 NonvestedatJanuary28,2011 9,855 $20.46
Deferred Stock UnitsDeferred stock units are valued at the market price of a share of the company’s common stock on the date of grant. for non-employee Directors,theseawardsvestimmediatelyandareexpensedonthegrant date. During 2010, 2009 and 2008 each non-employee Director was awarded a number of deferred stock units determined by dividing the annual award amount by the fair market value of a share of the company’s common stock on the award date and rounding up to thenext100units.TheannualawardamountusedtodeterminethenumberofdeferredstockunitsgrantedtoeachDirectorwas$115,000in 2010, 2009 and 2008. During 2010, 47,000 deferred stock units were granted and immediately vested for non-employee Directors. the weighted-average grant-date fair value per share of deferred stock unitsgrantedwas$24.75,$19.01and$24.00in2010,2009and2008,respectively. the total fair value of deferred stock units vested was approximately$1millioninboth2010and2009and$10millionin2008. at January 28, 2011, there were 0.7 million deferred stock units outstanding all of which were vested.
Restricted Stock UnitsRestricted stock units do not have dividend rights and are valued at the market price of a share of the company’s common stock on the date of grantlessthepresentvalueofdividendsexpectedduringtherequisiteservice period. in general, these awards vest at the end of a three-year periodfromthedateofgrantandareexpensedonastraight-linebasisover that period, which is considered to be the requisite service period. the company uses historical data to estimate the timing and amount of forfeitures. the weighted-average grant-date fair value per share of restrictedstockunitsgrantedwas$22.84,$15.63and$22.80in2010,2009 and 2008, respectively. an insignificant number of restricted stock units vested in 2010, 2009 and 2008. transactions related to restricted stock units issued for the year ended January 28, 2011 are summarized as follows:
weighted-average shares grant-Date fair (in thousands) value per share
NonvestedatJanuary29,2010 92 $18.35granted 99 22.84 vested (11) 22.72 canceled or forfeited (12) 20.16 NonvestedatJanuary28,2011 168 $20.58
ESPPthe purchase price of the shares under the espp equals 85% of the closing price on the date of purchase. the company’s share-based paymentexpenseisequalto15%oftheclosingpriceonthedateofpurchase. the espp is considered a liability award and is measured at fair value at each reporting date, and the share-based payment expenseisrecognizedoverthesix-monthofferingperiod.Thecompany issued 3,846,086 shares of common stock pursuant to this plan during the year ended January 28, 2011.
NOTE 9 EMPLOyEE rETIrEMENT PLANSthe company maintains a defined contribution retirement plan for its eligible employees (the 401(k) plan). employees are eligible to participate inthe401(k)Plansixmonths(180dayspriortoJanuary1,2011)after their original date of service. eligible employees are automatically enrolled in the 401(k) plan at a 1% deferral rate, unless the employee elects otherwise. the company makes contributions to the 401(k) plan each payroll period, based upon a matching formula applied to employee deferrals (the company match). plan participants are eligible toreceivetheCompanymatchaftercompletingsixmonths(180daysprior to January 1, 2011) of continuous service. the company match variesbasedonhowmuchtheemployeeelectstodeferuptoamaxi-mum of 4.25% of eligible compensation. the company match is invested identically to employee contributions and vests immediately in the participant accounts. the company maintains a benefit Restoration plan to supplement benefits provided under the 401(k) plan to plan participants whose benefits are restricted as a result of certain provisions of the internal Revenue code of 1986. this plan provides for employee salary deferrals and employer contributions in the form of a company match.

44 LOWE’S 2010 AnnuAL REpORt
the company maintains a non-qualified deferred compensation program called the lowe’s cash Deferral plan. this plan is designed to permit certain employees to defer receipt of portions of their compensa-tion,therebydelayingtaxationonthedeferralamountandonsubsequentearnings until the balance is distributed. this plan does not provide for employer contributions. TheCompanyrecognizedexpenseassociatedwithemployee retirementplansof$154millioninboth2010and2009and$112millionin 2008.
NOTE 10 INCOME TAxESThefollowingisareconciliationoftheeffectivetaxratetothefederalstatutorytaxrate:
2010 2009 2008
Statutoryfederalincometaxrate 35.0% 35.0% 35.0%Stateincometaxes,netof federaltaxbenefit 3.0 2.2 2.9other, net (0.3) (0.3) (0.5) Effective tax rate 37.7% 36.9% 37.4%
Thecomponentsoftheincometaxprovisionareasfollows:
(in millions) 2010 2009 2008
Current: Federal $1,171 $1,046 $1,070 state 188 123 166Total current 1,359 1,169 1,236Deferred: federal (117) (108) 82 state (24) (19) (7)Total deferred (141) (127) 75Total income tax provision $1,218 $1,042 $1,311
Thetaxeffectsofcumulativetemporarydifferencesthatgaverisetothedeferredtaxassetsandliabilitieswereasfollows:
January 28, January 29, (in millions) 2011 2010
Deferred tax assets: Self-insurance $303 $251 Share-basedpaymentexpense 128 115 Deferred rent 89 75 other, net 249 223Total deferred tax assets 769 664valuation allowance (99) (65)Net deferred tax assets 670 599Deferred tax liabilities: property (870) (934) other, net (74) (55)Total deferred tax liabilities (944) (989)Net deferred tax liability $ (274) $ (390)
the company operates as a branch in various foreign jurisdictions andcumulativelyhasincurrednetoperatinglossesof$310millionand$209millionasofJanuary28,2011,andJanuary29,2010,respectively.Thenetoperatinglossesaresubjecttoexpirationin2017through2030.Deferredtaxassetshavebeenestablishedforthesenetoperatinglossesin the accompanying consolidated balance sheets. given the uncertainty regardingtherealizationoftheforeignnetdeferredtaxassets,thecompany recorded cumulative valuation allowances for the full amount ofthenetdeferredtaxassets,$99millionand$65millionatJanuary28,2011, and January 29, 2010, respectively. a reconciliation of the beginning and ending balances of unrecognizedtaxbenefitsisasfollows:
(in millions) 2010 2009 2008
Unrecognizedtaxbenefits, beginningofyear $154 $200 $138Additionsfortaxpositionsofprioryears 22 31 82Reductionsfortaxpositionsofprioryears (19) (45) (16)Netadditionsbasedontaxpositions related to the current year 9 5 16 settlements (1) (37) (19)Reductions due to a lapse in applicable statute of limitations – – (1)Unrecognizedtaxbenefits,endofyear $165 $154 $200
Theamountsofunrecognizedtaxbenefitsthat,ifrecognized,wouldfavorablyimpacttheeffectivetaxratewere$8millionand$7millionasof January 28, 2011, and January 29, 2010, respectively. During2010,theCompanyrecognized$7millionofinterestexpenseanda$0.2millionincreaseinpenaltiesrelatedtouncertaintaxpositions.AsofJanuary28,2011,theCompanyhad$21millionofaccruedinterestand$0.7millionofaccruedpenalties.During2009,theCompanyrecognized$9millionofinterestincomeanda$9millionreductioninpenaltiesrelatedtouncertaintaxpositions.AsofJanuary29,2010,theCompanyhad$14millionofaccruedinterestand$1millionofaccruedpenalties.During2008,theCompanyrecognized$10millionofinterestexpenseand$3millionofpenaltiesrelatedtouncertaintaxpositions. TheCompanyissubjecttoexaminationbyvariousforeignanddomestictaxingauthorities.TheCompanyisappealinganIRSexaminationforfiscalyears2004and2005relatedtoinsurancedeductions. it is reasonably possible this issue will be settled within thenexttwelvemonthsresultinginareductioninitsunrecognizedtaxbenefitofapproximately$70million.TheCompany’sU.S.federalincometaxreturnsforfiscalyears2006and2007arecurrentlyunderaudit.TherearealsoongoingU.S.stateauditscoveringtaxyears 2002 to 2009. the company believes appropriate provisions for all outstanding issues have been made for all jurisdictions and all open years.
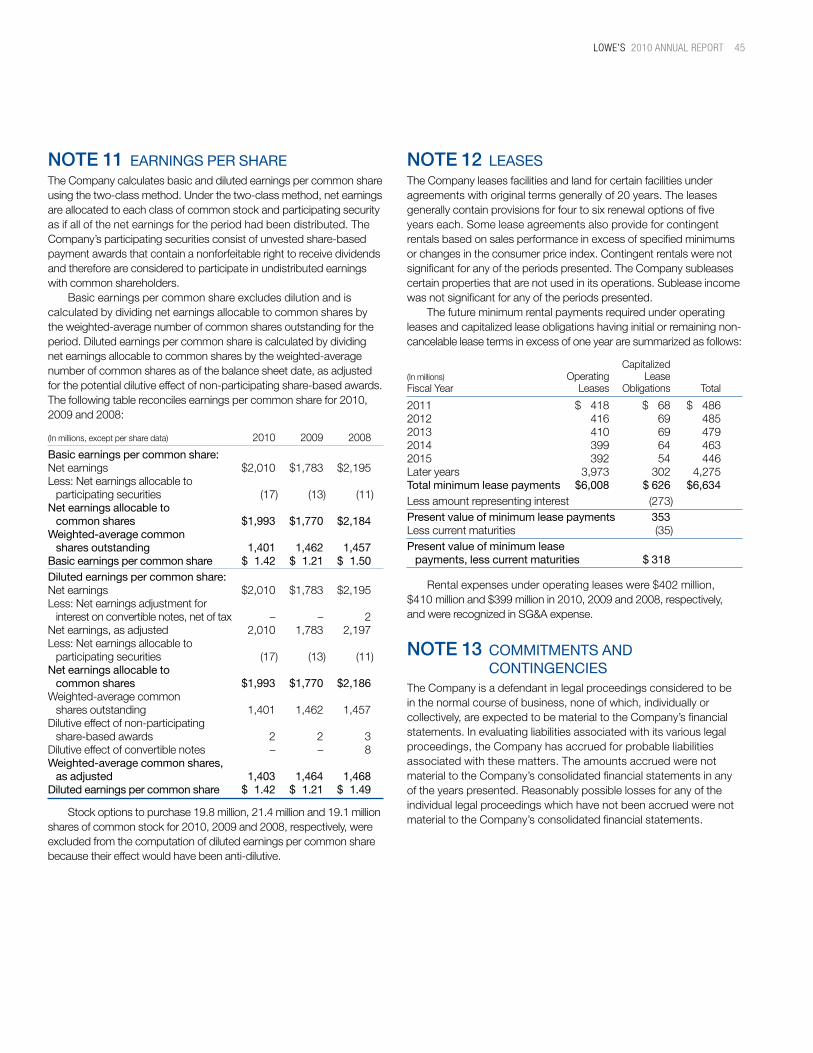
LOWE’S 2010 AnnuAL REpORt 45
NOTE 11 EArNINGS PEr ShArEthe company calculates basic and diluted earnings per common share using the two-class method. under the two-class method, net earnings are allocated to each class of common stock and participating security as if all of the net earnings for the period had been distributed. the company’s participating securities consist of unvested share-based payment awards that contain a nonforfeitable right to receive dividends and therefore are considered to participate in undistributed earnings with common shareholders. Basicearningspercommonshareexcludesdilutionandis calculated by dividing net earnings allocable to common shares by the weighted-average number of common shares outstanding for the period. Diluted earnings per common share is calculated by dividing net earnings allocable to common shares by the weighted-average number of common shares as of the balance sheet date, as adjusted for the potential dilutive effect of non-participating share-based awards. the following table reconciles earnings per common share for 2010, 2009 and 2008:
(Inmillions,exceptpersharedata) 2010 2009 2008
Basic earnings per common share:Netearnings $2,010 $1,783 $2,195less: net earnings allocable to participating securities (17) (13) (11)Net earnings allocable to common shares $1,993 $1,770 $2,184weighted-average common shares outstanding 1,401 1,462 1,457Basic earnings per common share $ 1.42 $ 1.21 $ 1.50Diluted earnings per common share:Netearnings $2,010 $1,783 $2,195less: net earnings adjustment for interestonconvertiblenotes,netoftax – – 2net earnings, as adjusted 2,010 1,783 2,197 less: net earnings allocable to participating securities (17) (13) (11)Net earnings allocable to common shares $1,993 $1,770 $2,186 weighted-average common shares outstanding 1,401 1,462 1,457 Dilutive effect of non-participating share-based awards 2 2 3 Dilutive effect of convertible notes – – 8 weighted-average common shares, as adjusted 1,403 1,464 1,468 Diluted earnings per common share $ 1.42 $ 1.21 $ 1.49
stock options to purchase 19.8 million, 21.4 million and 19.1 million shares of common stock for 2010, 2009 and 2008, respectively, were excludedfromthecomputationofdilutedearningspercommonsharebecause their effect would have been anti-dilutive.
NOTE 12 LEASES the company leases facilities and land for certain facilities under agreements with original terms generally of 20 years. the leases generallycontainprovisionsforfourtosixrenewaloptionsoffiveyears each. some lease agreements also provide for contingent rentalsbasedonsalesperformanceinexcessofspecifiedminimumsorchangesintheconsumerpriceindex.Contingentrentalswerenotsignificant for any of the periods presented. the company subleases certain properties that are not used in its operations. sublease income was not significant for any of the periods presented. the future minimum rental payments required under operating leases and capitalized lease obligations having initial or remaining non-cancelableleasetermsinexcessofoneyeararesummarizedasfollows:
capitalized (in millions) operating lease fiscal year leases obligations total
2011 $ 418 $ 68 $ 4862012 416 69 4852013 410 69 4792014 399 64 4632015 392 54 446later years 3,973 302 4,275Total minimum lease payments $6,008 $ 626 $6,634less amount representing interest (273)Present value of minimum lease payments 353less current maturities (35)Present value of minimum lease payments, less current maturities $ 318
Rentalexpensesunderoperatingleaseswere$402million,$410millionand$399millionin2010,2009and2008,respectively,andwererecognizedinSG&Aexpense.
NOTE 13 COMMITMENTS AND CONTINGENCIES
the company is a defendant in legal proceedings considered to be in the normal course of business, none of which, individually or collectively,areexpectedtobematerialtotheCompany’sfinancialstatements. in evaluating liabilities associated with its various legal proceedings, the company has accrued for probable liabilities associated with these matters. the amounts accrued were not material to the company’s consolidated financial statements in any of the years presented. Reasonably possible losses for any of the individual legal proceedings which have not been accrued were not material to the company’s consolidated financial statements.

46 LOWE’S 2010 AnnuAL REpORt
as of January 28, 2011, the company had non-cancelable commitmentsof$633millionrelatedtocertainmarketingand information technology programs, and purchases of merchandise inventory. payments under these commitments are scheduled to bemadeasfollows:2011,$386million;2012,$175million;2013,$61million;2014,$9million;2015,$1million;thereafter,$1million. the company held standby and documentary letters of credit issuedunderbankingarrangementswhichtotaled$19millionasofJanuary 28, 2011. the majority of the company’s letters of credits were issued for real estate and construction contracts. payments under these arrangements are scheduled to be made as follows: 2011,$18million;2012,$1million.Commitmentfeesrangingfrom.225% to 1.000% per annum are paid on the letters of credit amounts outstanding. During 2009, the company entered into a joint venture agreement with australian retailer woolworths limited, to develop a chain of home improvement stores in australia. under the agreement, the company committedtocontribute$400milliontothejointventure,ofwhichitisaone-thirdowner.Thecontributionsareexpectedtoberelativelyconsistent over a four-year period. as of January 28, 2011 the Companyhascontributedapproximately$140million.
NOTE 14 rELATED PArTIES Abrother-in-lawoftheCompany’sExecutiveVicePresidentofBusinessDevelopment is a senior officer and shareholder of a vendor that provides millwork and other building products to the company. the company purchased products from this vendor in the amount of $82million,$86millionand$92millionfor2010,2009and2008,respectively. amounts payable to this vendor were insignificant at January 28, 2011 and January 29, 2010.
NOTE 15 OThEr INFOrMATIONNetinterestexpenseiscomprisedofthefollowing:
(in millions) 2010 2009 2008
Long-termdebt $312 $293 $292short-term borrowings – 2 11 capitalized lease obligations 35 32 31 interest income (12) (17) (40)interest capitalized (14) (19) (36)Interestontaxuncertainties 7 (9) 10other 4 5 12 Interest – net $332 $287 $280
Supplementaldisclosuresofcashflowinformation:
(in millions) 2010 2009 2008
cash paid for interest, netofamountcapitalized $ 319 $ 314 $ 309Cashpaidforincometaxes,net $1,590 $1,157 $1,138non-cash investing and financing activities:non-cash property acquisitions, including assets acquired undercapitallease $ 56 $ 69 $ 124change in equity method investments $ (4) $ (4) $ (15)conversions of long-term debttoequity $ – $ – $ 1cash dividends declared butnotpaid $ 148 $ 131 $ –
sales by product category:
(Dollars in millions) 2010 2009 2008product total total total category sales % sales % sales %
Appliances $ 5,365 11% $ 4,904 10% $ 4,752 10%lumber 3,402 7 3,242 7 3,506 7 paint 3,003 6 2,913 6 2,791 6 Millwork 2,884 6 2,786 6 2,965 6 building materials 2,879 6 2,924 6 2,966 6Lawn&landscape products 2,812 6 2,690 6 2,585 5flooring 2,779 6 2,765 6 2,879 6Rough plumbing 2,709 6 2,659 6 2,618 6seasonal living 2,654 5 2,413 5 2,449 5tools 2,604 5 2,439 5 2,563 5hardware 2,526 5 2,497 5 2,516 5 fashion plumbing 2,433 5 2,475 5 2,573 5lighting 2,396 5 2,407 5 2,508 5nursery 1,962 4 1,942 4 1,850 4outdoor power equipment 1,932 4 1,834 4 1,963 4Cabinets& countertops 1,700 3 1,715 4 1,935 4home organization 1,695 3 1,662 3 1,662 4Rough electrical 1,409 3 1,316 3 1,446 3home fashion 1,337 3 1,309 3 1,408 3
other 334 1 328 1 295 1Totals $ 48,815 100% $ 47,220 100% $ 48,230 100%

LOWE’S 2010 AnnuAL REpORt 47
alabama 39alaska 6arizona 32arkansas 20california 109colorado 28connecticut 16Delaware 10florida 118georgia 64hawaii 3idaho 8
illinois 41indiana 44iowa 11kansas 11kentucky 42louisiana 32Maine 13Maryland 29Massachusetts 28Michigan 48Minnesota 13Mississippi 24
Missouri 45Montana 5nebraska 5nevada 17new hampshire 16new Jersey 40NewMexico 13new york 66north carolina 111north Dakota 3ohio 83oklahoma 29
oregon 13pennsylvania 79Rhode island 6south carolina 48south Dakota 3tennessee 60Texas 141utah 16vermont 2virginia 68washington 37west virginia 18
wisconsin 9wyoming 1
total u.s. stores 1,723alberta, can 2ontario, can 22
total can stores 24nuevo leon, MX 2
Total Stores 1,749
lowe’s coMpanies, inc. selecteD financial Data (unaudited)
Lowe’s Stores by State and Province(As of January 28, 2011)
Selected Statement of Earnings Data(Inmillions,exceptpersharedata) 2010 2009 2008 2007 2006
Netsales $48,815 $47,220 $48,230 $48,283 $46,927
gross margin 17,152 16,463 16,501 16,727 16,198
net earnings 2,010 1,783 2,195 2,809 3,105
basic earnings per common share 1.42 1.21 1.50 1.89 2.02
Diluted earnings per common share 1.42 1.21 1.49 1.86 1.98
Dividendspershare $ 0.420 $ 0.355 $ 0.335 $ 0.290 $ 0.180
Selected Balance Sheet DataTotalassets $33,699 $33,005 $32,625 $30,816 $27,726Long-termdebt,excludingcurrentmaturities $ 6,537 $ 4,528 $ 5,039 $ 5,576 $ 4,325
Selected Quarterly Data(Inmillions,exceptpersharedata) first second third fourth
2010
Netsales $12,388 $14,361 $11,587 $10,480
gross margin 4,358 5,006 4,061 3,726
net earnings 489 832 404 285
basic earnings per common share 0.34 0.58 0.29 0.21
Dilutedearningspercommonshare $ 0.34 $ 0.58 $ 0.29 $ 0.21
first second third fourth
2009
Netsales $11,832 $13,844 $11,375 $10,168
gross margin 4,196 4,823 3,890 3,554
net earnings 476 759 344 205
basic earnings per common share 0.32 0.51 0.23 0.14
Diluted earnings per common share $ 0.32 $ 0.51 $ 0.23 $ 0.14
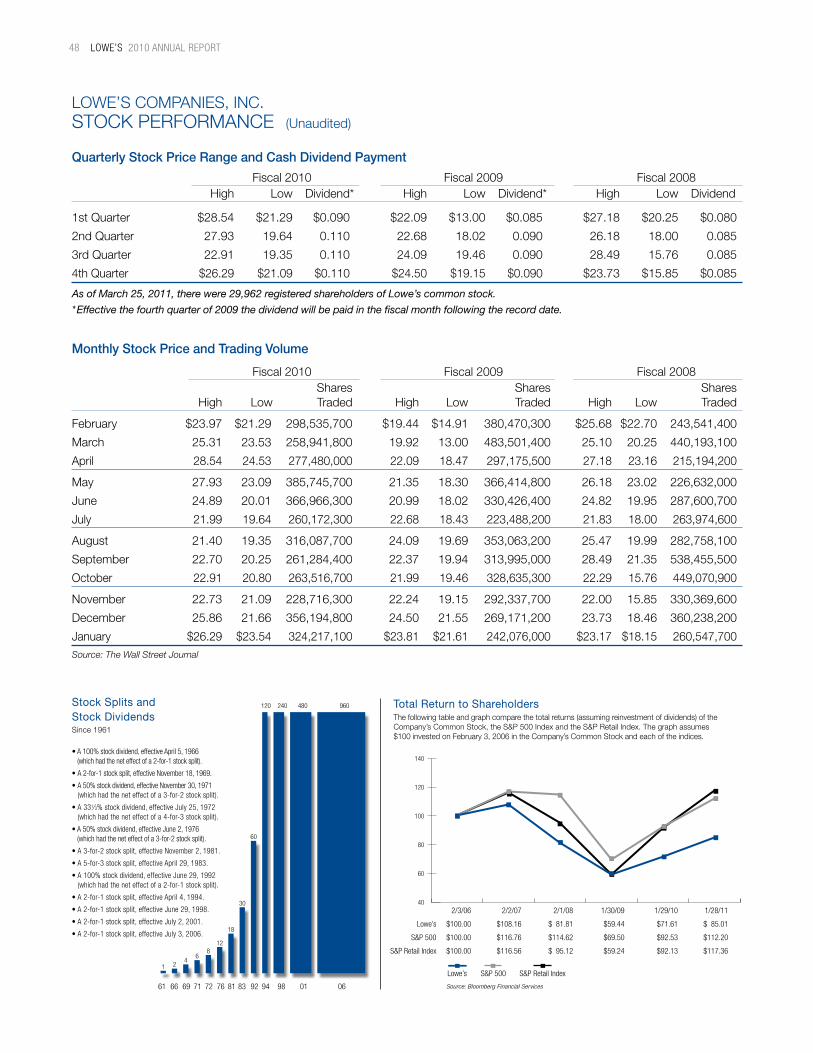
48 LOWE’S 2010 AnnuAL REpORt
lowe’s coMpanies, inc. stock peRfoRMance (unaudited)
Quarterly Stock Price Range and Cash Dividend Payment
fiscal 2010 fiscal 2009 fiscal 2008 high low Dividend* high low Dividend* high low Dividend
1stQuarter $28.54 $21.29 $0.090 $22.09 $13.00 $0.085 $27.18 $20.25 $0.080
2nd quarter 27.93 19.64 0.110 22.68 18.02 0.090 26.18 18.00 0.085
3rd quarter 22.91 19.35 0.110 24.09 19.46 0.090 28.49 15.76 0.085
4thQuarter $26.29 $21.09 $0.110 $24.50 $19.15 $0.090 $23.73 $15.85 $0.085
As of March 25, 2011, there were 29,962 registered shareholders of Lowe’s common stock.
* Effective the fourth quarter of 2009 the dividend will be paid in the fiscal month following the record date.
Monthly Stock Price and Trading Volume
fiscal 2010 fiscal 2009 fiscal 2008 shares shares shares high low traded high low traded high low traded
February $23.97 $21.29 298,535,700 $19.44 $14.91 380,470,300 $25.68 $22.70 243,541,400
March 25.31 23.53 258,941,800 19.92 13.00 483,501,400 25.10 20.25 440,193,100
april 28.54 24.53 277,480,000 22.09 18.47 297,175,500 27.18 23.16 215,194,200
May 27.93 23.09 385,745,700 21.35 18.30 366,414,800 26.18 23.02 226,632,000
June 24.89 20.01 366,966,300 20.99 18.02 330,426,400 24.82 19.95 287,600,700
July 21.99 19.64 260,172,300 22.68 18.43 223,488,200 21.83 18.00 263,974,600
august 21.40 19.35 316,087,700 24.09 19.69 353,063,200 25.47 19.99 282,758,100
september 22.70 20.25 261,284,400 22.37 19.94 313,995,000 28.49 21.35 538,455,500
october 22.91 20.80 263,516,700 21.99 19.46 328,635,300 22.29 15.76 449,070,900
november 22.73 21.09 228,716,300 22.24 19.15 292,337,700 22.00 15.85 330,369,600
December 25.86 21.66 356,194,800 24.50 21.55 269,171,200 23.73 18.46 360,238,200
January $26.29 $23.54 324,217,100 $23.81 $21.61 242,076,000 $23.17 $18.15 260,547,700Source: The Wall Street Journal
Stock Splits and Stock Dividendssince 1961
• A 100% stock dividend, effective April 5, 1966 (which had the net effect of a 2-for-1 stock split).
• A 2-for-1 stock split, effective November 18, 1969.
• A 50% stock dividend, effective November 30, 1971 (which had the net effect of a 3-for-2 stock split).
• A 331⁄3% stock dividend, effective July 25, 1972 (which had the net effect of a 4-for-3 stock split).
• A 50% stock dividend, effective June 2, 1976 (which had the net effect of a 3-for-2 stock split).
• A 3-for-2 stock split, effective November 2, 1981.
• A 5-for-3 stock split, effective April 29, 1983.
• A 100% stock dividend, effective June 29, 1992 (which had the net effect of a 2-for-1 stock split).
• A 2-for-1 stock split, effective April 4, 1994.
• A 2-for-1 stock split, effective June 29, 1998.
• A 2-for-1 stock split, effective July 2, 2001.
• A 2-for-1 stock split, effective July 3, 2006.
Total return to Shareholdersthe following table and graph compare the total returns (assuming reinvestment of dividends) of the Company’sCommonStock,theS&P500IndexandtheS&PRetailIndex.Thegraphassumes $100investedonFebruary3,2006intheCompany’sCommonStockandeachoftheindices.
2/2/07
$108.16
$116.76
$116.56
2/1/08
$ 81.81
$114.62
$ 95.12
1/29/10
$71.61
$92.53
$92.13
1/28/11
$ 85.01
$112.20
$117.36
2/3/06
$100.00
$100.00
$100.00
1/30/09
$59.44
$69.50
$59.24
Lowe’s
S&P 500
S&P Retail Index
Source: Bloomberg Financial Services
S&P 500Lowe’s S&P Retail Index
40
60
80
100
120
140
61
480240
1 24
68
12
18
30
60
120 960
060198949283817672716966
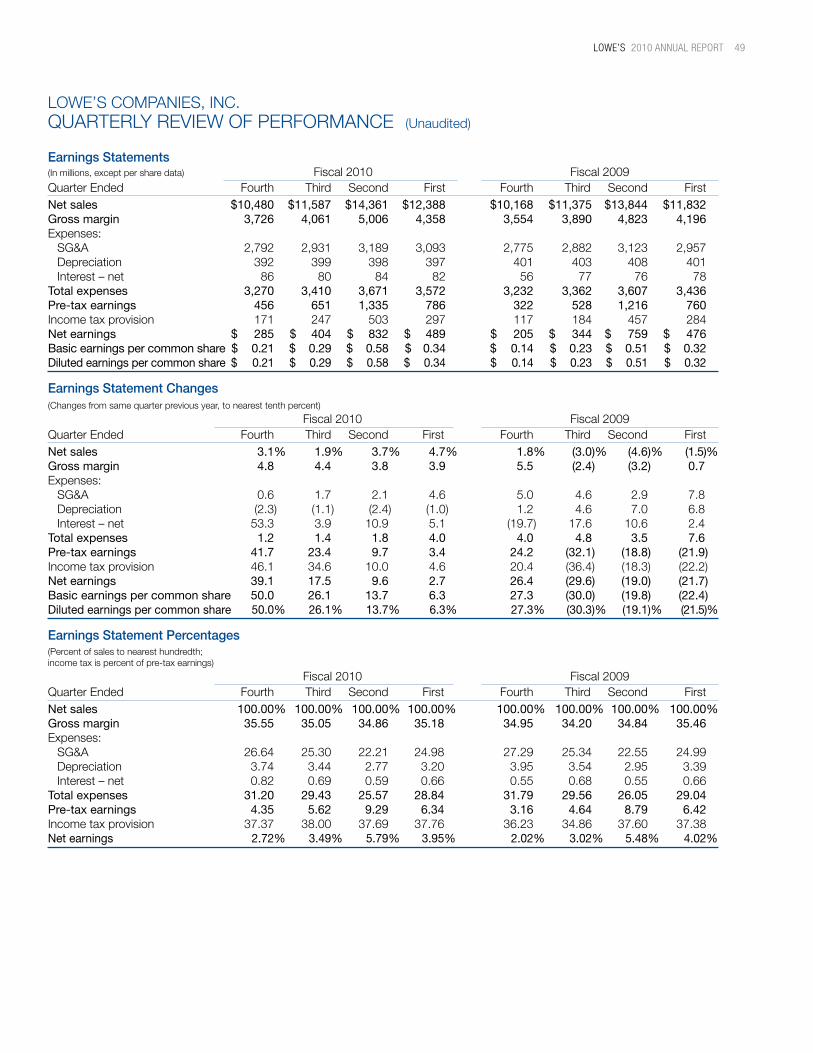
LOWE’S 2010 AnnuAL REpORt 49
Earnings Statements(Inmillions,exceptpersharedata) fiscal 2010 fiscal 2009quarter ended fourth third second first fourth third second firstNet sales $10,480 $11,587 $14,361 $12,388 $10,168 $11,375 $13,844 $11,832Gross margin 3,726 4,061 5,006 4,358 3,554 3,890 4,823 4,196Expenses: SG&A 2,792 2,931 3,189 3,093 2,775 2,882 3,123 2,957 Depreciation 392 399 398 397 401 403 408 401 interest – net 86 80 84 82 56 77 76 78Total expenses 3,270 3,410 3,671 3,572 3,232 3,362 3,607 3,436Pre-tax earnings 456 651 1,335 786 322 528 1,216 760Incometaxprovision 171 247 503 297 117 184 457 284Net earnings $ 285 $ 404 $ 832 $ 489 $ 205 $ 344 $ 759 $ 476Basic earnings per common share $ 0.21 $ 0.29 $ 0.58 $ 0.34 $ 0.14 $ 0.23 $ 0.51 $ 0.32Diluted earnings per common share $ 0.21 $ 0.29 $ 0.58 $ 0.34 $ 0.14 $ 0.23 $ 0.51 $ 0.32
Earnings Statement Changes(changes from same quarter previous year, to nearest tenth percent)
fiscal 2010 fiscal 2009quarter ended fourth third second first fourth third second firstNet sales 3.1% 1.9% 3.7% 4.7% 1.8% (3.0)% (4.6)% (1.5)%Gross margin 4.8 4.4 3.8 3.9 5.5 (2.4) (3.2) 0.7Expenses: SG&A 0.6 1.7 2.1 4.6 5.0 4.6 2.9 7.8 Depreciation (2.3) (1.1) (2.4) (1.0) 1.2 4.6 7.0 6.8 interest – net 53.3 3.9 10.9 5.1 (19.7) 17.6 10.6 2.4Total expenses 1.2 1.4 1.8 4.0 4.0 4.8 3.5 7.6Pre-tax earnings 41.7 23.4 9.7 3.4 24.2 (32.1) (18.8) (21.9)Incometaxprovision 46.1 34.6 10.0 4.6 20.4 (36.4) (18.3) (22.2)Net earnings 39.1 17.5 9.6 2.7 26.4 (29.6) (19.0) (21.7)Basic earnings per common share 50.0 26.1 13.7 6.3 27.3 (30.0) (19.8) (22.4)Diluted earnings per common share 50.0% 26.1% 13.7% 6.3% 27.3% (30.3)% (19.1)% (21.5)%
Earnings Statement Percentages(percent of sales to nearest hundredth; incometaxispercentofpre-taxearnings)
fiscal 2010 fiscal 2009quarter ended fourth third second first fourth third second firstNet sales 100.00% 100.00% 100.00% 100.00% 100.00% 100.00% 100.00% 100.00%Gross margin 35.55 35.05 34.86 35.18 34.95 34.20 34.84 35.46Expenses: SG&A 26.64 25.30 22.21 24.98 27.29 25.34 22.55 24.99 Depreciation 3.74 3.44 2.77 3.20 3.95 3.54 2.95 3.39 interest – net 0.82 0.69 0.59 0.66 0.55 0.68 0.55 0.66Total expenses 31.20 29.43 25.57 28.84 31.79 29.56 26.05 29.04Pre-tax earnings 4.35 5.62 9.29 6.34 3.16 4.64 8.79 6.42Incometaxprovision 37.37 38.00 37.69 37.76 36.23 34.86 37.60 37.38Net earnings 2.72% 3.49% 5.79% 3.95% 2.02% 3.02% 5.48% 4.02%
lowe’s coMpanies, inc. quaRteRly Review of peRfoRMance (unaudited)
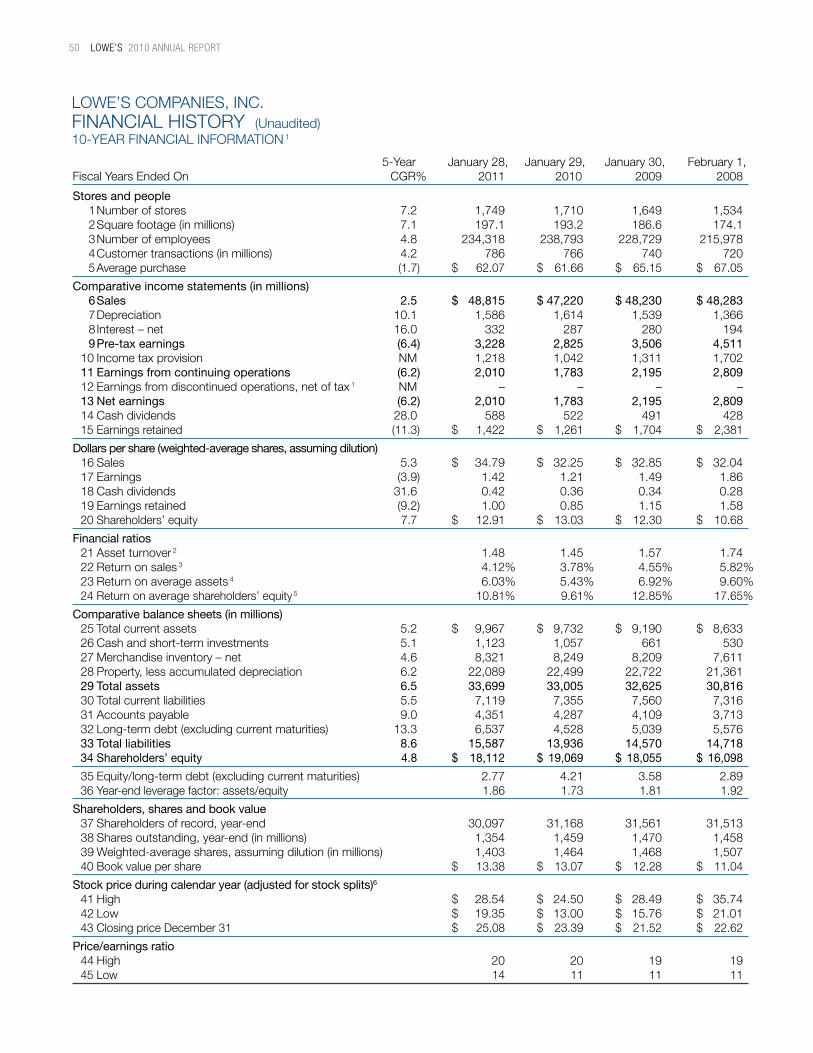
50 LOWE’S 2010 AnnuAL REpORt
lowe’s coMpanies, inc. financial histoRy (unaudited)10-yeaR financial infoRMation 1
5-year January 28, January 29, January 30, february 1, february 2, february 3, January 28, January 30, January 31, february 1,fiscal years ended on cgR% 2011 2010 2009 2008 2007 2006* 2005 2004 2003 2002
Stores and people 1 number of stores 7.2 1,749 1,710 1,649 1,534 1 1,385 1,234 1,087 952 828 718 1 2 square footage (in millions) 7.1 197.1 193.2 186.6 174.1 2 157.1 140.1 123.7 108.8 94.7 80.7 2 3 number of employees 4.8 234,318 238,793 228,729 215,978 3 210,142 185,314 161,964 147,052 120,692 107,404 3 4 customer transactions (in millions) 4.2 786 766 740 720 4 680 639 575 521 460 394 4 5Averagepurchase (1.7) $ 62.07 $ 61.66 $ 65.15 $ 67.05 5 $ 68.98 $ 67.67 $ 63.43 $ 59.21 $ 56.80 $ 55.05 5
Comparative income statements (in millions) 6 Sales 2.5 $ 48,815 $ 47,220 $ 48,230 $ 48,283 6 $ 46,927 $ 43,243 $ 36,464 $ 30,838 $ 26,112 $ 21,714 6 7 Depreciation 10.1 1,586 1,614 1,539 1,366 7 1,162 980 859 739 617 509 7 8 interest – net 16.0 332 287 280 194 8 154 158 176 180 182 174 8 9 Pre-tax earnings (6.4) 3,228 2,825 3,506 4,511 9 4,998 4,496 3,520 2,908 2,362 1,535 9 10Incometaxprovision NM 1,218 1,042 1,311 1,702 10 1,893 1,731 1,353 1,101 889 566 10 11 Earnings from continuing operations (6.2) 2,010 1,783 2,195 2,809 11 3,105 2,765 2,167 1,807 1,473 969 11 12Earningsfromdiscontinuedoperations,netoftax1 nM – – – – 12 – – – 15 12 13 12 13 Net earnings (6.2) 2,010 1,783 2,195 2,809 13 3,105 2,765 2,167 1,822 1,485 982 13 14 cash dividends 28.0 588 522 491 428 14 276 171 116 87 66 60 14 15Earningsretained (11.3) $ 1,422 $ 1,261 $ 1,704 $ 2,381 15 $ 2,829 $ 2,594 $ 2,051 $ 1,735 $ 1,419 $ 922 15
Dollars per share (weighted-average shares, assuming dilution) 16Sales 5.3 $ 34.79 $ 32.25 $ 32.85 $ 32.04 16 $ 30.00 $ 26.91 $ 22.55 $ 18.91 $ 16.12 $ 13.49 16 17 earnings (3.9) 1.42 1.21 1.49 1.86 17 1.98 1.73 1.35 1.13 0.93 0.62 17 18 cash dividends 31.6 0.42 0.36 0.34 0.28 18 0.18 0.11 0.08 0.06 0.04 0.04 18 19 earnings retained (9.2) 1.00 0.85 1.15 1.58 19 1.80 1.62 1.27 1.07 0.89 0.58 19 20Shareholders’equity 7.7 $ 12.91 $ 13.03 $ 12.30 $ 10.68 20 $ 10.05 $ 8.90 $ 7.11 $ 6.25 $ 5.08 $ 4.09 20
Financial ratios 21 asset turnover 2 1.48 1.45 1.57 1.74 21 1.91 2.05 1.96 1.96 1.93 1.93 21 22 Return on sales 3 4.12% 3.78% 4.55% 5.82% 22 6.62% 6.39% 5.94% 5.91% 5.69% 4.52% 22 23 Return on average assets 4 6.03% 5.43% 6.92% 9.60% 23 11.87% 12.11% 10.91% 10.59% 10.14% 7.92% 23 24 Return on average shareholders’ equity 5 10.81% 9.61% 12.85% 17.65% 24 20.69% 21.44% 19.99% 19.79% 20.05% 16.33% 24
Comparative balance sheets (in millions) 25Totalcurrentassets 5.2 $ 9,967 $ 9,732 $ 9,190 $ 8,633 25 $ 8,273 $ 7,753 $ 6,842 $ 6,418 $ 5,333 $ 4,798 25 26 cash and short-term investments 5.1 1,123 1,057 661 530 26 796 876 813 1,624 1,126 853 26 27 Merchandise inventory – net 4.6 8,321 8,249 8,209 7,611 27 7,144 6,635 5,850 4,482 3,911 3,611 27 28 property, less accumulated depreciation 6.2 22,089 22,499 22,722 21,361 28 18,971 16,354 13,911 11,819 10,245 8,565 28 29 Total assets 6.5 33,699 33,005 32,625 30,816 29 27,726 24,604 21,077 18,647 15,767 13,526 29 30 total current liabilities 5.5 7,119 7,355 7,560 7,316 30 6,108 5,449 5,337 3,908 3,180 2,808 30 31 accounts payable 9.0 4,351 4,287 4,109 3,713 31 3,524 2,832 2,695 2,212 1,791 1,589 31 32Long-termdebt(excludingcurrentmaturities) 13.3 6,537 4,528 5,039 5,576 32 4,325 3,499 3,060 3,678 3,736 3,734 32 33 Total liabilities 8.6 15,587 13,936 14,570 14,718 33 12,001 10,308 9,579 8,459 7,541 6,942 33 34 Shareholders’ equity 4.8 $ 18,112 $ 19,069 $ 18,055 $ 16,098 34 $ 15,725 $ 14,296 $ 11,498 $ 10,188 $ 8,226 $ 6,584 34
35Equity/long-termdebt(excludingcurrentmaturities) 2.77 4.21 3.58 2.89 35 3.64 4.09 3.76 2.77 2.20 1.76 35 36 year-end leverage factor: assets/equity 1.86 1.73 1.81 1.92 36 1.76 1.72 1.83 1.83 1.92 2.05 36
Shareholders, shares and book value 37 shareholders of record, year-end 30,097 31,168 31,561 31,513 37 29,439 27,427 27,071 26,553 25,405 19,277 37 38 shares outstanding, year-end (in millions) 1,354 1,459 1,470 1,458 38 1,525 1,568 1,548 1,575 1,564 1,551 38 39 weighted-average shares, assuming dilution (in millions) 1,403 1,464 1,468 1,507 39 1,564 1,607 1,617 1,631 1,620 1,610 39 40Bookvaluepershare $ 13.38 $ 13.07 $ 12.28 $ 11.04 40 $ 10.31 $ 9.12 $ 7.43 $ 6.47 $ 5.26 $ 4.25 40
Stock price during calendar year (adjusted for stock splits)6
41High $ 28.54 $ 24.50 $ 28.49 $ 35.74 41 $ 34.83 $ 34.85 $ 30.27 $ 30.21 $ 25.00 $ 24.44 41 42Low $ 19.35 $ 13.00 $ 15.76 $ 21.01 42 $ 26.15 $ 25.36 $ 22.95 $ 16.69 $ 16.25 $ 12.40 42 43ClosingpriceDecember31 $ 25.08 $ 23.39 $ 21.52 $ 22.62 43 $ 31.15 $ 33.33 $ 28.80 $ 27.70 $ 18.75 $ 23.21 43
Price/earnings ratio 44 high 20 20 19 19 44 17 20 22 27 27 40 44 45 low 14 11 11 11 45 13 15 17 15 17 20 45

LOWE’S 2010 AnnuAL REpORt 51
5-year January 28, January 29, January 30, february 1, february 2, february 3, January 28, January 30, January 31, february 1,fiscal years ended on cgR% 2011 2010 2009 2008 2007 2006* 2005 2004 2003 2002
Stores and people 1 number of stores 7.2 1,749 1,710 1,649 1,534 1 1,385 1,234 1,087 952 828 718 1 2 square footage (in millions) 7.1 197.1 193.2 186.6 174.1 2 157.1 140.1 123.7 108.8 94.7 80.7 2 3 number of employees 4.8 234,318 238,793 228,729 215,978 3 210,142 185,314 161,964 147,052 120,692 107,404 3 4 customer transactions (in millions) 4.2 786 766 740 720 4 680 639 575 521 460 394 4 5Averagepurchase (1.7) $ 62.07 $ 61.66 $ 65.15 $ 67.05 5 $ 68.98 $ 67.67 $ 63.43 $ 59.21 $ 56.80 $ 55.05 5
Comparative income statements (in millions) 6 Sales 2.5 $ 48,815 $ 47,220 $ 48,230 $ 48,283 6 $ 46,927 $ 43,243 $ 36,464 $ 30,838 $ 26,112 $ 21,714 6 7 Depreciation 10.1 1,586 1,614 1,539 1,366 7 1,162 980 859 739 617 509 7 8 interest – net 16.0 332 287 280 194 8 154 158 176 180 182 174 8 9 Pre-tax earnings (6.4) 3,228 2,825 3,506 4,511 9 4,998 4,496 3,520 2,908 2,362 1,535 9 10Incometaxprovision NM 1,218 1,042 1,311 1,702 10 1,893 1,731 1,353 1,101 889 566 10 11 Earnings from continuing operations (6.2) 2,010 1,783 2,195 2,809 11 3,105 2,765 2,167 1,807 1,473 969 11 12Earningsfromdiscontinuedoperations,netoftax1 nM – – – – 12 – – – 15 12 13 12 13 Net earnings (6.2) 2,010 1,783 2,195 2,809 13 3,105 2,765 2,167 1,822 1,485 982 13 14 cash dividends 28.0 588 522 491 428 14 276 171 116 87 66 60 14 15Earningsretained (11.3) $ 1,422 $ 1,261 $ 1,704 $ 2,381 15 $ 2,829 $ 2,594 $ 2,051 $ 1,735 $ 1,419 $ 922 15
Dollars per share (weighted-average shares, assuming dilution) 16Sales 5.3 $ 34.79 $ 32.25 $ 32.85 $ 32.04 16 $ 30.00 $ 26.91 $ 22.55 $ 18.91 $ 16.12 $ 13.49 16 17 earnings (3.9) 1.42 1.21 1.49 1.86 17 1.98 1.73 1.35 1.13 0.93 0.62 17 18 cash dividends 31.6 0.42 0.36 0.34 0.28 18 0.18 0.11 0.08 0.06 0.04 0.04 18 19 earnings retained (9.2) 1.00 0.85 1.15 1.58 19 1.80 1.62 1.27 1.07 0.89 0.58 19 20Shareholders’equity 7.7 $ 12.91 $ 13.03 $ 12.30 $ 10.68 20 $ 10.05 $ 8.90 $ 7.11 $ 6.25 $ 5.08 $ 4.09 20
Financial ratios 21 asset turnover 2 1.48 1.45 1.57 1.74 21 1.91 2.05 1.96 1.96 1.93 1.93 21 22 Return on sales 3 4.12% 3.78% 4.55% 5.82% 22 6.62% 6.39% 5.94% 5.91% 5.69% 4.52% 22 23 Return on average assets 4 6.03% 5.43% 6.92% 9.60% 23 11.87% 12.11% 10.91% 10.59% 10.14% 7.92% 23 24 Return on average shareholders’ equity 5 10.81% 9.61% 12.85% 17.65% 24 20.69% 21.44% 19.99% 19.79% 20.05% 16.33% 24
Comparative balance sheets (in millions) 25Totalcurrentassets 5.2 $ 9,967 $ 9,732 $ 9,190 $ 8,633 25 $ 8,273 $ 7,753 $ 6,842 $ 6,418 $ 5,333 $ 4,798 25 26 cash and short-term investments 5.1 1,123 1,057 661 530 26 796 876 813 1,624 1,126 853 26 27 Merchandise inventory – net 4.6 8,321 8,249 8,209 7,611 27 7,144 6,635 5,850 4,482 3,911 3,611 27 28 property, less accumulated depreciation 6.2 22,089 22,499 22,722 21,361 28 18,971 16,354 13,911 11,819 10,245 8,565 28 29 Total assets 6.5 33,699 33,005 32,625 30,816 29 27,726 24,604 21,077 18,647 15,767 13,526 29 30 total current liabilities 5.5 7,119 7,355 7,560 7,316 30 6,108 5,449 5,337 3,908 3,180 2,808 30 31 accounts payable 9.0 4,351 4,287 4,109 3,713 31 3,524 2,832 2,695 2,212 1,791 1,589 31 32Long-termdebt(excludingcurrentmaturities) 13.3 6,537 4,528 5,039 5,576 32 4,325 3,499 3,060 3,678 3,736 3,734 32 33 Total liabilities 8.6 15,587 13,936 14,570 14,718 33 12,001 10,308 9,579 8,459 7,541 6,942 33 34 Shareholders’ equity 4.8 $ 18,112 $ 19,069 $ 18,055 $ 16,098 34 $ 15,725 $ 14,296 $ 11,498 $ 10,188 $ 8,226 $ 6,584 34
35Equity/long-termdebt(excludingcurrentmaturities) 2.77 4.21 3.58 2.89 35 3.64 4.09 3.76 2.77 2.20 1.76 35 36 year-end leverage factor: assets/equity 1.86 1.73 1.81 1.92 36 1.76 1.72 1.83 1.83 1.92 2.05 36
Shareholders, shares and book value 37 shareholders of record, year-end 30,097 31,168 31,561 31,513 37 29,439 27,427 27,071 26,553 25,405 19,277 37 38 shares outstanding, year-end (in millions) 1,354 1,459 1,470 1,458 38 1,525 1,568 1,548 1,575 1,564 1,551 38 39 weighted-average shares, assuming dilution (in millions) 1,403 1,464 1,468 1,507 39 1,564 1,607 1,617 1,631 1,620 1,610 39 40Bookvaluepershare $ 13.38 $ 13.07 $ 12.28 $ 11.04 40 $ 10.31 $ 9.12 $ 7.43 $ 6.47 $ 5.26 $ 4.25 40
Stock price during calendar year (adjusted for stock splits)6
41High $ 28.54 $ 24.50 $ 28.49 $ 35.74 41 $ 34.83 $ 34.85 $ 30.27 $ 30.21 $ 25.00 $ 24.44 41 42Low $ 19.35 $ 13.00 $ 15.76 $ 21.01 42 $ 26.15 $ 25.36 $ 22.95 $ 16.69 $ 16.25 $ 12.40 42 43ClosingpriceDecember31 $ 25.08 $ 23.39 $ 21.52 $ 22.62 43 $ 31.15 $ 33.33 $ 28.80 $ 27.70 $ 18.75 $ 23.21 43
Price/earnings ratio 44 high 20 20 19 19 44 17 20 22 27 27 40 44 45 low 14 11 11 11 45 13 15 17 15 17 20 45
Explanatory Notes: 1 Amounts herein reflect the Contractor
Yards as a discontinued operation. 2 Asset turnover: Sales divided by
Beginning Assets 3 Return on sales: Net Earnings
divided by Sales 4 Return on average assets:
Net Earnings divided by the average of Beginning and Ending Assets
5 Return on Average Shareholders’ Equity: Net Earnings divided by the average of Beginning and Ending Equity
6 Stock price source: the wall street Journal * Fiscal year contained 53 weeks. All other years contained 52 weeks.NM = not meaningfulCGR = compound growth rate

52 LOWE’S 2010 AnnuAL REpORt
lowe’s coMpanies, inc. boaRD of DiRectoRs
lowe’s coMpanies, inc. eXecutive officeRs
Robert a. niblockChairman of the Board and Chief Executive Officer
larry D. stonepresident and Chief Operating Officer
Maureen k. ausuraExecutive Vice president – Human Resources
gregory M. bridgefordExecutive Vice president – Business Development
Michael k. brownExecutive Vice president and Chief Information Officer
Rick D. DamronExecutive Vice president – Store Operations
Robert J. gfeller, Jr.Executive Vice president – Merchandising
Robert f. hull, Jr.Executive Vice president and Chief Financial Officer
gaither M. keener, Jr.Executive Vice president, General Counsel, Secretary and Chief Compliance Officer
Joseph M. Mabry, Jr.Executive Vice president – Logistics and Distribution
Marshall a. croomSenior Vice president and Chief Risk Officer
Matthew v. hollifieldSenior Vice president and Chief Accounting Officer
n. brian peaceSenior Vice president – Corporate Affairs
Janet M. sauraSenior Vice president, Deputy General Counsel and Assistant Secretary
todd i. woodsSenior Vice president, Deputy General Counsel and Assistant Secretary
Robert a. niblock 3*
Chairman of the Board and Chief Executive Officer,Lowe’s Companies, Inc., Mooresville, nC
Raul alvarez1,4
Retired president and Chief Operating Officer,McDonald’s Corporation, Oak Brook, IL
David w . bernauer 1,3, 4*
Lead Director, Lowe’s Companies, Inc., Mooresville, nC;Retired Chairman and Chief Executive Officer,Walgreen Co., Deerfield, IL
leonard l. berry, ph.D. 1, 4
Distinguished professor of Marketing, M.B. Zale Chair in Retailingand Marketing Leadership, and professor of Humanities in Medicine,texas A&M university, College Station, tX
peter c. browning 1, 4
Managing Director,peter C. Browning & Associates, LLC, Charlotte, nC
Dawn e. hudson 2, 4
Vice-Chair,the parthenon Group, Boston, MA
Robert a. ingram 2, 4
Former Vice Chairman pharmaceuticals, GlaxoSmithKline plc,London, uK; non-Executive Chairman, Valeant pharmaceuticals International, Aliso Viejo, CA; non-Executive Chairman, Elan Corporation, plc, Dublin, Ireland
Robert l. Johnson 2, 4
Founder and Chairman,the RLJ Companies, Bethesda, MD
Marshall o. larsen 2*, 3, 4
Chairman, president and Chief Executive Officer,Goodrich Corporation, Charlotte, nC
Richard k. lochridge 2, 4
Retired president,Lochridge & Company, Inc., Boston, MA
stephen f. page 1*, 3, 4
Retired Vice Chairman and Chief Financial Officer,united technologies Corporation, Hartford, Ct
o. temple sloan, Jr. 1, 4
Chairman, General parts International, Inc., Raleigh, nC;Chairman, Highwoods properties, Inc., Raleigh, nC
committee Membership1 – Audit Committee2 – Compensation Committee3 – Executive Committee4 – Governance Committee* 2010 Committee Chairman

Des
igne
d by
Cor
pora
te R
epor
ts In
c./A
tlant
a, G
A
ww
w.c
orpo
rate
repo
rt.c
om
Business Description Lowe’s Companies, Inc. is a $48.8 billion retailer, offering a complete line of home improvement products and services. The Company, through its subsidiaries, serves approximately 15 million do-it-yourself, do-it-for-me and Commercial Business Customers each week through 1,749 stores in the United States, Canada and Mexico. Founded in 1946 and based in Mooresville, N.C., Lowe’s is the second-largest home improvement retailer in the world and employs more than 234,000 people. Lowe’s has been a publicly held company since October 10, 1961. The Company’s stock is listed on the New York Stock Exchange with shares trading under the symbol LOW. For more information, visit www.Lowes.com.
Lowe’s files reports with the Securities and Exchange Commission (SEC), including annual reports on Form 10-K, quarterly reports on Form 10-Q, current reports on Form 8-K and any other filings required by the SEC.
The reports Lowe’s files with, or furnishes to, the SEC, and all amendments to those reports, are available without charge on Lowe’s website (www.Lowes.com/investor) as soon as reasonably practicable after Lowe’s files them with, or furnishes them to, the SEC.
Copies of lowe’s 2010 annual Report on Form 10-K are available without charge upon written request to gaither M. Keener, Jr., secretary, at lowe’s corporate offices or by calling 888-345-6937.
Additional information available on our website (www.Lowes.com/investor) includes our Corporate Governance Guidelines, Board of Directors Committee Charters, Code of Business Conduct and Ethics, and Social Responsibility Report, as well as other financial information.
Corporate Offices 1000 Lowe’s BoulevardMooresville, NC 28117704-758-1000
Lowe’s Websitewww.Lowes.com
Stock Transfer Agent & Registrar, Dividend Disbursing Agent and Dividend Reinvesting AgentComputershare Trust Company N.A. P.O. Box 43078 Providence, RI 02940
For direct deposit of dividends, registered shareholders may call Computershare toll-free at 877-282-1174.
Registered shareholders with e-mail addresses can send account inquiries electronically to Computershare through its website at www.computershare.com/investor and clicking on Contact Us.
Registered shareholders may access their accounts online by visiting Investor Centre at www.computershare.com/investor.
Investors can join Lowe’s Stock Advantage Direct Stock Purchase Plan by visiting www.Lowes.com/investor, and clicking on Buy Stock Direct.
DividendsLowe’s has declared a cash dividend each quarter since becoming a public company in 1961.
Dividend record dates are usually the third week of fiscal April, July, October and January.
Dividend payment dates are usually the first week of fiscal May, August, November and February.
Annual Meeting DateMay 27, 2011 at 10:00 a.m. Ballantyne Hotel Charlotte, North Carolina
Stock Trading Information Lowe’s common stock is listed on the New York Stock Exchange (LOW)
General CounselGaither M. Keener, Jr. Executive Vice President, General Counsel, Secretary and Chief Compliance Officer 704-758-1000
Independent Registered Public Accounting Firm Deloitte & Touche LLP550 South Tryon StreetSuite 2500Charlotte, NC 28202-4211704-887-1500
Shareholder ServicesShareholders’ and security analysts’ inquiries should be directed to:
Tiffany MasonVice President, Investor Relations 704-758-2033
For copies of financial information: 888-34LOWES (888-345-6937) or visit www.Lowes.com/investor
Public RelationsMedia inquiries should be directed to: Chris Ahearn Vice President, Public Relations 704-758-2304 Media.Lowes.com
To view Lowe’s Social Responsibility Report, visit www.Lowes.com/socialresponsibility.
This report is printed on paper containing fiber from well-managed, independently certified forests and contains a minimum of 10% post-consumer recycled fiber. To further reduce resource use, Lowe's is relying on E-proxy rules to make the proxy materials for its 2011 Annual Meeting, including this Annual Report, available online to many of our shareholders instead of mailing hard copies to them. This use of technology has allowed us to reduce the number of copies we print of our Annual Report by approximately 10% from last year. For additional information about Lowe’s commitment to sustainable forest management, visit: www.Lowes.com/woodpolicy.
CORPORATE INFORMATION

LOWE’S COMPANIES, INC.1000 LOWE’S BOULEVARDMOORESVILLE, NC 28117
CONSIDER THE POSSIBILITIES