consolidated annual report - plusplus capital · total operating profit (loss) 1,101,974 428,177...
TRANSCRIPT

CONSOLIDATED ANNUAL REPORT
Beginning of financial year: 1 January 2015 End of financial year: 31 December 2015
Business name: Aktsiaselts PlusPlus Capital
Registry code: 11919806
Street name, house number: Jõe 3 City: Tallinn
County: Harju County Postal code: 10151
Telephone: +372 6827870
E-mail address: [email protected] Website address: www.plusplus.ee

10 0 10 20 20 1 2 1
2
Table of contents Management report 3!Financial statements 4!
Consolidated balance sheet 4!Consolidated income statement 5!Consolidated cash flow statement 6!Consolidated statement of changes in equity 7!Notes to financial statements 8!
Note 1! Accounting policies 8!Note 2! Cash 11!Note 3! Receivables and prepayments 12!Note 4! Taxes prepaid and payable 13!Note 5! Property, plant and equipment 13!Note 6! Intangible assets 14!Note 7! Finance lease 14!Note 8! Loans payable 15!Note 9! Payables and prepayments 16!Note 10! Provisions 16!Note 11! Contingent liabilities and assets 17!Note 12! Share capital 17!Note 13! Sales revenue 17!Note 14! Other operating revenue 17!Note 15! Goods, raw materials and services 18!Note 16! Other operating expenses 18!Note 17! Staff costs 18!Note 18! Interest expenses 18!Note 19! Other financial income and expenses 19!Note 20! Related parties 19!Note 21! Unconsolidated balance sheet 20!Note 22! Unconsolidated income statement 21!Note 23! Unconsolidated cash flow statement 22!Note 24! Unconsolidated statement of changes in equity 23!Note 25! Events after the balance sheet date 23!Note 26! Shares of subsidiaries 24!Note 27 Group structure 25
Signatures to report 26
Sworn auditor’s report 27

10 0 10 20 20 1 2 1
3
Management report
The principal activity of companies that belong to the group of PlusPlus Capital AS is purchasing overdue arrears, restructuring acquired arrears and administration of subsidiaries operating in the field of debt management in all the Baltic countries. PlusPlus Capital AS was established in the first half of 2010 and it has made significant progress in its first years of activity, by participating, either directly or through its subsidiaries, successfully in auction sales of receivables organised by credit institutions and telecommunications operators. As of the end of 2015, the company has purchased assets in the total value of EUR 24 million. The activities have been financed both from the own funds of the company as well as with the help of credit lines opened by banks. The strategic objective of PlusPlus Capital AS is to achieve a position among the three leading companies on the Baltic debt management market and, to this end, extend its activities significantly in terms of both fields and geographically. In the period from 2016 to 2018, the fast growth of the company will continue mostly in Latvia and Lithuania. In order to provide its professional services and implement its plans, PlusPlus Capital AS makes consistent contributions to training its staff and automatisation of processes and uses extensively modern IT solutions. Financial ratios 2015 2014
Sales revenue 1,689,930 1,011,623
Balance sheet total 8,149,619 6,917,686
Current ratio 0.61 0.71
Mirje Trumsi Member of Management Board Karl Mitt Member of Management Board

10 0 10 20 20 1 2 1
4
Financial statements
Consolidated balance sheet (EUR)
31.12.2015 31.12.2014 Note
Assets
Current assets
Cash 51,646 79,171 2
Financial investments 0 2,846
Receivables and prepayments 2,345,087 1,747,948 3;4
Total current assets 2,396,733 1,829,965
Non-current assets
Receivables and prepayments 5,675,921 4,988,190 3
Property, plant and equipment 76,713 93,429 5
Intangible assets 252 6,102 6
Total non-current assets 5,752,886 5,087,721
Total assets 8,149,619 6,917,686
Liabilities and equity
Liabilities
Current liabilities
Loans payable 3,170,412 1,389,724 8
Payables and prepayments 402,721 309,137 9
Provisions 338,463 566,918 10
Total current liabilities 3,911,596 2,265,779
Long-term liabilities
Loans payable 407,238 1,288,153 8
Provisions 559,370 563,236 10
Total long-term liabilities 966,608 1,851,389
Total liabilities 4,878,204 4,117,168
Equity
Equity held by shareholders of parent company
Share capital at nominal value 63,912 63,912 12
Retained earnings (loss) 2,736,606 2,339,289
Annual period profit (loss) 470,897 397,317
Total equity held by shareholders of parent company 3,271,415 2,800,518
Total equity 3,271,415 2,800,518
Total liabilities and equity 8,149,619 6,917,686

10 0 10 20 20 1 2 1
5
Consolidated income statement (EUR)
2015 2014 Note
Sales revenue 1,689,930 1,011,623 13
Other operating revenue 389,269 178,319 14
Goods, raw materials and services -449,991 -356,555 15
Other operating expenses -249,884 -171,014 16
Staff costs -241,284 -198,130 17
Depreciation and impairment of non-current assets -36,066 -36,066 5;6
Total operating profit (loss) 1,101,974 428,177
Interest expenses -487,613 -263,216 18
Other financial income and expenses -143,464 232,356 19
Profit (loss) before income tax 470,897 397,317
Annual period profit (loss) 470,897 397,317
Share of profit (loss) attributable to shareholder of parent company
470,897 397,317

10 0 10 20 20 1 2 1
6
Consolidated cash flow statement (EUR)
2015 2014 Note
Cash flows from operating activities
Operating profit (loss) 1,101,974 428,177
Adjustments
Depreciation and impairment of non-current assets 36,066 36,066 5;6
Other adjustments 0 259,309
Total adjustments 36,066 295,375
Change in receivables and prepayments related to operating activities
-1,245,316 -625,634
Change in payables and prepayments related to operating activities
-256,214 -70,589
Interest received 26 51
Total cash flows from operating activities -363,464 27,380
Cash flows from investing activities
Purchase of investment properties -13,500 -13,500 5
Proceeds from sales of other financial investments 2,846 0
Loans given 0 -49,600
Total cash flows from investing activities -10,654 -63,100
Cash flows from financing activities
Loans received 2,200,000 882,217
Repayments of loans received -1,267,637 -498,011
Finance lease principal amount repayments -23,893 -21,253
Interest paid -407,203 -246,318
Other payments from financing activities -154,674 -40,929
Total cash flows from financing activities 346,593 75,706
Total cash flows -27,525 39,986
Cash and cash equivalents at beginning of period 79,171 39,185 2
Change in cash and cash equivalents -27,525 39,986
Cash and cash equivalents at end of period 51,646 79,171 2

10 0 10 20 20 1 2 1
7
Consolidated statement of changes in equity (EUR)
Equity held by shareholders of parent company
Share capital at nominal value
Retained earnings (loss)
Total
31.12.2013 63,912 2,339,289 2,403,201
Annual period profit (loss)
397,317 397,317
31.12.2014 63,912 2,736,606 2,800,518
Annual period profit (loss)
470,897 470,897
31.12.2015 63,912 3,207,503 3,271,415
Additional information about share capital is set out in Note 12.

10 0 10 20 20 1 2 1
8
Notes to financial statements
Note 1 Accounting policies
General information
The consolidated financial statements of AS PlusPlus Capital for 2015 have been prepared in compliance with the accounting principles generally accepted in the Republic of Estonia. The basic requirements of the generally accepted accounting principles have been established in the Accounting Act of the Republic of Estonia and are supplemented by the guidelines issued by the Estonian Accounting Standards Board.
The consolidated financial statements have been prepared using the acquisition cost principle, unless otherwise indicated in the accounting policies below.
The consolidated financial statements have been prepared in euro.
The 2015 consolidated financial statements include financial indicators of AS PlusPlus Capital (parent company) and its subsidiaries PlusPlus Baltic OÜ, PPC Delta OÜ, PPC Beeta OÜ, PlusPlus Inkasso OÜ, VõlaKütid OÜ, PlusPlus Inkasso SIA, PlusPlus Inkasso UAB, PlusPlus Baltic Latvian Branch and PlusPlus Baltic Lithuanian Branch (the group structure is set out in Note 27).
Preparation of consolidated statements
The financial indicators of all subsidiaries (except for subsidiaries acquired for resale) controlled by the parent company are consolidated on a line-by-line basis in the consolidated statements. All intra-group receivables and payables, transactions between the companies of the group and the unrealised profits and losses, which have arisen as a result thereof, have been eliminated.
The accounting policies of subsidiaries have been brought into conformity with the accounting policies of the group, where necessary.
Subsidiaries
Subsidiaries are companies controlled by the parent company. A subsidiary is deemed to be controlled by the parent company if the group holds over 50% of the voting shares in the subsidiary either directly or indirectly, or is otherwise capable of controlling the operating or financial policies of the subsidiary.
The acquisition of a subsidiary is recognised by using the purchase method (except in case of business combinations under joint control which are recognised by using the adjusted purchase method).
As from the date of acquisition, the group’s share in the acquired company’s assets, liabilities and contingent liabilities, and the accrued goodwill are recognised in the consolidated balance sheet and the share in the revenue and expenditure of the acquired company is recognised in the consolidated income statement.
Unconsolidated statements of the parent company presented in the notes to the consolidated statements
Pursuant to the Accounting Act of Estonia, the primary unconsolidated statements of the consolidating entity (parent company) must be separately presented in the notes to the consolidated financial statements. The primary statements of the parent company have been prepared following the same accounting policies as applied upon the preparation of the consolidated financial statements with the exception of investments in subsidiaries and associates that have been recognised in the unconsolidated statements at the acquisition cost.
Financial assets
Purchases and sales of financial assets are recognised at the date of the transaction.
Securities held for trading (shares, bonds, debenture bonds, fund units, etc.) are recognised as short-term financial investments. Securities (shares, bonds, debenture bonds, fund units, etc.) that will probably not be sold within the next twelve months (except for investments in subsidiaries and associates) are recognised as long-term financial investments (other long-term shares and securities).
Short-term and long-term financial investments in shares and other equity instruments (except for such participating interests in subsidiaries and associates which are recognised using the consolidation or equity method) are recognised at the fair value if this can be reliably evaluated. The basis for the fair value is the listed market price of the financial instrument. Shares and other equity instruments whose fair value cannot be reliably evaluated are recognised at the acquisition cost (less possible write-downs if the recoverable amount of the investment has fallen below the book value).
Changes in the fair value of the financial assets acquired for trading are recognised as profit or loss in the income statement of the accounting period.

10 0 10 20 20 1 2 1
9
Cash
Cash and cash equivalents include cash in hand recognised in the balance sheet under the cash entry and in the cash flow statement, balances of current accounts and term deposits of up to three months.
Receivables and prepayments
Trade receivables
Short-term receivables incurred by the group in the course of its daily business activities are recognised as trade receivables. Trade receivables are recognised at the adjusted acquisition cost (i.e. nominal value less repayments and any necessary write-downs).
Write-downs of receivables are recognised if there is objective proof that the amounts of all receivables will not be received according to the initial contract terms and conditions of the receivables. The circumstances that refer to possible impairment of receivables are the bankruptcy or serious financial difficulties of the debtor, and their failure to adhere to payment deadlines. Impairment of individually significant receivables (i.e. the need for a write-down) is evaluated separately in terms of each purchaser, the book value is reduced by the write-down amount of doubtful receivables and the loss from the write-down is recognised in the income statement under other operating expenses. The receivable and its write-down are written off the balance sheet if the receivable is deemed to be uncollectible. Collection of doubtful receivables that have previously been written down is recognised as a decrease in the expenses of doubtful receivables.
Other receivables
All other receivables (accrued income, loans given, other short-term and long-term receivables) except receivables acquired for resale are recognised at the adjusted acquisition cost.
The adjusted acquisition cost of short-term receivables generally equals their nominal value (less potential write-downs), due to which short-term receivables are recognised in the balance sheet in the collectible amount. In order to calculate the adjusted acquisition cost of long-term receivables, the long-term receivables are initially registered at the fair value of the amounts to be received, considering the interest income to be gained in future periods, using the internal interest rate method. Receivables acquired for resale are recognised using the fair value method.
All other receivables are recognised consistently from the registration of the receivable until its realisation at fair value. Any changes in the fair value of the receivables are recognised consistently as profit or loss in the income statement of the accounting period. Changes in the fair value of receivables acquired for trading are recognised as profit or loss in the income statement of the accounting period.
DEBT CLAIMS
Debt claims are recognised in the statements as financial assets.
Debt claims are initially registered at their acquisition cost, which is the fair value paid for the claim. The initial acquisition cost includes all of the direct costs related to the acquisition of the claims. Debt claims are recognised in the balance sheet by the fair value method. Upon implementation of the fair value method, a debt claim is recognised in the balance sheet at its fair value, gains/losses on changes in the value are recognised in the income statement of the accounting period.
Upon evaluation of claims to their fair value, the probability of receipt of the claims is taken into account. Claims are evaluated to their fair value according to the evaluation procedure established by the management board of the company.
Property, plant and equipment and intangible assets
Property, plant and equipment are assets that are used in the economic activities of the company within a period of time longer than one year and the acquisition cost of which is equal to or higher than EUR 3,835. Assets with a useful life of less than one year are written off as assets of low value.
If, within the framework of a new project, such assets are acquired whose unit value is less than EUR 3,865, but the set that is formed from the units is equal to or higher than EUR 3,865, it is recognised as non-current assets.
Depreciation is calculated using the straight-line method. Depreciation rates are established separately for each item of non-current assets on the basis of its useful life. In the case of asset items of significant residual value, only the depreciable difference between the acquisition cost and the residual value is depreciated as expenses during the useful life.
If the recoverable amount of non-current assets (i.e. the higher of the following two indicators: the fair value of the assets (less costs to sell) or the value in use of the assets) is less than its carrying amount, the items of property, plant and equipment are written down to their recoverable amount.
Recognition of property, plant and equipment stops when the asset is transferred or in the situation where no economic gains are expected from the use or sale of the asset. Gains and losses from discontinued recognition of property, plant and equipment are recognised in the income statement under other operating revenue or other operating charges.

10 0 10 20 20 1 2 1
10
Items of property, plant and equipment that are highly likely to be sold within the next twelve months are reclassified as non-current assets for resale.
Threshold for recognition of non-current assets EUR 3,865
Leases
Finance lease means a lease where all significant risks and benefits related to the ownership of the asset in question are transferred to the lessee. Other lease contracts are recognised as operating leases.
Company as lessee
Finance lease is recognised in the balance sheet as an asset and liability at the fair value of the leased asset or at the present value of the minimum amount of lease payments, whichever is lower. Lease payments are divided between financial expenses (interest expenses) and reduction of the residual value of the liability. Assets leased under finance lease are depreciated in the same manner as the acquired non-current assets and their depreciation periods are equal to the shorter of the expected useful life of the assets or the lease period. Primary direct expenses incurred by the lessee directly as a result of entry into finance lease contracts are included in the acquisition cost of the leased assets.
Operating lease payments are recognised in the income statement as expenses on a straight-line basis over the lease period.
Financial liabilities
All financial liabilities (trade creditors, loans raised, accrued expenses, bonds issued and other short-term and long-term payables) are initially registered at their acquisition cost, which also includes all the expenses directly associated with the acquisition. Any subsequent recognition takes place pursuant to the adjusted acquisition cost method (except for the financial liabilities acquired for the purpose of resale and derivatives of negative fair value which are recognised at their fair value).
The adjusted acquisition cost of short-term financial liabilities is generally equal to their nominal value, due to which short-term financial liabilities are recognised in the balance sheet in the amounts subject to payment. In order to calculate the adjusted acquisition cost of long-term financial liabilities, they are initially registered at the fair value of the amounts received (less any transaction costs), considering the interest expenses to be incurred on the liabilities in future periods, using the internal interest rate method.
A financial liability is classified as short-term if its payment term is within twelve months after the balance sheet date or if the company does not have the unconditional right to postpone the payment of the obligation for more than twelve months after the balance sheet date.
Loans payable that are due within twelve months of the balance sheet date, but which are refinanced as long-term after the balance sheet date, but before the approval of the annual report, are recognised as current liabilities. Loans payable that the lender had the right to recall on the balance sheet date due to a breach of the terms and conditions provided for in the loan agreement are also recognised as current liabilities.
Provisions and contingent liabilities
The group forms provisions for those liabilities whose realisation term or amount is not certain. Provisions are recognised in the balance sheet on the basis of the estimates of the management about the amount probably required for the provision and the realisation time of the provision. A provision is recognised if, prior to the balance sheet date, the group has incurred liabilities arising from law or the group’s activities, the realisation of the provision in the form of expenditure is likely (more than 50%), and the amount of the provision can be reliably evaluated.
The expenses associated with the realisation of a provision are evaluated as of the balance sheet date and the amount of the provision is evaluated again on each balance sheet date.
Revenue
Accounting of revenue
Revenue from purchase of accounts receivable.
The principal activity of the companies of the group is purchasing debt claims. Revenue or expenses from principal activity arise(s) from the revaluation of receivables to their fair value. The fair value of a debt claim is the amount to be likely received from the debtor.
The fair value of a debt claim is found according to the evaluation procedure established by the management board of the group company. The long-term non-interest bearing portion of purchased claims has been recognised at the present value of the amounts to be received in the future.

10 0 10 20 20 1 2 1
11
Revenue from the sales of a service is recognised after provision of the service.
Note 2 Cash (EUR)
31.12.2015 31.12.2014
Cash at bank 50,375 65,673
Cash en route 0 10,050
Cash in hand 1,271 3,448
Total cash 51,646 79,171

10 0 10 20 20 1 2 1
12
Note 3 Receivables and prepayments (EUR)
Allocation by remaining maturity 31.12.2015
Within 12 months 1-5 years
Note
Trade receivables 7,351 7,351
Accounts receivable 7,351 7,351
Receivables from related parties 203,429 203,429
Tax prepayments and receivables 416 416
4
Prepayments 10,046 10,046
Deferred expenses 46 46
Other prepayments made
10,000 10,000
Portfolios of receivables 7,770,283 2,094,362 5,675,921
Other receivables 29,483 29,483
Total receivables and prepayments 8,021,008 2,345,087 5,675,921
Allocation by remaining maturity 31.12.2014
Within 12 months 1-5 years
Note
Trade receivables 3,976 3,976
Accounts receivable 3,976 3,976
Receivables from related parties 133,946 133,946
Tax prepayments and receivables 15 15
4
Prepayments 133 133
Other prepayments made
133 133
Portfolios of receivables 6,571,830 1,583,640 4,988,190
Other receivables 26,238 26,238
Total receivables and prepayments 6,736,138 1,747,948 4,988,190
The long-term non-interest bearing portion of debt claims has been discounted at the rate of 15% a year.

10 0 10 20 20 1 2 1
13
Note 4 Taxes prepaid and payable (EUR)
31.12.2015 31.12.2014
Prepaid Payable Prepaid Payable
Value added tax 2,074 2,507
Personal income tax 6,507 8,510
Income tax on fringe benefits 2,327 1,026
Social security tax 13,505 15,269
Mandatory funded pension 516 534
Unemployment insurance premium 651 840
Interest 126
Prepayment account balance 416 15
Total taxes prepaid and payable 416 25,580 15 28,812
Note 5 Property, plant and equipment (EUR)
Means of transport
Machinery and equipment
Prepayments
Projects in progress and prepayments
Total
31.12.2013
Acquisition cost 158,882 158,882 7,500 7,500 166,382
Accumulated depreciation -56,237 -56,237 -56,237
Residual cost 102,645 102,645 7,500 7,500 110,145
Acquisitions and additions 13,500 13,500 13,500
Depreciation cost -30,216 -30,216 -30,216
31.12.2014
Acquisition cost 158,882 158,882 21,000 21,000 179,882
Accumulated depreciation -86,453 -86,453 -86,453
Residual cost 72,429 72,429 21,000 21,000 93,429
Acquisitions and additions 13,500 13,500 13,500
Depreciation cost -30,216 -30,216 -30,216
31.12.2015
Acquisition cost 158,882 158,882 34,500 34,500 193,382
Accumulated depreciation -116,669 -116,669 -116,669
Residual cost 42,213 42,213 34,500 34,500 76,713

10 0 10 20 20 1 2 1
14
Note 6 Intangible assets (EUR)
Computer software
Total
31.12.2013
Acquisition cost 29,248 29,248
Accumulated depreciation -17,297 -17,297
Residual cost 11,951 11,951
Depreciation cost -5,849 -5,849
31.12.2014
Acquisition cost 29,248 29,248
Accumulated depreciation -23,146 -23,146
Residual cost 6,102 6,102
Depreciation cost -5,850 -5,850
31.12.2015
Acquisition cost 29,248 29,248
Accumulated depreciation -28,996 -28,996
Residual cost 252 252
Note 7 Finance lease (EUR)
Accounting entity as lessee
Allocation by remaining maturity
31.12.2015
Within 12 months
1-5 years
Interest rate Due date
Finance lease 58,102 22,293 35,809 2.51 + EURIBOR 2017
Total finance lease liabilities 58,102 22,293 35,809
Allocation by remaining maturity
31.12.2014
Within 12 months
1-5 years
Interest rate Due date
Finance lease 78,646 20,484 58,162 2.51% + EURIBOR
2017
Total finance lease liabilities 78,646 20,484 58,162
Carrying amount of leased assets

10 0 10 20 20 1 2 1
15
31.12.2015 31.12.2014
Machinery and equipment 42,213 72,429
Total 42,213 72,429
Note 8 Loans payable (EUR)
31.12.2015 Allocation by remaining maturity
Within 12 months 1-5 years Over 5 years
Long-term loans
Bank loans 1,150,756 1,150,756 0
Other long-term loans 2,368,792 1,997,363 371,429
Total long-term loans 3,519,548 3,148,119 371,429
Total finance lease liabilities 58,102 22,293 35,809
Total loans payable 3,577,650 3,170,412 407,238
31.12.2014 Allocation by remaining maturity
Within 12 months 1-5 years Over 5 years
Long-term loans
Bank loans 1,504,127 339,136 1,164,991
Other long-term loans 1,095,104 1,030,104 65,000
Total long-term loans 2,599,231 1,369,240 1,229,991
Total finance lease liabilities 78,646 20,484 58,162
Total loans payable 2,677,877 1,389,724 1,288,153
Carrying amount of collateral assets
31.12.2015 31.12.2014
Other assets 2,620,000 2,620,000
Total 2,620,000 2,620,000
The management has not disclosed interest rates of the loan in the note due to the confidentiality requirement set out in the loan agreements.
To secure loans payable, a commercial pledge in the amount of EUR 2,620 thousand has been established on the assets of the group companies and a guarantee has been provided in the amount of EUR 2,500 thousand. In addition, the loans received by group companies have been secured by a mortgage on five registered immovables in the total amount of EUR 1,150 thousand and sureties of private persons related to group companies.

10 0 10 20 20 1 2 1
16
Note 9 Payables and prepayments (EUR)
31.12.2015 Within 12 months Note
Trade creditors 141,973 141,973
Employee payables 32,220 32,220
Taxes payable 25,580 25,580 4
Other payables 110,652 110,652
Interest payable 110,652 110,652
Other short-term payables 92,296 92,296
Total payables and prepayments 402,721 402,721
31.12.2014 Within 12 months Note
Trade creditors 191,679 191,679
Employee payables 28,127 28,127
Taxes payable 28,812 28,812
Other payables 33,075 33,075
Interest payable 33,075 33,075
Other short-term payables 27,444 27,444
Total payables and prepayments 309,137 309,137
Note 10 Provisions (EUR)
31.12.2013 Formation/adjustment
Use 31.12.2014
Deferred expenses 1,340,442 143,227 -353,515 1,130,154
Total provisions 1,340,442 143,227 -353,515 1,130,154
Short-term 432,725 487,708 -353,515 566,918
Long-term 907,717 -344,481 0 563,236
31.12.2014 Formation/adjustment
Use 31.12.2015
Deferred expenses 1,130,154 58,082 -290,403 897,833
Total provisions 1,130,154 58,082 -290,403 897,833
Short-term 566,918 61,948 -290,403 338,463
Long-term 563,236 -3,866 559,370
In the balance sheet, provisions consist of deferred expenses that are directly related to the administration of purchased debt portfolios.
According to the management, the sum of the administration costs in 2016 will be EUR 338,465 and in the years 2017 to 2020 EUR 369,370. Group companies have formed a reserve of other provisions in the amount of EUR 190,000.

10 0 10 20 20 1 2 1
17
Note 11 Contingent liabilities and assets (EUR)
31.12.2015 31.12.2014
Contingent liabilities
Possible dividends 2,566,002 2,189,285
Income tax due on potential dividends 641,501 547,321
Total contingent liabilities 3,207,503 2,736,606
Note 12 Share capital (EUR)
31.12.2015 31.12.2014
Share capital 63,912 63,912
Number of shares (pcs) 10,000 10,000
Nominal value of shares 6.39 6.39
Note 13 Sales revenue (EUR)
2015 2014
Sales revenue by geographical regions
Sales to European Union Member States
Total sales to European Union Member States 1,689,930 1,011,623
Total sales revenue 1,689,930 1,011,623
Sales revenue by areas of activity
Revenue on debt claims 1,689,930 1,011,623
Total sales revenue 1,689,930 1,011,623
Note 14 Other operating revenue (EUR)
2015 2014
Profit from changes in exchange rates 0 188
Profit from adjustment of provision 388,331 128,000
Other 938 50,131
Total other operating revenue 389,269 178,319

10 0 10 20 20 1 2 1
18
Note 15 Goods, raw materials and services (EUR)
2015 2014
Administration costs of debt claims 449,991 356,555
Total goods, raw materials and services 449,991 356,555
Note 16 Other operating expenses (EUR)
2015 2014
Lease and rent 26,121 23,784
Miscellaneous office expenses 36,007 21,335
Business trip expenses 7,355 4,981
Expenses on doubtful receivables 0 476
Services purchased 118,836 78,726
Value added tax expense of the group 30,554 15,863
Other 31,011 25,849
Total other operating expenses 249,884 171,014
Note 17 Staff costs (EUR)
2015 2014
Salaries and wages 182,038 145,311
Social security taxes 59,247 52,819
Total staff costs 241,285 198,130
Average number of employees in full-time equivalent units
18 16
Note 18 Interest expenses (EUR)
2015 2014
Interest expenses on loans -487,613 -263,216
Total interest expenses -487,613 -263,216

10 0 10 20 20 1 2 1
19
Note 19 Other financial income and expenses (EUR)
2015 2014
Profit (loss) from discounting receivables 0 258,833
Interest income 20,210 23,373
Other financial income and expenses -163,674 -49,850
Total other financial income and expenses -143,464 232,356
Note 20 Related parties (EUR)
Balances with related parties by group
31.12.2015 31.12.2014
Receivables Payables Receivables Payables
Executive and senior management and major shareholders being private individuals and entities under their dominant or significant influence
75,027 290,619 16,989 216,345
Major shareholders being legal entities and entities under their dominant or significant influence
154,131 10,261 133,946 0
2015 Purchases Disposals Loans received Repayments of loans
received
Executive and senior management and major shareholders being private individuals and entities under their dominant or significant influence
53,652 11,665 0 206,315
2014 Loans given Loans received Repayments of loans received
Executive and senior management and major shareholders being private individuals and entities under their dominant or significant influence
113,300 174,700
Major shareholders being legal entities and entities under their dominant or significant influence
49,600
Remuneration and other significant benefits calculated for executive and senior management
2015 2014
Remuneration calculated 13,800 5,310

10 0 10 20 20 1 2 1
20
The group companies have a total of receivables from members of the management board as regards the amounts of management in the sum of EUR 16,989.
Group companies have a loan receivable from a legal entity of significant holding in the amount of EUR 110,600, an interest receivable in the amount of EUR 43,531 and payables thereto in the amount of EUR 10,261.
Group companies have payables to the executive management, major shareholders being private individuals and entities under their dominant or significant influence in the amount of EUR 289,120 and receivables therefrom in the amount of EUR 66,918.
Group companies have purchased services related to the administration of receivables from entities related to the executive management and major shareholders being private individuals in the amount of EUR 53,652 and provided services thereto in the amount of EUR 11,665.
Note 21 Unconsolidated balance sheet (EUR)
31.12.2015 31.12.2014
Assets Current assets
Cash 6,383 3,281
Financial investments 0 2,846
Receivables and prepayments 911,537 733,189
Total current assets 917,920 739,316
Non-current assets Financial investments 13,286 13,286
Receivables and prepayments 2,219,699 1,497,599
Property, plant and equipment 76,712 93,428
Total non-current assets 2,309,697 1,604,313
Total assets 3,227,617 2,343,629
Liabilities and equity Liabilities
Current liabilities Loans payable 979,136 370,575
Payables and prepayments 179,647 105,916
Provisions 102,606 62,566
Total current liabilities 1,261,389 539,057
Long-term liabilities Loans payable 407,238 423,815
Provisions 190,099 104,614
Total long-term liabilities 597,337 528,429
Total liabilities 1,858,726 1,067,486
Equity Share capital at nominal value 63,912 63,912
Retained earnings (loss) 1,212,231 1,146,362
Annual period profit (loss) 92,748 65,869
Total equity 1,368,891 1,276,143
Total liabilities and equity 3,227,617 2,343,629
10 0 10 20 20 1 2 1
21
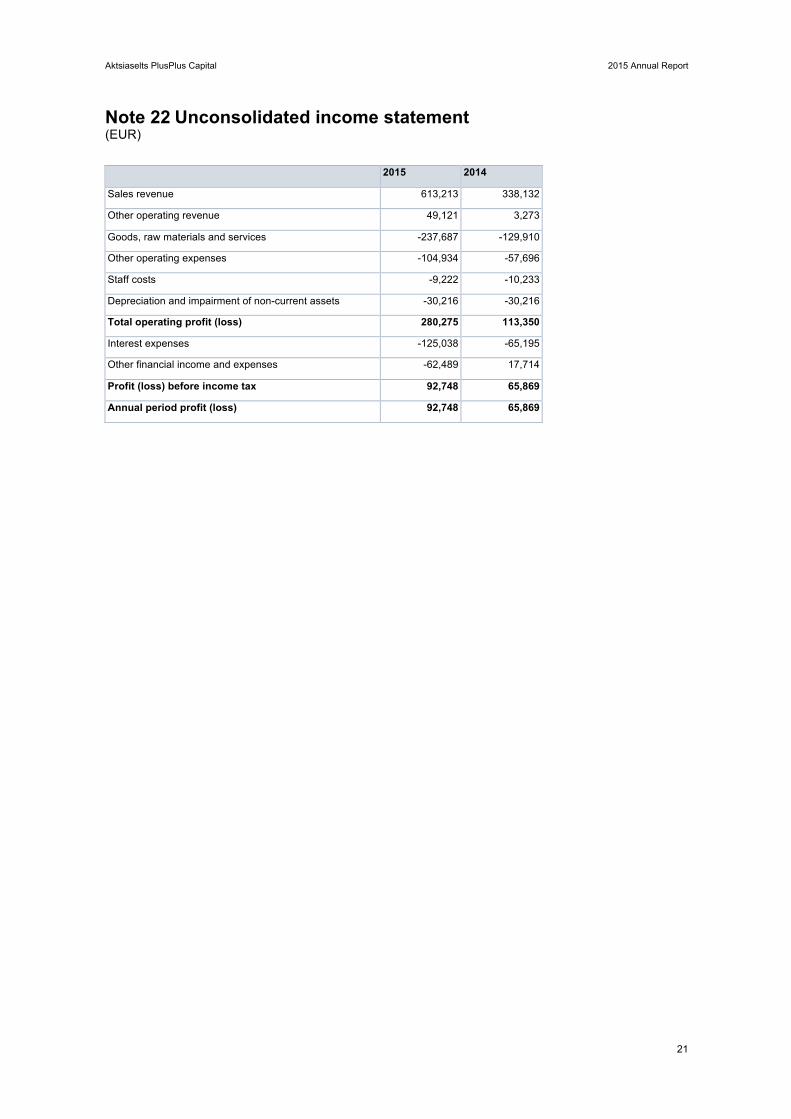
Note 22 Unconsolidated income statement (EUR)
2015 2014
Sales revenue 613,213 338,132
Other operating revenue 49,121 3,273
Goods, raw materials and services -237,687 -129,910
Other operating expenses -104,934 -57,696
Staff costs -9,222 -10,233
Depreciation and impairment of non-current assets -30,216 -30,216
Total operating profit (loss) 280,275 113,350
Interest expenses -125,038 -65,195
Other financial income and expenses -62,489 17,714
Profit (loss) before income tax 92,748 65,869
Annual period profit (loss) 92,748 65,869

10 0 10 20 20 1 2 1
22
Note 23 Unconsolidated cash flow statement (EUR)
2015 2014
Cash flows from operating activities
Operating profit (loss) 280,275 113,350
Adjustments
Depreciation and impairment of non-current assets 30,216 30,216
Other adjustments 0 17,064
Total adjustments 30,216 47,280
Change in receivables and prepayments related to operating activities
-870,727 -91,949
Change in payables and prepayments related to operating activities
159,539 106,197
Total cash flows from operating activities -400,697 174,878
Cash flows from investing activities
Purchase of investment properties -13,500 -13,500
Proceeds from sales of other financial investments 2,846 0
Loans given 0 -49,600
Total cash flows from investing activities -10,654 -63,100
Cash flows from financing activities
Loans received 1,015,000 237,100
Repayments of loans received -410,154 -244,405
Finance lease principal amount repayments -23,117 -21,253
Interest paid -84,602 -67,308
Other payments from financing activities -82,674 -13,697
Total cash flows from financing activities 414,453 -109,563
Total cash flows 3,102 2,215
Cash and cash equivalents at beginning of period 3,281 1,066
Change in cash and cash equivalents 3,102 2,215
Cash and cash equivalents at end of period 6,383 3,281

10 0 10 20 20 1 2 1
23
Note 24 Unconsolidated statement of changes in equity (EUR)
Share capital at nominal value
Retained earnings (loss)
Total
31.12.2013 63,912 1,146,362 1,210,274
Annual period profit (loss)
65,869 65,869
31.12.2014 63,912 1,212,231 1,276,143
Book value of holdings under dominant and significant influence
-13,286 -13,286
Value of holdings under dominant and significant influence calculated by equity method
1,489,926 1,489,926
Adjusted unconsolidated equity 31.12.2014
63,912 2,688,871 2,752,783
Annual period profit (loss)
92,748 92,748
31.12.2015 63,912 1,304,979 1,368,891
Book value of holdings under dominant and significant influence
-13,286 -13,286
Value of holdings under dominant and significant influence calculated by equity method
1,901,097 1,901,097
Adjusted unconsolidated equity 31.12.2015
63,912 3,192,790 3,256,702
Note 25 Events after the balance sheet date
In February 2016, PlusPlus Capital AS, i.e. the parent company of the group, organised the issue of debt instruments in the volume of EUR 4 million. It has been planned to use the money to be received from the debt instruments both for the restructuring of the liabilities of the company and for investing in new debt portfolios. The nominal interest rate of the debt instruments is 13% a year and the term of the debt instruments is three years.

10 0 10 20 20 1 2 1
24
Note 26 Shares of subsidiaries (EUR)
Shares of subsidiaries, general information
Ownership interest (%)
Registry code of subsidiary
Name of subsidiary Country of incorporation Principal activity
31.12.2014 31.12.2015 PlusPlus Baltic OÜ Estonia Acquisition and
administration of debt claims
100 100
PPC Beeta OÜ Estonia Acquisition and administration of debt claims
100 100
PPC Delta OÜ Estonia Acquisition and administration of debt claims
100 100
PlusPlus Inkasso OÜ Estonia Administration of debt claims
100 100
VõlaKütid OÜ Estonia Collection services 100 100
PlusPlus Inkasso SIA Latvia Collection services 100 100
PlusPlus Inkasso UAB Lithuania Collection services 100 100
Shares of subsidiaries, detailed information
Name of subsidiary 31.12.2014 31.12.2015
PlusPlus Baltic OÜ 2,500 2,500
PPC Beeta OÜ 2,500 2,500
PPC Delta OÜ 2,500 2,500
PlusPlus Inkasso OÜ 0 0
VõlaKütid OÜ 0 0
PlusPlus Inkasso SIA 2,872 2,872
PlusPlus Inkasso UAB 2,914 2,914
Total 13,286 13,286
Holdings acquired
Name of subsidiary Holding acquired, % Date of acquisition Acquisition cost of holding acquired
PlusPlus Baltic OÜ 100 07.05.2012 2,500
PPC Beeta OÜ 100 26.03.2012 2,500
PPC Delta OÜ 100 30.10.2014 2,500
PlusPlus Inkasso OÜ 100 04.04.2011 80,000
VõlaKütid OÜ 100 29.06.2011 75,000
PlusPlus Inkasso SIA 100 12.11.2012 2,872
PlusPlus Inkasso UAB 100 29.08.2012 2,914
The parent company recognises investments in subsidiaries by the acquisition cost method.
The financial indicators of all subsidiaries (except for subsidiaries acquired for resale) controlled by the parent company are consolidated on a line-by-line basis in the consolidated statements.

STR
UC
TUR
E O
F THE
PLU
SP
LUS
CA
PITA
L GR
OU
P
P
lusPlus C
apital AS
P
lusPlus B
altic O
Ü (dom
inant influence of P
lusPlus C
apital A
S 100%
) P
lusPlus
Baltic
Latvian B
ranch
PlusP
lus B
altic Lithuanian B
ranch
PP
C B
eeta O
Ü
(PlusP
lus C
apital AS
100%
)
PP
C D
elta O
Ü
(PlusP
lus C
apital AS
100%
)
PlusP
lus Inkasso O
Ü
(PlusP
lus C
apital AS
100%
)
VõlaK
ütid O
Ü
(PlusP
lus C
apital 100%
)
PlusP
lus Inkasso S
IA
(PlusP
lus C
apital AS
100%
)
PlusP
lus Inkasso U
AB
(P
lusPlus
Capital A
S
100%)

VALIDITY CONFIRMATION SHEETSIGNED FILES
FILE NAME FILE SIZE11919806_2015__Aruanne_11919806.pdf 178 KB
SIGNERS
NO. NAME PERSONAL CODE TIMEMirje Trumsi1 47510230211 25.05.2016 12:09:49 +03:00
VALIDITY OF SIGNATURE
SIGNATURE IS VALID
ROLE / RESOLUTION
Juhatuse liige;
PLACE OF CONFIRMATION (CITY, STATE, ZIP, COUNTRY)
SERIAL NUMBER OF SIGNER CERTIFICATE
143547010790321687843943198004843455090
ISSUER OF CERTIFICATE AUTHORITY KEY IDENTIFIERESTEID-SK 2011 7B 6A F2 55 50 5C B8 D9 7A 08 87 41 AE FA A2 2B 3D 5B 57 76
HASH VALUE OF SIGNATURE30 31 30 0D 06 09 60 86 48 01 65 03 04 02 01 05 00 04 20 65 58 61 42 D6 F6 9E F4 FE E2 22 5C 24 D0 E1 B3 69 9A D0 BC 92CF 73 04 05 D8 A6 10 E2 1C 41 35
NO. NAME PERSONAL CODE TIMEKarl Mitt2 37605060014 25.05.2016 12:32:26 +03:00
VALIDITY OF SIGNATURE
SIGNATURE IS VALID
ROLE / RESOLUTION
Juhatuse liige;
PLACE OF CONFIRMATION (CITY, STATE, ZIP, COUNTRY)
SERIAL NUMBER OF SIGNER CERTIFICATE
18474888871550125562373644430798570781
ISSUER OF CERTIFICATE AUTHORITY KEY IDENTIFIERESTEID-SK 2011 7B 6A F2 55 50 5C B8 D9 7A 08 87 41 AE FA A2 2B 3D 5B 57 76
HASH VALUE OF SIGNATURE30 31 30 0D 06 09 60 86 48 01 65 03 04 02 01 05 00 04 20 9B C6 0E E1 CE 99 84 B1 CB 25 92 B6 B2 67 D3 BB 25 A1 85 41 C1D1 A4 C8 B1 20 88 1C 94 C5 D4 E7The print out of files listed in the section "Signed Files" are inseparable part of this Validity Confirmation Sheet.
NOTES

INDEPENDENT SWORN AUDITOR’S REPORT
To shareholders of Aktsiaselts /public limited company/ PlusPlus Capital
We have audited the consolidated financial statements of Aktsiaselts PlusPlus Capital, which comprise the consolidated balance sheet as at 31 December 2015, and the consolidated income statement, consolidated statement of changes in equity and consolidated cash flow statement for the year then ended, and a summary of significant accounting policies used upon drawing up the financial statements and other explanatory notes. Audited consolidated financial statements presented on pages 4 to 25 are enclosed with this report.
Management’s Responsibility for the Financial Statements
Management is responsible for the preparation and fair presentation of the consolidated financial statements in accordance with the accounting principles generally accepted in Estonia and for such internal control as management determines is necessary to enable the preparation of consolidated financial statements that are free from material misstatement, whether due to fraud or error.
Sworn Auditor’s Responsibility
Our responsibility is to express an opinion on these consolidated financial statements based on our audit. We conducted our audit in accordance with International Standards on Auditing (Estonia). Those standards require that we comply with ethical requirements and plan and perform the audit to obtain reasonable assurance about whether the consolidated financial statements are free from material misstatement.
An audit involves performing procedures to obtain audit evidence about the amounts and disclosures in the consolidated financial statements. The procedures selected depend on the sworn auditor’s judgment, including the assessment of the risks of material misstatement of the consolidated financial statements, whether due to fraud or error. In making those risk assessments, the sworn auditor considers internal control relevant to the entity’s preparation and fair presentation of the consolidated financial statements in order to design audit procedures that are appropriate in the circumstances, but not for the purpose of expressing an opinion on the effectiveness of the entity’s internal control. An audit also includes evaluating the appropriateness of accounting policies used and the reasonableness of accounting estimates made by management, as well as evaluating the overall presentation of the consolidated financial statements.
We believe that the audit evidence we have obtained is sufficient and appropriate to provide a basis for our audit opinion.
Opinion
In our opinion, the consolidated financial statements present fairly, in all material respects, the financial position of Aktsiaselts PlusPlus Capital as at 31 December 2015 and of its financial performance and its cash flows for the year then ended in accordance with the accounting principles generally accepted in Estonia.
/digitally signed/ Ksenia Lukkanen
Sworn Auditor number 373 KL Partners OÜ Audit firm’s activity licence number 149 Tallinn, 25 May 2016