consolidated financial results of the year ended march … · may 14, 2015 consolidated financial...
TRANSCRIPT
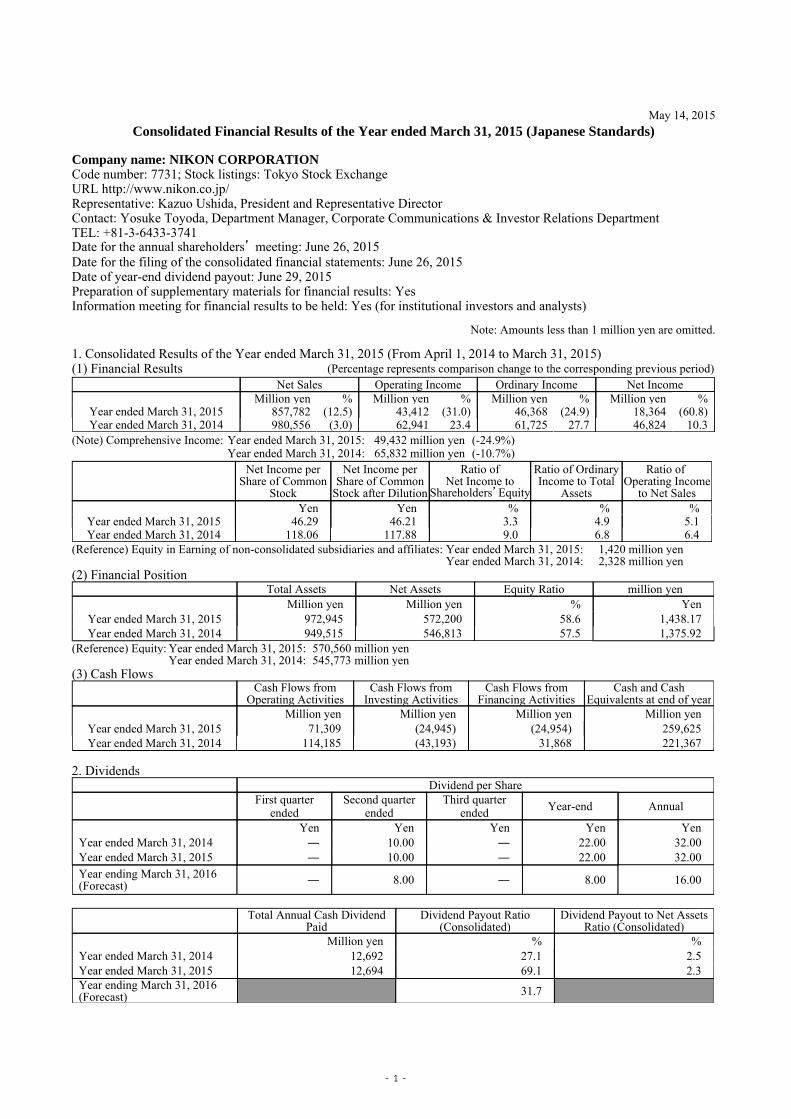
May 14, 2015
Consolidated Financial Results of the Year ended March 31, 2015 (Japanese Standards)
Company name: NIKON CORPORATION Code number: 7731; Stock listings: Tokyo Stock Exchange URL http://www.nikon.co.jp/ Representative: Kazuo Ushida, President and Representative Director Contact: Yosuke Toyoda, Department Manager, Corporate Communications & Investor Relations Department TEL: +81-3-6433-3741 Date for the annual shareholders’ meeting: June 26, 2015 Date for the filing of the consolidated financial statements: June 26, 2015 Date of year-end dividend payout: June 29, 2015 Preparation of supplementary materials for financial results: Yes Information meeting for financial results to be held: Yes (for institutional investors and analysts)
Note: Amounts less than 1 million yen are omitted.
1. Consolidated Results of the Year ended March 31, 2015 (From April 1, 2014 to March 31, 2015)
(2) Financial Position
(3) Cash Flows
2. Dividends
(1) Financial Results (Percentage represents comparison change to the corresponding previous period)
Net Sales Operating Income Ordinary Income Net IncomeMillion yen % Million yen % Million yen % Million yen %
Year ended March 31, 2015 857,782 (12.5) 43,412 (31.0) 46,368 (24.9) 18,364 (60.8)Year ended March 31, 2014 980,556 (3.0) 62,941 23.4 61,725 27.7 46,824 10.3
(Note) Comprehensive Income: Year ended March 31, 2015: 49,432 million yen (-24.9%)Year ended March 31, 2014: 65,832 million yen (-10.7%)
Net Income per Share of Common
Stock
Net Income per Share of Common
Stock after Dilution
Ratio of Net Income to
Shareholders’Equity
Ratio of Ordinary Income to Total
Assets
Ratio of Operating Income
to Net Sales Yen Yen % % %
Year ended March 31, 2015 46.29 46.21 3.3 4.9 5.1Year ended March 31, 2014 118.06 117.88 9.0 6.8 6.4
(Reference) Equity in Earning of non-consolidated subsidiaries and affiliates: Year ended March 31, 2015: 1,420 million yenYear ended March 31, 2014: 2,328 million yen
Total Assets Net Assets Equity Ratio million yenMillion yen Million yen % Yen
Year ended March 31, 2015 972,945 572,200 58.6 1,438.17Year ended March 31, 2014 949,515 546,813 57.5 1,375.92
(Reference) Equity: Year ended March 31, 2015: 570,560 million yenYear ended March 31, 2014: 545,773 million yen
Cash Flows from Operating Activities
Cash Flows from Investing Activities
Cash Flows from Financing Activities
Cash and Cash Equivalents at end of year
Million yen Million yen Million yen Million yen Year ended March 31, 2015 71,309 (24,945) (24,954) 259,625Year ended March 31, 2014 114,185 (43,193) 31,868 221,367
Dividend per ShareFirst quarter
ended Second quarter
endedThird quarter
ended Year-end Annual
Yen Yen Yen Yen YenYear ended March 31, 2014 ― 10.00 ― 22.00 32.00Year ended March 31, 2015 ― 10.00 ― 22.00 32.00Year ending March 31, 2016 (Forecast) ― 8.00 ― 8.00 16.00
Total Annual Cash Dividend Paid
Dividend Payout Ratio (Consolidated)
Dividend Payout to Net Assets Ratio (Consolidated)
Million yen % %Year ended March 31, 2014 12,692 27.1 2.5Year ended March 31, 2015 12,694 69.1 2.3Year ending March 31, 2016 (Forecast) 31.7
- 1 -

3. Consolidated Financial Forecasts for the year ending March 31, 2016 (From April 1, 2015 to March 31, 2016)
4. Other (1) Changes of significant subsidiaries during the current fiscal year (change of specified subsidiaries that affected
the scope of consolidated reporting): None (2) Changes of accounting policies applied, procedures and methods of presentation for preparing consolidated
financial statements
(3) Number of shares issued (common stock)
1. Number of shares issued as of the term end (including treasury stocks):
2. Number of treasury stock as of the term end:
3. Average number of shares during the term:
(Percentage represents comparison to previous fiscal year)
Net Sales Operating Income Ordinary Income Net Income
Attributable to Owners of Parent
Net Income per Share of
Common Stock
Million yen % Million yen % Million yen % Million yen % Yen Second quarter ending September 30, 2015 374,000 (0.3) 2,000 (84.7) 4,000 (72.9) 1,000 (90.1) 2.52
Full year 860,000 0.3 30,000 (30.9) 33,000 (28.8) 20,000 8.9 50.42
1. Changes in accounting policies resulting from the revision of the accounting standards and other regulations: Yes
2. Other changes in accounting policies: Yes3. Changes in accounting estimates: Yes4. Restatement of corrections: None
Year ended March 31, 2015 400,878,921 shares Year ended March 31, 2014 400,878,921 shares
Year ended March 31, 2015 4,152,366 shares Year ended March 31, 2014 4,219,304 shares
Year ended March 31, 2015 396,695,884 shares Year ended March 31, 2014 396,630,041 shares
- 2 -

〔Reference〕 1. Non-consolidated Results of the year ended March 31, 2015 (From April 1, 2014 to March 31, 2015)
(2) Financial Position
(※Indication of quarterly review procedures implementation status) This financial results report is exempt from review procedures under Japan’s Financial Instruments and Exchange Law. It is under the review procedure process at the time of disclosure of this report. (※Appropriate use of business forecasts; other special items) Performance forecasts and other forward-looking statements contained in this report are based on informationcurrently available and on certain assumptions deemed rational at the time of this report’s release. Due to various circumstances, however, actual results may differ significantly from such statements. For more information aboutthe Company’s business forecasts, please refer to page 6.
(1) Financial Results (Percentage represents comparison change to the corresponding previous period)
Net Sales Operating Income Ordinary Income Net Income Million yen % Million yen % Million yen % Million yen %
Year ended March 31, 2015 607,556 (15.2) 7,319 (77.7) 28,223 (26.2) 10,133 (69.1) Year ended March 31, 2014 716,863 (4.3) 32,809 97.3 38,228 89.5 32,780 62.4
Net Income per
Share of Common Stock
Net Income per Share of Common
Stock after Dilution
Yen Yen Year ended March 31, 2015 25.54 25.50 Year ended March 31, 2014 82.65 82.52
Total Assets Net Assets Equity Ratio Net Assets per Share of
Common Stock Million yen Million yen % Yen
Year ended March 31, 2015 659,283 339,453 51.3 852.78 Year ended March 31, 2014 681,230 346,093 50.7 870.12
(Reference) Equity: Year ended March 31, 2015: 338,321 million yen Year ended March 31, 2014: 345,141 million yen
- 3 -

Contents
1. Operating Results …………………………………………………………………………………………………………… 5
(1) Analysis of Operating Results ………………………………………………………………………………………… 5
(2) Analysis of Financial Position ………………………………………………………………………………………… 7
(3) Shareholder Returns Policy and Dividends ………………………………………………………………………… 7
(4) Business and Other Risks …………………………………………………………………………………………… 9
2. Status of Nikon Group …………………………………………………………………………………………………… 12
3. Management Policies ……………………………………………………………………………………………………… 13
(1) Company’s Basic Management Policies …………………………………………………………………………… 13
(2) Targeted Management Indices ………………………………………………………………………………………… 13
(3) Medium and Long-term Management Strategies and Issues to be Addressed ……………………………… 13
4. Basic Policy on the Adoption of Accounting Standards………………………………………………………………… 14
5. Consolidated Financial Statements ……………………………………………………………………………………… 15
(1) Consolidated Balance Sheets …………………………………………………………………………………………… 15
(2) Consolidated Statements of Income and Statements of Comprehensive Income …………………………… 17
(3) Consolidated Statements of Changes in Net Assets ……………………………………………………………… 19
(4) Consolidated Statement of Cash Flows …………………………………………………………………………… 21
(5) Note on Assumptions for Going Concern ………………………………………………………………………… 22
(6) Basis of Presenting Consolidated Financial Statements ………………………………………………………… 22
(7) Changes in Basis of Presenting Consolidated Financial Statements …………………………………………… 22
(8) Notes to Consolidated Financial Statements ……………………………………………………………………… 25
1) Consolidated Statements of Income ……………………………………………………………………………… 25
2) Segment Information ………………………………………………………………………………………………… 26
3) Per-Share Information ……………………………………………………………………………………………… 30
4) Significant Subsequent Events …………………………………………………………………………………… 30
6. Non-Consolidated Financial Statements ………………………………………………………………………………… 31
(1) Non-Consolidated Balance Sheets …………………………………………………………………………………… 31
(2) Non-Consolidated Statements of Income ………………………………………………………………………… 34
(3) Non-Consolidated Statements of Changes in Net Assets ……………………………………………………… 35
- 4 -

1. Operating Results 1. Analysis of Operating Results
(1) Overview of the fiscal year ended March 31, 2015 During the consolidated fiscal year ended March 31, 2015, in the Precision Equipment Business, capital
investments were firm in the semiconductor-related field. Meanwhile, in the FPD (Flat Panel Display)-relatedfield, although there was a recovery in capital investments for large displays, its performance was weak as aresult of a settling down in capital investments for mid-to-small size displays. In the Imaging Products Business,the market for the Digital camera—Interchangeable Lens Type was sluggish mainly in Europe and China, andthe compact digital camera market continued to shrink. In the Instruments Business, although the microscope-related field was sluggish due to a reduction in the public budget of Japan and delays in execution, the field wasrobust in the Americas and China. In the industrial metrology-related field, capital investments related toelectronic component and automobiles recovered.
Under these circumstances, the Group initiated a structural reform in order to re-build its business portfolioand try to achieve a transformation into a business model capable of realizing sustained growth based on thethree-year Medium Term Management Plan announced in June, 2014.
Firstly, the Group shifted from the in-house company, which was a decentralized operation, to a divisionalorganization under direct control of the President, in order to create a system that allows the flexible allocationof management resources. In addition, the Group established the Medical Business Development Division inorder to promote faster business development of the Medical Business that will serve as a new business pillar.
In existing core businesses, the Group has worked to strengthen the business base through the introduction ofinnovative new products and working on further cost reductions, etc. In addition, the Group promoted thedevelopment of corporate venture capital projects to utilize external resources through means such as M&Asand business alliances, and to explore new fields.
For example, as a stepping stone toward full-fledged entry into the Medical Business, the Group reached anagreement with Optos Plc, which is a leading company in the UK’s retina diagnostic imaging equipmentmarket, for the friendly acquisition of Optos Plc and commencement of procedures to convert it into a whollyowned subsidiary.
Net sales of the Group for the fiscal year ended March 31, 2015 decreased by 122,774 million yen (12.5%)year on year to 857,782 million yen, operating income decreased by 19,529 million yen (31.0%) year on year to43,412 million yen, and ordinary income decreased by 15,356 million yen (24.9%) year on year to 46,368million yen. In addition, as a result of factors including an impairment loss recorded in the SemiconductorLithography Business, net income decreased by 28,460 million yen (60.8%) year on year to 18,364 million yen.
Performance by business segment is as follows. 1) Precision Equipment Business In the Semiconductor Lithography System field, the Group worked to improve performance and expand sales
of equipment, focusing on ArF immersion scanners, and launched the new NSR-S630D equipment that offersextremely high overlay accuracy and improved productivity. However, the situation was challenging due tofactors including the impact of changes in capital investment plans by customers.
In the FPD Lithography System field, although focusing on sales of products such as the FX-67S that are idealfor the production of mid-to-small size high definition displays for smart-phone/tablet terminals, etc., the Groupwas affected by the settling down of capital investments. In the equipment for large displays, sales of its latestproducts such as the FX-86S2 and FX-86SH2 grew steadily, supported by a recovery in capital investment.
Although the Group made efforts across its business as a whole to improve the profit structure, includingshortening manufacturing periods and cutting costs, net sales decreased by 16.9% from the previous fiscal yearto 170,757 million yen, and operating income decreased by 58.4% from the previous fiscal year to 8,355 millionyen.
2) Imaging Products Business In the Imaging Products Business, the performance of Digital camera—Interchangeable Lens Type was strong
for D750 and D810, the digital single-lens reflex (SLR) cameras with full-scale specifications comparable tothose of professional models, D7200 and D7100, the middle-class models, and D5500 and D3300, the entry-class models, and the market share grew significantly, especially in the USA and Russia during the fourthquarter.
In compact digital cameras, sales were strong for products including the multi-function model COOLPIXP600 which comes with 60x optical zoom and the stylish model COOLPIX S9700 equipped with a 30x opticalzoom.
Cumulative production of interchangeable lenses reached 90 million units in November 2014. As a result of the foregoing, despite downturn in the market , due in part to the expansion in market shares net
sales only decreased by 14.5% from the previous fiscal year to 586,019 million yen, and operating income onlydecreased by 11.8% to 56,698 million yen.
- 5 -
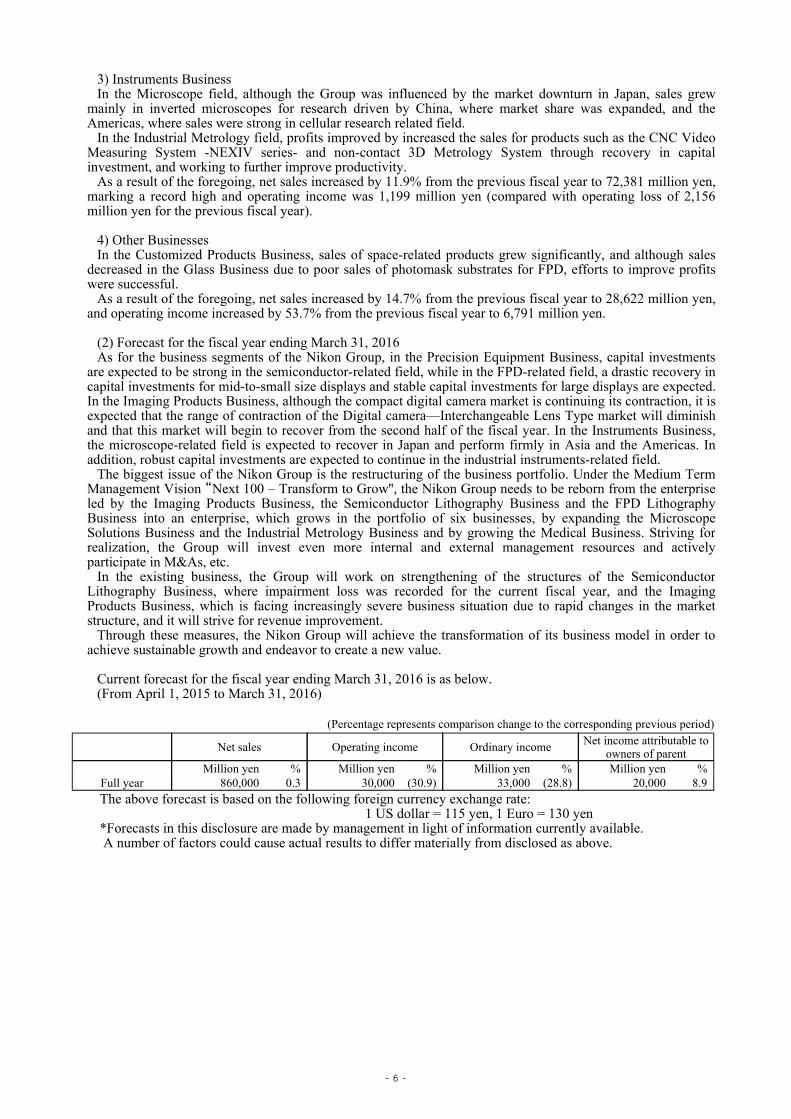
3) Instruments Business In the Microscope field, although the Group was influenced by the market downturn in Japan, sales grew
mainly in inverted microscopes for research driven by China, where market share was expanded, and theAmericas, where sales were strong in cellular research related field.
In the Industrial Metrology field, profits improved by increased the sales for products such as the CNC VideoMeasuring System -NEXIV series- and non-contact 3D Metrology System through recovery in capitalinvestment, and working to further improve productivity.
As a result of the foregoing, net sales increased by 11.9% from the previous fiscal year to 72,381 million yen,marking a record high and operating income was 1,199 million yen (compared with operating loss of 2,156million yen for the previous fiscal year).
4) Other Businesses In the Customized Products Business, sales of space-related products grew significantly, and although sales
decreased in the Glass Business due to poor sales of photomask substrates for FPD, efforts to improve profitswere successful.
As a result of the foregoing, net sales increased by 14.7% from the previous fiscal year to 28,622 million yen,and operating income increased by 53.7% from the previous fiscal year to 6,791 million yen.
(2) Forecast for the fiscal year ending March 31, 2016 As for the business segments of the Nikon Group, in the Precision Equipment Business, capital investments
are expected to be strong in the semiconductor-related field, while in the FPD-related field, a drastic recovery incapital investments for mid-to-small size displays and stable capital investments for large displays are expected.In the Imaging Products Business, although the compact digital camera market is continuing its contraction, it isexpected that the range of contraction of the Digital camera—Interchangeable Lens Type market will diminishand that this market will begin to recover from the second half of the fiscal year. In the Instruments Business,the microscope-related field is expected to recover in Japan and perform firmly in Asia and the Americas. Inaddition, robust capital investments are expected to continue in the industrial instruments-related field.
The biggest issue of the Nikon Group is the restructuring of the business portfolio. Under the Medium TermManagement Vision “Next 100 – Transform to Grow'', the Nikon Group needs to be reborn from the enterpriseled by the Imaging Products Business, the Semiconductor Lithography Business and the FPD LithographyBusiness into an enterprise, which grows in the portfolio of six businesses, by expanding the MicroscopeSolutions Business and the Industrial Metrology Business and by growing the Medical Business. Striving forrealization, the Group will invest even more internal and external management resources and activelyparticipate in M&As, etc.
In the existing business, the Group will work on strengthening of the structures of the SemiconductorLithography Business, where impairment loss was recorded for the current fiscal year, and the ImagingProducts Business, which is facing increasingly severe business situation due to rapid changes in the marketstructure, and it will strive for revenue improvement.
Through these measures, the Nikon Group will achieve the transformation of its business model in order toachieve sustainable growth and endeavor to create a new value.
Current forecast for the fiscal year ending March 31, 2016 is as below. (From April 1, 2015 to March 31, 2016)
The above forecast is based on the following foreign currency exchange rate: 1 US dollar = 115 yen, 1 Euro = 130 yen
*Forecasts in this disclosure are made by management in light of information currently available. A number of factors could cause actual results to differ materially from disclosed as above.
(Percentage represents comparison change to the corresponding previous period)
Net sales Operating income Ordinary income Net income attributable to owners of parent
Million yen % Million yen % Million yen % Million yen % Full year 860,000 0.3 30,000 (30.9) 33,000 (28.8) 20,000 8.9
- 6 -
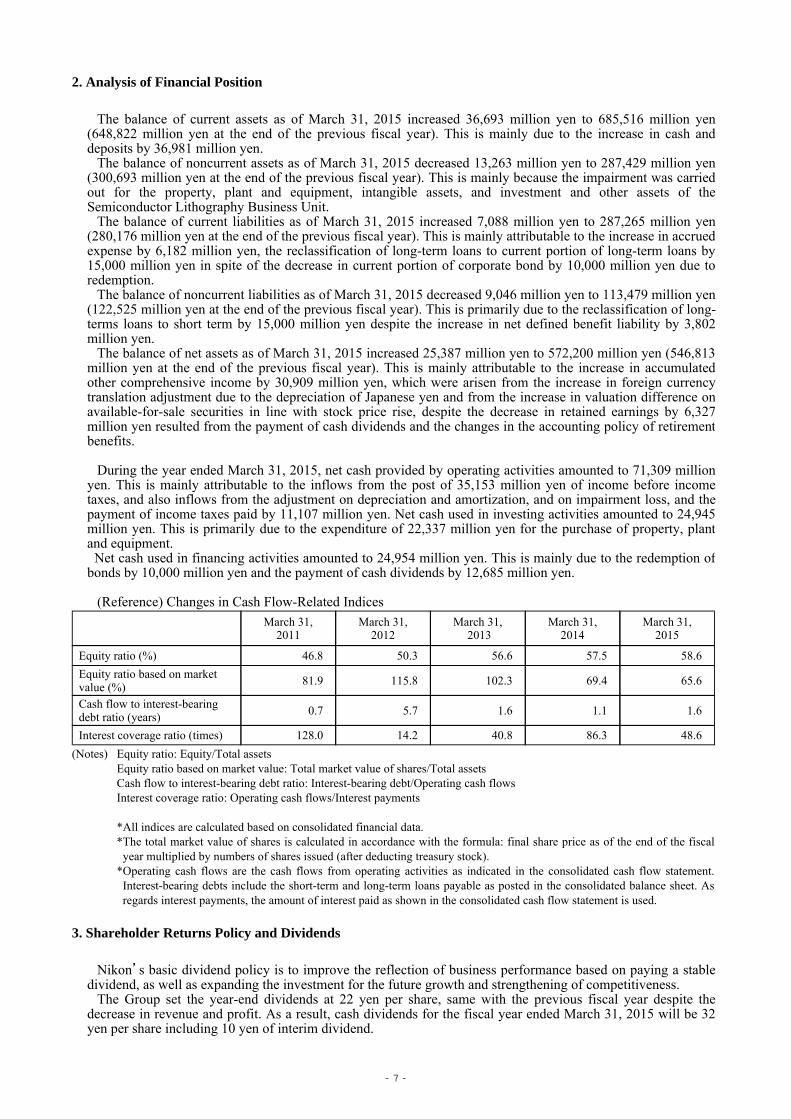
2. Analysis of Financial Position
The balance of current assets as of March 31, 2015 increased 36,693 million yen to 685,516 million yen
(648,822 million yen at the end of the previous fiscal year). This is mainly due to the increase in cash anddeposits by 36,981 million yen.
The balance of noncurrent assets as of March 31, 2015 decreased 13,263 million yen to 287,429 million yen(300,693 million yen at the end of the previous fiscal year). This is mainly because the impairment was carriedout for the property, plant and equipment, intangible assets, and investment and other assets of theSemiconductor Lithography Business Unit.
The balance of current liabilities as of March 31, 2015 increased 7,088 million yen to 287,265 million yen(280,176 million yen at the end of the previous fiscal year). This is mainly attributable to the increase in accruedexpense by 6,182 million yen, the reclassification of long-term loans to current portion of long-term loans by15,000 million yen in spite of the decrease in current portion of corporate bond by 10,000 million yen due toredemption.
The balance of noncurrent liabilities as of March 31, 2015 decreased 9,046 million yen to 113,479 million yen(122,525 million yen at the end of the previous fiscal year). This is primarily due to the reclassification of long-terms loans to short term by 15,000 million yen despite the increase in net defined benefit liability by 3,802million yen.
The balance of net assets as of March 31, 2015 increased 25,387 million yen to 572,200 million yen (546,813million yen at the end of the previous fiscal year). This is mainly attributable to the increase in accumulatedother comprehensive income by 30,909 million yen, which were arisen from the increase in foreign currencytranslation adjustment due to the depreciation of Japanese yen and from the increase in valuation difference onavailable-for-sale securities in line with stock price rise, despite the decrease in retained earnings by 6,327million yen resulted from the payment of cash dividends and the changes in the accounting policy of retirementbenefits.
During the year ended March 31, 2015, net cash provided by operating activities amounted to 71,309 million
yen. This is mainly attributable to the inflows from the post of 35,153 million yen of income before incometaxes, and also inflows from the adjustment on depreciation and amortization, and on impairment loss, and thepayment of income taxes paid by 11,107 million yen. Net cash used in investing activities amounted to 24,945million yen. This is primarily due to the expenditure of 22,337 million yen for the purchase of property, plantand equipment. Net cash used in financing activities amounted to 24,954 million yen. This is mainly due to the redemption ofbonds by 10,000 million yen and the payment of cash dividends by 12,685 million yen.
(Reference) Changes in Cash Flow-Related Indices
3. Shareholder Returns Policy and Dividends
Nikon’s basic dividend policy is to improve the reflection of business performance based on paying a stable
dividend, as well as expanding the investment for the future growth and strengthening of competitiveness. The Group set the year-end dividends at 22 yen per share, same with the previous fiscal year despite the
decrease in revenue and profit. As a result, cash dividends for the fiscal year ended March 31, 2015 will be 32yen per share including 10 yen of interim dividend.
March 31, 2011
March 31, 2012
March 31, 2013
March 31, 2014
March 31, 2015
Equity ratio (%) 46.8 50.3 56.6 57.5 58.6
Equity ratio based on market value (%) 81.9 115.8 102.3 69.4 65.6
Cash flow to interest-bearing debt ratio (years) 0.7 5.7 1.6 1.1 1.6
Interest coverage ratio (times) 128.0 14.2 40.8 86.3 48.6
(Notes) Equity ratio: Equity/Total assets Equity ratio based on market value: Total market value of shares/Total assets Cash flow to interest-bearing debt ratio: Interest-bearing debt/Operating cash flows Interest coverage ratio: Operating cash flows/Interest payments *All indices are calculated based on consolidated financial data. *The total market value of shares is calculated in accordance with the formula: final share price as of the end of the fiscalyear multiplied by numbers of shares issued (after deducting treasury stock).
*Operating cash flows are the cash flows from operating activities as indicated in the consolidated cash flow statement.Interest-bearing debts include the short-term and long-term loans payable as posted in the consolidated balance sheet. As regards interest payments, the amount of interest paid as shown in the consolidated cash flow statement is used.
- 7 -

As for the dividends of the fiscal year ending March 31, 2016, the Group plans to pay 16 yen per shareincluding 8 yen of interim dividend.
Henceforth, its present goal is to provide a total return ratio of 30% or more.
- 8 -

4. Business and Other Risks
There is a possibility that the business performance of the Nikon Group will be impacted significantly by
various factors that may arise in the future. Following are principal matters that are considered to be likely riskfactors in the promotion of business operations by the Group.
Matters concerning the future as stated herein are based on the Nikon Group's estimations as of the date of thepreparation hereof.
(1) Unique business environment and circumstances
The semiconductor industry, which is the main target market for the Semiconductor Lithography Systemhandled by the Precision Equipment Business, is characterized as an industry with drastic changes in thebusiness cycle, although this inclination has been waning in recent years, due to the diversification of endproducts. As a result, an over-supply of semiconductor devices in the market poses the risk of a decrease inthe demand for steppers, due to a cutback in capital investment by semiconductor manufacturers and anaccompanying increase in inventories. However, it is difficult to predict the timing or the duration of such asituation or the degree of fluctuation. As an additional characteristic of customer behavior in the sameindustry, orders are subject to postponement or cancellation even after they have been placed, resulting in astructure that is prone to increases in inventory during periods of slow demand. The demand for FPDLithography System, which is dependent on the climate of the LCD panel market, may experience a rapiddecline, should LCD panel prices drop as a result of an over-supply.
In the market for digital cameras, which are the leading products in the Imaging Products Business, thereis a possibility of the market undergoing changes such as the decline in demand for digital cameras, due tosuch factors as fluctuation of the economy of the respective regions and the emergence of strongcompetition, such as new digital equipment.
In the Instruments Business, the microscope market is becoming saturated, leading to the possibility of achange in competition structure, as a result of an industry restructuring or the like. Further, the IndustrialInstruments Business is susceptible to the effect of the economic and facility trends of various industries,including semiconductors, power generation, electronic components, automobiles and machine tools.
Such changes in the business environment are likely to have a considerable impact on the businessperformance and the financial position of the Nikon Group.
(2) Dependence on specific suppliers
In each business that it is engaged in, the Nikon Group is sometimes dependent on specific suppliers forsuch things as raw materials, key components, and finished products that have been outsourced. Althoughthe Group is making efforts to ensure stable procurement while maintaining a close relationship withspecific suppliers, there is a possibility that the Group's profit and financial position will be adverselyaffected in the event of a steep increases in purchase price or a material problem with procurement due to asudden surge in demand, natural disasters, quality issues, as well as policy changes or bankruptcy on thepart of a specific supplier.
(3) Dependence on specific customers
Moves such as mergers and partnerships are progressing within the semiconductor industry, which is acustomer of the Precision Equipment Business, in order to cope with expanding capital expenditure andincreasingly diversified technology development. Further, selective elimination is proceeding as thecompetitive superiority or inferiority of various companies becomes more defined, based on thetechnologies owned and the characteristics of the devices manufactured. Competition among companies isintensifying also in the LCD panel industry as capital expenditures expand, resulting in some moves forindustry restructuring. Capital investment plans of the Nikon Group's major customers are volatile owingto the foregoing circumstances. Hence, there is a possibility that the Group's profit and financial positionwill be adversely affected should; for example, a customer drastically reduce order volumes or take itsbusiness to a competitor, or should problems arise for any reason with respect to debt payment by acustomer.
(4) Ability to develop new products and investment in development
Being subject to intense competition, the Nikon Group's core businesses are constantly required todevelop new products by continuing to engage in highly advanced research and development. Therefore, itis necessary to continue to invest in product development, regardless of the fluctuations in the Group'sprofit. In the Precision Equipment Business, there is a possibility of a decrease in profit in the event of failure todevelop new products and/or next-generation technology in a timely manner, or of rejection by the marketof a technology developed by the Nikon Group. Further, should a competitor acquire a patent on a newtechnology, there is a danger that the production and/or sale of a product will be suspended or of a decreasein profit margin due to the payment of royalty, as well as the possibility that the adoption of a newtechnology by a competitor's device will cause the price of Nikon's devices to deteriorate. Furtherintensification of price competition is expected with respect to FPD Lithography System in the event of
- 9 -

market entries by newcomers or introduction of a new technology, which may impact profit. In the Imaging Products Business, given the rapid advances in surrounding technological environmentsand increasing sophistication and diversification of digital cameras, continual investment is required for thedevelopment of new technologies and new products. However, there is a conceivable possibility that atechnology or a product that was developed will not lead to an increase in profit should the investment failto produce adequate results or should there be an abrupt shift in demand to higher functioning digitalequipment. As with the Precision Equipment Business, should a competitor acquire a patent on a newtechnology, there is a danger that the production and/or sale of a product will be suspended or of a decreasein profit margin due to the payment of royalty, which may impact profit.
(5) Intensification of price competition
In the market for Semiconductor and FPD Lithography System, while the development of cutting-edgetechnologies is progressing, there is a possibility that competitors will launch an offensive with low-priced Lithography System.
As for digital cameras, which are the leading products of the Imaging Products Business, there is apossibility that competitors will launch an offensive with low-priced products as the market matures.
In the Instruments business, the maturing of the microscope market is further promoting the competitionto differentiate products, while fanning price competition in the mid- and low-range markets. There is a possibility that the Nikon Group's profit and financial position will be affected adversely, should there be asharp and sudden decrease in prices.
(6) Overseas business operations
The Nikon Group is dependent on foreign countries for a significant portion of its production and salesactivities. Hence, it is affected by changes in various import and export laws, tax systems, and regulation inJapan and other countries in which the Group operates. Further, in conducting business operationsoverseas, there is a possibility that major problems will be encountered and/or losses will be incurred inconducting business activities, due to such risks as changes in political regimes or economic climate; socialchaos caused by riots, terrorism, wars, infectious diseases, etc.; problems with such infrastructures orlogistics-related functions as water, electricity, and communications network due to natural disaster; anddifficulty hiring human resources or loss thereof. There is a possibility that the Nikon Group's profit andfinancial status will be affected adversely as a result of production and sales being limited by the foregoing.
(7) Risk of fluctuations in exchange rate
The Nikon Group is highly dependent on overseas market, with overseas sales accounting for as much as85.7% of net sales. While the Group is appropriately hedging foreign exchange risks in accordance withsales volumes and the sales region, the net sale of and profit from products and services subject to foreigncurrency transactions, or the yen values of the income, losses, assets and liabilities of overseas consolidatedsubsidiaries will be affected should there be a sharp fluctuation in foreign exchange rates.
(8) Risk relating to M&A, business alliances and strategic investments
The Company operates its business by building relationships with other companies in forms such asbusiness alliances, joint ventures and strategic investments. In addition, the Company may acquire othercompanies.
These are important for optimization of the business portfolio, expansion of business bases andtechnological developments, and the Company shares the goal with the other companies and strives towork together towards its achievement.
However, if such cooperation system is not able to be built, and even if it is built, due to businessenvironments, competitors’ trends and other reasons, the desired outcome may not be brought fully. It mayalso take more time than planned for the cooperation system and business integration. In that case, it couldadversely affect profitability and financial situation, or may damage investment values.
Further, if the Company found appropriate target company for acquisitions or investments but failed toreach the conclusion of contracts, it could adversely affect profitability and financial situation.
(9) Fund procurement risk
While the Nikon Group is procuring funds as the need arises with due consideration for the balancebetween long-term and short-term funds, as well as between direct and indirect financing, there is apossibility that such effects as an increase in interest rates on the fund procured or limitation of the meansfor procuring fund may arise should the financial market climate deteriorate further. There is a possibilitythat fund procurement by the Group will also be impacted should the rating of the Company's bond berevised downward due to a decline in business performance.
(10) Risk relating to the protection of and litigations on intellectual property rights
The Nikon Group acquires and holds numerous intellectual property rights as it develops products. Insome cases, the Group licenses such intellectual property rights to other companies. Although utmostefforts are being made for the maintenance and protection of these intellectual property rights, there is apossibility that considerable litigation expenses will be incurred should a lawsuit be filed in connection
- 10 -

with an unlicensed use of the Group's intellectual property rights by another company. Further, there is a possibility that other companies, individuals, or entities will file a complaint against the
Nikon Group for an alleged infringement on their intellectual property rights, although the Group is payingadequate attention to avoiding infringing third-party intellectual property rights in conducting product development. Should such a situation occur, there is a possibility that the Group's profit and financialposition will be affected significantly.
(11) Securing key personnel and outflow of human resources and know-how
The Nikon Group is supported by its employees, who possess advanced technical and other expertise andabilities, and securing such human resources is becoming increasingly more important in order to winthrough intense competitions in the market. However, should labor fluidity increase further for somereason, there is a possibility that such key personnel will resign, taking their expertise and know-how with them. In order to minimize such outflow of expertise and know-how, the internal transmission, standardization and sharing of proprietary technologies and skills are being promoted. While it is importantto secure competent human resources locally overseas, it is believed that the risk of an outflow of humanresources is particularly high in regions with high labor fluidity. Since long-term education and training are essential in order to foster human resources given the rapidtechnological renovations in the business that the Group is engaged in, replacing key personnel that departmay be difficult at times and may thus adversely affect the Group's future growth, profit and financialposition.
(12) Information Leaks
The Nikon Group retains such important information as technical information, corporate information, andthe personal information of its customers and other persons concerned. Among other things, the Group isenhancing its internal regulations on the handling of information and educating its employees, whilethoroughly controlling external access to such information and improving the level of storage security.However, in the rare event of leakage of the Group's confidential information, including technicalinformation, there is a possibility that the corporate value of the Nikon Group will be damaged. Further,should corporate or personal information leak out, the Group would not only suffer damages to itscredibility, but would also be subject to claims for compensation from such entities as business partners,customers, employees or other entities suffering the effect of the leak. Should this occur, there is apossibility that the Group's profit and financial position will be affected adversely as tremendous costs willbe necessary for various activities related to the recovery of trust, compensation to subject companies andindividuals, implementation of measures to prevent recurrence, and other necessities.
(13) Defects in products and services
As concerns the Nikon Group's products and services, advanced quality assurance systems are in placewithin Japanese and overseas Group companies, as well as production contractors, in order to providecustomers with highly trustable and sophisticated products. However, in the rare event that a customersuffers a loss due to a defect in a product or service, there is a possibility that profit and financial positionwill be adversely affected, there being the risk that large amounts will be incurred in repair expenses andcosts related to liability, recall, disposal of products and the like, in addition to the decreased desire ofcustomers to purchase the Group's products and services due to a decrease in customer trust in the Nikonbrand.
(14) Occurrence of natural disasters, etc.
Due attention is being paid to measures relating to such natural disasters as earthquakes, fires and flood,and measures to counter the expansion of such infectious diseases as new strains of influenza, with thebusiness continuity plan (BCP) formulated as a part of countermeasures. However, there is the risk thatoperations will be suspended and production and shipment will be delayed, should the Group'sdevelopment or productions sites, suppliers or other relevant parties suffer critical damage. There is apossibility that the Group's profit and financial position will be adversely affected, should net salesdecrease and considerable expenses be incurred for business recovery as a result thereof.
(15) Damages to brand value
The Nikon Group is making utmost efforts to protect and enhance the 'Nikon Brand,' which was fosteredover years of corporate management marked with integrity and provision of products and services that areworthy of customer trust. However, there is a possibility that the Group's profit and financial position willbe adversely affected should trust in the brand decline and the value of the Nikon brand be damaged, as aresult of the circulation of negative reputation or evaluation of the Group's technologies, products orservices.
- 11 -

2. Status of Nikon Group
The Nikon Group is comprised of Nikon Corporation (the Company), its 83 subsidiaries, and 9 affiliates. Whilethe principal operations of the Group are manufacturing and sales relating to the precision equipment, imagingproduct, instruments, and other businesses, it is also engaged in other operations and activities incidental thereto,such as services.
- 12 -

3. Management Policies (1) Company’s Basic Management Policies
The Group sets “Our Aspirations” as follows, under its corporate philosophy of “Trustworthiness andCreativity”.
Our Philosophy “Trustworthiness and Creativity” Our Aspirations “Meeting needs. Exceeding expectations.”
・ Providing customers with new value that exceeds their expectations. ・ Sustaining growth through a break with the past and a passionate commitment by one and all. ・ Maximizing our understanding of light to lead the way towards transformation and a new future. ・ Maintaining integrity in order to contribute to social prosperity
(2) Targeted Management Indices
The Group will make a unified effort to vigorously progress for the achievement of its goal to realize “theNikon Group that keeps on providing new values and generates sustainable growth.”
Continuing to follow the Medium Term Management Plan announced in June 2014, the Group set MediumTerm Management Plan based on the progress of this year and the current business environment, andannounced it in May, 2015.
(3) Medium and Long-term Management Strategies and Issues to be Addressed
Having year 2017 for its 100th anniversary, the Group, henceforth, to continuously grow together based onMedium Term Management Plan, "Next 100 - Transform to Grow", as its fundamental value, will effectmanagement by focusing on the following measures.
・ To constantly provide customers with new value, and further grow the Nikon brand. ・ To realize a Nikon Group with a strong corporate structure to deal with environmental changes withflexibility and a sense of speed. ・ To achieve a solid leading position for existing businesses. ・ To accelerate the nurturing of new businesses, with priority on the areas of the health and medicinefields, and aim to become a company that can offer total solutions. ・ To recognize the importance of Corporate Social Responsibility (CSR), and contribute to the sustainabledevelopment of society.
- 13 -

4. Basic Policy on the Adoption of Accounting Standards The Group, as a goal to improve the international comparability of financial information and the quality of
group management, and also to strengthen its governance, is in the process of various modifications to applyvoluntarily IFRS (International Financial Reporting Standards) from the fiscal year ending March 31, 2017.
- 14 -

5. Consolidated Financial Statements
(1) Consolidated Balance Sheets
(Million yen)
As of March 31, 2014 As of March 31, 2015
Assets
Current assets
Cash and deposits 225,519 262,501 Notes and accounts receivable-trade 128,443 131,554 Merchandise and finished goods 92,792 88,072 Work in process 123,813 121,929 Raw materials and supplies 28,336 29,980 Deferred tax assets 38,373 37,862 Other 15,513 17,774 Allowance for doubtful accounts (3,969) (4,159) Total Current Assets 648,822 685,516 Noncurrent assets
Property, plant and equipment
Buildings and structures 126,082 133,376 Accumulated depreciation (75,469) (80,282) Buildings and structures, net 50,612 53,094 Machinery, equipment and vehicles 208,489 209,496 Accumulated depreciation (150,879) (161,424) Machinery, equipment and vehicles, net 57,609 48,072 Land 15,234 16,142 Lease assets 12,001 9,317 Accumulated depreciation (9,104) (7,444) Lease assets, net 2,896 1,872 Construction in progress 8,407 4,393 Other 81,716 86,149 Accumulated depreciation (57,199) (61,638) Other, net 24,516 24,510 Total property, plant and equipment 159,278 148,085 Intangible assets
Goodwill 3,759 3,076 Other 29,247 25,294 Total intangible assets 33,006 28,370 Investments and other assets
Investment securities 72,742 80,860 Net defined benefit asset 19,266 9,658 Deferred tax assets 7,646 10,152 Other 9,007 10,586 Allowance for doubtful accounts (255) (285)
Total investments and other assets 108,408 110,973 Total noncurrent assets 300,693 287,429 Total assets 949,515 972,945
- 15 -

(Million yen)
As of March 31, 2014 As of March 31, 2015
Liabilities
Current liabilities
Notes and accounts payable-trade 118,841 113,724 Short-term loans payable 14,511 28,600 Current portion of bonds 10,000 ― Lease obligations 1,301 1,011 Accrued expenses 52,272 58,454 Income taxes payable 4,449 5,038 Advances received 46,373 46,489 Provision for product warranties 9,926 9,165 Other 22,499 24,781 Total current liabilities 280,176 287,265 Noncurrent liabilities
Bonds payable 50,000 50,000 Long-term loans payable 49,600 34,600 Lease obligations 1,719 1,285
Deferred tax liabilities 10,356 11,472 Net defined benefit liability 4,674 8,477 Asset retirement obligations 2,755 3,623 Other 3,419 4,020 Total noncurrent liabilities 122,525 113,479 Total liabilities 402,702 400,744
Net assets
Shareholders' equity
Capital stock 65,475 65,475 Capital surplus 80,711 80,711 Retained earnings 384,843 378,515 Treasury stock (12,618) (12,412) Total shareholders' equity 518,412 512,290 Accumulated other comprehensive income Valuation difference on available-for-sale securities 12,859 20,775
Deferred gains or losses on hedges (160) (1,200) Foreign currency translation adjustment 17,424 40,517 Remeasurements of defined benefit plans (2,762) (1,821) Total accumulated other comprehensive income 27,361 58,270 Subscription rights to shares 952 1,132 Minority interests 87 507 Total net assets 546,813 572,200
Total liabilities and net assets 949,515 972,945
- 16 -

(2) Consolidated Statements of Income and Statements of Comprehensive Income
①Consolidated Statements of Income
(Million yen)
Year ended March 31, 2014 Year ended March 31, 2015
Net sales 980,556 857,782
Cost of sales 630,568 532,383
Gross profit 349,987 325,398
Selling, general and administrative expenses 287,046 281,986
Operating income 62,941 43,412
Non-operating income
Interest income 933 1,516 Dividends income 1,139 1,196 Equity in earnings of affiliates 2,328 1,420 Other 4,786 4,855 Total non-operating income 9,187 8,988
Non-operating expenses
Interest expenses 1,351 1,405 Foreign exchange losses 5,486 1,789 Other 3,565 2,837 Total non-operating expenses 10,403 6,032
Ordinary income 61,725 46,368
Extraordinary income
Gain on sales of noncurrent assets 238 91 Gain on sales of investment securities 1,484 4,982 Compensation income for expropriation 15,006 ― Total extraordinary income 16,729 5,073
Extraordinary loss
Loss on sales of noncurrent assets 23 56 Impairment loss 2,319 16,229 Loss on sales of investment securities 11 ― Loss on valuation of investment securities 458 3 Environmental expenses 949 ― Total extraordinary losses 3,763 16,289
Income before income taxes 74,691 35,153
Income taxes-current 11,714 11,006
Income taxes-deferred 16,143 5,728
Total income taxes 27,857 16,735
Income before minority interests 46,834 18,417
Minority interests in income 9 53
Net income 46,824 18,364
- 17 -

②Consolidated Statements of Comprehensive Income
(Million yen)
Year ended March 31, 2014 Year ended March 31, 2015
Income before minority interests 46,834 18,417
Other comprehensive income
Valuation difference on available-for-sale securities 3,396 7,915 Deferred gains or losses on hedges 56 (1,040) Foreign currency translation adjustment 15,288 23,201 Remeasurements of defined benefit plans 275 927 Share of other comprehensive income of associates accounted for using equity method (18) 11
Total other comprehensive income 18,997 31,014
Comprehensive income 65,832 49,432
(Breakdown) Comprehensive income attributable to owners of the parent 65,811 49,271
Comprehensive income attributable to minority interests 20 160
- 18 -
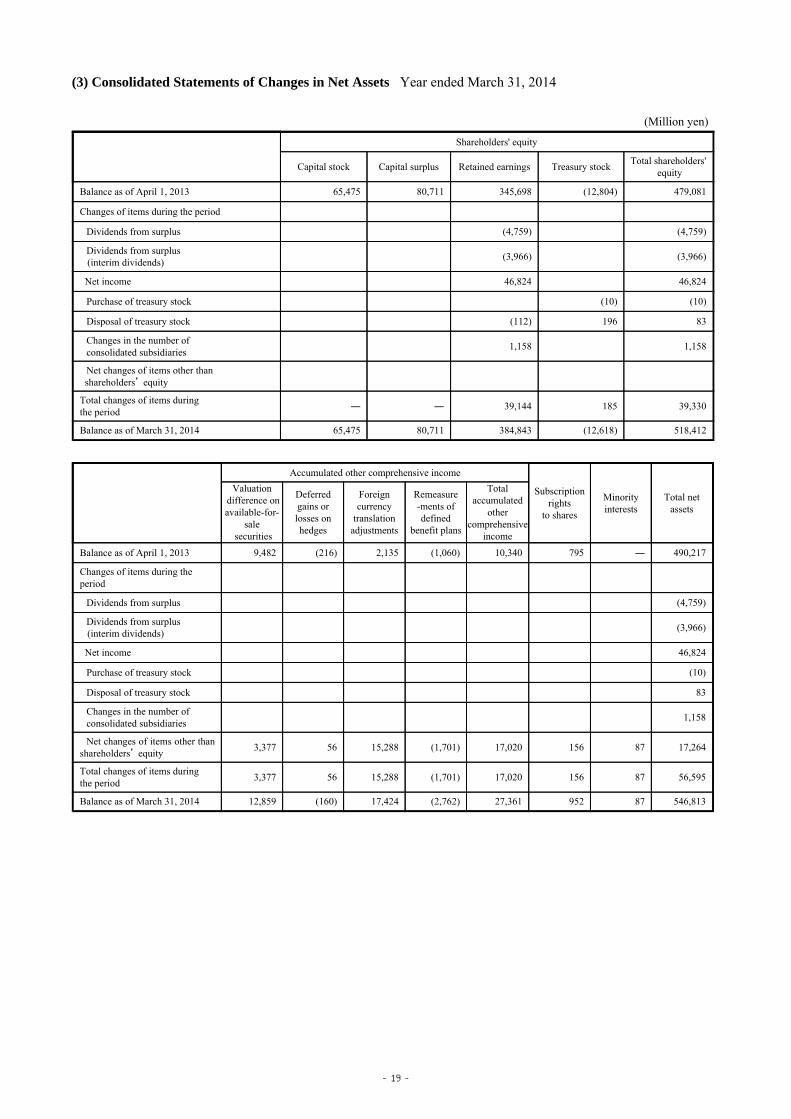
(3) Consolidated Statements of Changes in Net Assets Year ended March 31, 2014
(Million yen)
Shareholders' equity
Capital stock Capital surplus Retained earnings Treasury stock Total shareholders'
equity
Balance as of April 1, 2013 65,475 80,711 345,698 (12,804) 479,081
Changes of items during the period
Dividends from surplus (4,759) (4,759)
Dividends from surplus (interim dividends)
(3,966) (3,966)
Net income 46,824 46,824
Purchase of treasury stock (10) (10)
Disposal of treasury stock (112) 196 83
Changes in the number of consolidated subsidiaries
1,158 1,158
Net changes of items other than shareholders’ equity
Total changes of items during the period
― ― 39,144 185 39,330
Balance as of March 31, 2014 65,475 80,711 384,843 (12,618) 518,412
Accumulated other comprehensive income
Subscription rights
to shares
Minority interests
Total net assets
Valuation difference on available-for-
sale securities
Deferred gains or losses on hedges
Foreign currency
translation adjustments
Remeasure -ments of defined
benefit plans
Total accumulated
other comprehensive
income
Balance as of April 1, 2013 9,482 (216) 2,135 (1,060) 10,340 795 ― 490,217
Changes of items during the period
Dividends from surplus (4,759)
Dividends from surplus (interim dividends) (3,966)
Net income 46,824
Purchase of treasury stock (10)
Disposal of treasury stock 83
Changes in the number of consolidated subsidiaries 1,158
Net changes of items other than shareholders’ equity
3,377 56 15,288 (1,701) 17,020 156 87 17,264
Total changes of items during the period
3,377 56 15,288 (1,701) 17,020 156 87 56,595
Balance as of March 31, 2014 12,859 (160) 17,424 (2,762) 27,361 952 87 546,813
- 19 -

Consolidated Statements of Changes in Net Assets Year ended March 31, 2015
(Million yen)
Shareholders' equity
Capital stock Capital surplus Retained earnings Treasury stock Total shareholders'
equity
Balance as of April 1, 2014 65,475 80,711 384,843 (12,618) 518,412
Cumulative effect of changes in accounting policies
(11,970) (11,970)
Balance as of April 1, 2014 (Restated) 65,475 80,711 372,872 (12,618) 506,441
Changes of items during the period
Dividends from surplus (8,726) (8,726)
Dividends from surplus (interim dividends)
(3,966) (3,966)
Net income 18,364 18,364
Purchase of treasury stock (6) (6)
Disposal of treasury stock (115) 211 96
Changes in the number of consolidated subsidiaries
87 87
Net changes of items other than shareholders’ equity
Total changes of items during the period
― ― 5,643 205 5,848
Balance as of March 31, 2015 65,475 80,711 378,515 (12,412) 512,290
Accumulated other comprehensive income
Subscription rights
to shares
Minority interests
Total net assets
Valuation difference on available-for-
sale securities
Deferred gains or losses on hedges
Foreign currency
translation adjustments
Remeasure -ments of defined
benefit plans
Total accumulated
other comprehensive
income
Balance as of April 1, 2014 12,859 (160) 17,424 (2,762) 27,361 952 87 546,813
Cumulative effect of changes in accounting policies (11,970)
Balance as of April 1, 2014 (Restated) 12,859 (160) 17,424 (2,762) 27,361 952 87 534,842
Changes of items during the period
Dividends from surplus (8,726)
Dividends from surplus (interim dividends) (3,966)
Net income 18,364
Purchase of treasury stock (6)
Disposal of treasury stock 96
Changes in the number of consolidated subsidiaries 87
Net changes of items other than shareholders’ equity
7,915 (1,040) 23,093 940 30,909 179 420 31,509
Total changes of items during the period
7,915 (1,040) 23,093 940 30,909 179 420 37,358
Balance as of March 31, 2015 20,775 (1,200) 40,517 (1,821) 58,270 1,132 507 572,200
- 20 -

(4) Consolidated Statements of Cash Flows
(Million yen)
Year ended March 31, 2014 Year ended March 31, 2015
Net cash provided by (used in) operating activities Income before income tax 74,691 35,153
Depreciation and amortization 42,477 38,458
Impairment loss 2,319 16,229
Increase (decrease) in allowance for doubtful accounts (247) 2
Increase (decrease) in provision for product warranties 1,558 (862)
Increase (decrease) in net defined benefit liability benefits (531) (874)
Interest and dividends income (2,073) (2,712)
Equity in (earnings) losses of affiliates (2,328) (1,420)
Interest expenses 1,351 1,405
Loss on retirement of noncurrent assets (214) (35)
Loss (gain) on sales of investment securities (1,473) (4,982)
Loss (gain) on valuation of investment securities 458 3
Compensation income for expropriation (15,006) ―
Decrease (increase) in notes and accounts receivable-trade 13,924 (3,776)
Decrease (increase) in inventories 34,684 15,103
Increase (decrease) in notes and accounts payable-trade (13,941) (4,891)
Increase (decrease) in advances received (6,125) (4,043)
Other, net (12,298) (2,952)
Subtotal 117,226 79,803
Interest and dividends income received 4,058 4,081
Interest expenses paid (1,322) (1,468)
Income taxes (paid) refund (5,777) (11,107)
Net cash provided by (used in) operating activities 114,185 71,309
Net cash provided by (used in) investing activities Purchase of property, plant and equipment (32,680) (22,337)
Proceeds from sales of property, plant and equipment 737 377
Purchase of investment securities (4,628) (1,027)
Proceeds from sales of investment securities 4,117 6,946
Decrease (increase) in loans receivable 23 (20)
Proceeds from compensation for expropriation 4,491 ―
Other, net (15,255) (8,883)
Net cash provided by (used in) investing activities (43,193) (24,945)
Net cash provided by (used in ) financing activities Net increase (decrease) in short-term loans payable 762 (896)
Proceeds from long-term loans payable 27,000 ―
Repayment of long-term loans payable (5,000) ―
Proceeds from issuance of bonds 19,888 ―
Repayment of bonds ― (10,000)
Cash dividends paid (8,721) (12,685)
Cash dividends paid to minority shareholders ― (35)
Other, net (2,060) (1,337)
Net cash provided by (used in) financing activities 31,868 (24,954)
Effect of exchange rate change on cash and cash equivalents 7,330 14,195
Net increase (decrease) in cash and cash equivalents 110,190 35,605
Cash and cash equivalents at beginning of period 110,094 221,367
Increase in cash and cash equivalents from newly consolidated subsidiary
1,082 2,652
Cash and cash equivalents at end of period 221,367 259,625
- 21 -
(5) Note on Assumptions for Going Concern
Not applicable
(6) Basis of Presenting Consolidated Financial Statements
1. Scope of Consolidation (1) Number of Consolidated subsidiaries: 75 companies
Principal subsidiaries: Tochigi Nikon Corporation, Tochigi Nikon Precision Co., Ltd., Sendai Nikon Corporation, Miyagi Nikon
Precision Co., Ltd., Nikon Imaging Japan Inc., Nikon Instech Co., Ltd., Nikon (Thailand) Co., Ltd., NikonImaging (China) Co., Ltd., Nikon Hong Kong Ltd., Nikon Inc., Nikon Precision Inc., Nikon Europe B.V. andothers.
[Addition: 6 companies] Nikon Imaging Systems Inc., Nikon Lao Co., Ltd., Nikon Middle East FZE, PT NIKON INDONESIA,
Nanjing Nikon Jiangnan Optical Instrument Co., Ltd., Nikon Asia Pacific Pte., Ltd.
[Exclusion: 1 company] LK Investment Ltd.
(2) Non-consolidated subsidiaries: 8 companies
Major company name: Jigtec Corporation Since these companies are small in scale, their combined assets, net sales, net income (the Company’s
interest share) and retained earnings (the Company’s interest share) have a minimal effect on the Company’s consolidated financial statements.
2. Scope of Equity Method (1) Number of Associated Company accounted for by Equity Method: 2 companies
Company names: Nikon-Essilor Co., Ltd., Nikon-Trimble Co., Ltd.
(2) Number of Non-consolidated Company not accounted for by Equity Method: 8 companies Major company name: Jigtec Corporation
(3) Number of Associated Company not accounted for by Equity Method: 7 companies
Major company name: Nihon System Seigyo K.K.
Since these companies are small in scale, net income (the company’s interest share) and retained earnings(the company’s interest share) have a minimal effect on the Company’s consolidated financial statements. They are insignificant in general; therefore, they are not included in the scope of consolidation.
(4) Companies that are in the scope of equity method and have a closing date other than March 31 use financialstatements based on the fiscal year of each company.
3. Fiscal Period of Consolidated Subsidiaries
The statutory closing date of the following companies is December 31, different from the closing date of theCompany, March 31. For those companies, the financial statements based on the tentative financial closing asof March 31 are used for the consolidated financial statements.
Company names: Nikon Imaging (China) Co., Ltd., Nikon Precision Shanghai Co., Ltd., Nikon Imaging(China) Sales Co., Ltd., Nikon (Russia) LLC., Nikon Mexico S.A de C.V., NIKON DO BRASIL LTDA.,Nikon Instruments (Shanghai) Co., Ltd., Hikari Glass (Changzhou) Optics Co., Ltd., Nikon Lao Co., Ltd.,Najing Nikon Jiangnan Optical Instruments Co., Ltd.
(7) Changes in Basis of Presenting Consolidated Financial Statements
1. Changes in Accounting Policies, Accounting Estimates and Restatement of Corrections (Changes in Accounting Policies)
(Application of Accounting Standard for Retirement Benefits and Other)
Effective from the beginning of the fiscal year under review, the Company has applied the “AccountingStandard for Retirement Benefits” (ASBJ Statement No. 26, May 17, 2012; the “Retirement BenefitsAccounting Standard”) and the “Guidance on Accounting Standard for Retirement Benefits” (ASBJ GuidanceNo. 25, May 17, 2012; the “Guidance on Retirement Benefits”), in respect of the provisions stated in Clause 35
- 22 -

of the Retirement Benefits Accounting Standard and Clause 67 of the Guidance on Retirement Benefits,whereby the method of calculating retirement liability and service cost has been reviewed. Based on this review,the method of attributing expected retirement benefits to periods has been changed from straight-line basis tobenefit formula basis, while the method of determining discount rates has been changed from the method wherethe period for bonds, which forms the basis for determining the discount rate, is determined based on theapproximate number of years of the average remaining service period of employees, to the method using asingle weighted average discount rate reflecting the period up to the expected timing of retirement benefitspayment, as well as the amount of retirement benefits payment for each such period.
The Retirement Benefits Accounting Standard and other standards were applied transitionally as determinedin Clause 37 of the Retirement Benefits Accounting Standard and the effect of the change in the method ofcalculating retirement liability and service cost is stated as an adjustment to retained earnings at the beginningof the fiscal year under review.
As a result, net defined benefit asset decreased by 18,349 million yen and net defined benefit liabilityincreased by 237 million yen, while retained earnings decreased by 11,970 million yen, at the beginning of thefiscal year under review. The impact on operating income, ordinary income and income before income taxes forthe year ended March 31, 2015 was minimal.
The effect on per-share data is stated in the relevant section.
(Application of Accounting for Business Combinations and Others) As the “Accounting Standard for Business Combinations” (ASBJ Statement No. 21, September 13, 2013; the
“Business Combinations Accounting Standard”), “Accounting Standard for Consolidated FinancialStatements” (ASBJ Statement No. 22, September 13, 2013; the “Consolidation Accounting Standard”),“Accounting Standard for Business Divestitures (ASBJ Statement No. 7, September 13, 2013; the “BusinessDivestitures Accounting Standard”) and other standards became applicable from the beginning of the fiscalyears commencing on or after April 1, 2014, these accounting standards (except for the provisions stated inClause 39 of the Consolidation Accounting Standard) have been applied from the fiscal year under review,effecting changes in the accounting method to record the difference associated with the changes in equity insubsidiaries remaining under the control of the Company as capital surplus, and to record acquisition-relatedcosts as expenses for the fiscal year in which such costs are incurred. For business combinations implementedon or after the beginning of the fiscal year under review, the accounting method would change to reflect theadjustments to the allocated amount of acquisition costs under the finalization of provisional accountingtreatment in the consolidated financial statements, for the consolidated fiscal year containing the date of suchbusiness combinations.
The Business Combinations Accounting Standard and other standards were applied transitionally asdetermined in Clause 58-2 (4) of the Business Combinations Accounting Standard, Clause 44-5 (4) of theConsolidation Accounting Standard and Clause 57-4 (4) of the Business Divestitures Accounting Standard.Although these standards are applicable from the beginning of the fiscal year under review, they have no impacton the Consolidated Balance Sheet and Consolidated Statements of Income for the fiscal year under review.
In addition, the method of presentation was changed in the Consolidated Statement of Cash Flows, and thecash flows from a purchase or a sale of shares of subsidiaries, which do not bring about a change in the scope ofconsolidation, are presented in "Net cash provided by (used in) financing activities", and cash flows with regardto the expenses related to a purchase of shares of subsidiaries, which bring about a change in the scope ofconsolidation, or the expenses related to a purchase or a sale of shares of subsidiaries, which do not lead achange in the scope of consolidation, are presented in "Net cash provided by (used in) operating activities".However, there was no impact on the Consolidated Statement of Cash Flows for the year ended March 31,2015.
(Changes in Depreciation Method and Useful Lives for Property, Plant and Equipment) For depreciation of property, plant and equipment excluding lease assets, the Company and its domestic
consolidated subsidiaries previously used the declining-line method, except for buildings (excluding attachedfacilities) subject to depreciation by the straight-line method. From the fiscal year under review, however, thedepreciation method has been changed to the straight-line method.
The aforementioned change was based on a series of review over the depreciation method for property, plantand equipment within the Group, in coordination with cost reduction in design and manufacturing processes andfundamental review of production structure, with a view to strengthen the maturing core businesses under theMedium Term Management Plan “Next 100 – Transform to Grow” for the period up to fiscal year 2016. As aresult of the review, it was concluded that the straight-line method shall be adopted from the fiscal year underreview to better reflect the actual usage of property, plant and equipment of the Company and its domesticconsolidated subsidiaries, as generalization of production facilities and leveled production are further promoted,contributing to constant utilization of production facilities over their useful lives.
In coordination with the aforementioned cost reduction in design and manufacturing processes andfundamental review of production structure, the useful lives of the machinery and equipment have been revisedeffective from the fiscal year under review, by estimating the period in which these assets are expected to beeconomically useful in consideration of their usage and operational status.
These changes have minimal impact on operating income, ordinary income and income before income taxesfor the year ended March 31, 2015.
- 23 -

(Changes in Presentation) Changes in Presentation of Deferred Tax Assets and Deferred Tax Liabilities For the fiscal year ended March 31, 2015, deferred tax assets, included in "Other" under investments and
other assets in the previous year, was individually presented in the Consolidated Balance Sheets, as themateriality has increased. The amount of deferred tax liabilities in the previous year was 7,646 million yen.
(Additional Information) Revisions on Deferred Tax Assets and Deferred Tax Liabilities in accordance with the Changes in the
Corporate Tax Rates Pursuant to "Partial Revision of Income Tax Act" (Act No. 9 of 2015) and "Partial Revision of Local Tax
Act" (Act No. 2 of 2015), which were issued on March 31, 2015, reduced corporate tax rates, etc. are appliedfrom the fiscal year starting on and after April 1, 2015. In accordance with this revision, the effective tax rate,applied to the calculation of deferred tax assets and deferred tax liabilities, is changed from 35.6% to 33.1% fortemporary differences which are expected to be settled during the consolidated fiscal year starting April 1,2015, or 32.3% for those which are expected to be settled in the consolidated fiscal year starting April 1, 2016onward.
According to aforementioned changes in the tax rate, deferred tax assets (the net amount with the deferred taxliabilities) decreased by 1,866 million yen and deferred tax expense increased by 2,826 million yen.
- 24 -

(8) Notes to Consolidated Financial Statements 1) Consolidated Statements of Income
1. Principal Items and Amounts under Selling, General and Administrative Expenses
2. Impairment Loss a. Impaired Assets
For Semiconductor Lithography Business Unit of the Precision Equipment Business, investment recovery isno longer expected due to declining revenue, the carrying amount of following noncurrent assets was reduced tothe recoverable amount, and extraordinary loss of 15,220 million yen was recognized as impairment loss.
※1 Tools, Furnitures, and Fixtures are included in "Other " within "Property, Plant and Equipment" of theconsolidated balance sheet. ※2 Long-term Prepaid Expense is included in "Investment and other assets" of the consolidated balance sheet.
As a result of the reviewing on current status of utilization and future prospect of noncurrent assets held by
the Company and its consolidated subsidiaries, 1,009 million yen of impairment loss was recorded as no specificuse is expected in the future for idle assets located mainly in Japan, China, and Thailand.
Types of main idle assets, which were impaired, are buildings and structures of 165 million yen, machinery,equipment and vehicles of 291 million yen, and other noncurrent assets of 552 million yen.
b. Method for Grouping Assets
The assets are grouped by the minimum unit that generates approximately independent cash flow.
c. Method for Measuring Recoverable Amount Recoverable amount is determined by the higher of either net realizable value or value in use. Net realizable value is computed reasonably, based mainly on the revaluated amount of noncurrent assets.
(Million yen)
Fiscal year ended March 31, 2014
(From April 1 2013 to March 31, 2014)
Fiscal year ended March 31, 2015
(From April 1 2014 to March 31, 2015)
Advertising expenses 73,232 70,268
Provision for doubtful debts (128) (71)
Provision for product warranties 4,992 2,984
Salary and allowances 32,965 35,028
Retirement benefit expenses 2,149 3,141
Other personnel expenses 17,332 17,359
Research and development 74,552 66,730
(Million yen)
Place Usage Type Impairment Loss
Kumagaya, Saitama
and others
Assets for Business
Buildings and Structures 2,755
Machinery, Equipment, and Vehicle 6,463
Lease Assets 327
Construction in Progress 1,899
Tools, Furnitures and Fixtures ※1 1,464
Intangible Assets (Except Goodwill) 2,166
Long-term Prepaid Expense ※2 142
Total 15,220
- 25 -

2) Segment Information 1. Outline of business segments reported
The business segments the Group reports are the business units for which the Company is able to obtainrespective financial information separately in order for the Board of Directors to conduct periodicinvestigation to determine distribution of management resources and evaluate their business results.
The Group has introduced the in-house company system since 1999, and each operating division hasaddressed the creation of consistent responsibility system and thoroughness of decentralized operation.However, in order to reflect intention of the management to the business administration more directly andto create a system capable of carrying out fundamental restructuring, from June 27, 2014, the Group wasreorganized to the divisional system directly supervised by the President according to the business field.The divisions were integrated in consideration of similarity, etc., of the economic characteristics, and theGroup remains to have three reportable segments as before: the Precision Equipment Business, the ImagingProducts Business, and the Instruments Business.
The Precision Equipment Business provides products and services of IC steppers and LCD steppers. TheImaging Products Business provides products and services of imaging products and its peripheral domain,such as digital SLR cameras, compact digital cameras and interchangeable camera lenses. The InstrumentsBusiness provides products and services of microscopes, measuring instruments, x-ray/CT inspection systems, etc. 2. Method for calculating the sales, income (loss), assets, and other items for reporting segments
The accounting methods for the reporting business segments are generally those set forth in “MaterialItems Which Form the Basis for Preparation of the Consolidated Financial Statements.” Figures for income of reporting segments are on an operating income basis. Inter-segment sales or transfer are based on current market price. 3. Information on the amounts of sales, income (loss), assets, and other items by reporting segments Fiscal year ended March 31, 2014 (From April 1, 2013 to March 31, 2014)
(Million yen)
Business segments reported
Other 1
Total Adjustment2
Consolidated Statement
of income 3 Precision Equipment
Imaging Products
Instruments Total
Sales
Outside customers 205,446 685,446 64,708 955,601 24,954 980,556 ― 980,556
Inter-segment sales or transfer 500 558 900 1,959 23,267 25,227 (25,227) ―
Total 205,946 686,005 65,609 957,561 48,222 1,005,783 (25,227) 980,556
Segment income (loss) 20,079 64,284 (2,156) 82,207 4,419 86,626 (23,685) 62,941
Segment assets 203,779 242,783 57,263 503,826 98,133 601,959 347,555 949,515
Other items
Depreciation and amortization 9,561 20,724 1,717 32,003 5,774 37,777 4,699 42,477
Increase in tangible/intangible fixed assets
9,730 16,130 1,362 27,224 11,314 38,538 6,933 45,472
Notes: 1. The “Other Business” category incorporates operations not included in business segments reported, including the glass-related business and the customized products business.
2. Adjustment of segment income (loss) refers to elimination of intersegment transactions of 341 million yen and corporateexpenses of minus 24,026 million yen. In addition, segment assets adjustment includes corporate assets not allocated tothe respective reportable segments of 360,425 million yen and elimination of intersegment transactions of minus 12,869million yen. Principal components of corporate assets are surplus funds (cash and deposits) held by the Company and itsconsolidated subsidiaries, long-term investments (investment securities), deferred tax assets, and some intersegment fixedassets.
3. Segment income is adjusted with reported operating income on the consolidated financial statements.
- 26 -

Fiscal year ended March 31, 2015 (From April 1 2014 to March 31, 2015)
(Million yen)
Business segments reported
Other 1 Total Adjustment2
Consolidated Statement
of income 3 Precision Equipment
Imaging Products
Instruments Total
Sales
Outside customers 170,757 586,019 72,381 829,159 28,622 857,782 ― 857,782
Inter-segment sales or transfer 382 474 836 1,692 20,520 22,213 (22,213) ―
Total 171,140 586,493 73,217 830,851 49,143 879,995 (22,213) 857,782
Segment income (loss) 8,355 56,698 1,199 66,253 6,791 73,045 (29,632) 43,412
Segment assets 199,389 224,196 61,520 485,106 67,997 553,104 419,840 972,945
Other items
Depreciation and amortization 7,722 18,814 1,618 28,156 5,800 33,956 4,502 38,458
Increase in tangible/intangible fixed assets
6,034 8,329 1,788 16,152 8,365 24,517 8,032 32,549
Notes: 1. The “Other Business” category incorporates operations not included in business segments reported, including the glass-related business and the customized products business.
2. Adjustment of segment income (loss) refers to elimination of intersegment transactions of 311 million yen and corporateexpenses of minus 29,943 million yen. In addition, segment assets adjustment includes corporate assets not allocated tothe respective reportable segments of 431,709 million yen and elimination of intersegment transactions of minus 11,868million yen. Principal components of corporate assets are surplus funds (cash and deposits) held by the Company and itsconsolidated subsidiaries, long-term investments (investment securities), deferred tax assets, and some intersegment fixedassets.
3. Segment income is adjusted with reported operating income on the consolidated financial statements.
- 27 -

[Related Information]
Fiscal year ended March 31, 2014 (From April 1 2013 to March 31, 2014) 1. Information by geographical area (1) Net Sales
(2) Property, plant and equipment
Fiscal year ended March 31, 2015 (From April 1 2014 to March 31, 2015) 1. Information by geographical area (1) Net Sales
(2) Property, plant and equipment
(Million yen)
Japan USA Europe China Other Total
150,161 222,676 254,036 141,501 212,179 980,556
(Note) Sales information is based on the geographical location of customers, and it is classified by region.
(Million yen)
Japan North America Europe China Thailand Other Total
92,690 6,325 4,459 17,966 36,470 1,366 159,278
(Million yen)
Japan USA Europe China Other Total
122,264 200,600 212,372 120,690 201,853 857,782
(Note) Sales information is based on the geographical location of customers, and it is classified by region.
(Million yen)
Japan North America Europe China Thailand Other Total
78,830 6,734 4,004 17,447 38,881 2,186 148,085
- 28 -

[Information for impairment loss of noncurrent assets by business segments reported]
Fiscal year ended March 31, 2014 (From April 1, 2013 to March 31, 2014)
Fiscal year ended March 31, 2015 (From April 1, 2014 to March 31, 2015)
[Information for amortization of goodwill and balance of goodwill by business segments reported]
Fiscal year ended March 31, 2014 (From April 1, 2013 to March 31, 2014)
Fiscal year ended March 31, 2015 (From April 1, 2014 to March 31, 2015)
[Information for gains on negative goodwill by business segments reported]
Fiscal year ended March 31, 2014 (From April 1, 2013 to March 31, 2014) Not applicable
Fiscal year ended March 31, 2015 (From April 1, 2014 to March 31, 2015) Not applicable
(Million yen)
Business segments reported
Other Corporate or Eliminations
Total Precision Equipment
Imaging Products
Instruments Total
Impairment loss 169 1,815 19 2,004 315 - 2,319
(Million yen)
Business segments reported
Other Corporate or Eliminations Total Precision
Equipment Imaging Products Instruments Total
Impairment loss 15,220 851 - 16,071 158 - 16,229
(Million yen)
Business segments reported
Other Corporate or Eliminations Total Precision
Equipment Imaging Products Instruments Total
Amortization of goodwill for the current fiscal year
― ― 683 683 ― ― 683
Balance of goodwill at fiscal year ended March 31, 2014 ― ― 3,759 3,759 ― ― 3,759
(Million yen)
Business segments reported
Other Corporate or Eliminations Total Precision
Equipment Imaging Products Instruments Total
Amortization of goodwill for the current fiscal year
― ― 683 683 ― ― 683
Balance of goodwill at fiscal year ended March 31, 2015 ― ― 3,076 3,076 ― ― 3,076
- 29 -

3) Per-Share Information
4) Significant Subsequent Events
Not applicable
Fiscal Year Ended March 2014 (From April 1, 2013 to March 31, 2014)
Fiscal Year Ended March 2015 (From April 1, 2014 to March 31, 2015)
(Yen) (Yen) Net assets per share 1,375.92 Net assets per share 1,438.17 Net income per share 118.06 Net income per share 46.29 Net income per share(fully diluted) 117.88 Net income per share(fully diluted) 46.21
Notes: 1. The basis for calculating net income per share and fully diluted net income per share is shown below.
Fiscal Year Ended March 2014
(From April 1, 2013 to March 31, 2014)
Fiscal Year Ended March 2015
(From April 1, 2014 to March 31, 2015)
Net income per share
Net income (million yen) 46,824 18,364
Amount not belonging to common stockholders (million yen)
― ―
Net income related to common stock (million yen)
46,824 18,364
Average shared outstanding (1,000 shares) 396,630 396,695
Net income per share (fully diluted)
Increase in common stock (1,000 shares) 607 750
(Subscription rights to shares) (1,000 shares)
(607) (750)
Latent shares not included in fully diluted net income per share calculation due to lack of dilution effect.
2007 stock options(79 new share subscription rights): 79,000 shares of common stocks
2007 stock options (68 new share subscription rights): 68,000 shares of common stocks
Notes: 2. As stated in “Changes in Accounting Policies,” the Retirement Benefits Accounting Standards was applied transitionally in accordance with Clause 37. As a result, net assets per share of fiscal year ended March 31,2015 decreased by 30.17 yen.
- 30 -

6. Non-Consolidated Financial Statements
(1) Non-Consolidated Balance Sheets
(Million yen)
As of March 31,2014 As of March 31,2015
Assets
Current assets
Cash and deposits 109,636 126,404 Notes receivable-trade 4,464 4,876 Accounts receivable-trade 68,182 72,542 Merchandise and finished goods 36,123 34,574 Work in process 114,966 113,044 Raw materials and supplies 12,083 10,337 Deferred tax assets 25,688 24,904 Other 47,512 36,997 Allowance for doubtful accounts (5) (686) Total current assets 418,651 422,995 Noncurrent assets
Property, plant and equipment
Buildings, net 22,959 22,911 Structures, net 858 766 Machinery and equipment, net 24,195 15,272 Vehicles, net 84 26 Tools, furniture and fixtures, net 6,482 5,764 Land 9,840 9,837 Lease assets, net 2,267 1,332 Construction in progress 7,044 3,579 Total property, plant and equipment 73,734 59,491
- 31 -

(Million yen)
As of March 31,2014 As of March 31,2015
Intangible assets
Software 19,828 16,668 Other 5,246 4,081
Total intangible assets 25,075 20,749 Investments and other assets
Investment securities 60,618 70,054 Stocks of subsidiaries and affiliates 49,931 48,729 Investments in capital 1 1 Investments in capital of subsidiaries and affiliates 14,918 14,786
Long-term loans receivable 14,918 9,826
Prepaid pension cost 19,973 5,100 Deferred tax assets - 3,544 Other 3,416 4,012 Allowance for doubtful accounts (9) (9)
Total investments and other assets 163,769 156,047 Total noncurrent assets 262,579 236,287 Total assets 681,230 659,283
- 32 -
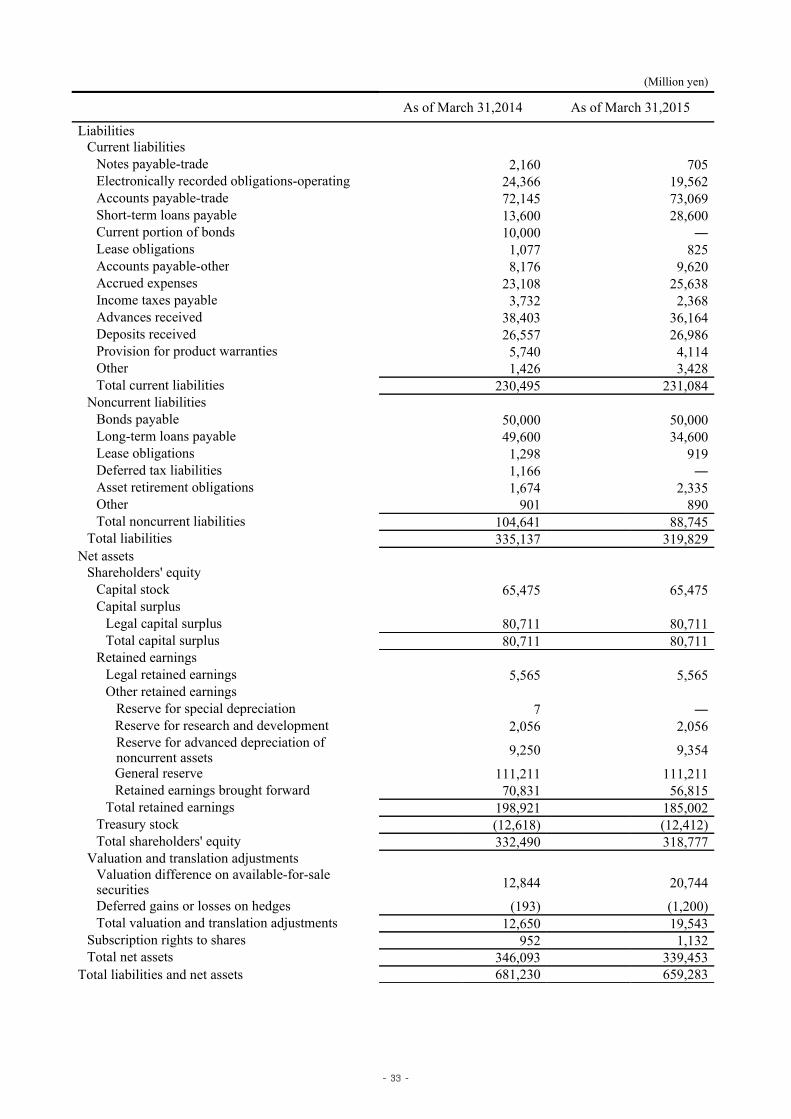
(Million yen)
As of March 31,2014 As of March 31,2015
Liabilities Current liabilities Notes payable-trade 2,160 705 Electronically recorded obligations-operating 24,366 19,562 Accounts payable-trade 72,145 73,069 Short-term loans payable 13,600 28,600 Current portion of bonds 10,000 ― Lease obligations 1,077 825 Accounts payable-other 8,176 9,620 Accrued expenses 23,108 25,638 Income taxes payable 3,732 2,368 Advances received 38,403 36,164 Deposits received 26,557 26,986 Provision for product warranties 5,740 4,114 Other 1,426 3,428 Total current liabilities 230,495 231,084 Noncurrent liabilities Bonds payable 50,000 50,000 Long-term loans payable 49,600 34,600 Lease obligations 1,298 919 Deferred tax liabilities 1,166 ― Asset retirement obligations 1,674 2,335 Other 901 890 Total noncurrent liabilities 104,641 88,745 Total liabilities 335,137 319,829Net assets Shareholders' equity Capital stock 65,475 65,475 Capital surplus Legal capital surplus 80,711 80,711 Total capital surplus 80,711 80,711 Retained earnings Legal retained earnings 5,565 5,565 Other retained earnings Reserve for special depreciation 7 ― Reserve for research and development 2,056 2,056 Reserve for advanced depreciation of noncurrent assets 9,250 9,354
General reserve 111,211 111,211 Retained earnings brought forward 70,831 56,815 Total retained earnings 198,921 185,002 Treasury stock (12,618) (12,412) Total shareholders' equity 332,490 318,777 Valuation and translation adjustments Valuation difference on available-for-sale securities 12,844 20,744
Deferred gains or losses on hedges (193) (1,200) Total valuation and translation adjustments 12,650 19,543 Subscription rights to shares 952 1,132 Total net assets 346,093 339,453Total liabilities and net assets 681,230 659,283
- 33 -

(2) Non-Consolidated Statements of Income
(Million yen)
Year ended March 31,2014 Year ended March 31,2015
Net sales 716,863 607,556
Cost of sales 545,682 465,887
Gross profit 171,180 141,668
Selling, general and administrative expenses 138,371 134,349
Operating income 32,809 7,319
Non-operating income
Interest and dividends income 11,253 21,604 Other 4,322 3,822
Total non-operating income 15,575 25,427
Non-operating expenses
Interest expenses 957 1,161 Other 9,198 3,362 Total non-operating expenses 10,156 4,524
Ordinary income 38,228 28,223
Extraordinary income
Gain on sales of noncurrent assets 150 229 Gain on sales of investment securities 1,484 4,982 Compensation income for expropriation 14,926 ― Total extraordinary income 16,561 5,211
Extraordinary loss
Loss on sales of noncurrent assets 0 1 Impairment loss 601 15,555 Loss on sales of investment securities 8 ― Loss on valuation of investment securities 458 ―
Loss on sales of stocks of subsidiaries and affiliates 3 ―
Loss on business of subsidiaries and affiliates ― 3,267 Environmental expenses 103 ― Total extraordinary losses 1,175 18,823
Income before income taxes 53,615 14,610
Income taxes-current 5,353 4,387
Income taxes-deferred 15,482 90
Total income taxes 20,835 4,477
Net income 32,780 10,133
- 34 -

(3) Non-Consolidated Statement of Changes in Net Assets Year ended March 31, 2014
(Million yen)
Shareholders' equity
Capital stock
Capital surplus
Retained earnings
Legal capital surplus
Legal retained earnings
Other retained earnings
Total retained earnings
Reserve for special
depreciation
Reserve for research and development
Reserve for advanced
depreciation of noncurrent
assets
General reserve
Retained earnings brought forward
Balance as of April 1,2013 65,475 80,711 5,565 15 2,056 4,764 111,211 51,367 174,979
Changes of items during the period
Reversal of reserve for special depreciation (7) 7 -
Provision of reserve for advanced depreciation of noncurrent assets 4,851 (4,851) -
Reversal of reserve for advanced depreciation of noncurrent assets (365) 365 -
Dividends from surplus (4,759) (4,759)
Dividends from surplus ( Interim dividends ) (3,966) (3,966)
Net income 32,780 32,780
Purchase of treasury stock
Disposal of treasury stock (112) (112)
Net changes of items other than Shareholders' equity
Total changes of items during the period - - - (7) - 4,485 - 19,463 23,942
Balance as of March 31,2014 65,475 80,711 5,565 7 2,056 9,250 111,211 70,831 198,921
Shareholders' equity Valuation and translation adjustments
Subscription rights to shares
Total net assets
Treasury stock Total
shareholders'equity
Valuation difference
on available-for-sale
securities
Deferred gains or losses on hedges
Total valuation and
translation adjustments
Balance as of April 1,2013 (12,804) 308,362 9,460 (250) 9,210 795 318,369
Changes of items during the period
Reversal for special depreciation - -
Provision of reserve for advanced depreciation of noncurrent assets - -
Reversal of reserve for advanced depreciation of noncurrent assets - -
Dividends from surplus (4,759) (4,759)
Dividends from surplus ( Interim dividends ) (3,966) (3,966)
Net income 32,780 32,780
Purchase of treasury stock (10) (10) (10)
Disposal of treasury stock 196 83 83
Net changes of items other than Shareholders' equity 3,383 56 3,440 156 3,596
Total changes of items during the period 185 24,127 3,383 56 3,440 156 27,724
Balance as of March 31,2014 (12,618) 332,490 12,844 (193) 12,650 952 346,093
- 35 -

Year ended March 31, 2015
(Million yen)
Shareholders' equity
Capital stock
Capital surplus
Retained earnings
Legal capital surplus
Legal retained earnings
Other retained earnings
Total retained earnings
Reserve for special
depreciation
Reserve for research and development
Reserve for advanced
depreciation of noncurrent
assets
General reserve
Retained earnings brought forward
Balance as of April 1, 2014 65,475 80,711 5,565 7 2,056 9,250 111,211 70,831 198,921
Cumulative effect of changes in accounting policies (11,243) (11,243)
Balance as of April 1, 2014 (Restated) 65,475 80,711 5,565 7 2,056 9,250 111,211 59,587 187,677
Changes of items during the period
Reversal of reserve for special depreciation (7) 7 -
Provision of reserve for advanced depreciation of noncurrent assets 2,601 (2,601) -
Reversal of reserve for advanced depreciation of noncurrent assets (2,497) 2,497 -
Dividends from surplus (8,726) (8,726)
Dividends from surplus ( Interim dividends ) (3,966) (3,966)
Net income 10,133 10,133
Purchase of treasury stock
Disposal of treasury stock (115) (115)
Net changes of items other than Shareholders' equity
Total changes of items during the period - - - (7) - 104 - (2,771) (2,675)
Balance as of March 31,2015 65,475 80,711 5,565 - 2,056 9,354 111,211 56,815 185,002
Shareholders' equity Valuation and translation adjustments
Subscription rights to shares
Total net assets
Treasury stock Total
shareholders'equity
Valuation difference
on available-for- sale securities
Deferred gains or losses on hedges
Total valuation and
translation adjustments
Balance as of April 1,2014 (12,618) 332,490 12,844 (193) 12,650 952 346,093
Cumulative effect of changes in accounting policies (11,243) (11,243)
Balance as of April 1, 2014 (Restated) (12,618) 321,246 12,844 (193) 12,650 952 334,850
Changes of items during the period
Reversal for special depreciation - -
Provision of reserve for advanced depreciation of noncurrent assets - -
Reversal of reserve for advanced depreciation of noncurrent assets - -
Dividends from surplus (8,726) (8,726)
Dividends from surplus ( Interim dividends ) (3,966) (3,966)
Net income 10,133 10,133
Purchase of treasury stock (6) (6) (6)
Disposal of treasury stock 211 96 96
Net changes of items other than Shareholders' equity 7,900 (1,007) 6,893 179 7,072
Total changes of items during the period 205 (2,469) 7,900 (1,007) 6,893 179 4,603
Balance as of March 31,2015 (12,412) 318,777 20,744 (1,200) 19,543 1,132 339,453
- 36 -