consolidated financial statements for the years ended
TRANSCRIPT
1
XL Insurance (Bermuda) Ltd
Consolidated Financial Statements
For The Years Ended
December 31, 2009 and 2008
2
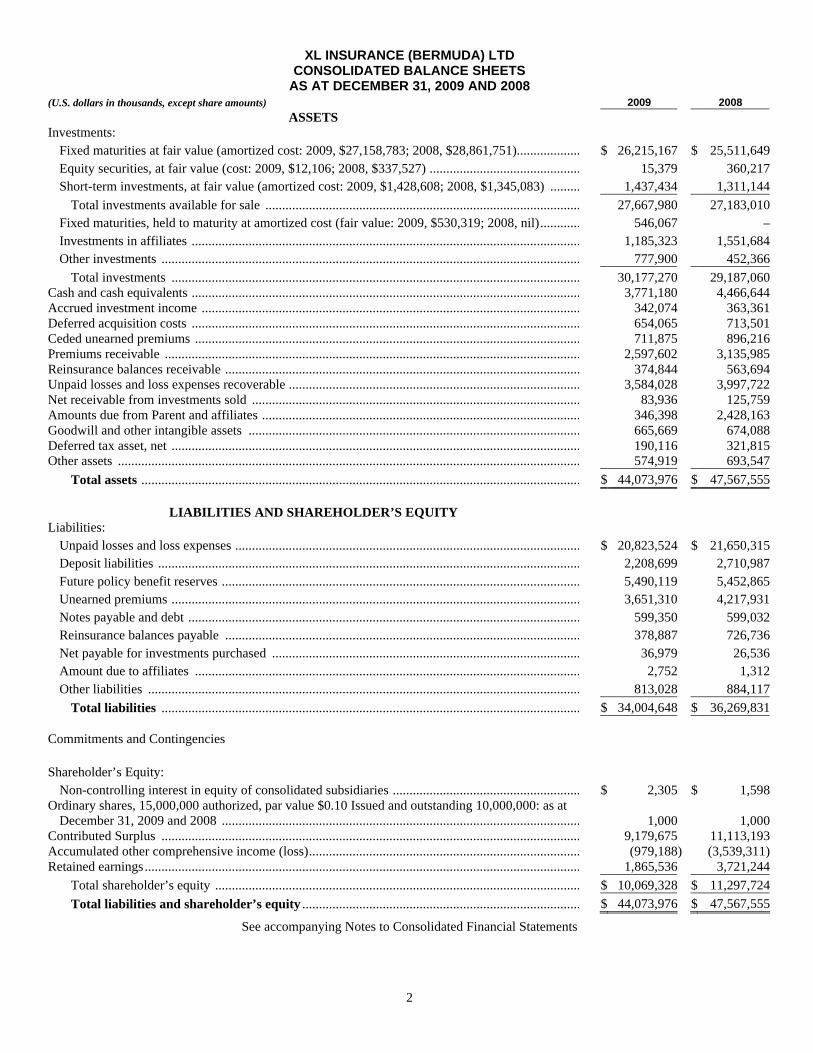
XL INSURANCE (BERMUDA) LTD CONSOLIDATED BALANCE SHEETS
AS AT DECEMBER 31, 2009 AND 2008 (U.S. dollars in thousands, except share amounts) 2009 2008
ASSETS Investments:
Fixed maturities at fair value (amortized cost: 2009, $27,158,783; 2008, $28,861,751)............................... $ 26,215,167 $ 25,511,649 Equity securities, at fair value (cost: 2009, $12,106; 2008, $337,527) ......................................................... 15,379 360,217 Short-term investments, at fair value (amortized cost: 2009, $1,428,608; 2008, $1,345,083) ..................... 1,437,434 1,311,144
Total investments available for sale ................................................................................................ 27,667,980 27,183,010 Fixed maturities, held to maturity at amortized cost (fair value: 2009, $530,319; 2008, nil)........................ 546,067 – Investments in affiliates ................................................................................................................................ 1,185,323 1,551,684 Other investments ................................................................................................................................ 777,900 452,366
Total investments ................................................................................................................................ 30,177,270 29,187,060 Cash and cash equivalents ................................................................................................................................ 3,771,180 4,466,644 Accrued investment income ............................................................................................................................. 342,074 363,361 Deferred acquisition costs ................................................................................................................................ 654,065 713,501 Ceded unearned premiums ............................................................................................................................... 711,875 896,216 Premiums receivable ................................................................................................................................ 2,597,602 3,135,985 Reinsurance balances receivable ...................................................................................................................... 374,844 563,694 Unpaid losses and loss expenses recoverable ................................................................................................ 3,584,028 3,997,722 Net receivable from investments sold .............................................................................................................. 83,936 125,759 Amounts due from Parent and affiliates ................................................................................................ 346,398 2,428,163 Goodwill and other intangible assets ............................................................................................................... 665,669 674,088 Deferred tax asset, net ................................................................................................................................ 190,116 321,815 Other assets ...................................................................................................................................................... 574,919 693,547
Total assets ............................................................................................................................................... $ 44,073,976 $ 47,567,555
LIABILITIES AND SHAREHOLDER’S EQUITY Liabilities:
Unpaid losses and loss expenses ................................................................................................................... $ 20,823,524 $ 21,650,315 Deposit liabilities ................................................................................................................................ 2,208,699 2,710,987 Future policy benefit reserves ....................................................................................................................... 5,490,119 5,452,865 Unearned premiums ................................................................................................................................ 3,651,310 4,217,931 Notes payable and debt ................................................................................................................................ 599,350 599,032 Reinsurance balances payable ...................................................................................................................... 378,887 726,736 Net payable for investments purchased ................................................................................................ 36,979 26,536 Amount due to affiliates ............................................................................................................................... 2,752 1,312 Other liabilities ............................................................................................................................................. 813,028 884,117
Total liabilities ................................................................................................................................ $ 34,004,648 $ 36,269,831 Commitments and Contingencies Shareholder’s Equity:
Non-controlling interest in equity of consolidated subsidiaries ................................................................ $ 2,305 $ 1,598 Ordinary shares, 15,000,000 authorized, par value $0.10 Issued and outstanding 10,000,000: as at
December 31, 2009 and 2008 ....................................................................................................................... 1,000 1,000 Contributed Surplus ................................................................................................................................ 9,179,675 11,113,193 Accumulated other comprehensive income (loss)............................................................................................. (979,188) (3,539,311) Retained earnings.............................................................................................................................................. 1,865,536 3,721,244
Total shareholder’s equity ......................................................................................................................... $ 10,069,328 $ 11,297,724 Total liabilities and shareholder’s equity ............................................................................................... $ 44,073,976 $ 47,567,555
See accompanying Notes to Consolidated Financial Statements
3
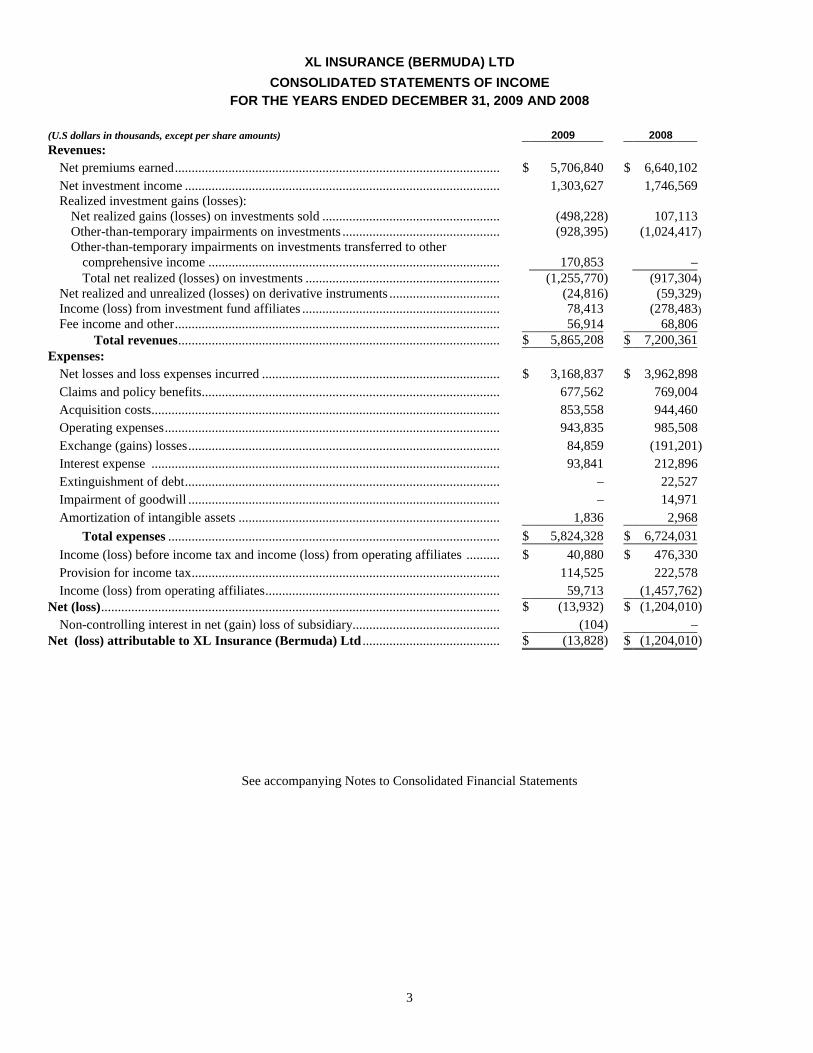
XL INSURANCE (BERMUDA) LTD
CONSOLIDATED STATEMENTS OF INCOME FOR THE YEARS ENDED DECEMBER 31, 2009 AND 2008
(U.S dollars in thousands, except per share amounts) 2009 2008 Revenues:
Net premiums earned......................................................................................................... $ 5,706,840 $ 6,640,102 Net investment income ................................................................................................ 1,303,627 1,746,569 Realized investment gains (losses):
Net realized gains (losses) on investments sold ................................................................ (498,228) 107,113 Other-than-temporary impairments on investments ................................................................ (928,395) (1,024,417) Other-than-temporary impairments on investments transferred to other
comprehensive income ................................................................................................ 170,853 – Total net realized (losses) on investments ................................................................ (1,255,770) (917,304)
Net realized and unrealized (losses) on derivative instruments ................................................................ (24,816) (59,329) Income (loss) from investment fund affiliates ................................................................ 78,413 (278,483) Fee income and other................................................................................................................................ 56,914 68,806
Total revenues................................................................................................................................ $ 5,865,208 $ 7,200,361 Expenses:
Net losses and loss expenses incurred ............................................................................... $ 3,168,837 $ 3,962,898 Claims and policy benefits................................................................................................ 677,562 769,004 Acquisition costs................................................................................................................ 853,558 944,460 Operating expenses............................................................................................................ 943,835 985,508 Exchange (gains) losses................................................................................................ 84,859 (191,201) Interest expense ................................................................................................................ 93,841 212,896 Extinguishment of debt................................................................................................ – 22,527 Impairment of goodwill ................................................................................................ – 14,971 Amortization of intangible assets ...................................................................................... 1,836 2,968
Total expenses ........................................................................................................... $ 5,824,328 $ 6,724,031 Income (loss) before income tax and income (loss) from operating affiliates .................. $ 40,880 $ 476,330 Provision for income tax................................................................................................ 114,525 222,578 Income (loss) from operating affiliates.............................................................................. 59,713 (1,457,762)
Net (loss)............................................................................................................................... $ (13,932) $ (1,204,010) Non-controlling interest in net (gain) loss of subsidiary.................................................... (104) –
Net (loss) attributable to XL Insurance (Bermuda) Ltd ................................................. $ (13,828) $ (1,204,010)
See accompanying Notes to Consolidated Financial Statements
4
XL INSURANCE (BERMUDA) LTD
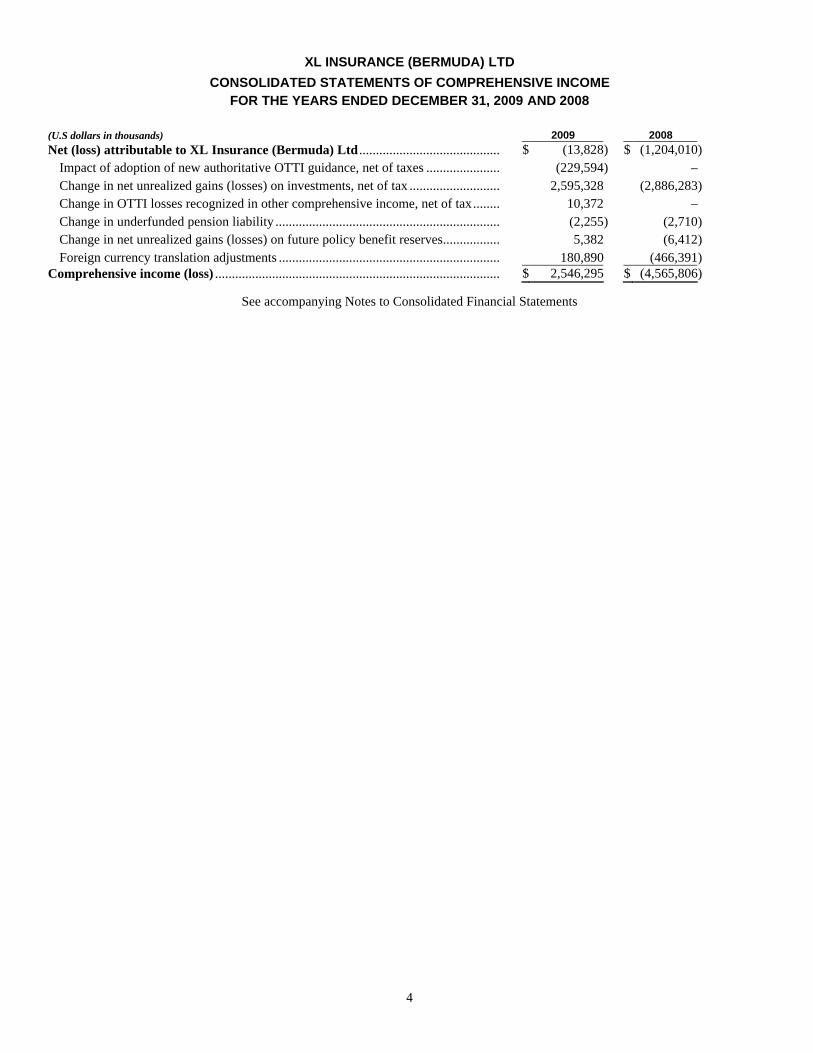
CONSOLIDATED STATEMENTS OF COMPREHENSIVE INCOME FOR THE YEARS ENDED DECEMBER 31, 2009 AND 2008
(U.S dollars in thousands) 2009 2008 Net (loss) attributable to XL Insurance (Bermuda) Ltd .................................................. $ (13,828) $ (1,204,010)
Impact of adoption of new authoritative OTTI guidance, net of taxes .............................. (229,594) – Change in net unrealized gains (losses) on investments, net of tax ................................ 2,595,328 (2,886,283) Change in OTTI losses recognized in other comprehensive income, net of tax................ 10,372 – Change in underfunded pension liability ........................................................................... (2,255) (2,710) Change in net unrealized gains (losses) on future policy benefit reserves......................... 5,382 (6,412) Foreign currency translation adjustments .......................................................................... 180,890 (466,391)
Comprehensive income (loss) ............................................................................................. $ 2,546,295 $ (4,565,806)
See accompanying Notes to Consolidated Financial Statements
5
XL INSURANCE (BERMUDA) LTD
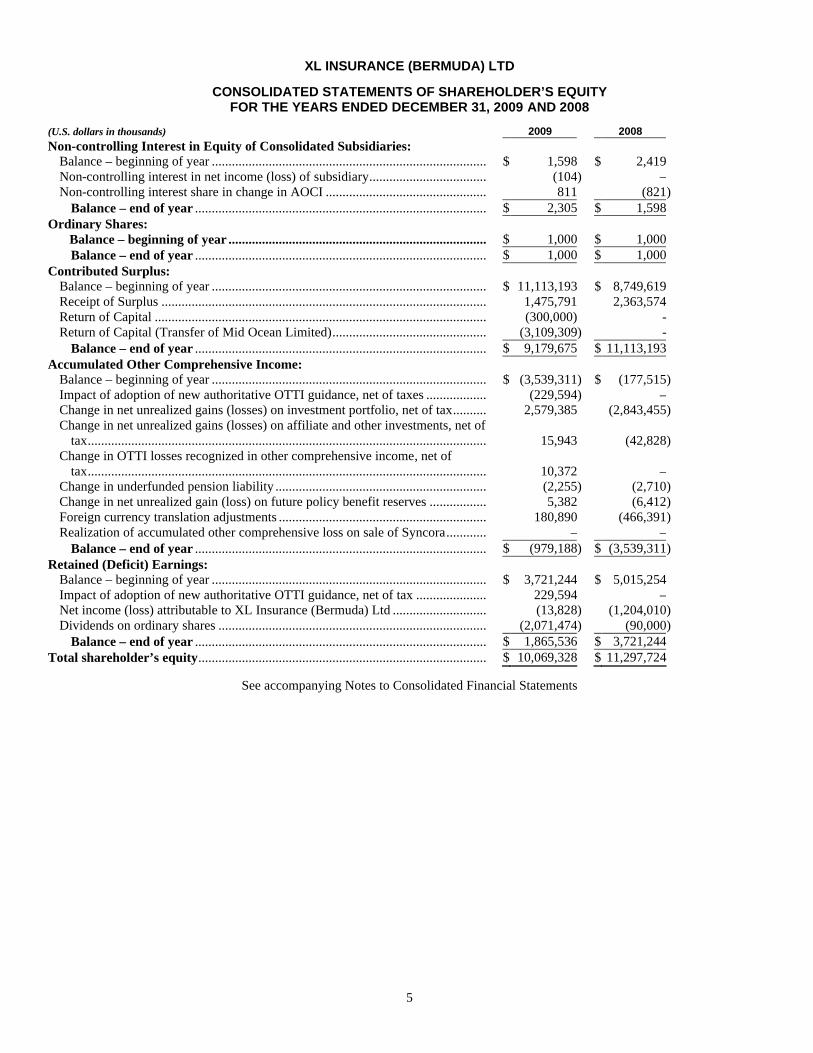
CONSOLIDATED STATEMENTS OF SHAREHOLDER’S EQUITY FOR THE YEARS ENDED DECEMBER 31, 2009 AND 2008
(U.S. dollars in thousands) 2009 2008 Non-controlling Interest in Equity of Consolidated Subsidiaries:
Balance – beginning of year .................................................................................. $ 1,598 $ 2,419 Non-controlling interest in net income (loss) of subsidiary................................... (104) – Non-controlling interest share in change in AOCI ................................................ 811 (821)
Balance – end of year ....................................................................................... $ 2,305 $ 1,598 Ordinary Shares:
Balance – beginning of year ............................................................................. $ 1,000 $ 1,000 Balance – end of year ....................................................................................... $ 1,000 $ 1,000
Contributed Surplus: Balance – beginning of year .................................................................................. $ 11,113,193 $ 8,749,619 Receipt of Surplus ................................................................................................. 1,475,791 2,363,574 Return of Capital ................................................................................................... (300,000) - Return of Capital (Transfer of Mid Ocean Limited).............................................. (3,109,309) -
Balance – end of year ....................................................................................... $ 9,179,675 $ 11,113,193 Accumulated Other Comprehensive Income:
Balance – beginning of year .................................................................................. $ (3,539,311) $ (177,515) Impact of adoption of new authoritative OTTI guidance, net of taxes .................. (229,594) – Change in net unrealized gains (losses) on investment portfolio, net of tax.......... 2,579,385 (2,843,455) Change in net unrealized gains (losses) on affiliate and other investments, net of
tax....................................................................................................................... 15,943 (42,828) Change in OTTI losses recognized in other comprehensive income, net of
tax....................................................................................................................... 10,372 – Change in underfunded pension liability ............................................................... (2,255) (2,710) Change in net unrealized gain (loss) on future policy benefit reserves ................. 5,382 (6,412) Foreign currency translation adjustments .............................................................. 180,890 (466,391) Realization of accumulated other comprehensive loss on sale of Syncora............ – –
Balance – end of year ....................................................................................... $ (979,188) $ (3,539,311) Retained (Deficit) Earnings:
Balance – beginning of year .................................................................................. $ 3,721,244 $ 5,015,254 Impact of adoption of new authoritative OTTI guidance, net of tax ..................... 229,594 – Net income (loss) attributable to XL Insurance (Bermuda) Ltd ............................ (13,828) (1,204,010) Dividends on ordinary shares ................................................................................ (2,071,474) (90,000)
Balance – end of year ....................................................................................... $ 1,865,536 $ 3,721,244 Total shareholder’s equity...................................................................................... $ 10,069,328 $ 11,297,724
See accompanying Notes to Consolidated Financial Statements
6
XL INSURANCE (BERMUDA) LTD
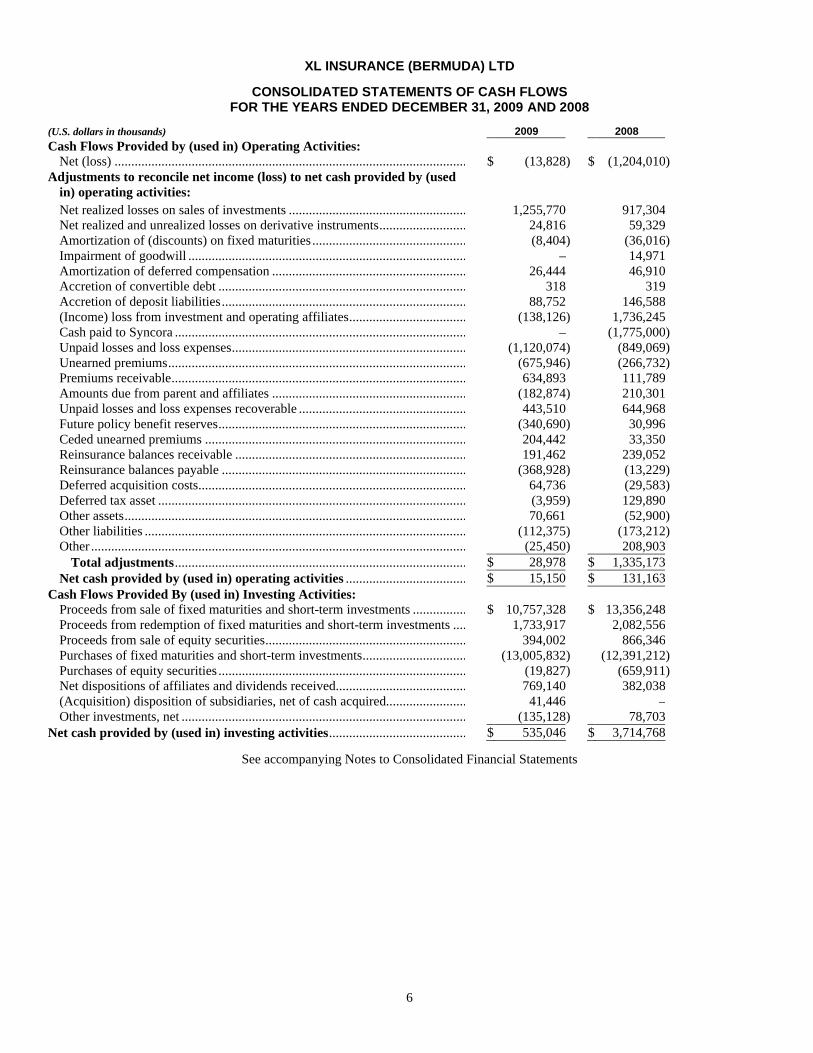
CONSOLIDATED STATEMENTS OF CASH FLOWS FOR THE YEARS ENDED DECEMBER 31, 2009 AND 2008
(U.S. dollars in thousands) 2009 2008 Cash Flows Provided by (used in) Operating Activities:
Net (loss) ............................................................................................................ $ (13,828) $ (1,204,010) Adjustments to reconcile net income (loss) to net cash provided by (used
in) operating activities: Net realized losses on sales of investments ........................................................ 1,255,770 917,304 Net realized and unrealized losses on derivative instruments............................. 24,816 59,329 Amortization of (discounts) on fixed maturities ................................................. (8,404) (36,016) Impairment of goodwill ...................................................................................... – 14,971 Amortization of deferred compensation ............................................................. 26,444 46,910 Accretion of convertible debt ............................................................................. 318 319 Accretion of deposit liabilities............................................................................ 88,752 146,588 (Income) loss from investment and operating affiliates...................................... (138,126) 1,736,245 Cash paid to Syncora .......................................................................................... – (1,775,000) Unpaid losses and loss expenses......................................................................... (1,120,074) (849,069) Unearned premiums............................................................................................ (675,946) (266,732) Premiums receivable........................................................................................... 634,893 111,789 Amounts due from parent and affiliates ............................................................. (182,874) 210,301 Unpaid losses and loss expenses recoverable ..................................................... 443,510 644,968 Future policy benefit reserves............................................................................. (340,690) 30,996 Ceded unearned premiums ................................................................................. 204,442 33,350 Reinsurance balances receivable ........................................................................ 191,462 239,052 Reinsurance balances payable ............................................................................ (368,928) (13,229) Deferred acquisition costs................................................................................... 64,736 (29,583) Deferred tax asset ............................................................................................... (3,959) 129,890 Other assets......................................................................................................... 70,661 (52,900) Other liabilities ................................................................................................ (112,375) (173,212) Other ................................................................................................................... (25,450) 208,903
Total adjustments.......................................................................................... $ 28,978 $ 1,335,173 Net cash provided by (used in) operating activities ....................................... $ 15,150 $ 131,163
Cash Flows Provided By (used in) Investing Activities: Proceeds from sale of fixed maturities and short-term investments ................... $ 10,757,328 $ 13,356,248 Proceeds from redemption of fixed maturities and short-term investments ....... 1,733,917 2,082,556 Proceeds from sale of equity securities............................................................... 394,002 866,346 Purchases of fixed maturities and short-term investments................................ (13,005,832) (12,391,212) Purchases of equity securities ............................................................................. (19,827) (659,911) Net dispositions of affiliates and dividends received.......................................... 769,140 382,038 (Acquisition) disposition of subsidiaries, net of cash acquired........................... 41,446 – Other investments, net ........................................................................................ (135,128) 78,703
Net cash provided by (used in) investing activities............................................ $ 535,046 $ 3,714,768
See accompanying Notes to Consolidated Financial Statements
7
XL INSURANCE (BERMUDA) LTD
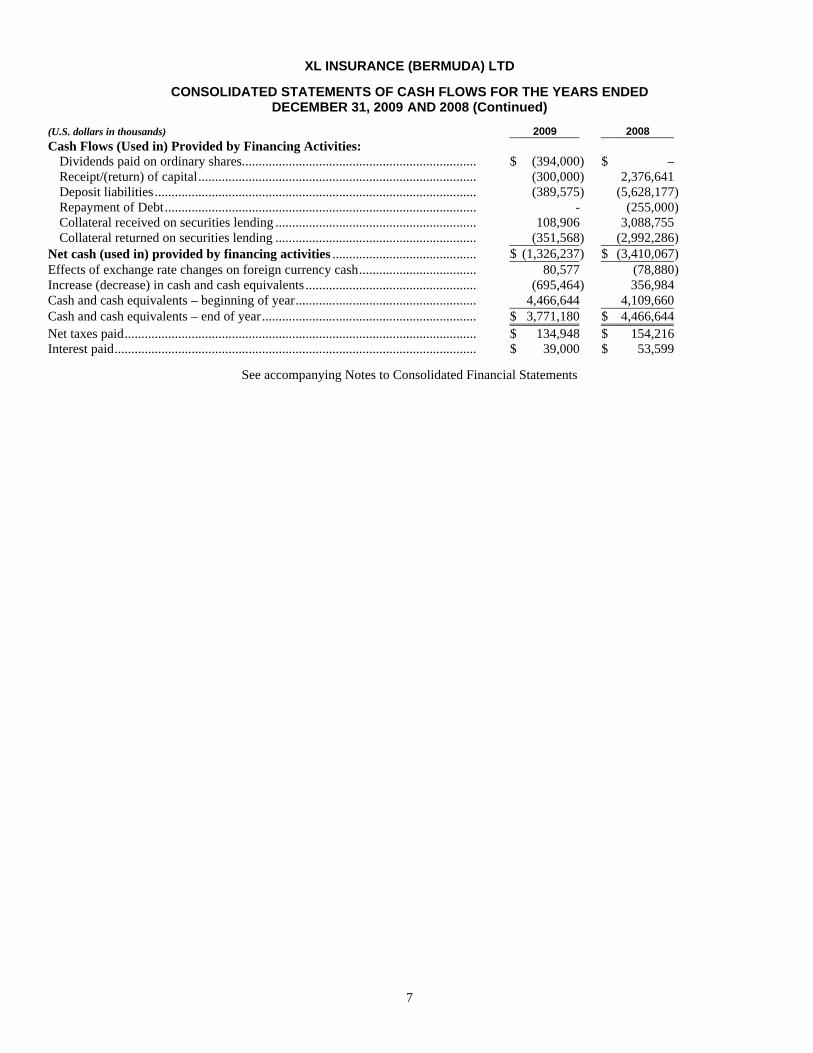
CONSOLIDATED STATEMENTS OF CASH FLOWS FOR THE YEARS ENDED DECEMBER 31, 2009 AND 2008 (Continued)
(U.S. dollars in thousands) 2009 2008 Cash Flows (Used in) Provided by Financing Activities:
Dividends paid on ordinary shares...................................................................... $ (394,000) $ – Receipt/(return) of capital................................................................................... (300,000) 2,376,641 Deposit liabilities ................................................................................................ (389,575) (5,628,177) Repayment of Debt............................................................................................. - (255,000) Collateral received on securities lending ............................................................ 108,906 3,088,755 Collateral returned on securities lending ............................................................ (351,568) (2,992,286)
Net cash (used in) provided by financing activities ........................................... $ (1,326,237) $ (3,410,067) Effects of exchange rate changes on foreign currency cash................................... 80,577 (78,880) Increase (decrease) in cash and cash equivalents ................................................... (695,464) 356,984 Cash and cash equivalents – beginning of year...................................................... 4,466,644 4,109,660 Cash and cash equivalents – end of year................................................................ $ 3,771,180 $ 4,466,644 Net taxes paid......................................................................................................... $ 134,948 $ 154,216 Interest paid............................................................................................................ $ 39,000 $ 53,599
See accompanying Notes to Consolidated Financial Statements
8
XL INSURANCE (BERMUDA) LTD
NOTES TO CONSOLIDATED FINANCIAL STATEMENTS FOR THE YEARS ENDED DECEMBER 31, 2009 AND 2008
1. Nature of Operations
XL Insurance (Bermuda) Ltd and its operating subsidiaries (collectively the “Company” or “XL”), are leading providers of insurance and reinsurance coverages to industrial, commercial and professional firms, insurance companies and other enterprises on a worldwide basis. The Company and its various subsidiaries operate globally in 24 countries, through its three business segments: Insurance, Reinsurance and Life Operations.
As of December 31, 2009 the ownership of Mid Ocean Limited, a company registered in the Cayman Islands, was transferred from XL Capital (the Company’s ultimate parent) to the Company. The consideration paid for Mid Ocean Limited was $3.1 Billion and was in the form of the forgiveness of debt of $2.7 Billion and the assignment to XL Capital of a receivable owed to the Company by its parent company, EXEL Holdings, of $0.4 Billion. Mid Ocean Limited is the parent of the XL Re Limited and Ridgewood Holdings group of companies. As a result of this reorganization the Company now is the ultimate parent of all the operating units within the XL Capital Group. The impact of the above transaction on the Company’s Consolidated Net Income and Comprehensive Income was as follows:
(U.S. dollars in thousands) 2009 2008 Pre Transaction
Net Income ......................................................................................................... $ (67,063) $ (1,674,284) Comprehensive Income ...................................................................................... 701,988 (2,575,418)
Post Transaction Net Income ......................................................................................................... (13,828) (1,204,010) Comprehensive Income ...................................................................................... 2,546,295 (4,565,806)
Given the nature of related party transactions, there can be no assurance that these transactions have been conducted at arms-length.
Insurance Operations
The Company’s Insurance segment provides commercial property, casualty and specialty insurance products on a global basis. Products generally provide tailored coverages for complex corporate risks and include the following lines of business: property, casualty, professional liability, environmental liability, aviation and satellite, marine and offshore energy, equine, fine art and specie, excess and surplus lines and other insurance coverages including program business.
Property and casualty products are typically written as global insurance programs for large multinational companies and institutions and include umbrella liability, product recall, U.S. workers’ compensation, property catastrophe and primary master property and liability coverages. Property and casualty products generally provide large capacity on a primary, quota share or excess of loss basis. In North America, the casualty business written includes primary, umbrella and high layer excess business. The primary casualty programs (including workers’ compensation) generally require customers to take large deductibles or self-insured retentions. For the umbrella and excess business written, the Company’s liability attaches after large deductibles, including self insurance or insurance from other companies. Outside of North America, casualty business is generally written on a primary or excess basis. Policies are written on an occurrence, claims-made and occurrence reported basis. The Company’s property business written, which also includes construction projects, is short-tail by nature and written on both a primary and excess of loss basis. Property business written includes exposures to man-made and natural disasters, and generally, loss experience is characterized as low frequency and high severity. In addition to the property and casualty products noted above, in 2008 the Company launched underwriting capabilities for the Upper Middle Markets (“UMM”) in the U.S., U.K. and Continental Europe. These units are focused on providing underwriting expertise and tailored insurance solutions for the UMM customers through focused distribution channels of select regional retail brokers.
Professional liability insurance includes directors’ and officers’ liability, errors and omissions liability and employment practices liability coverages. Policies are written on both a primary and excess of loss basis. Directors’ and officers’ coverage includes primary and excess directors’ and officers’ liability, employment practices liability, company securities and private company directors’ and officers’ liability. Employment practices liability is written primarily for very large corporations on an excess of loss basis and covers those firms for legal liability in regard to the treatment of employees. Errors and omissions coverage is written on a primary and excess basis.
Environmental liability products include pollution and remediation legal liability, general and project-specific pollution and professional liability, commercial general property redevelopment and contractor’s pollution liability. Business is written for both single and multiple years on a primary or excess of loss, claims-made or, less frequently, occurrence basis. The Company also offers commercial general liability and automobile liability insurance to environmental businesses.
9
XL INSURANCE (BERMUDA) LTD
NOTES TO CONSOLIDATED FINANCIAL STATEMENTS (Continued) FOR THE YEARS ENDED DECEMBER 31, 2009 AND 2008
1. Nature of Operations (Continued)
Insurance Operations (Continued)
Aviation and satellite products include comprehensive airline hull and liability, airport liability, aviation manufacturers’ product liability, aviation ground handler liability, large aircraft hull and liability, corporate non-owned aircraft liability, space third party liability and satellite risk including damage or malfunction during ascent to orbit and continual operation, and aviation war. Aviation liability and physical damage coverage is offered for large aviation risks on a proportional basis, while smaller general aviation risks are offered on a primary basis. Satellite risks are generally written on a proportional basis.
Marine and offshore energy, equine and fine art and specie insurance are also provided by the Company. Marine and energy coverage includes marine hull and machinery, marine war, marine excess liability, cargo and offshore energy insurance. Equine products specialize in providing bloodstock, livestock and aquaculture insurance. Fine art and specie coverages include fine art, jewelers block, cash in transit and related coverages for financial institutions.
Excess and surplus lines products include both general liability and property coverages. For general liability, most Insurance Services Office, Inc. (“ISO”) products are written. For property, limits are relatively low and coverages exclude flood, earthquake and difference in conditions. In 2009 the Company decided to stop offering property coverages.
The Company’s program business specializes in insurance coverages for distinct market segments in North America, including program administrators and managing general agents who operate in a specialized market niche and have unique industry backgrounds or specialized underwriting capabilities. Products encompass automobile extended warranty and other property and casualty coverages. The Company implemented an exit strategy to exit the automobile extended warranty business in 2009.
Certain structured indemnity products, previously structured by XL Financial Solutions (“XLFS”), are included within the results of the Insurance segment covering a range of insurance risks including property and casualty insurance, certain types of residual exposures and other market risk management products. In August 2008, the Company ceased certain operations that included the closure of the XLFS business unit and reassignment of responsibility for existing structured indemnity business to either the Insurance or Reinsurance segment depending on the underlying nature of the transactions.
Also included as part of the Insurance segment is XL Global Asset Protection Services (“XL GAPS”), a fee for service loss prevention consulting service which offers individually tailored risk management solutions to risk managers, insurance brokers and insurance company clients operating on a global basis.
The excess nature of many of the Company’s insurance products, coupled with historically large policy limits, results in a book of business that can have losses characterized as low frequency and high severity. As a result, large losses, though infrequent, can have a significant impact on the Company’s results of operations, financial condition and liquidity. The Company attempts to mitigate this risk by, among other things, using strict underwriting guidelines, effective risk management practices (e.g., monitoring of aggregate exposures) and various reinsurance arrangements, discussed below.
The Company has decided to follow the guidelines of the U.S. Terrorism Risk Insurance Act of 2002 (“TRIA”), as amended, established the Terrorism Risk Insurance Program (“TRIP”) which became effective on November 26, 2002 and was a three-year federal program effective through 2005. On December 22, 2005, President George W. Bush signed a bill extending TRIA (“TRIAE”) for two more years, continuing TRIP through 2007. On December 26, 2007, a bill was signed, the Terrorism Risk Insurance Program Reauthorization Act of 2007 (“TRIPRA”), which further extended TRIP for 7 years until December 31, 2014 and also eliminated the distinction between foreign and domestic acts of terrorism.
The Company had, prior to the passage of TRIP and the related legislation, underwritten exposures under certain insurance policies that included coverage for terrorism. The passage of TRIP and the related legislation has required the Company to make a mandatory offer of “Certified” terrorism coverage with respect to relevant covered insurance policies as specified under the related legislation. In addition, the Company underwrites a limited number of policies providing terrorism coverage that are not subject to TRIA.
Reinsurance Operations
The Company’s Reinsurance segment provides casualty, property risk (including energy and engineering), property catastrophe, marine, aviation, and other specialty reinsurance on a global basis with business being written on both a proportional and non-proportional basis and in certain limited instances on a direct basis.
10
XL INSURANCE (BERMUDA) LTD
NOTES TO CONSOLIDATED FINANCIAL STATEMENTS (Continued) FOR THE YEARS ENDED DECEMBER 31, 2009 AND 2008
1. Nature of Operations (Continued)
Reinsurance Operations (Continued)
Business written on a non-proportional basis generally provides for an indemnification by the Company to the ceding company for a portion of losses both individually and in the aggregate, on policies with limits in excess of a specified individual or aggregate loss deductible. For business written on a proportional bases including “quota share” or “surplus” basis, the Company receives an agreed percentage of the premium and is liable for the same percentage of each and all incurred loss. For proportional business, the ceding company normally receives a ceding commission for the premiums ceded and may also, under certain circumstances, receive a profit commission. Occasionally this commission could be on a sliding scale depending on the loss ratio performance in which case there is generally no profit commission. The Company’s casualty reinsurance includes general liability, professional liability, automobile and workers’ compensation. Professional liability includes directors’ and officers’, employment practices, medical malpractice, and environmental liability. Casualty lines are written as treaties, programs as well as on an individual risk basis and on both a proportional and a non-proportional basis. The treaty business includes clash programs which cover a number of underlying policies involved in one occurrence or a judgment above an underlying policy’s limit, before suffering a loss.
The Company’s property business, primarily short-tail in nature, is written on both a portfolio/treaty and individual/facultative basis and includes property catastrophe, property risk excess of loss and property proportional. A significant portion of the property business underwritten consists of large aggregate exposures to man-made and natural disasters and, generally, loss experience is characterized as low frequency and high severity.
The Company seeks to manage its reinsurance exposures to catastrophic events by limiting the amount of exposure written in each geographic or peril zone worldwide, underwriting in excess of varying attachment points and requiring that contracts exposed to catastrophe loss include aggregate limits. The Company also seeks to protect its total aggregate exposures by peril and zone through the purchase of reinsurance programs.
The Company’s property catastrophe reinsurance account is generally “all risk” in nature. As a result, the Company is exposed to losses from sources as diverse as hurricanes and other windstorms, earthquakes, freezing, riots, floods, industrial explosions, fires, and many other potential natural or man-made disasters.
In accordance with market practice, the Company’s policies generally exclude certain risks such as war, nuclear contamination or radiation. Following the terrorist attacks at the World Trade Center in New York City, in Washington, D.C. and in Pennsylvania on September 11, 2001 (collectively, “the September 11 event”), terrorism cover, including NBRC has been restricted or excluded in many territories and classes. Some U.S. states make it mandatory to provide some cover for “Fire Following” terrorism and some countries make terrorism coverage mandatory. The Company’s predominant exposure under such coverage is to property damage.
The Company had, prior to the passing of TRIA, underwritten reinsurance exposures in the U.S. that included terrorism coverage. Since the passage of TRIA in the U.S., together with the TRIAE and TRIPRA extensions noted above, the Company has underwritten a very limited number of stand-alone terrorism coverage policies in addition to coverage included within non-stand-alone policies. In the U.S., in addition to NBRC acts, the Company generally excludes coverage included under TRIA from the main catastrophe exposed policies. In other cases, both within and outside the U.S., the Company generally relies on either a terrorism exclusion clause, which does not include personal lines, excluding NBRC, or a similar clause that excludes terrorism completely. There are a limited number of classes underwritten where no terrorism exclusion exists.
Property catastrophe reinsurance provides coverage on an excess of loss basis when aggregate losses and loss adjustment expenses from a single occurrence of a covered event exceed the attachment point specified in the policy. Some of the Company’s property catastrophe contracts limit coverage to one occurrence in any single policy year, but most contracts generally enable at least one reinstatement to be purchased by the reinsured.
The Company also writes property risk excess of loss reinsurance. Property risk excess of loss reinsurance covers a loss to the reinsured on a single risk of the type reinsured rather than to aggregate losses for all covered risks on a specific peril, as is the case with catastrophe reinsurance. The Company’s property proportional account includes reinsurance of direct property insurance. The Company seeks to limit the catastrophe exposure from its proportional and per risk excess business through extensive use of occurrence and cession limits.
Other specialty reinsurance products include energy, marine, aviation, space, engineering, fidelity, trade credit, and political risk. The Company underwrites a small portfolio of contracts covering political risk and trade credit. Exposure is assumed from a limited number of trade credit contracts.
11
XL INSURANCE (BERMUDA) LTD
NOTES TO CONSOLIDATED FINANCIAL STATEMENTS (Continued) FOR THE YEARS ENDED DECEMBER 31, 2009 AND 2008
1. Nature of Operations (Continued)
Life Operations
During 2009, the Company completed a strategic review of its life reinsurance business. In relation to this initiative, the Company sold the renewal rights to its Continental European short-term life, accident and health business in December 2008. The Company also announced in March 2009 that it would run-off its existing book of U.K. and Irish traditional life and annuity business, and not accept new business. In addition, during July 2009, the Company entered into an agreement to sell its U.S. life reinsurance business. The transaction closed during the fourth quarter of 2009. In December 2009, the Company entered into an agreement to novate and recapture a number of U.K. and Irish term assurance and critical illness treaties. The transaction closed during the fourth quarter of 2009.
The Life Operations segment provides life reinsurance on business written by life insurance companies, principally to help them manage mortality, morbidity, survivorship, investment and lapse risks.
Products offered included a broad range of underlying lines of life insurance business, including term assurances, group life, critical illness cover, immediate annuities and disability income. In addition, prior to selling the renewal rights, the products offered included short-term life, accident and health business. The segment also covers a range of geographic markets, with an emphasis on the U.K., U.S., Ireland and Continental Europe.
The portfolio has three particularly significant components:
1) The portfolio includes a small number of large contracts relating to closed blocks of U.K. and Irish fixed annuities in payment. In relation to certain of these contracts, the Company receives cash and investment assets at the inception of the reinsurance contract, relating to the future policy benefit reserves assumed. These contracts are long-term in nature, and the expected claims payout period can span up to 30 or 40 years with average duration of around 10 years. The Company is exposed to investment and survivorship risk over the life of these arrangements.
2) The second component of the portfolio relates to life risks (in the U.S., U.K. and Ireland) and critical illness risks (in the U.K. and Ireland) where the Company is exposed to the mortality, morbidity and lapse experience from the underlying business, over the medium to long-term.
3) The third component relates to the annually renewable business covering life, accident and health risks written in Continental Europe. These contracts are short-term in nature and include both proportional and non-proportional reinsurance structures. While the renewal rights for this business have been sold, the existing business remains with the Company.
Other Financial Lines
The Other Financial Lines Business is comprised of remaining contracts associated with the funding agreement (“FA”) business and previously included the guaranteed investment contract (“GIC”) business. GICs and FAs provide users guaranteed rates of interest on amounts previously invested with the Company. FAs are very similar to GICs in that they have known cash flows. FAs were sold to institutional investors, typically through medium term note programs. At December 31, 2009, the remaining balance of FAs, excluding accrued interest of $6.5 million, was $450 million, with settlements scheduled for $450 million in August 2010.
Reinsurance Ceded
a) Insurance Operations In certain cases, the risks assumed by the Company in the Insurance segment are partially reinsured with third party reinsurers.
Reinsurance ceded varies by location and line of business based on a number of factors, including market conditions.
The Company uses reinsurance to support the underwriting and retention guidelines of each of its subsidiaries as well as to control the aggregate exposure of the Company to a particular risk or class of risks. Reinsurance is purchased at several levels ranging from reinsurance of risks assumed on individual contracts to reinsurance covering the aggregate exposure on a portfolio of policies issued by groups of companies.
b) Reinsurance Operations
The Company uses third party reinsurance to support the underwriting and retention guidelines of each reinsurance subsidiary as well as seeking to limit the aggregate exposure of the Company to a particular risk or class of risks. Reinsurance is purchased at several levels ranging from reinsurance of risks assumed on individual contracts to reinsurance covering the aggregate exposures.
12
XL INSURANCE (BERMUDA) LTD
NOTES TO CONSOLIDATED FINANCIAL STATEMENTS (Continued) FOR THE YEARS ENDED DECEMBER 31, 2009 AND 2008
1. Nature of Operations (Continued)
Reinsurance Ceded (Continued)
Reinsurance ceded varies by location and line of business based on factors including, among others, market conditions and the credit worthiness of the counterparty.
Effective January 1, 2008, the Company entered into a quota share reinsurance treaty with a newly-formed Bermuda reinsurance company, Cyrus Re II. Pursuant to the terms of the quota share reinsurance treaty, Cyrus Re II assumed a 10% cession of certain lines of property catastrophe reinsurance and retrocession business underwritten by certain operating subsidiaries of the Company for business that incepted between January 1, 2008 and July 1, 2008. In connection with such cessions, the Company paid Cyrus Re II reinsurance premium less a ceding commission, which included a reimbursement of direct acquisition expenses incurred by the Company as well as a commission to the Company for generating the business. The quota share reinsurance treaty also provided for a profit commission payable to the Company. The quota share with Cyrus Re II was canceled after its original term and not renewed.
The Company’s traditional catastrophe retrocession program was renewed in June 2009 to cover certain of the Company’s exposures. These protections, in various layers and in excess of varying attachment points according to the territory exposed, assist in managing the Company’s net retention to an acceptable level. The Company has co-reinsurance retentions within this program. The Company renewed additional structures with a restricted territorial scope for 12 months at July 2009. The Company continued to buy additional protection for the Company’s marine and offshore energy exposures. These covers provide protection in various layers and excess of varying attachment points according to the scope of cover provided. The Company has co-reinsurance participations within this program.
The Company continues to buy specific reinsurances on its credit and bond, motor third party liability, property and aviation portfolios to manage its net exposures in these classes.
2. Significant Accounting Policies
(a) Basis of Preparation and Consolidation
These consolidated financial statements include the accounts of the Company and all of its subsidiaries. These consolidated financial statements have been prepared in accordance with accounting principles generally accepted in the United States of America (“GAAP”). To facilitate period-to-period comparisons, certain reclassifications have been made to prior year consolidated financial statement amounts to conform to current year presentation. There was no effect on net income from this change in presentation.
The re-organization of the company discussed in Note 1 has impacted the basis of how these financial statements have been prepared. The transfer of Mid Ocean Limited from XL Capital to the Company is a transfer of a related party/common control transaction as Mid Ocean Limited and the Company are both wholly owned subsidiaries of XL Capital. These financial statements are in effect those of a new reporting entity as the two commonly controlled entities have not previously been presented together. As such, the financial statements have been prepared retrospectively combining the entities for the years ended December 31, 2009 and December 31, 2008 as if the combination had been in effect since the inception of common control.
The preparation of financial statements in conformity with GAAP requires management to make estimates and assumptions that affect the reported amount of assets and liabilities and disclosure of contingent assets and liabilities at the date of the financial statements and the reported amounts of revenues and expenses during the reporting period. The Company’s most significant areas of estimation include:
? unpaid losses and loss expenses and unpaid losses and loss expenses recoverable; ? future policy benefit reserves; ? valuation of certain derivative instruments; ? valuation and other than temporary impairments of investments; ? income taxes; ? reinsurance premium estimates; and ? goodwill carrying value
While management believes that the amounts included in the consolidated financial statements reflect the Company’s best estimates and assumptions, actual results could differ from these estimates. The Company has performed an evaluation of subsequent events through April 30, 2010, which is the date the financial statements were issued.
13
XL INSURANCE (BERMUDA) LTD
NOTES TO CONSOLIDATED FINANCIAL STATEMENTS (Continued) FOR THE YEARS ENDED DECEMBER 31, 2009 AND 2008
2. Significant Accounting Policies (Continued)
(b) Fair Value Measurements
Financial Instruments subject to Fair Value Measurements
Accounting guidance over fair value measurements requires that a fair value measurement reflect the assumptions market participants would use in pricing an asset or liability based on the best information available. Assumptions include the risks inherent in a particular valuation technique (such as a pricing model) and/or the risks inherent in the inputs to the model. The fair value of a financial instrument is the amount that would be received to sell an asset or paid to transfer a liability in an orderly transaction between market participants at the measurement date (the “exit price”). Instruments that the Company owns (“long positions”) are marked to bid prices and instruments that the Company has sold but not yet purchased (“short positions”) are marked to offer prices. Fair value measurements are not adjusted for transaction costs.
Basis of Fair Value Measurement
Fair value measurements accounting guidance also establishes a fair value hierarchy that prioritizes the inputs to the respective valuation techniques used to measure fair value. The hierarchy gives the highest priority to unadjusted quoted prices in active markets for identical assets or liabilities (Level 1 measurements) and the lowest priority to unobservable inputs (Level 3 measurements). An asset or liability’s classification within the fair value hierarchy is based on the lowest level of significant input to its valuation. The three levels of the fair value hierarchy are described further below:
? Level 1–Quoted prices in active markets for identical assets or liabilities (unadjusted); no blockage factors.
? Level 2–Other observable inputs (quoted prices in markets that are not active or inputs that are observable either directly or indirectly)–include quoted prices for similar assets/liabilities (adjusted) other than quoted prices in Level 1; quoted prices in markets that are not active; or other inputs that are observable or can be derived principally from or corroborated by observable market data for substantially the full term of the assets or liabilities.
? Level 3–Unobservable inputs that are supported by little or no market activity and are significant to the fair value of the assets or liabilities. Unobservable inputs reflect the reporting entity’s own assumptions about the assumptions that market participants would use in pricing the asset or liability. Level 3 assets and liabilities include financial instruments whose values are determined using pricing models, discounted cash flow methodologies, or similar techniques, as well as instruments for which the determination of fair value requires significant management judgment or estimation.
Details on assets and liabilities that have been included under the requirements of authoritative guidance on fair value measurements to illustrate the bases for determining the fair values of these items held by the Company are detailed in each respective significant accounting policy section of this note.
Fair values of investments and derivatives are based on published market values if available, estimates of fair values of similar issues, estimates of fair values provided by independent pricing services or, in limited circumstances, estimates of fair values determined by the Company. Fair values of financial instruments for which quoted market prices are not available or for which the company believes current trading conditions represent distressed markets are based on estimates using present value or other valuation techniques. The fair values estimated using such techniques are significantly affected by the assumptions used, including the discount rates and the estimated amounts and timing of future cash flows. In such instances, the derived fair value estimates cannot be substantiated by comparison to independent markets and are not necessarily indicative of the amounts that would be realized in a current market exchange.
(c) Total Investments
Investments Available For Sale
Investments that are considered available for sale (comprised of the Company’s fixed maturities, equity securities and short-term investments) are carried at fair value. The fair values for available for sale investments are generally sourced from third parties. The fair value of fixed income securities is based upon quoted market values where available, “evaluated bid” prices provided by third party pricing services (“pricing services”) where quoted market values are not available, or by reference to broker or underwriter bid indications where pricing services do not provide coverage for a particular security. To the extent the Company believes current trading conditions represent distressed transactions, the Company may elect to utilize internally generated models. The pricing services use market approaches to valuations using primarily Level 2 inputs in the vast majority of valuations, or some form of discounted cash flow
14
XL INSURANCE (BERMUDA) LTD
NOTES TO CONSOLIDATED FINANCIAL STATEMENTS (Continued) FOR THE YEARS ENDED DECEMBER 31, 2009 AND 2008
2. Significant Accounting Policies (Continued)
(c) Total Investments (Continued)
analysis, to obtain investment values for a small percentage of fixed income securities for which they provide a price. Pricing services indicate that they will only produce an estimate of fair value if there is objectively verifiable information available to produce a valuation. Standard inputs to the valuations provided by the pricing services listed in approximate order of priority for use when available include: reported trades, benchmark yields, broker/dealer quotes, issuer spreads, two-sided markets, benchmark securities, bids, offers, and reference data. The pricing services may prioritize inputs differently on any given day for any security, and not all inputs listed are available for use in the evaluation process on any given day for each security evaluation; however, the pricing services also monitor market indicators, industry and economic events. Information of this nature is a trigger to acquire further corroborating market data. When these inputs are not available, they identify “buckets” of similar securities (allocated by asset class types, sectors, sub-sectors, contractual cash flows/structure, and credit rating characteristics) and apply some form of matrix or other modeled pricing to determine an appropriate security value which represents their best estimate as to what a buyer in the marketplace would pay for a security in a current sale. While the Company receives values for the majority of the investment securities it holds from pricing services, it is ultimately management’s responsibility to determine whether the values received and recorded in the financial statements are representative of appropriate fair value measurements. It is common industry practice to utilize pricing services as a source for determining the fair values of investments where the pricing services are able to obtain sufficient market corroborating information to allow them to produce a valuation at a reporting date. In addition, in the majority of cases, although a value may be obtained from a particular pricing service for a security or class of similar securities, these values are corroborated against values provided by other pricing services.
Broker quotations are used to value fixed maturities where prices are unavailable from pricing services due to factors specific to the security such as limited liquidity, lack of current transactions, or trades only taking place in privately negotiated transactions. These are considered Level 3 valuations, as significant inputs utilized by brokers may be difficult to corroborate with observable market data, or sufficient information regarding the specific inputs utilized by the broker was not obtained to support a Level 2 classification.
Prices provided by independent pricing services and independent broker quotes can vary widely even for the same security. The use of different methodologies and assumptions may have a material effect on the estimated fair value amounts. During periods of market disruption including periods of significantly rising or high interest rates, rapidly widening credit spreads or illiquidity, it may be difficult to value certain of the Company’s securities, for example, collateralized loan obligations (“CLOs”), Alt-A and sub-prime mortgage backed securities, if trading becomes less frequent and/or market data becomes less observable. There may be certain asset classes that were in active markets with significant observable data that become illiquid due to the current financial environment. In such cases, more securities may fall to Level 3 meaning that more subjectivity and management judgment is required with regard to fair value. As such, valuations may include inputs and assumptions that are less observable or require greater estimation as well as valuation methods which are more sophisticated or require greater estimation, thereby resulting in values which may be different than the value at which the investments may be ultimately sold.
The net unrealized gain or loss on investments, net of tax, is included in “accumulated other comprehensive income (loss).”
Short-term investments comprise investments with a remaining maturity of less than one year and are valued using the same external factors and in the same manner as fixed income securities.
Equity securities include investments in open end mutual funds and shares of publicly traded alternative funds. The fair value of equity securities is based upon quoted market values (Level 1), or monthly net asset value statements provided by the investment managers upon which subscriptions and redemptions can be executed (Level 2).
All investment transactions are recorded on a trade date basis. Realized gains and losses on sales of equities and fixed income investments are determined on the basis of average cost. Investment income is
15
XL INSURANCE (BERMUDA) LTD
NOTES TO CONSOLIDATED FINANCIAL STATEMENTS (Continued) FOR THE YEARS ENDED DECEMBER 31, 2009 AND 2008
2. Significant Accounting Policies (Continued)
(c) Total Investments (Continued)
recognized when earned and includes interest and dividend income together with the amortization of premium and discount on fixed maturities and short-term investments. Amortization of discounts on fixed maturities includes amortization to expected recovery values for investments which have previously been recorded as other than temporarily impaired. For mortgage-backed securities, and any other holdings for which there is a prepayment risk, prepayment assumptions are evaluated and revised as necessary. Prepayment fees or call premiums that are only payable to the Company when a security is called prior to its maturity are earned when received and reflected in net investment income.
Investments Held to Maturity
Investments classified as held to maturity include securities for which the Company has the ability and intent to hold to maturity and are carried at amortized cost. During the current year, certain securities were transferred from an available for sale designation into held to maturity. For details see Note 9, “Investments”.
Investment in Affiliates
Investments in which the Company has significant influence over the operating and financial policies of the investee are classified as investments in affiliates on the Company’s balance sheet and are accounted for under the equity method of accounting. Under this method, the Company records its proportionate share of income or loss from such investments in its results for the period as well as its portion of movements in certain of the investee shareholders’ equity balances. When financial statements of the affiliate are not available on a timely basis to record the Company’s share of income or loss for the same reporting periods as the Company, the most recently available financial statements are used. This lag in reporting is applied consistently.
The Company records its alternative and private fund affiliates on a one month and three month lag, respectively, and its operating affiliates on a three month lag. Significant influence is generally deemed to exist where the Company has an investment of 20% or more in the common stock of a corporation or an investment of 3% or greater in closed end funds, limited partnerships, LLCs or similar investment vehicles. Significant influence is considered for other strategic investments on a case- by-case basis. Investments in affiliates are not subject to fair value measurement guidance as they are not considered to be fair value measured investments under U.S. GAAP. However, impairments associated with investments in affiliates that are deemed to be other-than-temporary are calculated in accordance with fair value measurement guidance and appropriate disclosures included within the financial statements during the period the losses are recorded.
Other investments
Contained within this asset class are equity interests in investment funds, limited partnerships and unrated tranches of collateralized debt obligations for which the Company does not have sufficient rights or ownership interests to follow the equity method of accounting. The Company accounts for equity securities that do not have readily determinable market values at estimated fair value as it has no significant influence over these entities. Also included within other investments are structured transactions which are carried at amortized cost.
Fair values for other investments, principally other direct equity investments, investment funds and limited partnerships, are primarily based on the net asset value provided by the investment manager, the general partner or the respective entity, recent financial information, available market data and, in certain cases, management judgment may be required. These entities generally carry their trading positions and investments, the majority of which have underlying securities valued using Level 1 or Level 2 inputs, at fair value as determined by their respective investment managers; accordingly, these investments are generally classified as Level 2. Private equity investments are classified as Level 3. The net unrealized gain
16
XL INSURANCE (BERMUDA) LTD
NOTES TO CONSOLIDATED FINANCIAL STATEMENTS (Continued) FOR THE YEARS ENDED DECEMBER 31, 2009 AND 2008
2. Significant Accounting Policies (Continued)
(c) Total Investments (Continued)
or loss on investments, net of tax, is included in “Accumulated other comprehensive income (loss)”. Any unrealized loss in value considered by management to be other than temporary is charged to income in the period that it is determined.
Overseas deposits include investments in private funds related to Lloyd’s Syndicates in which the underlying instruments are primarily cash equivalents. The funds themselves do not trade on an exchange and therefore are not included within available for sale securities. Also included in overseas deposits are restricted cash and cash equivalent balances held by Lloyd’s syndicates for solvency purposes. Given the restricted nature of these cash balances, they are not included within the cash and cash equivalents line in the balance sheet. Each of these investment types are considered Level 2 valuations.
The Company historically participated in structured transactions which include cash loans supporting project finance transactions, providing liquidity facility financing to a structured project deal in 2009 and invested in a payment obligation with an insurance company. These transactions are carried at amortized cost. For further details see Note 3, “Fair Value Measurements” and Note 10, “Other Investments”.
Cash Equivalents
Cash equivalents include fixed interest deposits placed with a maturity of under 90 days when purchased. Bank deposits are not considered to be fair value measurements and as such are not subject to fair value measurement disclosures. Money market funds are classified as Level 1 as these instruments are considered actively traded and values are quoted, however, certificates of deposit are classified as Level 2.
(d) Premiums and Acquisition Costs
Insurance premiums written are recorded in accordance with the terms of the underlying policies. Reinsurance premiums written are recorded at the inception of the policy and are estimated based upon information received from ceding companies and any subsequent differences arising on such estimates are recorded in the period they are determined.
Premiums are earned on a pro-rata basis over the period the coverage is provided. Unearned premiums represent the portion of premiums written applicable to the unexpired terms of policies in force. Net premiums earned are presented after deductions for reinsurance ceded, as applicable.
Mandatory reinstatement premiums are recognized and earned at the time a loss event occurs.
Life and annuity premiums from long duration contracts that transfer significant mortality or morbidity risks are recognized as revenue and earned when due from policyholders. Life and annuity premiums from long duration contracts that do not subject the Company to risks arising from policyholder mortality or morbidity are accounted for as investment contracts and presented within deposit liabilities.
The Company has periodically written retroactive loss portfolio transfer (“LPT”) contracts. These contracts are evaluated to determine whether they meet the established criteria for reinsurance accounting, and if so, at inception, written premiums are fully earned and corresponding losses and loss expense recognized. The contracts can cause significant variances in gross premiums written, net premiums written, net premiums earned, and net incurred losses in the years in which they are written. Reinsurance contracts sold not meeting the established criteria for reinsurance accounting are recorded using the deposit method.
Acquisition costs, which vary with and are directly related to the acquisition of policies, consist primarily of commissions paid to brokers and cedants, and are deferred and amortized over the period that the premiums are earned. Acquisition costs are shown net of commissions earned on reinsurance ceded. Future earned premiums, the anticipated losses and other costs (and in the case of a premium deficiency, investment income) related to those premiums, are also considered in determining the level of acquisition costs to be deferred.
17
XL INSURANCE (BERMUDA) LTD
NOTES TO CONSOLIDATED FINANCIAL STATEMENTS (Continued) FOR THE YEARS ENDED DECEMBER 31, 2009 AND 2008
2. Significant Accounting Policies (Continued)
(e) Reinsurance
In the normal course of business, the Company seeks to reduce the potential amount of loss arising from claims events by reinsuring certain levels of risk assumed in various areas of exposure with other insurers or reinsurers. Reinsurance premiums ceded are expensed (and any commissions recorded thereon are earned) on a monthly pro-rata basis over the period the reinsurance coverage is provided. Ceded unearned reinsurance premiums represent the portion of premiums ceded applicable to the unexpired term of policies in force. Mandatory reinstatement premiums ceded are recorded at the time a loss event occurs. Amounts recoverable from reinsurers are estimated in a manner consistent with the claim liability associated with the reinsured policy. Provisions are made for estimated unrecoverable reinsurance.
(f) Fee Income and Other
Fee income and other includes fees received for insurance and product structuring services provided and is earned over the service period of the contract. Any adjustments to fees earned or the service period are reflected in income in the period when determined.
(g) Other Than Temporary Impairments (“OTTI”) of Available for Sale Securities
The Company’s process for identifying declines in the fair value of investments that are other than temporary involves consideration of several factors. These primary factors include (i) the time period during which there has been a significant decline in value, (ii) an analysis of the liquidity, business prospects and financial condition of the issuer, (iii) the significance of the decline, (iv) an analysis of the collateral structure and other credit support, as applicable, of the securities in question, (v) expected future interest rate movements, (vi) the Company’s intent to sell the investment, and (vii) the Company’s assessment as to whether it will more likely than not be required to sell the security. Under the authoritative accounting guidance issued during April 2009, impairment is now considered to be other than temporary if an entity (1) intends to sell the security, (2) more likely than not will be required to sell the security before recovering its amortized cost basis, or (3) does not expect to recover the security’s entire amortized cost basis (even if the entity does not intend to sell the security).
If the Company intends to sell an impaired debt security, or it is more likely than not that it will be required to sell the security before recovery of its amortized cost basis, the impairment is other-than-temporary and is recognized currently in earnings in an amount equal to the entire difference between fair value and amortized cost.
From April 1, 2009, in instances in which the Company determines that a credit loss exists but the Company does not intend to sell the security and it is not more likely than not that the Company will be required to sell the security before the anticipated recovery of its remaining amortized cost basis, the OTTI is separated into (1) the amount of the total impairment related to the credit loss and (2) the amount of the total impairment related to all other factors (i.e. the noncredit portion). The amount of the total OTTI related to the credit loss is recognized in earnings and the amount of the total OTTI related to all other factors is recognized in accumulated other comprehensive loss. The total OTTI is presented in the income statement with an offset for the amount of the total OTTI that is recognized in accumulated other comprehensive loss. Absent the intent or requirement to sell a security, if a credit loss does not exist, any impairment is considered to be temporary.
The noncredit portion of any OTTI losses on securities classified as available for sale is recorded as a component of other comprehensive income with an offsetting adjustment to the carrying value of the security. The fair value adjustment could increase or decrease the carrying value of the security. The noncredit portion of any OTTI losses recognized in accumulated other comprehensive loss for debt securities classified as held to maturity would be accreted over the remaining life of the debt security (in a pro rata manner based on the amount of actual cash flows received as a percentage of total estimated cash
18
XL INSURANCE (BERMUDA) LTD
NOTES TO CONSOLIDATED FINANCIAL STATEMENTS (Continued) FOR THE YEARS ENDED DECEMBER 31, 2009 AND 2008
2. Significant Accounting Policies (Continued)
(g) Other Than Temporary Impairments (“OTTI”) of Available for Sale Securities (Continued)
flows) as an increase in the carrying value of the security until the security is sold, the security matures, or there is an additional OTTI that is recognized in earnings.
In periods subsequent to the recognition of an OTTI loss, the other-than-temporarily impaired debt security is accounted for as if it had been purchased on the measurement date of the OTTI at an amount equal to the previous amortized cost basis less the credit-related OTTI recognized in earnings. For debt securities for which credit-related OTTI is recognized in earnings, the difference between the new cost basis and the cash flows expected to be collected is accreted into interest income over the remaining life of the security in a prospective manner based on the estimated amount and timing of future estimated cash flows.
With respect to securities where the decline in value is determined to be temporary and the security’s amortized cost is not written down, a subsequent decision may be made to sell that security and realize a loss. Subsequent decisions on security sales are made within the context of overall risk monitoring, changing information, market conditions generally and assessing value relative to other comparable securities. Day-to-day management of the Company’s investment portfolio is outsourced to third party investment manager service providers. While these investment manager service providers may, at a given point in time, believe that the preferred course of action is to hold securities with unrealized losses that are considered temporary until such losses are recovered, the dynamic nature of the portfolio management may result in a subsequent decision to sell the security and realize the loss, based upon a change in market and other factors described above. The Company believes that subsequent decisions to sell such securities are consistent with the classification of the Company’s portfolio as available for sale.
Management reviews any significant sales of securities for a loss to determine if such sale calls into question its previous intention with respect to that security. However, this factor on its own does not dictate whether or not the Company recognizes an impairment charge. The Company believes its assertion that it does not have the intent to sell nor is it more likely than not it will be required to sell certain securities is supported by positive and sufficient cash flow from its operations and from maturities within its investment portfolio in order to meet its claims payment obligations arising from its underwriting operations without selling such investments.
There are risks and uncertainties associated with determining whether declines in the fair value of investments are other than temporary. These include subsequent significant changes in general economic conditions as well as specific business conditions affecting particular issuers, the Company’s liability profile, subjective assessment of issue-specific factors (seniority of claims, collateral value, etc.), future financial market effects, stability of foreign governments and economies, future rating agency actions and significant disclosure of accounting, fraud or corporate governance issues that may adversely affect certain investments. In addition, significant assumptions and management judgment are involved in determining if the decline is other than temporary. If management determines that a decline in fair value is temporary, then a security’s value is not written down at that time. However, there are potential effects upon the Company’s future earnings and financial position should management later conclude that some of the current declines in the fair value of the investments are other than temporary declines. For further details on the factors considered in evaluation other than temporary impairment see Note 8, “Investments”.
(h) Derivative Instruments
The Company recognizes all derivatives as either assets or liabilities in the balance sheet and measures those instruments at fair value. The changes in fair value of derivatives are shown in the consolidated statement of income as “net realized and unrealized gains and losses on derivative instruments” unless the derivatives are designated as hedging instruments. The accounting for derivatives which are designated as hedging instruments is discussed below. Changes in fair value of derivatives may create volatility in the Company’s results of operations from period to period. Amounts recognized for the right to reclaim cash collateral (a receivable) or the obligation to return cash collateral (a payable) are offset against net fair
19
XL INSURANCE (BERMUDA) LTD
NOTES TO CONSOLIDATED FINANCIAL STATEMENTS (Continued) FOR THE YEARS ENDED DECEMBER 31, 2009 AND 2008
2. Significant Accounting Policies (Continued)
(h) Derivative Instruments (Continued)
value amounts recognized in the consolidated balance sheet for derivative instruments executed with the same counterparty under the same netting arrangement.
Derivative contracts can be exchange-traded or over-the-counter (“OTC”). Exchange-traded derivatives (futures and options) typically fall within Level 1 of the fair value hierarchy depending on whether they are deemed to be actively traded or not. OTC derivatives are valued using market transactions and other market evidence whenever possible, including market-based inputs to models, model calibration to market clearing transactions, broker or dealer quotations or alternative pricing sources where an understanding of the inputs utilized in arriving at the valuations is obtained. Where models are used, the selection of a particular model to value an OTC derivative depends upon the contractual terms and specific risks inherent in the instrument as well as the availability of pricing information in the market. The Company generally uses similar models to value similar instruments. Valuation models require a variety of inputs, including contractual terms, market prices, yield curves, credit curves, measures of volatility, prepayment rates and correlations of such inputs. For OTC derivatives that trade in liquid markets, such as generic forwards, interest rate swaps and options, model inputs can generally be verified and model selection does not involve significant management judgment. Such instruments comprise the majority of derivatives held by the Company and are typically classified within Level 2 of the fair value hierarchy.
Certain OTC derivatives trade in less liquid markets with limited pricing information, or required model inputs which are not directly market corroborated, which causes the determination of fair value for these derivatives to be inherently more subjective. Accordingly, such derivatives are classified within Level 3 of the fair value hierarchy. The valuations of less standard or liquid OTC derivatives are typically based on Level 1 and/or Level 2 inputs that can be observed in the market, as well as unobservable Level 3 inputs. Level 1 and Level 2 inputs are regularly updated to reflect observable market changes, with resulting gains and losses reflected within Level 3. Level 3 inputs are only changed when corroborated by evidence such as similar market transactions, pricing services and/or broker or dealer quotations. The Company conducts its non-hedging derivatives activities in four main areas: investment related derivatives, credit derivatives, other non-investment related derivatives, and until late 2008 it also utilized weather and energy derivatives.
The Company uses derivative instruments, primarily interest rate swaps, to manage the interest rate exposure associated with certain assets and liabilities. These derivatives are recorded at fair value. On the date the derivative contract is entered into, the Company may designate the derivative as a hedge of the fair value of a recognized asset or liability (“fair value” hedge); a hedge of the variability in cash flows of a forecasted transaction or of amounts to be received or paid related to a recognized asset or liability (“cash flow” hedge); a hedge of a net investment in a foreign operation; or the Company may not designate any hedging relationship for a derivative contract. In addition, the company previously wrote a number of resettable strike swaps contracts relating to an absolute return index and diversified basket of funds which are recorded within Investment Related Derivatives–Financial Market Exposures.
Fair Value Hedges
Changes in the fair value of a derivative that is designated and qualifies as a fair value hedge, along with the changes in the fair value of the hedged asset or liability that is attributable to the hedged risk, are recorded in current period earnings (through “net realized and unrealized gains and losses on derivative instruments”) with any differences between the net change in fair value of the derivative and the hedged item representing the hedge ineffectiveness. Periodic derivative net coupon settlements are recorded in net investment income with the exception of hedges of Company issued debt which are recorded in interest expense. The Company may designate fair value hedging relationships where interest rate swaps are used to hedge the changes in fair value of certain fixed rate liabilities and fixed maturity securities due to changes in the designated benchmark interest rate.
20
XL INSURANCE (BERMUDA) LTD
NOTES TO CONSOLIDATED FINANCIAL STATEMENTS (Continued) FOR THE YEARS ENDED DECEMBER 31, 2009 AND 2008
2. Significant Accounting Policies (Continued)
(h) Derivative Instruments (Continued)
Hedges of the Net Investment in a Foreign Operation
Changes in fair value of a derivative used as a hedge of a net investment in a foreign operation, to the extent effective as a hedge, are recorded in the foreign currency translation adjustments account within AOCI. Cumulative changes in fair value recorded in AOCI are reclassified into earnings upon the sale or complete or substantially complete liquidation of the foreign entity. Any hedge ineffectiveness is recorded immediately in current period earnings as “net realized and unrealized gains and losses on derivative instruments.”
Hedge Documentation and Effectiveness Testing
To qualify for hedge accounting treatment, a derivative must be highly effective in mitigating the designated changes in value or cash flow of the hedged item. At hedge inception, the Company formally documents all relationships between hedging instruments and hedged items, as well as its risk-management objective and strategy for undertaking each hedge transaction. The documentation process includes linking derivatives that are designated as fair value, cash flow, or net investment hedges to specific assets or liabilities on the balance sheet or to specific forecasted transactions. The Company also formally assesses, both at the hedge’s inception and on an ongoing basis, whether the derivatives that are used in hedging transactions are highly effective in offsetting changes in fair values or cash flows of hedged items. In addition, certain hedging relationships are considered highly effective if the changes in the fair value or discounted cash flows of the hedging instrument are within a ratio of 80-125% of the inverse changes in the fair value or discounted cash flows of the hedged item. Hedge ineffectiveness is measured using qualitative and quantitative methods. Qualitative methods may include comparison of critical terms of the derivative to the hedged item. Depending on the hedging strategy, quantitative methods may include the “Change in Variable Cash Flows Method,” the “Change in Fair Value Method,” the “Hypothetical Derivative Method” and the “Dollar Offset Method.”
Discontinuance of Hedge Accounting
The Company discontinues hedge accounting prospectively when it is determined that the derivative is no longer highly effective in offsetting changes in the fair value or cash flows of a hedged item; the derivative is designated as a hedging instrument; or the derivative expires or is sold, terminated or exercised. When hedge accounting is discontinued because it is determined that the derivative no longer qualifies as an effective fair-value hedge, the derivative continues to be carried at fair value on the balance sheet with changes in its fair value recognized in current period earnings through “net realized and unrealized gains and losses on derivative instruments.” When hedge accounting is discontinued because the Company becomes aware that it is not probable that the forecasted transaction will occur, the derivative continues to be carried on the balance sheet at its fair value, and gains and losses that were accumulated in AOCI are recognized immediately in earnings.
21
XL INSURANCE (BERMUDA) LTD
NOTES TO CONSOLIDATED FINANCIAL STATEMENTS (Continued) FOR THE YEARS ENDED DECEMBER 31, 2009 AND 2008
2. Significant Accounting Policies (Continued)
(i) Cash Equivalents
Cash equivalents include fixed interest deposits placed with a maturity of under 90 days when purchased. Bank deposits are not considered to be fair value measurements and as such are not subject to the authoritative guidance on fair value measurement disclosures. Money market funds are classified as Level 1 as these instruments are considered actively traded; however, certificates of deposit are classified as Level 2.
(j) Foreign Currency Translation
Assets and liabilities of foreign operations whose functional currency is not the U.S. dollar are translated at prevailing year end exchange rates. Revenue and expenses of such foreign operations are translated at average exchange rates during the year. The net effect of the translation adjustments for foreign operations, net of applicable deferred income taxes, as well as any gains or losses on intercompany balances for which settlement is not planned or anticipated in the foreseeable future, are included in “accumulated other comprehensive income (loss).”
Monetary assets and liabilities denominated in currencies other than the functional currency of the applicable entity are revalued at the exchange rate in effect at the balance sheet date and revenues and expenses are translated at the exchange rate on the date the transaction occurs with the resulting foreign exchange gains and losses on settlement or revaluation recognized in income.
(k) Goodwill and Other Intangible Assets
The Company has recorded goodwill in connection with various acquisitions in prior years. Goodwill represents the excess of the purchase price over the fair value of net assets acquired. In accordance with accounting guidance over goodwill and other intangible assets, the Company tests goodwill for potential impairment annually as of June 30 and between annual tests if an event occurs or circumstances change that may indicate that potential exists for the fair value of a reporting unit to be reduced to a level below its carrying amount.
The Company’s other intangible assets consist of both amortizable and non-amortizable intangible assets. The Company’s amortizable intangible assets consist primarily of acquired customer relationships and acquired software. All of the Company’s amortizable intangible assets are carried at net book value and are amortized over their estimated useful lives. The amortization periods approximate the periods over which the Company expects to generate future net cash inflows from the use of these assets. Accordingly, customer relationships are amortized over a useful life of 10 years and acquired software is amortized over a useful life of 5 years. The Company’s policy is to amortize intangibles on a straight-line basis.
All of the Company’s amortizable intangible assets, as well as other amortizable or depreciable long-lived assets such as premises and equipment, are subject to impairment testing in accordance with authoritative guidance for the impairment or disposal of long-lived assets when events or conditions indicate that the carrying value of an asset may not be fully recoverable from future cash flows. A test for recoverability is done by comparing the asset’s carrying value to the sum of the undiscounted future net cash inflows expected to be generated from the use of the asset over its remaining useful life. In accordance with the authoritative guidance on property, plant and equipment under GAAP, impairment exists if the sum of the undiscounted expected future net cash inflows is less than the carrying amount of the asset. Impairment would result in a write-down of the asset to its estimated fair value. The estimated fair values of these assets are based on the discounted present value of the stream of future net cash inflows expected to be derived over their remaining useful lives. If an impairment write-down is recorded, the remaining useful life of the asset will be evaluated to determine whether revision of the remaining amortization or depreciation period is appropriate.
The Company’s indefinite lived intangible assets consist primarily of acquired insurance and reinsurance licenses. These assets are deemed to have indefinite useful lives and are therefore not subject to
22
XL INSURANCE (BERMUDA) LTD
NOTES TO CONSOLIDATED FINANCIAL STATEMENTS (Continued) FOR THE YEARS ENDED DECEMBER 31, 2009 AND 2008
2. Significant Accounting Policies (Continued)
(k) Goodwill and Other Intangible Assets (Continued)
amortization. In accordance with the authoritative guidance on intangibles and goodwill and other under GAAP, all of the Company’s non-amortized intangible assets are subject to a test for impairment annually, or more frequently if events or changes in circumstances indicate that the asset might be impaired. Pursuant to the authoritative guidance, if the carrying value of a non-amortized intangible asset is in excess of its fair value, the asset must be written down to its fair value through the recognition of an impairment charge to earnings.
(l) Losses and Loss Expenses
Unpaid losses and loss expenses include reserves for reported unpaid losses and loss expenses and for losses incurred but not reported. The reserve for reported unpaid losses and loss expenses for the Company’s property and casualty operations is established by management based on amounts reported from insureds or ceding companies, and represents the estimated ultimate cost of events or conditions that have been reported to or specifically identified by the Company.
The reserve for losses incurred but not reported is estimated by management based on loss development patterns determined by reference to the Company’s underwriting practices, the policy form, type of program and historical experience. The Company’s actuaries employ a variety of generally accepted methodologies to determine estimated ultimate loss reserves, including the “Bornhuetter-Ferguson incurred loss method” and frequency and severity approaches.
Certain workers’ compensation and financial guarantee case reserve contracts are considered fixed and determinable and are subject to tabular reserving. Reserves associated with these liabilities are discounted.
Management believes that the reserves for unpaid losses and loss expenses are sufficient to cover losses that fall within coverages assumed by the Company. However, there can be no assurance that losses will not exceed the Company’s total reserves. The methodology of estimating loss reserves is periodically reviewed to ensure that the assumptions made continue to be appropriate and any adjustments resulting from such reviews are reflected in income of the year in which the adjustments are made.
(m) Deposit liabilities
Contracts entered into by the Company which are not deemed to transfer significant underwriting and/or timing risk are accounted for as deposits, whereby liabilities are initially recorded at an amount equal to the assets received. The Company uses a portfolio rate of return of equivalent duration to the liabilities in determining risk transfer. An initial accretion rate is established based on actuarial estimates whereby the deposit liability is increased to the estimated amount payable over the term of the contract.
The deposit accretion rate is the rate of return required to fund expected future payment obligations (this is equivalent to the “best estimate” of future cash flows), which are determined actuarially based upon the nature of the underlying indemnifiable losses. Accretion of the liability is recorded as interest expense. The Company periodically reassesses the estimated ultimate liability. Any changes to this liability are reflected as adjustments to interest expense to reflect the cumulative effect of the period the contract has been in force, and by an adjustment to the future accretion rate of the liability over the remaining estimated contract term.
Funding agreements, when previously written by the Company, were initially recorded at an amount equal to the value of assets received. In relation to the payments to be made under these contracts, the Company used derivative instruments in order to hedge the Company’s exposure to fluctuations in interest rates related to these contracts. As described in Note 2(h), in relation to hedges in place on the remaining funding agreements, changes in the fair value of the hedging instrument are recognized in income. The change in the fair value of the hedged item, attributable to the hedged risk, is recorded as an adjustment to the carrying amount of the hedged item and is recognized in income.
23
XL INSURANCE (BERMUDA) LTD
NOTES TO CONSOLIDATED FINANCIAL STATEMENTS (Continued) FOR THE YEARS ENDED DECEMBER 31, 2009 AND 2008
2. Significant Accounting Policies (Continued)
(n) Future policy benefit reserves
The Company estimates the present value of future policy benefits related to long duration contracts using assumptions for investment yields, mortality, and expenses, including a provision for adverse deviation.
The assumptions used to determine future policy benefit reserves are best estimate assumptions that are determined at the inception of the contracts and are locked-in throughout the life of the contract unless a premium deficiency develops. As the experience on the contracts emerges, the assumptions are reviewed. If such review would produce reserves in excess of those currently held then the lock-in assumptions will be revised and a claim and policy benefit is recognized at that time.
Certain life insurance and annuity contracts provide the holder with a guarantee that the benefit received upon death will be no less than a minimum prescribed amount. The contracts are accounted for in accordance with the authoritative guidance on Accounting and Reporting by Insurance Enterprises for certain Long-Duration Contracts and for Separate Accounts, which requires that the best estimate of future experience be combined with actual experience to determine the benefit ratio used to calculate the policy benefit reserve.
(o) Income Taxes
The Company utilizes the asset and liability method of accounting for income taxes. Under this method, deferred income taxes reflect the net tax effect of temporary differences between the carrying amounts of assets and liabilities for financial reporting purposes and the amounts used for income tax purposes. The deferral of tax losses is evaluated based upon management’s estimates of the future profitability of the Company’s taxable entities based on current forecasts and the period for which losses may be carried forward. A valuation allowance is established for any portion of a deferred tax asset that management believes will not be realized. The Company continues to evaluate income generated in future periods by its subsidiaries in jurisdictions in determining the recoverability of its deferred tax asset. If it is determined that future income generated by these subsidiaries is insufficient to cause the realization of the net operating losses within a reasonable period, a valuation allowance is established at that time.
(p) Stock Plans
The Company adopted authoritative guidance on the fair value recognition provisions for accounting for stock-based compensation, under the prospective method for options granted by XL Capital subsequent to January 1, 2003. Prior to 2003, the Company accounted for options granted by XL Capital under the disclosure-only provisions of the guidance and no stock-based employee compensation cost was included in net income as all options granted had an exercise price equal to the market value of XL Capital’s ordinary shares on the date of the grant. At December 31, 2009, the Company had several stock based Performance Incentive Programs, which are described more fully in Note 19, “Compensation Plans.” Stock-based compensation issued under these plans generally have a life of not longer than ten years and vest as set forth at the time of grant. Options currently vest annually over four years from the date of grant. The Company recognizes compensation costs for stock options and restricted stock on a straight-line basis over the requisite service period (usually the vesting period) for each award.
Share-based payments to employees, including grants of employee stock options (for all grant years), are recognized in the financial statements over the vesting period based on their grant date fair values.
Authoritative guidance requires that compensation costs be recognized for unvested stock-based compensation awards over the period through the date that the employee is no longer required to provide future services to earn the award, rather than over the explicit service period. Accordingly, the Company follows a policy of recognizing compensation cost to coincide with the date that the employee is eligible to retire, rather than the actual retirement date, for all stock based compensation granted.
(q) Recent Accounting Pronouncements
In December 2007, the FASB issued final authoritative guidance regarding noncontrolling interests in consolidated financial statements to establish accounting and reporting standards for the noncontrolling interest in a subsidiary and for the deconsolidation of a
subsidiary was issued. This guidance requires a company to clearly identify and present ownership interests in subsidiaries held by parties other than the company in the consolidated financial statements within the equity section but separate from the company’s
equity. It also requires the amount of consolidated net income attributable to the parent and to the noncontrolling interest be clearly identified and presented on the face of the consolidated statement of income; requires any changes in ownership interest of the
subsidiary be accounted for as equity transactions; and requires that when a subsidiary is deconsolidated, any retained noncontrolling
24
XL INSURANCE (BERMUDA) LTD
NOTES TO CONSOLIDATED FINANCIAL STATEMENTS (Continued) FOR THE YEARS ENDED DECEMBER 31, 2009 AND 2008
2. Significant Accounting Policies (Continued)
(q) Recent Accounting Pronouncements (Continued)
equity investment in the former subsidiary and the gain or loss on the deconsolidation of the subsidiary be measured at fair value. This guidance is effective for interim and annual financial statements issued after January 1, 2009. While the adoption of this guidance did not have a material impact on the Company’s financial condition or results of operations, such adoption did result in certain changes in the presentation and disclosure of noncontrolling interests as noted above.
In March 2008, the FASB issued final authoritative guidance surrounding disclosures about derivative instruments and hedging activities which requires enhanced disclosures about an entity’s derivative and hedging activities. The Company adopted the standard as of January 1, 2009. This guidance requires only additional disclosures concerning derivatives and hedging activities, and therefore the adoption did not have an impact on the Company’s financial condition and results of operations. See Note 2(h), “Significant Accounting Policies–Derivative Instruments” and Note 16, “Derivative Instruments” for disclosures required under this standard.
In May 2008, the FASB issued final authoritative guidance on accounting for financial guarantee insurance contracts to address current diversity in practice with respect to accounting for financial guarantee insurance contracts by insurance enterprises under the existing authoritative guidance over accounting and reporting by insurance enterprises. That diversity resulted in inconsistencies in the recognition and measurement of claim liabilities because of differing views regarding when a loss has been incurred under guidance surrounding accounting for contingencies. This financial guarantee accounting guidance requires that an insurance enterprise recognize a claim liability prior to an event of default (insured event) when there is evidence that credit deterioration has occurred in an insured financial obligation. The guidance also clarifies how the existing insurance accounting guidance applies to financial guarantee insurance contracts, including the recognition and measurement to be used to account for premium revenue and claim liabilities. Those clarifications will increase comparability in financial reporting of financial guarantee insurance contracts by insurance enterprises. The guidance also requires expanded disclosures about financial guarantee insurance contracts. The standard was adopted by the Company as of January 1, 2009. The adoption of this guidance during 2009 did not have a material impact on the Company’s financial condition or results of operations.
As of December 31, 2009, the Company’s outstanding financial guarantee contracts that were subject to the new accounting guidance included the reinsurance of 41 financial guarantee contracts with total insured contractual payments outstanding of $713.6 million ($568.2 million of principal and $145.4 million of interest) with a remaining weighted-average contract period of 11.5 years. The total gross claim liability and unearned premiums recorded at December 31, 2009 were $14.5 million and $1.5 million, respectively. Of the contractual exposure existing at December 31, 2009, the Company has reinsured $401.9 million with subsidiaries of Syncora Holdings Ltd (“Syncora”), however, as of December 31, 2009 there are no gross claim liabilities or recoverables recorded relating to this exposure. Of the 41 contracts noted above, 3 contracts with total insured contractual payments outstanding of $16.1 million had experienced an event of default and were considered by the Company to be non-performing at December 31, 2009, while the remaining 38 contracts were considered to be performing at such date. As of December 31, 2008, the Company’s outstanding financial guarantee contracts that were subject to the new accounting guidance included the reinsurance of 48 financial guarantee contracts with total insured contractual payments outstanding of $936.6 million ($798.5 million of principal and $138.1 million of interest) with a remaining weighted-average contract period of 7.9 years. The total gross claim liability and unearned premiums recorded at December 31, 2008 were $14.5 million and $3.1 million, respectively. Of the contractual exposure existing at December 31, 2008, the Company had reinsured $360.5 million with subsidiaries of Syncora Holdings Ltd (“Syncora”), however as at December 31, 2008 no reinsurance balances recoverable from Syncora had been recorded. Surveillance procedures to track and monitor credit deteriorations in the insured financial obligations are performed by the primary obligors for each transaction on the Company’s behalf. Information regarding the performance status and updated exposure values is provided to the Company on a quarterly basis and evaluated by management in recording claims reserves.
In April 2009, the FASB issued final authoritative guidance on determining fair value when the volume and level of activity for the asset or liability have significantly decreased and identifying transactions that are not orderly, which provides additional guidance for estimating fair value in accordance with existing fair value measurements guidance. Guidance is also included on identifying circumstances that indicate a transaction is not orderly and amends certain fair value measurement disclosure guidance. This new authoritative guidance was effective for interim and annual reporting periods ending after June 15, 2009. The adoption of this standard did not have a material impact on the Company’s financial condition or results of operations.
In April 2009, the FASB issued final authoritative guidance on recognition and presentation of other-than-temporary Impairments (“OTTI”) which amends the OTTI guidance for debt securities to make the guidance more operational and to improve the
25
XL INSURANCE (BERMUDA) LTD
NOTES TO CONSOLIDATED FINANCIAL STATEMENTS (Continued) FOR THE YEARS ENDED DECEMBER 31, 2009 AND 2008
2. Significant Accounting Policies (Continued)
(q) Recent Accounting Pronouncements (Continued)
presentation and disclosure of OTTI on debt and equity securities in the financial statements. This guidance does not amend existing recognition and measurement guidance related to OTTI of equity securities. This guidance was effective for interim and annual reporting periods ending after June 15, 2009. The Company adopted this guidance effective April 1, 2009, which resulted in a net after-tax increase to retained earnings and decrease to Accumulated Other Comprehensive Income (Loss) of $229.7 million for the year ended December 31, 2009. The disclosures required by this guidance are provided in Note 8, “Investments”.
In April 2009, the FASB issued final authoritative guidance on interim disclosures about fair value of financial instruments which amends existing guidance to require disclosures about the fair value of financial instruments for interim reporting periods as well as in annual financial statements. This guidance was effective for interim reporting periods ending after June 15, 2009. This guidance affected disclosures only and accordingly did not have an impact on the Company’s financial condition or results of operations. The disclosures required by this guidance are provided in Note 3, “Fair Value Measurements”.
In April 2009, the FASB issued final authoritative guidance on accounting for assets acquired and liabilities assumed in a business combination that arise from contingencies. This guidance requires an asset acquired or liability assumed in a business combination that arises from a contingency to be recognized at fair value at the acquisition date, if the acquisition date fair value of that asset or liability can be determined during the measurement period. If the acquisition date fair value of an asset acquired or liability assumed in a business combination that arises from a contingency cannot be determined during the measurement period, the asset or liability shall be recognized at the acquisition date using the guidance governing accounting for contingencies. This guidance also amends disclosure requirements and is effective for assets or liabilities arising from contingencies in business combinations for which the acquisition date is on or after January 1, 2009. The Company’s adoption of this guidance effective January 1, 2009 did not have a material effect on the Company’s financial position or results of operations.
In May 2009, the FASB issued final authoritative guidance on accounting for and reporting of subsequent events. This standard incorporates into authoritative accounting literature certain guidance that already existed within generally accepted auditing standards, but the rules concerning recognition and disclosure of subsequent events will remain essentially unchanged. Subsequent events guidance addresses events which occur after the balance sheet date but before the issuance of financial statements. Under the new guidance, as under current practice, an entity must record the effects of subsequent events that provide evidence about conditions that existed at the balance sheet date and must disclose but not record the effects of subsequent events which provide evidence about conditions that did not exist at the balance sheet date. This guidance was effective for interim and annual periods ending after June 15, 2009. The adoption of this guidance did not have any impact on the Company’s financial condition or results of operations.
In June 2009, the FASB issued final authoritative guidance over accounting for transfers of financial assets which removes the concept of a qualifying special-purpose entity from existing accounting guidance over transfers of financial assets and also removes the exception from applying guidance surrounding consolidation of variable interest entities to qualifying special-purpose entities. This new guidance must be applied from January 1, 2010 for the Company, for both interim and annual periods. Earlier application is prohibited. The guidance must be applied to transfers occurring on or after the effective date. The Company is currently evaluating the potential impact of this guidance. However, it is not currently expected to have a material impact on the Company’s financial condition or results of operations.
In June 2009, the FASB issued final authoritative accounting guidance in an effort to improve financial reporting by enterprises involved with variable interest entities. This guidance retains the scope of the previous standard covering variable interest entities with the addition of entities previously considered qualifying special-purpose entities, as the concept of these entities was eliminated in the new authoritative guidance. The new guidance requires an enterprise to perform an analysis to determine whether the enterprise’s variable interest or interests give it a controlling financial interest in a variable interest entity under revised guidelines that are more qualitative than under previous guidance and amends previous guidance to require ongoing reassessments of whether an enterprise is the primary beneficiary of a variable interest entity. Before this update, previous guidance required reconsideration of whether an enterprise is the primary beneficiary of a variable interest entity only when specific events occurred. The new guidance also amends previous guidance to require enhanced disclosures that will provide users of financial statements with more transparent information about an enterprise’s involvement with a variable interest entity. The enhanced disclosures are required for any enterprise that holds a variable interest in a variable interest entity. The content of the enhanced disclosures required by this new guidance is generally consistent with that required by the previous standards. This new guidance must be applied from January 1, 2010 for the Company, for both interim and annual periods. The Company is currently evaluating the potential impact of this guidance on its financial condition and results of operations
26
XL INSURANCE (BERMUDA) LTD
NOTES TO CONSOLIDATED FINANCIAL STATEMENTS (Continued) FOR THE YEARS ENDED DECEMBER 31, 2009 AND 2008
2. Significant Accounting Policies (Continued)
(q) Recent Accounting Pronouncements (Continued)
In June 2009, the FASB issued its Accounting Standards Codification and guidance over the hierarchy of generally accepted accounting principles. This guidance specifies that the FASB Codification has become the source of authoritative U.S. generally accepted accounting principles (“GAAP”) recognized by the FASB to be applied by nongovernmental entities. Rules and interpretive releases of the Securities and Exchange Commission (“SEC”) under authority of federal securities laws are also sources of authoritative GAAP for SEC registrants. For financial statements issued for interim and annual periods ending after September 15, 2009, the effective date of this final guidance, the Codification superseded all then-existing non-SEC accounting and reporting standards. All other non-grandfathered, non-SEC accounting literature not included in the Codification became non-authoritative. While the Codification did not change GAAP, it introduced a new structure – one that is intended to be organized in an easily accessible, user-friendly online research system. The adoption of this standard did not have an impact on the Company’s financial condition or results of operations.
In August 2009, the FASB issued an Accounting Standards Update discussing the measurement of liabilities at fair value, which provides clarification for circumstances in which a quoted price in an active market for an identical liability is not available. The amendments are intended to reduce potential ambiguity in financial reporting when measuring the fair value of liabilities. The guidance was effective for the Company’s December 31, 2009 year end reporting. This guidance did not have an impact on the Company’s financial condition or results of operations.
In September 2009, the FASB issued authoritative guidance associated with estimating the fair value for investments in certain entities that do not have a quoted market price but calculate net asset value per share or its equivalent. This guidance covers investments often referred to as “alternative investments” that would include hedge funds, private equity funds, venture capital funds, offshore fund vehicles and funds of funds. When certain criteria are met, this guidance would permit an entity, as a practical expedient, to estimate the fair value of an investment within the scope of this guidance using the net asset value per share of the investment. Therefore, certain attributes of the investment (such as restrictions on redemption) and transaction prices from principal-to-principal or brokered transactions will not be considered in measuring the fair value of the investment if the practical expedient is used. The proposed amendments also require disclosures by major category of investment about the attributes of those investments, such as the nature of any restrictions on the investor’s ability to redeem its investments at the measurement date, any unfunded commitments, and the investment strategies of the investees. These amendments were effective for the Company for the December 31, 2009 year end reporting. The disclosures required by this standard are included in Note 10, “Other Investments”. This guidance did not have an impact on the Company’s financial condition or results from operations.
In January 2010, the FASB issued an accounting standards update on Improving Disclosures about Fair Value Measurements. The provisions of this authoritative guidance require new disclosures about recurring and nonrecurring fair value measurements including significant transfers into and out of Level 1 and Level 2 fair value measurements and information on purchases, sales, issuances, and settlements on a gross basis in the reconciliation of Level 3 fair value measurements. This guidance is effective for annual reporting periods beginning after December 15, 2009, except for Level 3 reconciliation disclosures which are effective for annual periods beginning after December 15, 2010. This standard affects disclosures only and accordingly will not have an impact on the Company’s financial condition or results of operations.
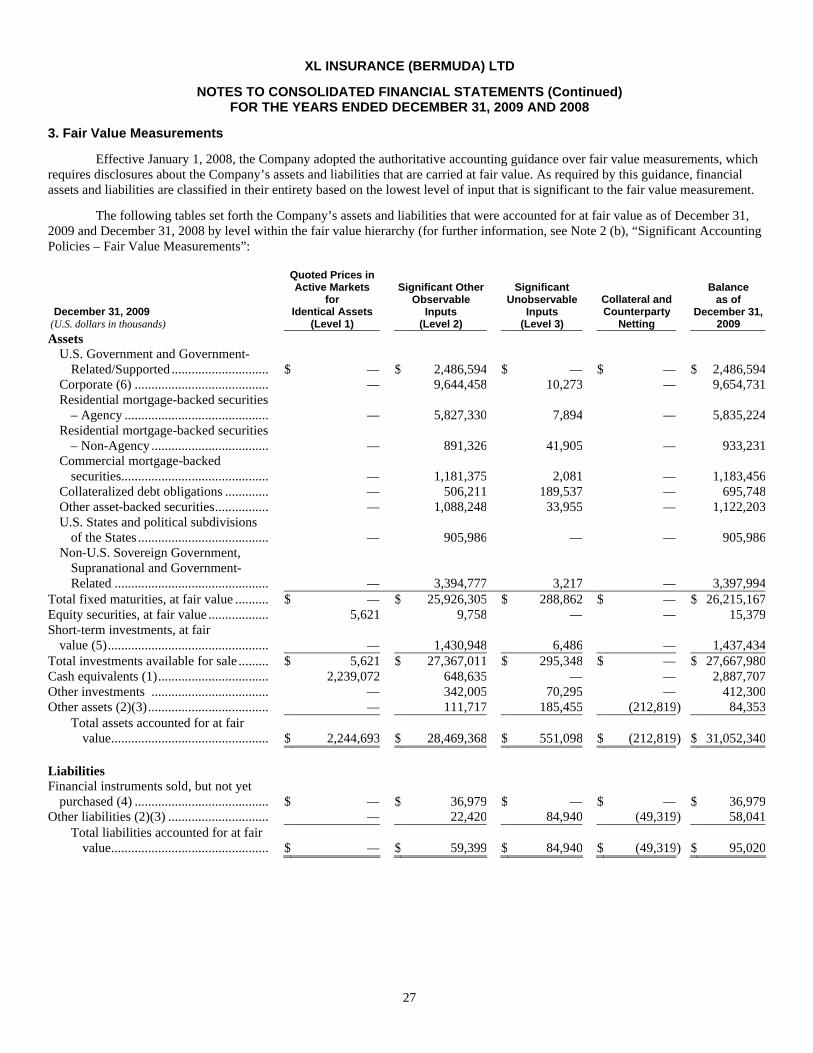
27
XL INSURANCE (BERMUDA) LTD
NOTES TO CONSOLIDATED FINANCIAL STATEMENTS (Continued) FOR THE YEARS ENDED DECEMBER 31, 2009 AND 2008
3. Fair Value Measurements
Effective January 1, 2008, the Company adopted the authoritative accounting guidance over fair value measurements, which requires disclosures about the Company’s assets and liabilities that are carried at fair value. As required by this guidance, financial assets and liabilities are classified in their entirety based on the lowest level of input that is significant to the fair value measurement.
The following tables set forth the Company’s assets and liabilities that were accounted for at fair value as of December 31, 2009 and December 31, 2008 by level within the fair value hierarchy (for further information, see Note 2 (b), “Significant Accounting Policies – Fair Value Measurements”:
December 31, 2009 (U.S. dollars in thousands)
Quoted Prices in Active Markets
for Identical Assets
(Level 1)
Significant Other Observable
Inputs (Level 2)
Significant Unobservable
Inputs (Level 3)
Collateral and Counterparty
Netting
Balance as of
December 31, 2009
Assets U.S. Government and Government-
Related/Supported ................................ $ — $ 2,486,594 $ — $ — $ 2,486,594 Corporate (6) ............................................. — 9,644,458 10,273 — 9,654,731 Residential mortgage-backed securities
– Agency ................................................ — 5,827,330 7,894 — 5,835,224 Residential mortgage-backed securities
– Non-Agency ........................................ — 891,326 41,905 — 933,231 Commercial mortgage-backed
securities................................................. — 1,181,375 2,081 — 1,183,456 Collateralized debt obligations .................. — 506,211 189,537 — 695,748 Other asset-backed securities..................... — 1,088,248 33,955 — 1,122,203 U.S. States and political subdivisions
of the States ............................................ — 905,986 — — 905,986 Non-U.S. Sovereign Government,
Supranational and Government-Related ................................................... — 3,394,777 3,217 — 3,397,994
Total fixed maturities, at fair value ............... $ — $ 25,926,305 $ 288,862 $ — $ 26,215,167 Equity securities, at fair value ....................... 5,621 9,758 — — 15,379 Short-term investments, at fair
value (5)..................................................... — 1,430,948 6,486 — 1,437,434 Total investments available for sale .............. $ 5,621 $ 27,367,011 $ 295,348 $ — $ 27,667,980 Cash equivalents (1)...................................... 2,239,072 648,635 — — 2,887,707 Other investments ........................................ — 342,005 70,295 — 412,300 Other assets (2)(3)......................................... — 111,717 185,455 (212,819) 84,353
Total assets accounted for at fair value.................................................... $ 2,244,693 $ 28,469,368 $ 551,098 $ (212,819) $ 31,052,340
Liabilities Financial instruments sold, but not yet
purchased (4) ............................................. $ — $ 36,979 $ — $ — $ 36,979 Other liabilities (2)(3) ................................ — 22,420 84,940 (49,319) 58,041
Total liabilities accounted for at fair value.................................................... $ — $ 59,399 $ 84,940 $ (49,319) $ 95,020
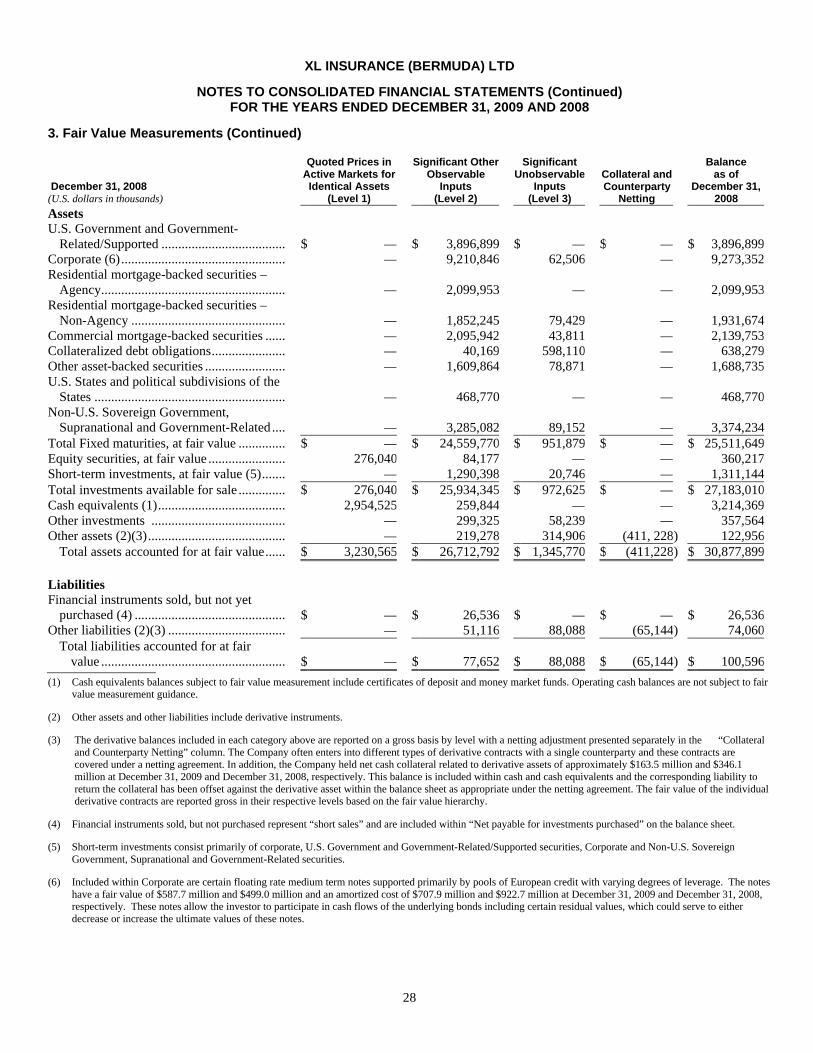
28
XL INSURANCE (BERMUDA) LTD
NOTES TO CONSOLIDATED FINANCIAL STATEMENTS (Continued) FOR THE YEARS ENDED DECEMBER 31, 2009 AND 2008
3. Fair Value Measurements (Continued)
December 31, 2008 (U.S. dollars in thousands)
Quoted Prices in Active Markets for Identical Assets
(Level 1)
Significant Other Observable
Inputs (Level 2)
Significant Unobservable
Inputs (Level 3)
Collateral and Counterparty
Netting
Balance as of
December 31, 2008
Assets U.S. Government and Government-
Related/Supported ................................................... $ — $ 3,896,899 $ — $ — $ 3,896,899 Corporate (6)............................................................... — 9,210,846 62,506 — 9,273,352 Residential mortgage-backed securities –
Agency................................................................ — 2,099,953 — — 2,099,953 Residential mortgage-backed securities –
Non-Agency ............................................................ — 1,852,245 79,429 — 1,931,674 Commercial mortgage-backed securities .................... — 2,095,942 43,811 — 2,139,753 Collateralized debt obligations................................ — 40,169 598,110 — 638,279 Other asset-backed securities ................................ — 1,609,864 78,871 — 1,688,735 U.S. States and political subdivisions of the
States ................................................................ — 468,770 — — 468,770 Non-U.S. Sovereign Government,
Supranational and Government-Related .................. — 3,285,082 89,152 — 3,374,234 Total Fixed maturities, at fair value ............................ $ — $ 24,559,770 $ 951,879 $ — $ 25,511,649 Equity securities, at fair value ................................ 276,040 84,177 — — 360,217 Short-term investments, at fair value (5)..................... — 1,290,398 20,746 — 1,311,144 Total investments available for sale ............................ $ 276,040 $ 25,934,345 $ 972,625 $ — $ 27,183,010 Cash equivalents (1).................................................... 2,954,525 259,844 — — 3,214,369 Other investments ...................................................... — 299,325 58,239 — 357,564 Other assets (2)(3)....................................................... — 219,278 314,906 (411, 228) 122,956
Total assets accounted for at fair value.................... $ 3,230,565 $ 26,712,792 $ 1,345,770 $ (411,228) $ 30,877,899 Liabilities Financial instruments sold, but not yet
purchased (4) ........................................................... $ — $ 26,536 $ — $ — $ 26,536 Other liabilities (2)(3) ................................................. — 51,116 88,088 (65,144) 74,060
Total liabilities accounted for at fair value ................................................................ $ — $ 77,652 $ 88,088 $ (65,144) $ 100,596
(1) Cash equivalents balances subject to fair value measurement include certificates of deposit and money market funds. Operating cash balances are not subject to fair value measurement guidance.
(2) Other assets and other liabilities include derivative instruments.
(3) The derivative balances included in each category above are reported on a gross basis by level with a netting adjustment presented separately in the “Collateral and Counterparty Netting” column. The Company often enters into different types of derivative contracts with a single counterparty and these contracts are covered under a netting agreement. In addition, the Company held net cash collateral related to derivative assets of approximately $163.5 million and $346.1 million at December 31, 2009 and December 31, 2008, respectively. This balance is included within cash and cash equivalents and the corresponding liability to return the collateral has been offset against the derivative asset within the balance sheet as appropriate under the netting agreement. The fair value of the individual derivative contracts are reported gross in their respective levels based on the fair value hierarchy.
(4) Financial instruments sold, but not purchased represent “short sales” and are included within “Net payable for investments purchased” on the balance sheet.
(5) Short-term investments consist primarily of corporate, U.S. Government and Government-Related/Supported securities, Corporate and Non-U.S. Sovereign Government, Supranational and Government-Related securities.
(6) Included within Corporate are certain floating rate medium term notes supported primarily by pools of European credit with varying degrees of leverage. The notes have a fair value of $587.7 million and $499.0 million and an amortized cost of $707.9 million and $922.7 million at December 31, 2009 and December 31, 2008, respectively. These notes allow the investor to participate in cash flows of the underlying bonds including certain residual values, which could serve to either decrease or increase the ultimate values of these notes.
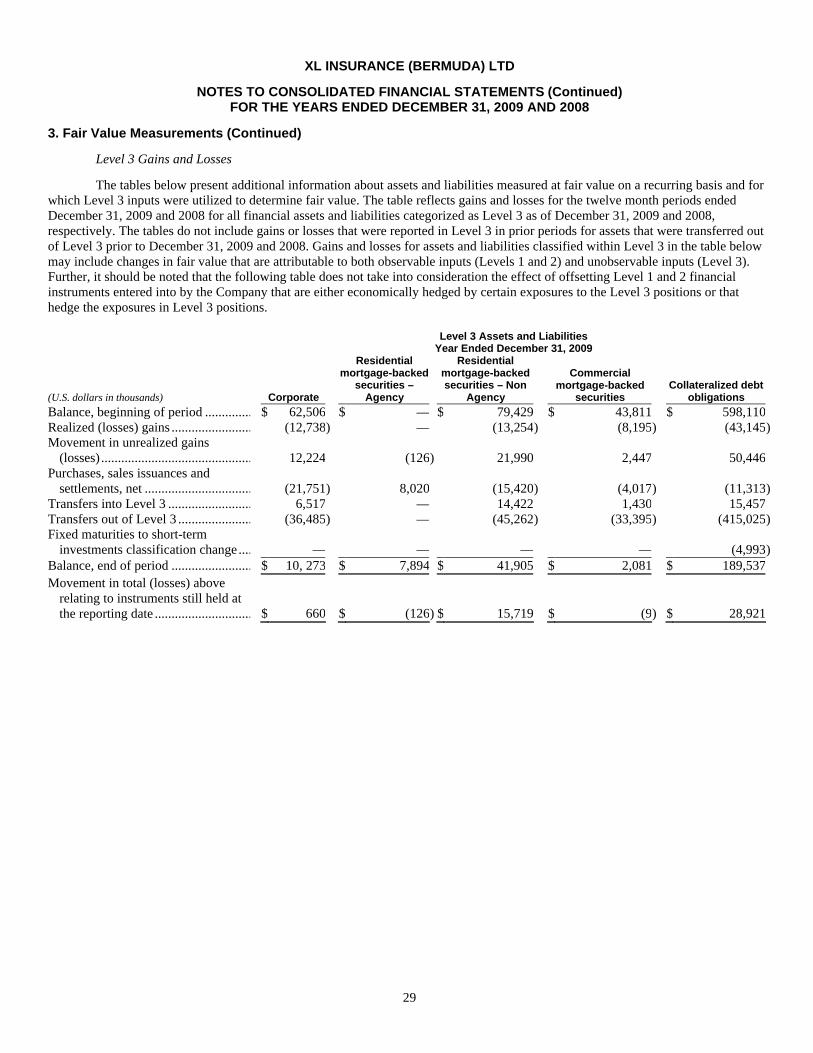
29
XL INSURANCE (BERMUDA) LTD
NOTES TO CONSOLIDATED FINANCIAL STATEMENTS (Continued) FOR THE YEARS ENDED DECEMBER 31, 2009 AND 2008
3. Fair Value Measurements (Continued)
Level 3 Gains and Losses
The tables below present additional information about assets and liabilities measured at fair value on a recurring basis and for which Level 3 inputs were utilized to determine fair value. The table reflects gains and losses for the twelve month periods ended December 31, 2009 and 2008 for all financial assets and liabilities categorized as Level 3 as of December 31, 2009 and 2008, respectively. The tables do not include gains or losses that were reported in Level 3 in prior periods for assets that were transferred out of Level 3 prior to December 31, 2009 and 2008. Gains and losses for assets and liabilities classified within Level 3 in the table below may include changes in fair value that are attributable to both observable inputs (Levels 1 and 2) and unobservable inputs (Level 3). Further, it should be noted that the following table does not take into consideration the effect of offsetting Level 1 and 2 financial instruments entered into by the Company that are either economically hedged by certain exposures to the Level 3 positions or that hedge the exposures in Level 3 positions.
Level 3 Assets and Liabilities
Year Ended December 31, 2009
(U.S. dollars in thousands) Corporate
Residential mortgage-backed
securities – Agency
Residential mortgage-backed securities – Non
Agency
Commercial mortgage-backed
securities Collateralized debt
obligations Balance, beginning of period ........................ $ 62,506 $ — $ 79,429 $ 43,811 $ 598,110 Realized (losses) gains ................................ (12,738) — (13,254 ) (8,195) (43,145 ) Movement in unrealized gains
(losses) ....................................................... 12,224 (126) 21,990 2,447 50,446 Purchases, sales issuances and
settlements, net ................................ (21,751) 8,020 (15,420 ) (4,017) (11,313 ) Transfers into Level 3 ................................ 6,517 — 14,422 1,430 15,457 Transfers out of Level 3 ................................ (36,485) — (45,262 ) (33,395) (415,025 ) Fixed maturities to short-term
investments classification change .............. — — — — (4,993 ) Balance, end of period ................................ $ 10, 273 $ 7,894 $ 41,905 $ 2,081 $ 189,537 Movement in total (losses) above
relating to instruments still held at the reporting date ................................ $ 660 $ (126) $ 15,719 $ (9) $ 28,921
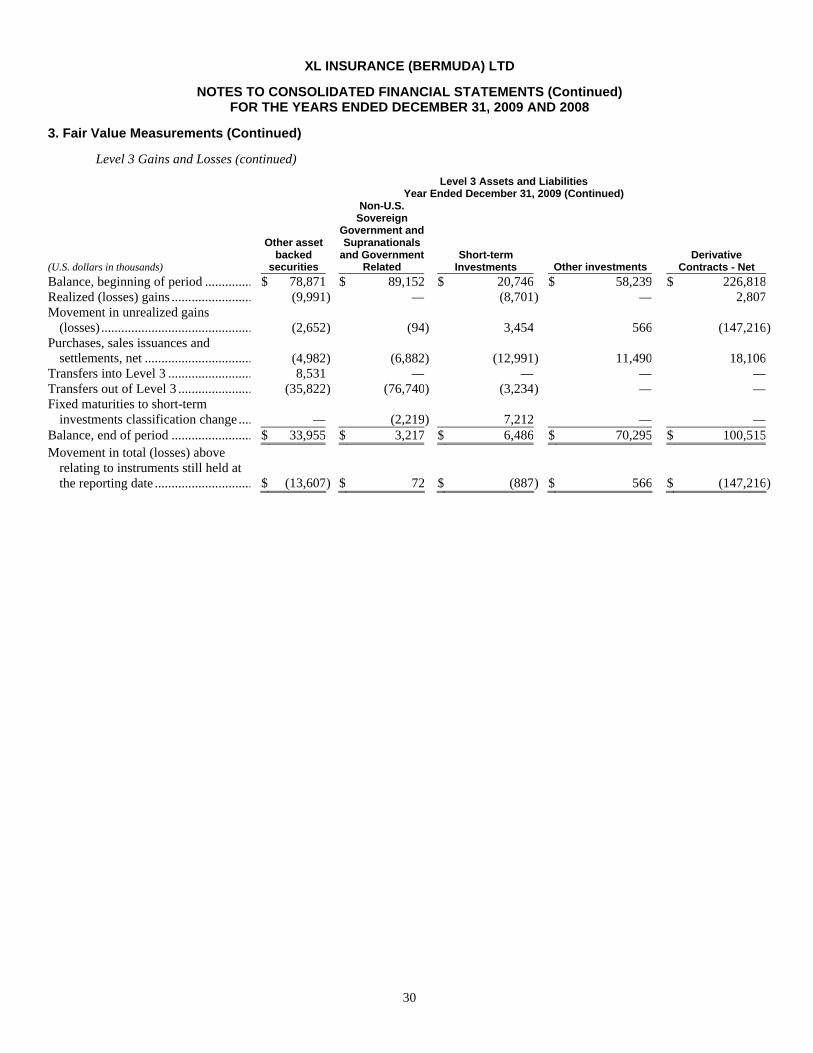
30
XL INSURANCE (BERMUDA) LTD
NOTES TO CONSOLIDATED FINANCIAL STATEMENTS (Continued) FOR THE YEARS ENDED DECEMBER 31, 2009 AND 2008
3. Fair Value Measurements (Continued)
Level 3 Gains and Losses (continued)
Level 3 Assets and Liabilities
Year Ended December 31, 2009 (Continued)
(U.S. dollars in thousands)
Other asset backed
securities
Non-U.S. Sovereign
Government and Supranationals
and Government Related
Short-term Investments Other investments
Derivative Contracts - Net
Balance, beginning of period ........................ $ 78,871 $ 89,152 $ 20,746 $ 58,239 $ 226,818 Realized (losses) gains ................................ (9,991) — (8,701 ) — 2,807 Movement in unrealized gains
(losses) ....................................................... (2,652) (94) 3,454 566 (147,216) Purchases, sales issuances and
settlements, net ................................ (4,982) (6,882) (12,991 ) 11,490 18,106 Transfers into Level 3 ................................ 8,531 — — — — Transfers out of Level 3 ................................ (35,822) (76,740) (3,234 ) — — Fixed maturities to short-term
investments classification change .............. — (2,219) 7,212 — — Balance, end of period ................................ $ 33,955 $ 3,217 $ 6,486 $ 70,295 $ 100,515 Movement in total (losses) above
relating to instruments still held at the reporting date ................................ $ (13,607) $ 72 $ (887 ) $ 566 $ (147,216)
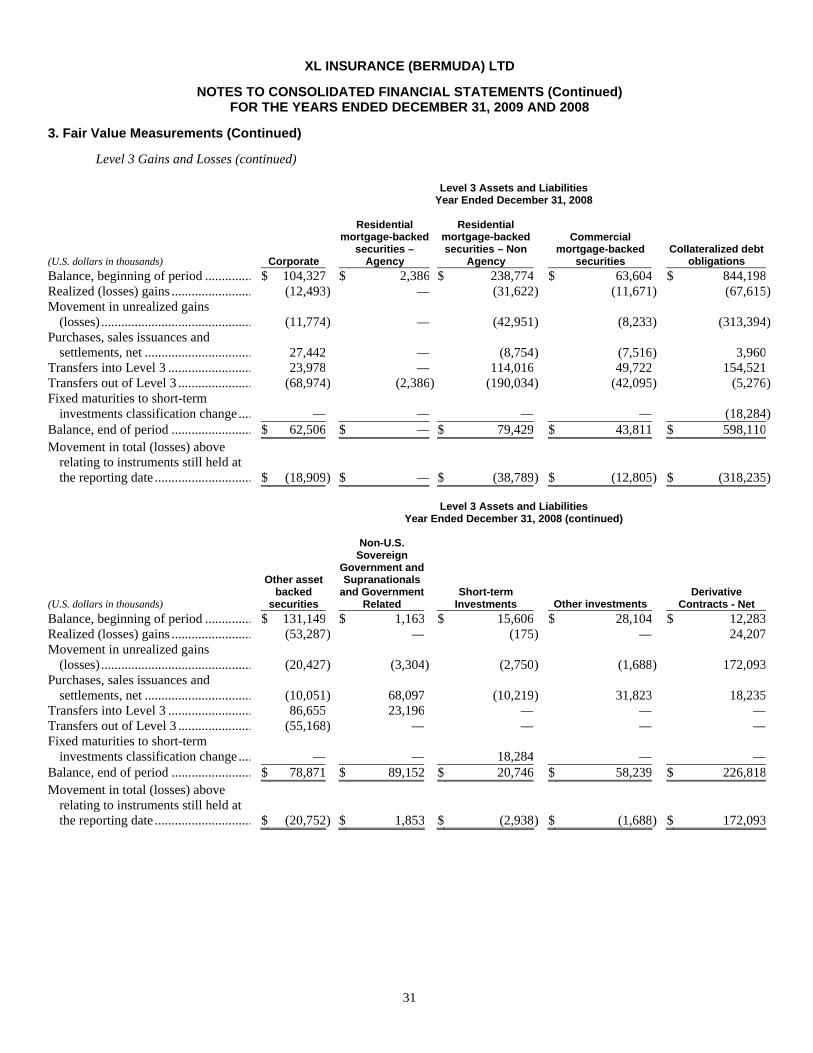
31
XL INSURANCE (BERMUDA) LTD
NOTES TO CONSOLIDATED FINANCIAL STATEMENTS (Continued) FOR THE YEARS ENDED DECEMBER 31, 2009 AND 2008
3. Fair Value Measurements (Continued)
Level 3 Gains and Losses (continued)
Level 3 Assets and Liabilities
Year Ended December 31, 2008
(U.S. dollars in thousands) Corporate
Residential mortgage-backed
securities – Agency
Residential mortgage-backed securities – Non
Agency
Commercial mortgage-backed
securities Collateralized debt
obligations Balance, beginning of period ........................ $ 104,327 $ 2,386 $ 238,774 $ 63,604 $ 844,198 Realized (losses) gains ................................ (12,493) — (31,622 ) (11,671) (67,615) Movement in unrealized gains
(losses) ....................................................... (11,774) — (42,951 ) (8,233) (313,394) Purchases, sales issuances and
settlements, net ................................ 27,442 — (8,754 ) (7,516) 3,960 Transfers into Level 3 ................................ 23,978 — 114,016 49,722 154,521 Transfers out of Level 3 ................................ (68,974) (2,386) (190,034 ) (42,095) (5,276) Fixed maturities to short-term
investments classification change .............. — — — — (18,284) Balance, end of period ................................ $ 62,506 $ — $ 79,429 $ 43,811 $ 598,110 Movement in total (losses) above
relating to instruments still held at the reporting date ................................ $ (18,909) $ — $ (38,789 ) $ (12,805) $ (318,235)
Level 3 Assets and Liabilities
Year Ended December 31, 2008 (continued)
(U.S. dollars in thousands)
Other asset backed
securities
Non-U.S. Sovereign
Government and Supranationals
and Government Related
Short-term Investments Other investments
Derivative Contracts - Net
Balance, beginning of period ........................ $ 131,149 $ 1,163 $ 15,606 $ 28,104 $ 12,283 Realized (losses) gains ................................ (53,287) — (175 ) — 24,207 Movement in unrealized gains
(losses) ....................................................... (20,427) (3,304) (2,750 ) (1,688) 172,093 Purchases, sales issuances and
settlements, net ................................ (10,051) 68,097 (10,219 ) 31,823 18,235 Transfers into Level 3 ................................ 86,655 23,196 — — — Transfers out of Level 3 ................................ (55,168) — — — — Fixed maturities to short-term
investments classification change .............. — — 18,284 — — Balance, end of period ................................ $ 78,871 $ 89,152 $ 20,746 $ 58,239 $ 226,818 Movement in total (losses) above
relating to instruments still held at the reporting date ................................ $ (20,752) $ 1,853 $ (2,938 ) $ (1,688) $ 172,093
32
XL INSURANCE (BERMUDA) LTD
NOTES TO CONSOLIDATED FINANCIAL STATEMENTS (Continued) FOR THE YEARS ENDED DECEMBER 31, 2009 AND 2008
3. Fair Value Measurements (Continued)
Level 3 Gains and Losses (continued)
In general, Level 3 assets include securities for which the values were obtained from brokers where either significant inputs were utilized in determining the value that were difficult to corroborate with observable market data, or sufficient information regarding the specific inputs utilized by the broker was not available to support a Level 2 classification. Level 3 assets also include securities for which the Company determined current market trades represent distressed transactions, and accordingly, the Company determined fair value using certain inputs that are not observable to market participants. Transfers from Level 3 to Level 2 during the year ended December 31, 2009, were primarily as a result of the Company utilizing values provided by pricing services not containing significant unobservable inputs, rather than other valuations for certain assets that would have been considered Level 3.
Fixed maturities and short-term investments
At December 31, 2009, certain assets which were previously classified as Level 3 assets due to a lack of observable market data are now classified as Level 2 assets as described further below.
For the period from December 31, 2008 through June 30, 2009, the Company had determined that internal models were more appropriate and better representative of the fair value of these securities. At June 30, 2009, the Company utilized internal valuation models for Collateralized Debt Obligations holdings (“CDOs”) with a fair value of $450.5 million and a par value of $807.5 million. However, as a result of numerous market factors, including increased volumes of trading and increased new issuance of CDOs, the Company believes that transactions in this market are no longer distressed and accordingly has reverted to third-party vendor pricing sources where transactions are available as of December 31, 2009, and where not available based the valuations on broker quotes. Accordingly, as at December 31, 2009, for those CDOs which were previously valued using internal models, the Company now carries these assets at a fair value of $538.5 million as compared to a par value of $789.1 million. Of these holdings, $457.6 million were valued by third party vendors and for which inputs are observable and accordingly are now classified as Level 2, and $80.9 million were valued using broker quotations and for which inputs are unobservable and accordingly remain classified as Level 3.
The remainder of the Level 3 assets relate to private equity investments where the nature of the underlying assets held by the investee include positions such as private business ventures and are such that significant Level 3 inputs are utilized in the valuation, and certain derivative positions.
Other investments
Included within the Other Investments component of the Company’s Level 3 valuations are private investments and alternatives where the Company is not deemed to have significant influence over the investee. The fair value of these investments is based upon net asset values received from the investment manager or general partner of the respective entity. The nature of the underlying investments held by the investee which form the basis of the net asset value include assets such as private business ventures and are such that significant Level 3 inputs are utilized in the determination of the individual underlying holding values and accordingly the fair value of the Company’s investment in each entity is classified within Level 3. The Company also incorporates factors such as the most recent financial information received, the values at which capital transactions with the investee take place, and management’s judgment regarding whether any adjustments should be made to the net asset value in recording the fair value of each position.
Derivative instruments
Derivative instruments classified within Level 3 include: (i) certain interest rate swaps where the duration of the contract the Company holds exceeds that of the longest term on a market observable input, (ii) weather and energy derivatives, (iii) GMIB benefits embedded within a certain reinsurance contract, (iv) credit derivatives sold providing protection on senior tranches of structured finance transactions where the value is obtained directly from the investment bank counterparty for which sufficient information regarding the
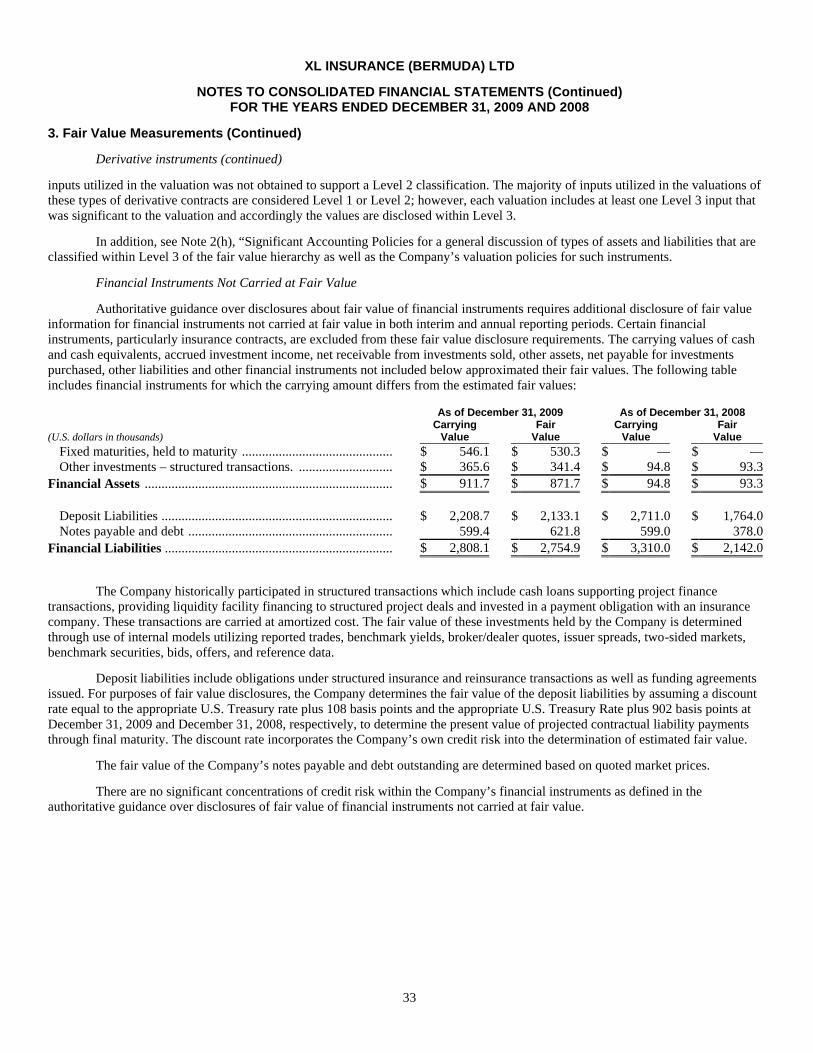
33
XL INSURANCE (BERMUDA) LTD
NOTES TO CONSOLIDATED FINANCIAL STATEMENTS (Continued) FOR THE YEARS ENDED DECEMBER 31, 2009 AND 2008
3. Fair Value Measurements (Continued)
Derivative instruments (continued)
inputs utilized in the valuation was not obtained to support a Level 2 classification. The majority of inputs utilized in the valuations of these types of derivative contracts are considered Level 1 or Level 2; however, each valuation includes at least one Level 3 input that was significant to the valuation and accordingly the values are disclosed within Level 3.
In addition, see Note 2(h), “Significant Accounting Policies for a general discussion of types of assets and liabilities that are classified within Level 3 of the fair value hierarchy as well as the Company’s valuation policies for such instruments.
Financial Instruments Not Carried at Fair Value
Authoritative guidance over disclosures about fair value of financial instruments requires additional disclosure of fair value information for financial instruments not carried at fair value in both interim and annual reporting periods. Certain financial instruments, particularly insurance contracts, are excluded from these fair value disclosure requirements. The carrying values of cash and cash equivalents, accrued investment income, net receivable from investments sold, other assets, net payable for investments purchased, other liabilities and other financial instruments not included below approximated their fair values. The following table includes financial instruments for which the carrying amount differs from the estimated fair values:
As of December 31, 2009 As of December 31, 2008
(U.S. dollars in thousands) Carrying
Value Fair
Value Carrying
Value Fair
Value Fixed maturities, held to maturity ............................................. $ 546.1 $ 530.3 $ — $ — Other investments – structured transactions. ............................ $ 365.6 $ 341.4 $ 94.8 $ 93.3
Financial Assets .......................................................................... $ 911.7 $ 871.7 $ 94.8 $ 93.3
Deposit Liabilities ..................................................................... $ 2,208.7 $ 2,133.1 $ 2,711.0 $ 1,764.0 Notes payable and debt ............................................................. 599.4 621.8 599.0 378.0
Financial Liabilities .................................................................... $ 2,808.1 $ 2,754.9 $ 3,310.0 $ 2,142.0
The Company historically participated in structured transactions which include cash loans supporting project finance transactions, providing liquidity facility financing to structured project deals and invested in a payment obligation with an insurance company. These transactions are carried at amortized cost. The fair value of these investments held by the Company is determined through use of internal models utilizing reported trades, benchmark yields, broker/dealer quotes, issuer spreads, two-sided markets, benchmark securities, bids, offers, and reference data.
Deposit liabilities include obligations under structured insurance and reinsurance transactions as well as funding agreements issued. For purposes of fair value disclosures, the Company determines the fair value of the deposit liabilities by assuming a discount rate equal to the appropriate U.S. Treasury rate plus 108 basis points and the appropriate U.S. Treasury Rate plus 902 basis points at December 31, 2009 and December 31, 2008, respectively, to determine the present value of projected contractual liability payments through final maturity. The discount rate incorporates the Company’s own credit risk into the determination of estimated fair value.
The fair value of the Company’s notes payable and debt outstanding are determined based on quoted market prices.
There are no significant concentrations of credit risk within the Company’s financial instruments as defined in the authoritative guidance over disclosures of fair value of financial instruments not carried at fair value.
34
XL INSURANCE (BERMUDA) LTD
NOTES TO CONSOLIDATED FINANCIAL STATEMENTS (Continued) FOR THE YEARS ENDED DECEMBER 31, 2009 AND 2008
4. Syncora Holdings Ltd. (“Syncora”)
On August 4, 2006, the Company completed the sale of approximately 37% of its then financial guarantee reinsurance and insurance businesses through an initial public offering (“IPO”) of 23.4 million common shares of Syncora for proceeds of approximately $446.9 million. On June 6, 2007, the Company completed the sale of a portion of Syncora’s common shares then owned by the Company through a secondary offering and thereby reduced its ownership of Syncora’s outstanding common shares further from approximately 63% to approximately 46%. Accordingly, subsequent to June 6, 2007 and up until the execution of the Master Agreement on August 5, 2008, as described below, the Company accounted for its remaining investment in Syncora using the equity method of accounting. Subsequent to August 5, 2008, the Company has no further ownership interest in Syncora.
Given management’s view of the risk exposure along with the uncertainty facing the entire financial guarantee industry, the Company reduced the reported value of its investment in Syncora to nil at December 31, 2007. The Company’s shares in Syncora were unregistered and thus illiquid. Throughout 2008 market developments with respect to the monoline industry continued to be largely negative and Syncora was downgraded by several rating agencies during this period. Accordingly, throughout 2008 and up until the closing of the Master Agreement with Syncora which resulted in the transfer by the Company of all of the shares it owned in Syncora, the Company reported its investment in Syncora at nil and less than the traded market value during this time, as it was believed the decline in value was other than temporary.
As described below, concurrent with the IPO of Syncora and subsequently, the Company entered into certain service, reinsurance and guarantee arrangements with Syncora and its subsidiaries, to govern certain aspects of the Company’s relationship with Syncora. Prior to the sale of Syncora shares through the secondary offering on June 6, 2007, the effect of these arrangements was eliminated upon consolidation of the Company’s results. The income statement impacts of all transactions with Syncora subsequent to June 6, 2007, including the impact of the closing of the transactions subject to the Master Agreement on August 5, 2008, were included in “Net (loss) income from operating affiliates.” In 2007, net losses were recorded with respect to the previous excess of loss and facultative reinsurance of Syncora subsidiaries in the amounts of $300.0 million and $51.0 million, respectively. In addition, during 2007, the Company incurred $17.9 million in additional mark-to-market losses related to those underlying contracts in credit default swap form subject to the provisions noted above.
As at September 30, 2008 and December 31, 2007, Syncora had total assets of $4.2 billion and $3.6 billion, total liabilities of $4.1 billion and $3.1 billion, outstanding preferred share equity of $246.6 million, and common shareholders’ (deficit) equity of $(183.1) million and $180.5 million, respectively. During the nine months ended September 30, 2008 and the year ended December 31, 2007, Syncora had net earned premiums of $238.6 million and $215.7 million, total revenues of $(1.0) billion and $(356.8) million, and a net loss to common shareholders before minority interest of $2.0 billion and $1.2 billion, respectively.
Service agreements
Previously, the Company had entered into a series of service agreements under which subsidiaries of the Company provided services to Syncora and its subsidiaries or received certain services from Syncora subsidiaries for a period of time after the IPO. As detailed below, subsequent to June 30, 2008 the Company executed the Master Agreement in connection with, among other things, the termination of these service agreements.
Reinsurance agreements
As noted above, the Company previously provided certain reinsurance protections with respect to adverse development on certain transactions as well as indemnification under specific facultative and excess of loss coverages for subsidiaries of Syncora: Syncora Guarantee Re Inc. (“Syncora Guarantee Re”) (formerly XL Financial Assurance Ltd. or “XLFA”) and Syncora Guarantee Inc. (“Syncora Guarantee”) (formerly XL Capital Assurance Inc. or “XLCA”). The adverse development cover related to a specific
35
XL INSURANCE (BERMUDA) LTD
NOTES TO CONSOLIDATED FINANCIAL STATEMENTS (Continued) FOR THE YEARS ENDED DECEMBER 31, 2009 AND 2008
4. Syncora Holdings Ltd. (“Syncora”) (Continued)
project financing transaction while the facultative covers generally reinsured certain policies up to the amount necessary for Syncora Guarantee and Syncora Guarantee Re to comply with certain regulatory and risk limits. The excess of loss reinsurance provided indemnification for the portion of any individual paid loss covered by Syncora Guarantee Re in excess of 10% of Syncora Guarantee Re’s surplus, up to an aggregate amount of $500 million, and excluded coverage for liabilities arising other than pursuant to the terms of the underlying policies. In 2007, in relation to the excess of loss and facultative reinsurance agreements described above, the Company recorded within “loss from operating affiliates”, losses in the amount of $300.0 million and $51.0 million, respectively. As detailed below, subsequent to June 30, 2008 the Company executed the Master Agreement in connection with, among other things, the termination of these reinsurance agreements. As at June 30, 2008 and December 31, 2007, the Company’s total net exposure under its facultative agreements with Syncora subsidiaries was approximately $6.4 billion and $7.7 billion, respectively, of net par outstanding.
Guarantee agreements
Previously, the Company also entered into certain guarantee agreements with subsidiaries of Syncora. These guarantee agreements terminated with respect to any new business written by Syncora through the underlying agreements after the effective date of Syncora’s IPO, but the agreements remained in effect with respect to cessions or guarantees written under these agreements prior to the IPO. The agreements unconditionally and irrevocably guaranteed: (i) Syncora Guarantee for the full and complete performance when due of all of Syncora Guarantee Re’s obligations under its facultative quota share reinsurance agreement with Syncora Guarantee, (ii) the full and complete payment when due of Syncora Guarantee’s obligations under certain financial guarantees issued by Syncora Guarantee and arranged by Syncora Guarantee (U.K.) Limited for the benefit of the European Investment Bank (“EIB”) and (iii) Financial Security Assurance (“Financial Security”) for the full and complete performance of Syncora Guarantee Re’s obligations under a Financial Security Master Facultative Agreement. The guarantees the Company provided contained a dual trigger, such that the guarantees responded only if two events were to occur. First, the underlying guaranteed obligation must have defaulted on payments of interest and principal, and secondly, the relevant Syncora subsidiary must have failed to meet its obligations under the applicable reinsurance or guarantee. As detailed below, subsequent to June 30, 2008 the Company executed the Master Agreement in connection with, among other things, the termination of reinsurance agreements with Syncora and its subsidiaries. As a result of the termination of these reinsurance agreements, the related guarantee agreements described above, with the exception of certain exposures relating to the European Investment Bank as described below, no longer have any force or effect. As at June 30, 2008 and December 31, 2008, the Company’s total net par outstanding falling under these guarantees was $59.2 billion and $75.2 billion, respectively.
Other agreements
As at December 31, 2008, the Company had approximately $4.0 billion of deposit liabilities associated with guaranteed investment contracts (“GICs”) for which credit enhancement was provided by Syncora Guarantee. Based on the terms and conditions of the underlying GICs, upon the downgrade of Syncora Guarantee below certain ratings levels, all or portions of the outstanding principal balances on such GICs would come due. Throughout 2008, several rating agencies downgraded Syncora and its subsidiaries and as a result, the Company settled all of the GIC liabilities during 2008.
Agreement with Syncora with Respect to Pre-IPO Guarantee and Reinsurance Agreements and Service Agreements
On July 28, 2008, the Company announced that it and certain of its subsidiaries had entered into an agreement (the “Master Agreement”) with Syncora and certain of its subsidiaries (sometimes collectively referred to herein as “Syncora”) as well as certain counterparties to credit default swap agreements (the “Counterparties”), in connection with the termination of certain reinsurance and other agreements as
36
XL INSURANCE (BERMUDA) LTD
NOTES TO CONSOLIDATED FINANCIAL STATEMENTS (Continued) FOR THE YEARS ENDED DECEMBER 31, 2009 AND 2008
4. Syncora Holdings Ltd. (“Syncora”) (Continued)
described below. The transactions and termination of certain reinsurance and other agreements under the Master Agreement closed on August 5, 2008. As part of the transaction, the Counterparties provided full releases to the Company and Syncora.
The Master Agreement provided for the payment by the Company to Syncora of $1.775 billion in cash, the issuance by the Company to Syncora of eight million of XL Capital’s Class A Ordinary Shares which were newly issued by the Company and the transfer by the Company of all of its voting, economic or other rights in the shares it owned in Syncora (representing approximately 46% of Syncora’s issued and outstanding shares) (the “Syncora Shares”) to an escrow agent in accordance with an escrow agreement between Syncora and the Counterparties. This consideration was made in exchange for, among other things, the full and unconditional:
? commutation of the Third Amended and Restated Facultative Quota Share Reinsurance Treaty, effective July 1, 2006, between Syncora Guarantee Re and Syncora Guarantee and all individual risk cessions thereunder, as a result of which the guarantee by XL Insurance (Bermuda) Ltd (“XLIB”) of Syncora Guarantee Re’s obligations to Syncora Guarantee thereunder no longer has any force or effect;
? commutation of the Excess of Loss Reinsurance Agreement, executed on October 3, 2001, pursuant to which XLIB agreed to reinsure certain liabilities of Syncora Guarantee Re (the “Excess of Loss Agreement”);
? commutation of the Second Amended and Restated Facultative Master Certificate, effective March 1, 2007, pursuant to which XL Re America, Inc. (“XLRA”) agreed to reinsure certain liabilities of Syncora Guarantee, and all individual risk cessions thereunder; (the “XLRA Master Facultative Agreement”);
? commutation of the Facultative Quota Share Reinsurance Agreement, effective August 17, 2001, as amended by Amendment No. 1 to such agreement, dated as of August 4, 2006, pursuant to which XLIB agreed to reinsure certain liabilities of Syncora Guarantee Re, and all individual risk cessions thereunder;
? commutation of the Adverse Development Reinsurance Agreement, dated as of August 4, 2006, between Syncora Guarantee and XLRA, and the Indemnification Agreement, dated as of August 4, 2006, between Syncora Guarantee Re and XLIB; and
? termination of certain indemnification and services agreements between the Company and Syncora.
The Company and Syncora obtained approval from the New York State Insurance Department for the Master Agreement and each of the commutations to which XLRA or Syncora Guarantee was a party. Syncora also complied with all applicable procedures of the Bermuda Monetary Authority, the Delaware Insurance Department and other regulators.
On August 5, 2008, and simultaneous with the closing of the Master Agreement, Syncora commuted the Amended and Restated Master Facultative Reinsurance Agreement, dated November 3, 1998, between Financial Security and Syncora Guarantee Re, and all individual risk cessions thereunder. As a result of this commutation, the Company’s guarantee of Syncora Guarantee Re’s obligations thereunder (the “Financial Security Guarantee”) no longer has any force or effect.
After the closing of the Master Agreement on August 5, 2008, approximately $64.6 billion of the Company’s total net exposure (which was $65.7 billion as at June 30, 2008) under reinsurance agreements and guarantees with Syncora subsidiaries was eliminated. Pursuant to the terms of the Master Agreement, Syncora is required to use commercially reasonable efforts to commute the agreements that are the subject of the Company’s guarantee of Syncora Guarantee’s obligations under certain financial guarantees issued by Syncora Guarantee to the European Investment Bank (the “EIB Policies”), subject to certain limitations. These guarantees were provided for the benefit of EIB and are made up of transportation and public
37
XL INSURANCE (BERMUDA) LTD
NOTES TO CONSOLIDATED FINANCIAL STATEMENTS (Continued) FOR THE YEARS ENDED DECEMBER 31, 2009 AND 2008
4. Syncora Holdings Ltd. (“Syncora”) (Continued)
building risk with an average rating of BBB, written between 2001 and 2006 with anticipated maturities ranging between 2027 and 2038. As at December 31, 2009, the Company’s exposures relating to the EIB Policies (which relate to project finance transactions) was approximately $920.5 million, reduced from $1.1 billion at June 30, 2008, mainly due to the strengthening of the U.S. dollar against the currencies of the underlying obligations. As of December 31, 2009, there have been no reported events of default on the underlying obligations, accordingly, no reserves have been recorded.
The terms of the Master Agreement were determined in consideration of a number of commercial and economic factors associated with all existing relationships with Syncora, including, but not limited to, a valuation of the consideration for the commuted agreements and any potential future claims thereunder and the impact of outstanding uncertainty on both the ratings and business operations of the Company. The total value of the consideration noted above of $1.775 billion as well as the eight million ordinary shares of the Company transferred to Syncora valued at $128.0 million, significantly exceeded the carried net liabilities of approximately $490.7 million related to such reinsurances and guarantees. Management considers the execution of the Master Agreement as the event giving rise to the additional liability. As detailed in the table below, the Company recorded a loss of approximately $1.4 billion in respect of the closing of the Master Agreement during the year ended December 31, 2008: (U.S. dollars in millions) Carried liabilities in relation to reinsurance and guarantee agreements commuted under the
Master Agreement ...................................................................................................................................................... $ 490.7 Other accruals ................................................................................................................................................................ (5.2) Cash payment made to Syncora in August 2008 ............................................................................................................ (1,775.0) Value of XL common shares transferred under the Master Agreement ......................................................................... (128.0) Net loss associated with Master Agreement recorded in the year ended December 31, 2008 ............................... $ (1,417.5)
5. Restructuring and Asset Impairment Charges
During the third quarter of 2008 and during the first quarter of 2009, expense reduction initiatives were implemented in order to reduce the Company’s operating expenses. The goal of these initiatives was to achieve enhanced efficiency and an overall reduction in operating expenses by streamlining processes across all geographic locations, with a primary emphasis on corporate functions. To date, this has been achieved through redundancies, increased outsourcing and the cessation of certain projects and activities. Charges have been recognized and accrued as restructuring and asset impairment charges and allocated to the Company’s reportable segments in accordance with authoritative guidance over accounting for costs associated with exit or disposal activities and guidance over accounting for the impairment or disposal of long-lived assets. Other costs that do not meet the criteria for accrual are being expensed as restructuring charges as they are incurred. Restructuring charges relate mainly to employee termination benefits as well as costs associated with ceasing to use certain leased property accounted for as operating leases. Asset impairment charges relate primarily to the write-off of certain IT system and equipment costs previously capitalized. The Company recognizes an asset impairment charge when net proceeds expected from disposition of an asset are less than the carrying value of the asset and reduces the carrying amount of the asset to its estimated fair value. Restructuring and asset impairment charges noted above have been recorded in the Company’s income statement under “Operating Expenses”.
38
XL INSURANCE (BERMUDA) LTD
NOTES TO CONSOLIDATED FINANCIAL STATEMENTS (Continued) FOR THE YEARS ENDED DECEMBER 31, 2009 AND 2008
5. Restructuring and Asset Impairment Charges (Continued)
Total estimated costs the Company expects to incur in connection with the restructuring initiatives noted above as well as costs incurred during the year ended December 31, 2009 and total cumulative costs incurred through December 31, 2009 are as follows:
(U.S. dollars in millions)
Total Expected
Costs
Costs Incurred During the Year Ended
December 31, 2009
Cumulative Costs Incurred
through December 31,
2009 Employee Termination Benefits ................................................................ $ 81.8 $ 44.7 $ 80.9 Lease Termination and Other Costs ................................................................ 14.5 8.0 14.6 Asset Impairment ................................................................................................ 20.5 20.5 20.5
Total ................................................................................................ $ 116.8 $ 73.2 $ 116.0
Activity related to restructuring and asset impairment charges for the year ended December 31, 2009 was as follows:
(U.S. dollars in millions)
Accrual at December 31,
2008 Costs
Incurred Amounts Paid and Assets Impaired
Balance of Liability at December 31,
2009 Employee Termination Benefits ................................ $ 4.4 $ 44.7 $ 38.9 $ 10.2 Lease Termination and Other Costs ................................ 5.3 8.0 10.3 3.0 Asset Impairment ................................................................ — 20.5 20.5 —
Total ................................................................................................ $ 9.7 $ 73.2 $ 69.7 $ 13.2
Costs incurred through December 31, 2008 and total estimated costs the Company expects to incur in connection with the restructuring and asset impairment implemented during the third quarter of 2008 were as follows:
(U.S. dollars in millions)
Total Expected
Costs
Costs Incurred through
December 31, 2008
Employee Termination Benefits ....................................................................................................................... $ 38.2 $ 36.2 Lease Termination and Other Costs .................................................................................................................. 6.6 6.6
Total .............................................................................................................................................................. $ 44.8 $ 42.8
Activity related to restructuring and asset impairment charges for the year ended December 31, 2008 were as follows:
(U.S. dollars in millions)
Accrual at December 31,
2007 Costs
Incurred Amounts Paid and Assets Impaired
Balance of Liability at December 31,
2008 Employee Termination Benefits ................................................................ $ — $ 36.2 $ 31.8 $ 4.4 Lease Termination and Other Costs ................................................................ — 6.6 1.3 5.3
Total ................................................................................................ $ — $ 42.8 $ 33.1 $ 9.7

39
XL INSURANCE (BERMUDA) LTD
NOTES TO CONSOLIDATED FINANCIAL STATEMENTS (Continued) FOR THE YEARS ENDED DECEMBER 31, 2009 AND 2008
6. Goodwill and Other Intangible Assets
The following table presents an analysis of intangible assets broken down between goodwill, intangible assets with an indefinite life and intangible assets with a definite life for the years ended December 31, 2009, 2008 and 2007:
(U.S. dollars in thousands) Goodwill
Intangible assets with an indefinite life
Intangible assets with a definite life Total
Balance at December 31, 2007................................................ $ 650,354 $ 30,195 $ 6,580 $ 687,129 Reclassification.................................................................... 5,089 (11,529) 6,440 – Impairment .......................................................................... (14,971) – – (14,971) Amortization........................................................................ – – (2,968) (2,968) Foreign Currency Translation.............................................. 4,898 – – 4,898
Balance at December 31, 2008................................................ $ 645,370 $ 18,666 $ 10,052 $ 674,088 Reclassification.................................................................... – – (4,440) (4,440) Amortization........................................................................ – (3,300) (1,858) (5,158) Foreign Currency Translation.............................................. 1,179 – – 1,179
Balance at December 31, 2009................................................ $ 646,549 $ 15,366 $ 3,754 $ 665,669
The Company has goodwill of $646.5 million as at December 31, 2009. The estimated fair values of these reporting units exceeded their net book values as of December 31, 2009 and therefore no impairments were recorded during 2009. There were no goodwill impairment charges recorded by the Company in any year prior to the amount recorded during 2008.
During July 2009, the Company entered into an agreement to sell its U.S. life reinsurance business. The transaction closed during the fourth quarter of 2009. Accordingly, the full value of the licenses held relating to this business of $3.3 million was removed from intangible assets with an indefinite life as part of the sale transaction.
In addition, during 2009 certain internal use software acquired as part of the GAPS acquisition, with a carried value of $4.4 million was reclassified from intangible assets with a definite life into other assets. No impairments were recorded on intangible assets during any of the years ended December 2009 and 2008.
40
XL INSURANCE (BERMUDA) LTD
NOTES TO CONSOLIDATED FINANCIAL STATEMENTS (Continued) FOR THE YEARS ENDED DECEMBER 31, 2009 AND 2008
7. Business Combinations
Global Asset Protection Services LLC (“GAPS”)
On November 30, 2007, the Company purchased all of the issued and outstanding limited liability company interests in GAPS, a loss prevention consulting service provider. GAPS is a provider of unbundled loss prevention consulting services, offering individually tailored risk management solutions to risk managers, insurance brokers and insurance company clients operating on a global basis.
The GAPS operation and XL Insurance’s existing loss prevention services were merged to form XL GAPS. XL GAPS employs more than 150 engineers worldwide, with a strong presence in America, Europe, Asia and Australia and will remain independent of XL’s underwriting operations and will continue to provide loss prevention consulting services to existing clients as well as to clients of the Company. The acquisition is intended to help the Company achieve its long-term growth plans in both the loss prevention market and as a primary insurer. The focus is to offer XL GAPS clients high quality risk management solutions.
The aggregate purchase price after receipt of a final closing balance sheet in 2008 was $33.4 million. Of the final purchase price paid, $4.7 million was allocated to the identifiable net assets assumed, with the remaining $28.7 million recorded as goodwill. GAPS results of operations were included in the Company’s income statement from the date of purchase.
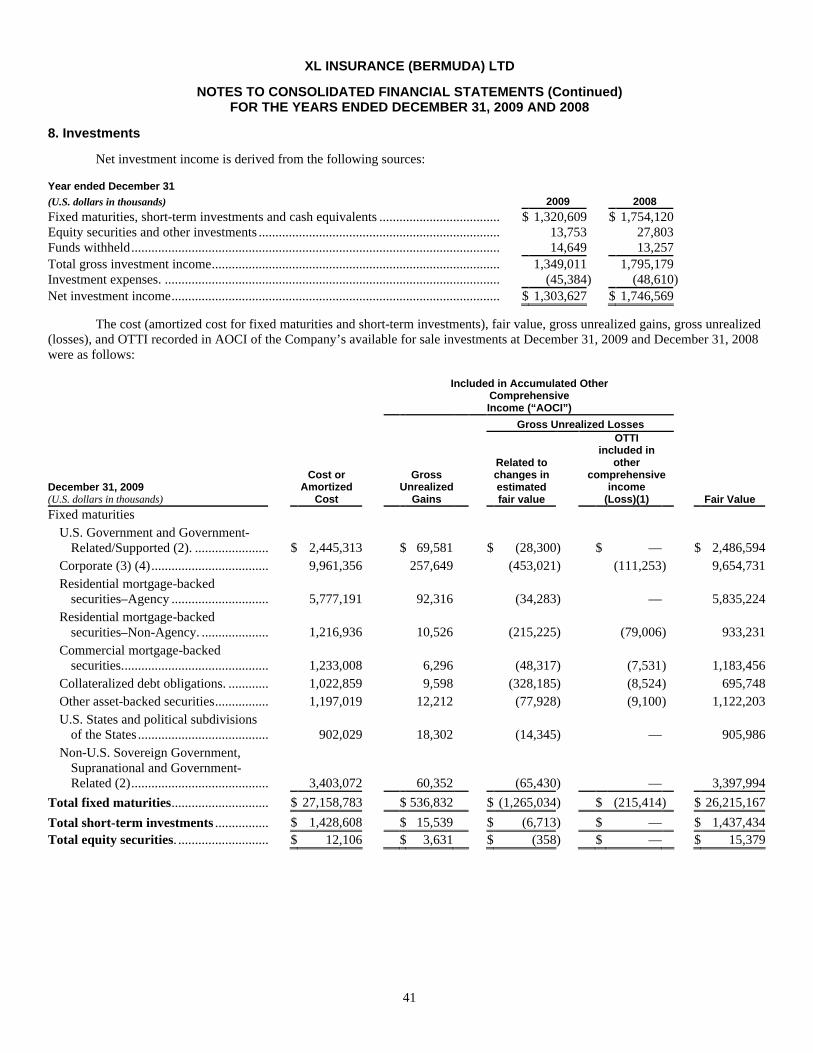
41
XL INSURANCE (BERMUDA) LTD
NOTES TO CONSOLIDATED FINANCIAL STATEMENTS (Continued) FOR THE YEARS ENDED DECEMBER 31, 2009 AND 2008
8. Investments
Net investment income is derived from the following sources:
Year ended December 31 (U.S. dollars in thousands) 2009 2008 Fixed maturities, short-term investments and cash equivalents ............................................ $ 1,320,609 $ 1,754,120 Equity securities and other investments ................................................................................ 13,753 27,803 Funds withheld...................................................................................................................... 14,649 13,257 Total gross investment income.............................................................................................. 1,349,011 1,795,179 Investment expenses. ............................................................................................................ (45,384) (48,610) Net investment income.......................................................................................................... $ 1,303,627 $ 1,746,569
The cost (amortized cost for fixed maturities and short-term investments), fair value, gross unrealized gains, gross unrealized (losses), and OTTI recorded in AOCI of the Company’s available for sale investments at December 31, 2009 and December 31, 2008 were as follows:
Included in Accumulated Other Comprehensive Income (“AOCI”)
Gross Unrealized Losses
December 31, 2009 (U.S. dollars in thousands)
Cost or Amortized
Cost
Gross Unrealized
Gains
Related to changes in estimated fair value
OTTI included in
other comprehensive
income (Loss)(1) Fair Value
Fixed maturities U.S. Government and Government-
Related/Supported (2). ........................... $ 2,445,313 $ 69,581 $ (28,300) $ — $ 2,486,594 Corporate (3) (4)........................................ 9,961,356 257,649 (453,021) (111,253 ) 9,654,731 Residential mortgage-backed
securities–Agency ................................ 5,777,191 92,316 (34,283) — 5,835,224 Residential mortgage-backed
securities–Non-Agency. ......................... 1,216,936 10,526 (215,225) (79,006 ) 933,231 Commercial mortgage-backed
securities................................................. 1,233,008 6,296 (48,317) (7,531 ) 1,183,456 Collateralized debt obligations. ................. 1,022,859 9,598 (328,185) (8,524 ) 695,748 Other asset-backed securities..................... 1,197,019 12,212 (77,928) (9,100 ) 1,122,203 U.S. States and political subdivisions
of the States ............................................ 902,029 18,302 (14,345) — 905,986 Non-U.S. Sovereign Government,
Supranational and Government-Related (2).............................................. 3,403,072 60,352 (65,430) — 3,397,994
Total fixed maturities................................ $ 27,158,783 $ 536,832 $ (1,265,034) $ (215,414 ) $ 26,215,167
Total short-term investments ..................... $ 1,428,608 $ 15,539 $ (6,713) $ — $ 1,437,434 Total equity securities. ................................ $ 12,106 $ 3,631 $ (358) $ — $ 15,379
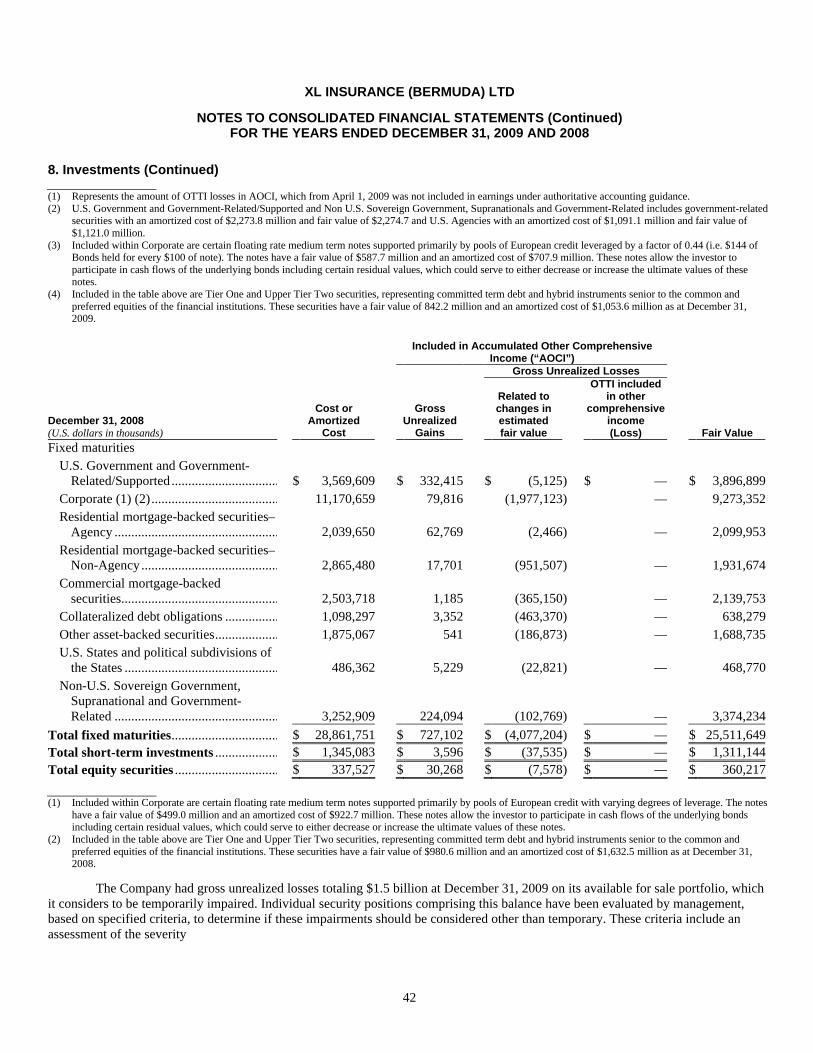
42
XL INSURANCE (BERMUDA) LTD
NOTES TO CONSOLIDATED FINANCIAL STATEMENTS (Continued) FOR THE YEARS ENDED DECEMBER 31, 2009 AND 2008
8. Investments (Continued)
(1) Represents the amount of OTTI losses in AOCI, which from April 1, 2009 was not included in earnings under authoritative accounting guidance. (2) U.S. Government and Government-Related/Supported and Non U.S. Sovereign Government, Supranationals and Government-Related includes government-related
securities with an amortized cost of $2,273.8 million and fair value of $2,274.7 and U.S. Agencies with an amortized cost of $1,091.1 million and fair value of $1,121.0 million.
(3) Included within Corporate are certain floating rate medium term notes supported primarily by pools of European credit leveraged by a factor of 0.44 (i.e. $144 of Bonds held for every $100 of note). The notes have a fair value of $587.7 million and an amortized cost of $707.9 million. These notes allow the investor to participate in cash flows of the underlying bonds including certain residual values, which could serve to either decrease or increase the ultimate values of these notes.
(4) Included in the table above are Tier One and Upper Tier Two securities, representing committed term debt and hybrid instruments senior to the common and preferred equities of the financial institutions. These securities have a fair value of 842.2 million and an amortized cost of $1,053.6 million as at December 31, 2009.
Included in Accumulated Other Comprehensive
Income (“AOCI”) Gross Unrealized Losses
December 31, 2008 (U.S. dollars in thousands)
Cost or Amortized
Cost
Gross Unrealized
Gains
Related to changes in estimated fair value
OTTI included in other
comprehensive income (Loss) Fair Value
Fixed maturities U.S. Government and Government-
Related/Supported ................................ $ 3,569,609 $ 332,415 $ (5,125) $ — $ 3,896,899 Corporate (1) (2)................................................................ 11,170,659 79,816 (1,977,123) — 9,273,352 Residential mortgage-backed securities–
Agency ................................................................ 2,039,650 62,769 (2,466) — 2,099,953 Residential mortgage-backed securities–
Non-Agency ................................................................ 2,865,480 17,701 (951,507) — 1,931,674 Commercial mortgage-backed
securities................................................................ 2,503,718 1,185 (365,150) — 2,139,753 Collateralized debt obligations ................................ 1,098,297 3,352 (463,370) — 638,279 Other asset-backed securities................................ 1,875,067 541 (186,873) — 1,688,735 U.S. States and political subdivisions of
the States ................................................................ 486,362 5,229 (22,821) — 468,770 Non-U.S. Sovereign Government,
Supranational and Government-Related ................................................................ 3,252,909 224,094 (102,769) — 3,374,234
Total fixed maturities................................ $ 28,861,751 $ 727,102 $ (4,077,204) $ — $ 25,511,649 Total short-term investments ................................ $ 1,345,083 $ 3,596 $ (37,535) $ — $ 1,311,144 Total equity securities ................................ $ 337,527 $ 30,268 $ (7,578) $ — $ 360,217
(1) Included within Corporate are certain floating rate medium term notes supported primarily by pools of European credit with varying degrees of leverage. The notes have a fair value of $499.0 million and an amortized cost of $922.7 million. These notes allow the investor to participate in cash flows of the underlying bonds including certain residual values, which could serve to either decrease or increase the ultimate values of these notes.
(2) Included in the table above are Tier One and Upper Tier Two securities, representing committed term debt and hybrid instruments senior to the common and preferred equities of the financial institutions. These securities have a fair value of $980.6 million and an amortized cost of $1,632.5 million as at December 31, 2008.
The Company had gross unrealized losses totaling $1.5 billion at December 31, 2009 on its available for sale portfolio, which it considers to be temporarily impaired. Individual security positions comprising this balance have been evaluated by management, based on specified criteria, to determine if these impairments should be considered other than temporary. These criteria include an assessment of the severity
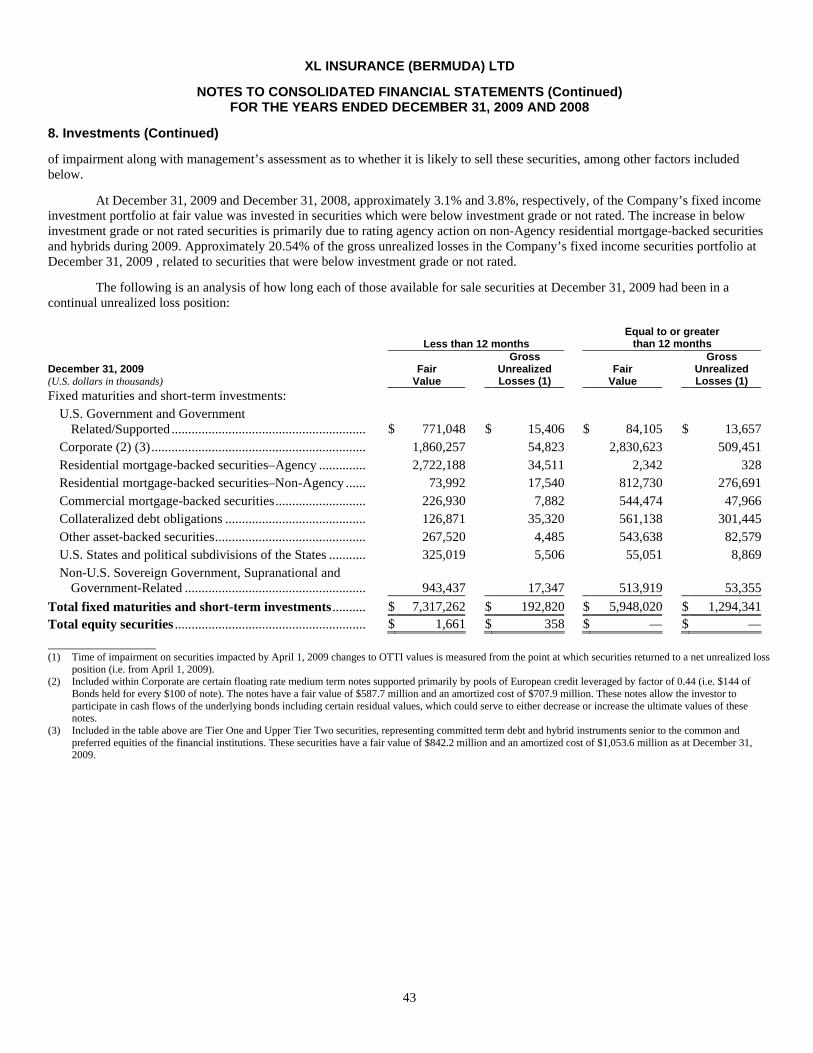
43
XL INSURANCE (BERMUDA) LTD
NOTES TO CONSOLIDATED FINANCIAL STATEMENTS (Continued) FOR THE YEARS ENDED DECEMBER 31, 2009 AND 2008
8. Investments (Continued)
of impairment along with management’s assessment as to whether it is likely to sell these securities, among other factors included below.
At December 31, 2009 and December 31, 2008, approximately 3.1% and 3.8%, respectively, of the Company’s fixed income investment portfolio at fair value was invested in securities which were below investment grade or not rated. The increase in below investment grade or not rated securities is primarily due to rating agency action on non-Agency residential mortgage-backed securities and hybrids during 2009. Approximately 20.54% of the gross unrealized losses in the Company’s fixed income securities portfolio at December 31, 2009 , related to securities that were below investment grade or not rated.
The following is an analysis of how long each of those available for sale securities at December 31, 2009 had been in a continual unrealized loss position:
Less than 12 months Equal to or greater
than 12 months
December 31, 2009 (U.S. dollars in thousands)
Fair Value
Gross Unrealized Losses (1)
Fair Value
Gross Unrealized Losses (1)
Fixed maturities and short-term investments: U.S. Government and Government
Related/Supported ................................................................ $ 771,048 $ 15,406 $ 84,105 $ 13,657 Corporate (2) (3)................................................................................................ 1,860,257 54,823 2,830,623 509,451 Residential mortgage-backed securities–Agency ................................ 2,722,188 34,511 2,342 328 Residential mortgage-backed securities–Non-Agency ................................ 73,992 17,540 812,730 276,691 Commercial mortgage-backed securities................................ 226,930 7,882 544,474 47,966 Collateralized debt obligations ................................................................ 126,871 35,320 561,138 301,445 Other asset-backed securities................................................................ 267,520 4,485 543,638 82,579 U.S. States and political subdivisions of the States ................................ 325,019 5,506 55,051 8,869 Non-U.S. Sovereign Government, Supranational and
Government-Related ................................................................ 943,437 17,347 513,919 53,355 Total fixed maturities and short-term investments................................ $ 7,317,262 $ 192,820 $ 5,948,020 $ 1,294,341 Total equity securities ................................................................ $ 1,661 $ 358 $ — $ —
(1) Time of impairment on securities impacted by April 1, 2009 changes to OTTI values is measured from the point at which securities returned to a net unrealized loss position (i.e. from April 1, 2009).
(2) Included within Corporate are certain floating rate medium term notes supported primarily by pools of European credit leveraged by factor of 0.44 (i.e. $144 of Bonds held for every $100 of note). The notes have a fair value of $587.7 million and an amortized cost of $707.9 million. These notes allow the investor to participate in cash flows of the underlying bonds including certain residual values, which could serve to either decrease or increase the ultimate values of these notes.
(3) Included in the table above are Tier One and Upper Tier Two securities, representing committed term debt and hybrid instruments senior to the common and preferred equities of the financial institutions. These securities have a fair value of $842.2 million and an amortized cost of $1,053.6 million as at December 31, 2009.

44
XL INSURANCE (BERMUDA) LTD
NOTES TO CONSOLIDATED FINANCIAL STATEMENTS (Continued) FOR THE YEARS ENDED DECEMBER 31, 2009 AND 2008
8. Investments (Continued)
The following is an analysis of how long each of those available for sale securities at December 31, 2008 had been in a continual unrealized loss position:
Less than 12 months Equal to or greater
than 12 months
December 31, 2008 (U.S. dollars in thousands)
Fair Value
Gross Unrealized
Losses Fair
Value
Gross Unrealized
Losses Fixed maturities and short-term investments:
U.S. Government and Government-Related/Supported................................ $ 103,040 $ 7,210 $ — $ — Corporate (1) (2)................................................................................................ 3,631,493 631,711 3,955,063 1,359,316 Residential mortgage-backed securities–Agency ................................ 24,590 1,276 2,734 1,190 Residential mortgage-backed securities–Non-Agency ................................ 861,578 452,246 886,949 499,261 Commercial mortgage-backed securities................................ 961,040 155,203 832,537 209,947 Collateralized debt obligations ................................................................ 51,965 24,620 602,839 442,007 Other asset-backed securities................................................................ 1,170,797 84,159 389,501 102,714 U.S. States and political subdivisions of the States ................................ 201,049 9,769 37,328 13,072
Non-U.S. Sovereign Government, Supranational and Government-Related................................................................ 612,380 92,632 168,834 28,406
Total fixed maturities and short-term investments................................ $ 7,617,932 $ 1,458,826 $ 6,875,785 $ 2,655,913 Total equity securities ................................................................ $ 188,614 $ 7,578 $ — $ —
(1) Included within Corporate are certain floating rate medium term notes supported primarily by pools of European credit with varying degrees of leverage. The notes have a fair value of $499.0 million and an amortized cost of $922.7 million. These notes allow the investor to participate in cash flows of the underlying bonds including certain residual values, which could serve to either decrease or increase the ultimate values of these notes.
(2) Included in the table above are Tier One and Upper Tier Two securities, representing committed term debt and hybrid instruments senior to the common and preferred equities of the financial institutions. These securities have a fair value of $980.6 million and an amortized cost of $1,632.5 million as at December 31, 2008.
The contractual maturities of available for sale fixed income securities are shown below. Actual maturities may differ from contractual maturities because borrowers may have the right to call or prepay obligations with or without call or prepayment penalties. December 31, 2009 (1) December 31, 2008 (1)
(U.S. dollars in thousands) Amortized
Cost Fair
Value Amortized
Cost Fair
Value Due after 1 through 5 years................................................................ $ 7,708,368 $ 7,747,103 $ 7,355,875 $ 6,891,507 Due after 5 through 10 years................................................................ 3,916,670 3,943,255 5,315,957 5,097,669 Due after 10 years ................................................................ 5,086,732 4,754,947 5,807,707 5,024,079 16,711,770 16,445,305 18,479,539 17,013,255 Residential mortgage-backed securities–Agency................................ 5,777,191 5,835,224 2,039,650 2,099,953 Residential mortgage-backed securities–Non-Agency................................ 1,216,936 933,231 2,865,480 1,931,674 Commercial mortgage-backed securities ................................ 1,233,008 1,183,456 2,503,718 2,139,753 Collateralized debt obligations................................................................ 1,022,859 695,748 1,098,297 638,279 Other asset-backed securities ................................................................ 1,197,019 1,122,203 1,875,067 1,688,735 Total mortgage and asset-backed securities ................................ 10,447,013 9,769,862 10,382,212 8,498,394
Total................................................................................................ $ 27,158,783 $ 26,215,167 $ 28,861,751 $ 25,511,649
(1) Included in the table above are $842.2 million and $980.6 million in Tier One and Upper Tier Two securities, representing committed term debt and hybrid instruments senior to the common and preferred equities of the financial institutions, at fair value
45
XL INSURANCE (BERMUDA) LTD
NOTES TO CONSOLIDATED FINANCIAL STATEMENTS (Continued) FOR THE YEARS ENDED DECEMBER 31, 2009 AND 2008
8. Investments (Continued)
as at December 31, 2009 and December 31, 2008, respectively. These securities have been distributed in the table based on their call date and have net unrealized losses of $211.4 million and $651.8 million as at December 31, 2009 and December 31, 2008, respectively.
Factors considered in determining that the remaining gross unrealized loss is not other-than-temporarily impaired include management’s consideration of current and near term liquidity needs and other available sources, an evaluation of the factors and time necessary for recovery, and the results of on-going retrospective reviews of security sales and the basis for such sales.
Gross unrealized losses of $1.5 billion on available for sale assets at December 31, 2009 can be attributed to the following significant drivers:
? gross unrealized losses of $428.3 million related to the Company’s Life Operations investment portfolio, which had a fair value of $6.4 billion as at December 31, 2009. Of this, $262.7 million of gross unrealized losses related to $1.7 billion of exposures to corporate financial institutions including $904.3 million Tier One and Upper Tier Two securities. At December 31, 2009, this portfolio had an average interest rate duration of 8.7 years, primarily denominated in U.K. Sterling and Euros. As a result of the long duration, significant gross losses have arisen as the fair values of these securities are more sensitive to prevailing government interest rates and credit spreads. This portfolio is matched to corresponding long duration liabilities. A hypothetical parallel increase in interest rates and credit spreads of 50 and 25 basis points, respectively, would increase the unrealized losses related to this portfolio at December 31, 2009 by approximately $273.8 million and $114.2 million, respectively on both the available for sale and held to maturity portfolios. Given the long term nature of this portfolio, and the level of credit spreads as at December 31, 2009 relative to historical averages within the U.K. and Euro-zone as well as the Company’s liquidity needs at December 31, 2009, the Company believes that these assets will continue to be held until such time as they mature, or credit spreads revert to levels more consistent with historical averages.
? gross unrealized losses of $244.0 million related to the corporate holdings within the Company’s non-life fixed income portfolios, which had a fair value of $6.7 billion as at December 31, 2009. During the year ended December 31, 2009, as a result of declining credit spreads, the gross unrealized losses on these holdings has declined substantially. Despite the rally during the last three quarters of 2009, corporate credit spreads remain at elevated levels relative to historical averages. The Company continues to believe that the gross unrealized losses are a reflection of a premium being charged by the market for credit, rather than fundamental deterioration in the debt service capabilities of the issuers.
Of the gross unrealized losses noted above $121.8 million relate to medium term notes primarily supported by pools of investment grade European credit with varying degrees of leverage. These had a fair value of $587.7 million at December 31, 2009. Management believes that expected cash flows over the expected holding period from these bonds is sufficient to support the remaining reported amortized cost.
? gross unrealized losses of $205.1 million related to the Topical Asset portfolio (which consists of the Company’s holdings of sub-prime non-agency securities, second liens, ABS CDOs with sub-prime collateral as well as Alt-A mortgage exposures), which had a fair value of $410.4 million as at December 31, 2009. The Company undertook a security level review in conjunction with its investment manager service providers of these securities and recognized charges to the extent it believed the discounted cash flow value (to fair value in certain cases) of any security was below its amortized cost. The Company has recognized realized losses, consisting of charges for OTTI and realized losses from sales, of approximately $779.4 million since the beginning of 2007 and through December 31, 2009 on these asset classes.
The Company purchased a number of these assets to support the previously written GIC and funding agreement contracts and has reduced its exposure to this asset class as part of its strategic portfolio
46
XL INSURANCE (BERMUDA) LTD
NOTES TO CONSOLIDATED FINANCIAL STATEMENTS (Continued) FOR THE YEARS ENDED DECEMBER 31, 2009 AND 2008
8. Investments (Continued)
realignment. The Company believes that, based on market conditions and liquidity needs at December 31, 2009, this reduction will be realized through natural cash flows of the portfolio, and limited selective sales, rather than selling these assets into markets which continue to be illiquid and not reflective of the intrinsic value of these assets. The weighted average terms-to-maturity of the sub-prime and Alt-A residential holdings within this portfolio at December 31, 2009 were 3.3 years and 4.0 years, respectively. The Company, based on current market conditions and liquidity needs as well as its assessment of the holdings, believes it will continue to hold these securities until either maturity, or a return of liquidity and valuations more reflective of intrinsic value of these holdings.
? gross unrealized losses of $333.0 million related to the non-life portfolio of Core CDO holdings (defined by the Company as investments in non-subprime collateralized debt obligations), which consisted primarily of CDOs and had a fair value of $697.7 million as of December 31, 2009. The Company undertook a security level review in conjunction with its investment manager service providers of these securities and recognized charges to the extent it believed the discounted cash flow value of the security was below the amortized cost. The Company believes that the level of impairment is primarily a function of historically wide spreads in the CDO market during the period, driven by the level of illiquidity in this market. The Company purchased a number of these assets to support the previously written GIC and Funding Agreement contracts and has announced its intention to reduce its exposure to this asset class over time as a part of its strategic portfolio realignment. The Company, based on current market conditions and liquidity needs as well as its assessment of the holdings, believes it is likely that the Company will continue to hold these securities until either maturity or a recovery of value, following which the Company intends to reduce its exposure to this asset class.
? gross unrealized losses of $49.8 million related to the non-life portion of CMBS holdings, which had a fair value of $1.1 billion as at December 31, 2009. The Company’s holdings in CMBS are 86.9% rated AAA. The Company’s exposure to downgrades below investment grade has been small, and it believes that the currently depressed pricing, which represents approximately 96.7% of the par value of the securities, is directly related to the aggregate 258 basis point widening in credit spreads within this market since June 2007, as a result of the heightened risk premium attached to the collateral. Credit spreads have improved significantly during 2009. The Company’s portfolio is highly diversified, has limited delinquencies and has experienced limited downgrades and has high levels of subordination relative to expected losses.
? gross unrealized losses of $62.0 million related to the Company’s holdings in non-agency RMBS secured by prime mortgages which had a fair value of $327.2 million at December 31, 2009. In the U.S., the average price on these securities declined to approximately 84.7% of par value at December 31, 2009, reflecting concerns over rising unemployment in the U.S. and the potential impact on previously high quality borrowers to meet their obligations. The Company undertook a security level review in conjunction with its investment manager service providers of these securities and recognized charges to the extent it believed the intrinsic value of any security was below its amortized cost.
Management, in its assessment of whether securities in a gross unrealized loss position are temporarily impaired, considers the significance of the impairments. The Company had structured credit securities with gross unrealized losses of $212.7million, with a fair value of $117.6 million, which as at December 31, 2009 were impaired by greater than 50% of amortized costs. All of these are asset-backed securities. Of these gross unrealized losses, $59.1 million are rated investment grade. The Company has evaluated each of these securities in conjunction with its investment manager service providers and believes it is more likely than not that the issuer will be able to fund sufficient principal and interest payments to support the current amortized cost, and believes that the current levels of impairments are a function of the currently extremely elevated levels of credit spreads. These securities include gross unrealized losses of $62.2
47
XL INSURANCE (BERMUDA) LTD
NOTES TO CONSOLIDATED FINANCIAL STATEMENTS (Continued) FOR THE YEARS ENDED DECEMBER 31, 2009 AND 2008
8. Investments (Continued)
million on Topical assets, $127.6 million on Core CDOs, $0.5 million on prime RMBS and $4.6 million on CMBS holdings.
Included in the gross unrealized losses associated with the Company’s corporate portfolio as of December 31, 2009 are gross unrealized losses of $8.6 million related to Tier One and Upper Tier Two securities that have been rated below investment grade by at least one major rating agency. Of this total, none have gross unrealized losses representing greater than 50% of amortized cost. The Company has completed its review of this portfolio and believes, at this time, that these impairments remain temporary in nature. The primary basis for this conclusion was the analysis of the fundamentals of these securities using a debt-based impairment model, which indicated these securities continue to meet their obligations, and the issuer has the ability to call these obligations at their call date. In addition, as these securities are below investment grade, the Company considered these securities using an equity-impairment model. Factors that were considered and supported that these impairments were temporary included that the vast majority of these securities had only recently been rated below-investment-grade beginning in first quarter of 2009, in certain cases alternative ratings were available that indicated these securities remained investment grade, or the securities were only slightly below investment-grade. At December 31, 2009, the Company believes that it is likely that the fair values of these securities will ultimately increase to equal the cost basis over a reasonable period of time. However, there is a high degree of judgment in reaching this conclusion, including an assessment of how various governments will treat these securities in the event of governmental intervention in these institutions’ operations or management’s decision to defer calls or coupons. Management will closely monitor the developments related to these securities.
The Company recorded net impairment charges of $757.6 million and $1.0 billion for the year ended December 31, 2009 and for the year ended December 31, 2008, respectively. Impairment charges to March 31, 2009 include charges of OTTI related to the non-credit impairment of unrealized losses. From April 1, 2009, the non-credit impairment is excluded from net impairments. The significant assumptions and inputs associated with these securities consist of:
? For corporate securities, excluding medium term notes backed primarily by investment grade European credit, the Company recorded net impairments totaling $151.4 million for the year ended December 31, 2009. The impairment charges consisted of below-investment grade securities, below-investment grade hybrids, where the Company considered impairment factors consistent with an equity impairment model, along with a debt impairment model, and accordingly recorded impairment charges to fair value, or securities in an unrealized loss position that management intends to sell.
In addition the Company recorded impairments totaling $226.9 million for the year ended December 31, 2009 in relation to medium term notes backed primarily by investment grade European credit. Management has concluded that, following recent credit spread movements during 2009, future yields within the supporting collateral were not sufficient to support the previously reported amortized cost.
? For structured credit securities, the Company recorded net impairments of $352.1million for the year ended December 31, 2009. The Company determined that the likely recovery on these securities was below the carrying value, and accordingly impaired the securities to the discounted value of the cash flows of these securities.
? For equity securities, the Company recorded net impairments of $27.2 million for the year ended December 31, 2009, respectively, primarily representing securities in an unrealized loss position that management does not have the intent to hold to recovery.
? For the year ended December 31, 2009, included in the above totals is $160.6 million related to changes to intent-to-hold up to March 31, 2009, or intent to sell from April, 2009, primarily representing exchanges of hybrid securities, and as part of the fourth quarter 2008 restructuring charge.
48
XL INSURANCE (BERMUDA) LTD
NOTES TO CONSOLIDATED FINANCIAL STATEMENTS (Continued) FOR THE YEARS ENDED DECEMBER 31, 2009 AND 2008
8. Investments (Continued)
During the fourth quarter of 2008, management recorded a charge for OTTI of $400.0 million on assets with a fair value of $1.0 billion for which it could no longer assert its intent to hold until recovery. Although management believed that these securities were likely to recover to their current amortized cost, it determined that these securities were at risk for further mark-to-market declines, and potentially real economic losses, to the extent that economic conditions were to deteriorate further than the then present estimates and the Company’s allocation to these asset classes is overweight relative to a traditional P&C portfolio. Accordingly, in conjunction with its risk reduction exercise, management pursued targeted sales of these assets over the course of 2009. The assets were concentrated in certain holdings within the Company’s BBB and lower corporate, CMBS, equity and consumer ABS portfolios.
The total amount of other than temporary declines in value in 2008 included $906.0 million related to fixed income securities and short-term investments, $109.9 million on equity securities and $1.5 million on other investments. The total amount of other than temporary declines in value in 2007 included $608.3 million related to fixed income securities, $2.6 million on equity securities, and $0.1 million on other investments.
As discussed in Note 2(g), a portion of certain OTTI losses on fixed income securities and short-term investments are recognized in “Other comprehensive income (loss)” (“OCI”). Under final authoritative accounting guidance effective April 1, 2009, other than in a situation in which the Company has the intent to sell a security or more likely than not will be required to sell a security, the amount of the OTTI related to a credit loss is recognized in earnings, and the amount of the OTTI related to other factors (i.e., interest rates, market conditions, etc.) is recorded as a component of other comprehensive income (loss). The net amount recognized in earnings (“credit loss impairments”) represents the difference between the amortized cost of the security and the net present value of its projected future cash flows discounted at the effective interest rate implicit in the debt security prior to impairment. Any remaining difference between the fair value and amortized cost is recognized in OCI. The following table sets forth the amount of credit loss impairments on fixed income securities held by the Company as of the dates indicated, for which a portion of the OTTI loss was recognized in OCI, and the corresponding changes in such amounts.
Year Ended December 31, 2009 (U.S. dollars and shares in thousands)
OTTI related to Credit Losses recognized in
earnings Balance, January 1, 2009 .......................................................................................................................................... $ — Credit losses remaining in retained earnings related to adoption of new authoritative guidance............................... 187,272 Credit loss impairment recognized in the current period on securities not previously impaired ............................... 290,034 Credit loss impairments previously recognized on securities which matured, paid down, prepaid or were sold
during the period..................................................................................................................................................... (176,905) Credit loss impairments previously recognized on securities impaired to fair value during the period..................... (37,962) Additional credit loss impairments recognized in the current period on securities previously impaired................... 116,563 Accretion of credit loss impairments previously recognized due to an increase in cash flows expected to be
collected.................................................................................................................................................................. (5,604) Balance, December 31, 2009 ..................................................................................................................................... 373,398
The determination of credit losses is based on detailed analyses of underlying cash flows. Such analyses require the use of certain assumption in developing the estimated performance of underlying collateral. Key assumptions used include, but are not limited to, items such as, RMBS default rates based on collateral duration in arrears, severity of losses on default by collateral class, collateral reinvestment rates and expected future general corporate default rates.
The Company previously participated in a securities lending program operated by a third party banking institution, whereby certain assets were loaned out and for which the Company earned an incremental return. During the second quarter of 2009, the Company discontinued its participation in this program, and no longer holds any collateral, and has no remaining liabilities to the borrowers of the securities. Prior to discontinuation, for securities on loan, the lending agent received cash collateral generally worth 102 to 105% of the loaned securities which needed to be returned to the borrower upon return of the securities and which in the meantime is invested in a collateral pool managed by the banking institution. The collateral pool was subject to written investment guidelines with key objectives which includes safeguard of principal and adequate liquidity to meet anticipated needs with a maximum weighted average maturity of ninety days. At December 31, 2009 and December 31, 2008 was nil and $238.5 million, respectively, of securities included in investments available for sale were loaned to various counter parties through the securities lending program. The cash collateral received as at December 31, 2009 and December 31, 2008 was $nil and $242.8 million respectively. At December 31,
49
XL INSURANCE (BERMUDA) LTD
NOTES TO CONSOLIDATED FINANCIAL STATEMENTS (Continued) FOR THE YEARS ENDED DECEMBER 31, 2009 AND 2008
8. Investments (Continued)
2009 and December 31, 2008, the value of the Company’s share of the collateral pool and investments available for sale held was nil and $231.0 million, respectively, in connection with these loans, and was included in cash and cash equivalents, with a corresponding liability reflected in net payable for investments purchased
The following represents an analysis of net realized gains (losses) and the change in unrealized (losses) gains on investments:
Year ended December 31 (U.S. dollars in thousands) 2009 2008 Net realized gains (losses): Fixed maturities, short-term investments, cash and cash equivalents:
Gross realized gains ................................................................................................ $ 348,002 $ 442,297 Gross realized losses ................................................................................................ (1,555,981 ) (1,209,469)
Net realized (losses) ................................................................................................ (1,207,979 ) (767,172) Equity securities:
Gross realized gains ................................................................................................ 65,289 89,466 Gross realized losses ................................................................................................ (124,748 ) (225,047)
Net realized (losses) gains ................................................................................................ (59,459 ) (135,581) Other investments:
Gross realized gains ................................................................................................ 27,647 10,718 Gross realized losses ................................................................................................ (6,351 ) (25,269)
Net realized gains (losses) ................................................................................................ 21,296 (14,551) Realized loss on sale of U.S. life reinsurance business ................................................................ (9,628 ) – Net realized (losses) on investments ................................................................................................ (1,255,770 ) (917,304) Net realized and unrealized (losses) on investment related derivative instruments
................................................................................................................................ (24,816 ) (59,329) Net realized (losses) on investments and net realized and unrealized (losses) on
investment related derivative instruments ................................................................ (1,280,586 ) (976,633) Change in unrealized gains (losses): Fixed maturities and short-term investments, available for sale ................................ 2,449,251 (2,747,861) Fixed maturities, held to maturity ................................................................................................ (15,748 ) – Equity securities ................................................................................................................................ (19,417 ) (166,434) Affiliates and other investments ................................................................................................ 15,943 (42,828) Net change in unrealized gains (losses) on investments ................................................................ 2,430,029 (2,957,123) Total net realized (losses) on investments, net realized and unrealized
(losses) on investment related derivative instruments, and net change in unrealized gains (losses) on investments ................................................................ $ 1,149,443 $ (3,933,756)
Transfer of Available for Sale Securities to Held to Maturity
In November 2009, the Company formalized its intention to hold certain fixed income securities to maturity. Consistent with this intention, the Company has reclassified these securities from available for sale to hold to maturity in the consolidated financial statements. As a result of this classification, these fixed income securities are reflected in the held to maturity portfolio and recorded at amortized cost in the consolidated balance sheet and not fair value. The held to maturity portfolio is comprised of long duration non-U.S. sovereign government securities. The Company believes this held to maturity strategy is achievable due to the relatively stable and predictable cash flows of the Company’s long-term liabilities within its Life operations along with its ability to substitute other assets at a future date in the event that liquidity was required due to changes in expected cash flows or other transactions entered into related to the long-term liabilities supported by the held to maturity portfolio. The fair value of those securities transferred was $557.0 million on the date of reclassification, and this became the new cost base. The unrealized appreciation at the date of the transfer continues to be reported as a separate component of shareholder’s equity and is being amortized over the remaining lives of the securities as an adjustment to yield in a manner consistent with the amortization of any premium or discount. The unrealized appreciation on the date of transfer was $51.2 million and $49.7 million of this balance remains unamortized at December 31, 2009.

50
XL INSURANCE (BERMUDA) LTD
NOTES TO CONSOLIDATED FINANCIAL STATEMENTS (Continued) FOR THE YEARS ENDED DECEMBER 31, 2009 AND 2008
8. Investments (Continued)
Fixed Maturities–Held to Maturity
The fair values and amortized cost of held to maturity fixed maturities at December 31, 2009 were:
December 31, 2009 (U.S. dollars in thousands)
Cost or Amortized
Cost
Gross Unrealized
Gains
Gross Unrealized
Losses Fair
Value Fixed maturities
Non-U.S. Sovereign Government, Supranational and Government-Related ................................................................................................ $ 546,067 $ — $ (15,748) $ 530,319
Total fixed maturities held to maturity ................................................................ $ 546,067 $ — $ (15,748) $ 530,319
The Company has gross unrealized losses totaling $15.7 million at December 31, 2009, which it considers to be temporarily impaired. The Company’s held to maturity portfolio consists entirely of Non-U.S. sovereign holdings.
There were no fixed income securities designated as held to maturity at December 31, 2008.
The maturity distribution for held to maturity fixed maturities held at December 31, 2009 was as follows: December 31, 2009 December 31, 2008
(U.S. dollars in thousands) Amortized
Cost Fair
Value Amortized
Cost Fair
Value Due after 10 years ................................................................................................ $ 546,067 $ 530,319 $ — $ —
Total ................................................................................................................................ $ 546,067 $ 530,319 $ — $ —
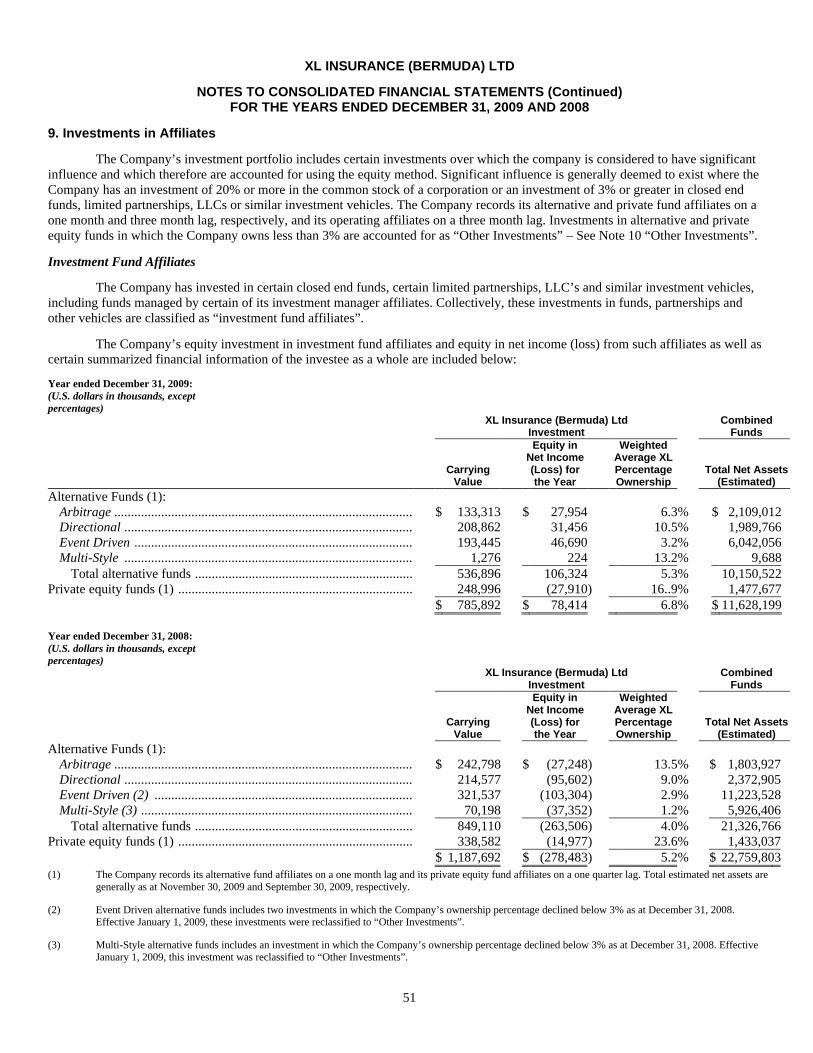
51
XL INSURANCE (BERMUDA) LTD
NOTES TO CONSOLIDATED FINANCIAL STATEMENTS (Continued) FOR THE YEARS ENDED DECEMBER 31, 2009 AND 2008
9. Investments in Affiliates
The Company’s investment portfolio includes certain investments over which the company is considered to have significant influence and which therefore are accounted for using the equity method. Significant influence is generally deemed to exist where the Company has an investment of 20% or more in the common stock of a corporation or an investment of 3% or greater in closed end funds, limited partnerships, LLCs or similar investment vehicles. The Company records its alternative and private fund affiliates on a one month and three month lag, respectively, and its operating affiliates on a three month lag. Investments in alternative and private equity funds in which the Company owns less than 3% are accounted for as “Other Investments” – See Note 10 “Other Investments”.
Investment Fund Affiliates
The Company has invested in certain closed end funds, certain limited partnerships, LLC’s and similar investment vehicles, including funds managed by certain of its investment manager affiliates. Collectively, these investments in funds, partnerships and other vehicles are classified as “investment fund affiliates”.
The Company’s equity investment in investment fund affiliates and equity in net income (loss) from such affiliates as well as certain summarized financial information of the investee as a whole are included below:
Year ended December 31, 2009: (U.S. dollars in thousands, except percentages)
XL Insurance (Bermuda) Ltd
Investment Combined
Funds
Carrying
Value
Equity in Net Income (Loss) for the Year
Weighted Average XL Percentage Ownership
Total Net Assets (Estimated)
Alternative Funds (1): Arbitrage ................................................................................................ $ 133,313 $ 27,954 6.3% $ 2,109,012 Directional ................................................................................................ 208,862 31,456 10.5% 1,989,766 Event Driven ................................................................................................ 193,445 46,690 3.2% 6,042,056 Multi-Style ................................................................................................ 1,276 224 13.2% 9,688
Total alternative funds ................................................................................................ 536,896 106,324 5.3% 10,150,522 Private equity funds (1) ................................................................................................ 248,996 (27,910) 16..9% 1,477,677 $ 785,892 $ 78,414 6.8% $ 11,628,199 Year ended December 31, 2008: (U.S. dollars in thousands, except percentages)
XL Insurance (Bermuda) Ltd
Investment Combined
Funds
Carrying
Value
Equity in Net Income (Loss) for the Year
Weighted Average XL Percentage Ownership
Total Net Assets (Estimated)
Alternative Funds (1): Arbitrage ................................................................................................ $ 242,798 $ (27,248) 13.5% $ 1,803,927 Directional ................................................................................................ 214,577 (95,602) 9.0% 2,372,905 Event Driven (2) ................................................................................................ 321,537 (103,304) 2.9% 11,223,528 Multi-Style (3) ................................................................................................ 70,198 (37,352) 1.2% 5,926,406
Total alternative funds ................................................................................................ 849,110 (263,506) 4.0% 21,326,766 Private equity funds (1) ................................................................................................ 338,582 (14,977) 23.6% 1,433,037 $ 1,187,692 $ (278,483) 5.2% $ 22,759,803
(1) The Company records its alternative fund affiliates on a one month lag and its private equity fund affiliates on a one quarter lag. Total estimated net assets are generally as at November 30, 2009 and September 30, 2009, respectively.
(2) Event Driven alternative funds includes two investments in which the Company’s ownership percentage declined below 3% as at December 31, 2008. Effective January 1, 2009, these investments were reclassified to “Other Investments”.
(3) Multi-Style alternative funds includes an investment in which the Company’s ownership percentage declined below 3% as at December 31, 2008. Effective January 1, 2009, this investment was reclassified to “Other Investments”.
52
XL INSURANCE (BERMUDA) LTD
NOTES TO CONSOLIDATED FINANCIAL STATEMENTS (Continued) FOR THE YEARS ENDED DECEMBER 31, 2009 AND 2008
9. Investments in Affiliates (Continued)
Operating Affiliates
The company had no significant financial operating affiliates as at December 31, 2009 or December 31, 2008. Previously the Company’s significant financial operating affiliate investments included Syncora and Primus Guaranty, Ltd. (“Primus”) with ownership of 46.9% and 33.1%, respectively. Given management’s view of the risk exposure, expected losses in 2007 by both Syncora and Primus, along with the uncertainty facing the entire financial guarantee industry, the Company reduced the reported value of its investment in both Syncora and Primus to nil at December 31, 2007.
Market developments with respect to the monoline industry continued to be largely negative throughout 2008 and during the same period, Syncora was downgraded by several rating agencies. Accordingly, throughout 2008 and up until the closing of the Master Agreement in August 2008 which resulted in the transfer by the Company of all of the shares it owned in Syncora, the Company reported its investment in Syncora at nil and less than the traded market value during this time, as it was believed the decline in value was other than temporary. In addition to the transfer of the Company’s shares it owned in Syncora as described above, under the Master Agreement, the Company paid consideration to Syncora of $1.775 billion cash as well as eight million ordinary shares valued at $128.0 million. The Master Agreement terminated certain reinsurance and service agreements with Syncora and as a result, related guarantee agreements with Syncora, with the exception of certain exposures relating to the European Investment Bank, no longer had any force or effect. As the total value of the consideration paid to Syncora significantly exceeded the liabilities related to such reinsurances and guarantees, the Company recorded a loss of approximately $1.4 billion, in “net (loss) income from operating affiliates”, in respect of the closing of the Master Agreement in the third quarter of 2008. See Note 4, “Syncora Holdings Ltd” for further details.
While the Company continues to hold its shares in Primus, which continued to be valued at nil, no equity earnings were recorded during 2009 or 2008 in relation to Primus as a result of the significant losses and negative book value reported by Primus throughout 2009 and 2008.
The Company’s other strategic operating affiliates at December 31, 2009 included investments in ARX Holding Corporation and ITAÙ XL Seguros Corporativos S.A. (“ITAU”), with ownership in these entities at 45.9% and 49.9%, respectively. The Company expects to complete the sale of its interest in ITAU in 2010.
The Company’s larger investment manager affiliates include Highfields Capital Management LP, a global equity investment firm, MKP Capital Management, a fixed income investment manager, specializing in mortgage-backed securities, Stanfield Capital Partners, a credit-oriented asset management firm specializing in collateralized loan obligations, Banquo Credit Management LLP, a European-based credit asset management firm, Polar Capital Holdings plc, an investment firm offering traditional and alternative products, HighVista Strategies LLC, a diversified wealth management firm, and Finisterre Cayman Limited, an emerging market specialist asset management firm. During the years ended December 31, 2009, 2008, and 2007, the Company recorded through net income in affiliates other than temporary declines in the values of certain investment manager affiliates totaling $6.9 million, $0.2 million, and $63.5 million, respectively.
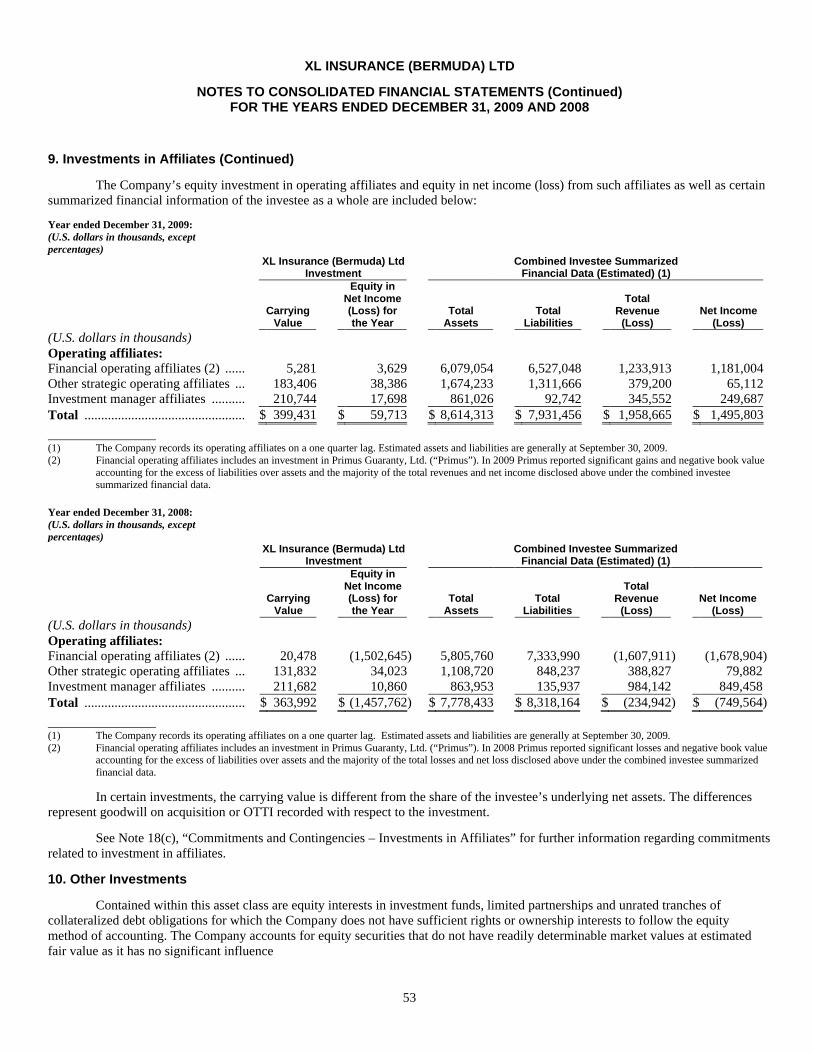
53
XL INSURANCE (BERMUDA) LTD
NOTES TO CONSOLIDATED FINANCIAL STATEMENTS (Continued) FOR THE YEARS ENDED DECEMBER 31, 2009 AND 2008
9. Investments in Affiliates (Continued)
The Company’s equity investment in operating affiliates and equity in net income (loss) from such affiliates as well as certain summarized financial information of the investee as a whole are included below:
Year ended December 31, 2009: (U.S. dollars in thousands, except percentages)
XL Insurance (Bermuda) Ltd
Investment Combined Investee Summarized
Financial Data (Estimated) (1)
Carrying
Value
Equity in Net Income (Loss) for the Year
Total Assets
Total Liabilities
Total Revenue
(Loss) Net Income
(Loss) (U.S. dollars in thousands) Operating affiliates: Financial operating affiliates (2) ................................ 5,281 3,629 6,079,054 6,527,048 1,233,913 1,181,004 Other strategic operating affiliates ................................ 183,406 38,386 1,674,233 1,311,666 379,200 65,112 Investment manager affiliates ................................ 210,744 17,698 861,026 92,742 345,552 249,687 Total ................................................................ $ 399,431 $ 59,713 $ 8,614,313 $ 7,931,456 $ 1,958,665 $ 1,495,803
(1) The Company records its operating affiliates on a one quarter lag. Estimated assets and liabilities are generally at September 30, 2009. (2) Financial operating affiliates includes an investment in Primus Guaranty, Ltd. (“Primus”). In 2009 Primus reported significant gains and negative book value
accounting for the excess of liabilities over assets and the majority of the total revenues and net income disclosed above under the combined investee summarized financial data.
Year ended December 31, 2008: (U.S. dollars in thousands, except percentages)
XL Insurance (Bermuda) Ltd
Investment Combined Investee Summarized
Financial Data (Estimated) (1)
Carrying
Value
Equity in Net Income (Loss) for the Year
Total Assets
Total Liabilities
Total Revenue
(Loss) Net Income
(Loss) (U.S. dollars in thousands) Operating affiliates: Financial operating affiliates (2) ................................ 20,478 (1,502,645) 5,805,760 7,333,990 (1,607,911) (1,678,904) Other strategic operating affiliates ................................ 131,832 34,023 1,108,720 848,237 388,827 79,882 Investment manager affiliates ................................ 211,682 10,860 863,953 135,937 984,142 849,458 Total ................................................................ $ 363,992 $ (1,457,762) $ 7,778,433 $ 8,318,164 $ (234,942) $ (749,564)
(1) The Company records its operating affiliates on a one quarter lag. Estimated assets and liabilities are generally at September 30, 2009. (2) Financial operating affiliates includes an investment in Primus Guaranty, Ltd. (“Primus”). In 2008 Primus reported significant losses and negative book value
accounting for the excess of liabilities over assets and the majority of the total losses and net loss disclosed above under the combined investee summarized financial data.
In certain investments, the carrying value is different from the share of the investee’s underlying net assets. The differences represent goodwill on acquisition or OTTI recorded with respect to the investment.
See Note 18(c), “Commitments and Contingencies – Investments in Affiliates” for further information regarding commitments related to investment in affiliates.
10. Other Investments
Contained within this asset class are equity interests in investment funds, limited partnerships and unrated tranches of collateralized debt obligations for which the Company does not have sufficient rights or ownership interests to follow the equity method of accounting. The Company accounts for equity securities that do not have readily determinable market values at estimated fair value as it has no significant influence
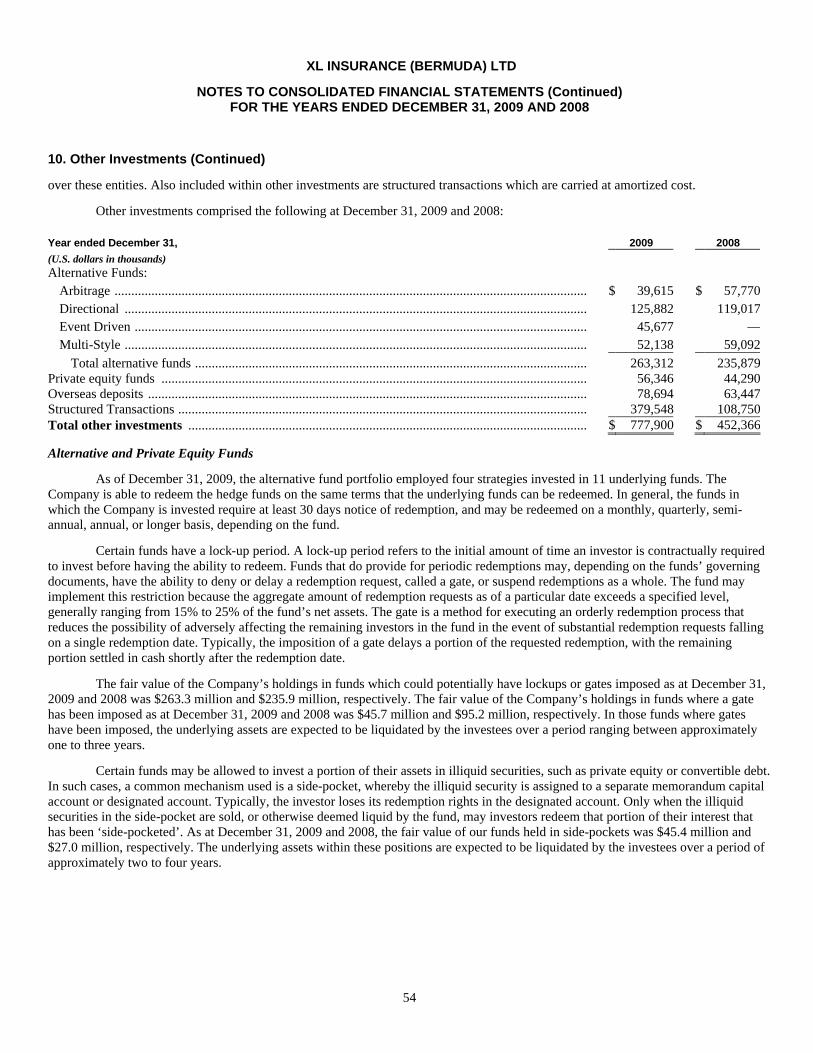
54
XL INSURANCE (BERMUDA) LTD
NOTES TO CONSOLIDATED FINANCIAL STATEMENTS (Continued) FOR THE YEARS ENDED DECEMBER 31, 2009 AND 2008
10. Other Investments (Continued)
over these entities. Also included within other investments are structured transactions which are carried at amortized cost.
Other investments comprised the following at December 31, 2009 and 2008: Year ended December 31, 2009 2008 (U.S. dollars in thousands) Alternative Funds:
Arbitrage ....................................................................................................................................................... $ 39,615 $ 57,770 Directional .................................................................................................................................................... 125,882 119,017 Event Driven ................................................................................................................................................. 45,677 — Multi-Style .................................................................................................................................................... 52,138 59,092
Total alternative funds ............................................................................................................................... 263,312 235,879 Private equity funds ................................................................................................................................ 56,346 44,290 Overseas deposits ............................................................................................................................................. 78,694 63,447 Structured Transactions ................................................................................................................................ 379,548 108,750 Total other investments ................................................................................................................................ $ 777,900 $ 452,366
Alternative and Private Equity Funds
As of December 31, 2009, the alternative fund portfolio employed four strategies invested in 11 underlying funds. The Company is able to redeem the hedge funds on the same terms that the underlying funds can be redeemed. In general, the funds in which the Company is invested require at least 30 days notice of redemption, and may be redeemed on a monthly, quarterly, semi-annual, annual, or longer basis, depending on the fund.
Certain funds have a lock-up period. A lock-up period refers to the initial amount of time an investor is contractually required to invest before having the ability to redeem. Funds that do provide for periodic redemptions may, depending on the funds’ governing documents, have the ability to deny or delay a redemption request, called a gate, or suspend redemptions as a whole. The fund may implement this restriction because the aggregate amount of redemption requests as of a particular date exceeds a specified level, generally ranging from 15% to 25% of the fund’s net assets. The gate is a method for executing an orderly redemption process that reduces the possibility of adversely affecting the remaining investors in the fund in the event of substantial redemption requests falling on a single redemption date. Typically, the imposition of a gate delays a portion of the requested redemption, with the remaining portion settled in cash shortly after the redemption date.
The fair value of the Company’s holdings in funds which could potentially have lockups or gates imposed as at December 31, 2009 and 2008 was $263.3 million and $235.9 million, respectively. The fair value of the Company’s holdings in funds where a gate has been imposed as at December 31, 2009 and 2008 was $45.7 million and $95.2 million, respectively. In those funds where gates have been imposed, the underlying assets are expected to be liquidated by the investees over a period ranging between approximately one to three years.
Certain funds may be allowed to invest a portion of their assets in illiquid securities, such as private equity or convertible debt. In such cases, a common mechanism used is a side-pocket, whereby the illiquid security is assigned to a separate memorandum capital account or designated account. Typically, the investor loses its redemption rights in the designated account. Only when the illiquid securities in the side-pocket are sold, or otherwise deemed liquid by the fund, may investors redeem that portion of their interest that has been ‘side-pocketed’. As at December 31, 2009 and 2008, the fair value of our funds held in side-pockets was $45.4 million and $27.0 million, respectively. The underlying assets within these positions are expected to be liquidated by the investees over a period of approximately two to four years.
55
XL INSURANCE (BERMUDA) LTD
NOTES TO CONSOLIDATED FINANCIAL STATEMENTS (Continued) FOR THE YEARS ENDED DECEMBER 31, 2009 AND 2008
10. Other Investments (Continued)
An increase in market volatility and an increase in volatility of hedge funds in general, as well as a decrease in market liquidity, could lead to a higher risk of a large decline in value of the hedge funds in any given time period.
As these hedge funds, private equity and alternative investments included in other investments do not pay dividends, income is realized only on partial or ultimate sale of these investments. The Company had net unrealized gains of $51.9 million and $40.8 million, respectively, at December 31, 2009 and 2008, related to these alternative investments. On sales related to the alternative investments, the Company had realized gains of $21.8 million and realized losses of $13.1 million in 2009 and 2008, respectively, with no gains or losses in 2007.
Overseas Deposits
Overseas deposits include investments in private funds related to Lloyd’s Syndicates in which the underlying instruments are primarily cash equivalents. The funds themselves do not trade on an exchange and therefore are not included within available for sale securities. Also included in overseas deposits are restricted cash and cash equivalent balances held by Lloyd’s syndicates for solvency purposes. Given the restricted nature of these cash balances, they are not included within the cash and cash equivalents category in the balance sheet.
Structured Transactions
The Company historically participated in structured transactions in project finance related areas under which the Company provided a cash loan supporting trade finance transactions. These transactions are accounted for in accordance with guidance governing accounting by certain entities (including entities with trade receivables) that lend to or finance the activities of others under which the loans are considered held for investment as the Company has the intent and ability to hold for the foreseeable future or until maturity or payoff. Accordingly, these funded loan participations are reported in the balance sheet at outstanding principal adjusted for any allowance for loan losses as considered necessary by management. The Company has also provided liquidity facility financing to a structured credit vehicle as a part of a third party medium term note facility. These investments are not considered to be fair value measurements under U.S. GAAP and accordingly they have been excluded from the fair value measurement disclosures. See Note 3, “Fair Value Measurements” for details surrounding the estimated fair value of these investments.
On June 9, 2009, XL Specialty Insurance Company (“XL Specialty”), a wholly-owned subsidiary of XL Insurance (Bermuda) Ltd, entered into an agreement with National Indemnity Company, an insurance company subsidiary of Berkshire Hathaway Inc. (“National Indemnity”). Under the agreement, and a related reinsurance agreement, National Indemnity will issue endorsements (“Endorsements”) to certain directors and officers liability insurance policies known as “Side A” coverage policies underwritten by XL Specialty (the “Facility”).
The Endorsements entitle policyholders to present claims under such D&O policies directly to National Indemnity in the event that XL Specialty is unable to meet its obligations due to an order of insolvency, liquidation or an injunction that prohibits XL Specialty from paying claims. Under the terms of the Facility, National Indemnity will issue Endorsements with aggregate premiums up to $140 million. In addition, XL Specialty has an irrevocable option, which may be exercised during the first eleven months of the Facility, to require National Indemnity to issue Endorsements on D&O policies with additional aggregate premiums up to $100 million (the “Option”). The Endorsements will terminate on the tenth anniversary of their issuance. The Facility provides that National Indemnity will be obligated to issue Endorsements on D&O policies issued during an eighteen month period that commenced on June 8, 2009.
National Indemnity’s obligations under the Facility to issue new Endorsements will terminate if XL Specialty’s financial strength rating is downgraded to or below “BBB+” by Standard & Poor’s Corporation or to or below “A-” by A.M. Best. In connection with the Facility, the Company will purchase a payment obligation in an aggregate principal amount of $150 million from National Indemnity. If XL Specialty elects to exercise the Option, the company will purchase a second obligation in an aggregate principal amount of $100 million. In addition, XL Specialty will establish a trust to hold the premiums (net of commissions) on the D&O policies endorsed by National Indemnity. XL Specialty will also arrange to provide National Indemnity with a letter of credit in the event the assets in the trust are insufficient to meet XL Specialty’s obligations under the Facility (the “Letter of Credit”). The trust, the Letter of Credit and the payment obligations collateralize XL Specialty’s indemnity obligations under the Facility to National Indemnity for any payments National Indemnity is required to make under the Endorsements.
56
XL INSURANCE (BERMUDA) LTD
NOTES TO CONSOLIDATED FINANCIAL STATEMENTS (Continued) FOR THE YEARS ENDED DECEMBER 31, 2009 AND 2008
10. Other Investments (Continued)
Structured Transactions (Continued)
The outstanding payment obligation was recorded in Other Investments at an estimated fair value of $128.1 million, pays a coupon of 3.5%, and will be accreted to $150 million over the 11.5 year term of the payment obligation. The difference between the estimated fair value of the Obligation and the cost of that Obligation at the time of the transaction was approximately $21.9 million and is recorded in Other Assets. This difference is being amortized in relation to the earning of the underlying policies written. $5.5 million of amortization was recorded during the year ended December 30, 2009.
The Company regularly reviews the performance of these other investments. The Company recorded losses of $0.9 million, $1.5 million and $0.1 million in the years ended December 31, 2009, 2008 and 2007, respectively, due to other than temporary declines in values of these other investments.
See Note 18(b), “Commitments and Contingencies – Other Investments,” for further information regarding commitments related to other investments.
57
XL INSURANCE (BERMUDA) LTD
NOTES TO CONSOLIDATED FINANCIAL STATEMENTS (Continued) FOR THE YEARS ENDED DECEMBER 31, 2009 AND 2008
11. Losses and Loss Expenses
Unpaid losses and loss expenses are comprised of: Year Ended December 31 (U.S. dollars in thousands) 2009 2008 Reserve for reported losses and loss expenses ................................................................ $ 8,978,612 $ 9,948,137 Reserve for losses incurred but not reported................................................................ 11,844,912 11,702,178 Unpaid losses and loss expenses ......................................................................................... $ 20,823,524 $ 21,650,315
Net losses and loss expenses incurred are comprised of:
Year Ended December 31 (U.S. dollars in thousands) 2009 2008 Loss and loss expenses payments ......................................................................................... $ 5,138,951 $ 5,157,388 Change in unpaid losses and loss expenses (1) ................................................................ (1,148,495) (462,129) Change in unpaid losses and loss expenses recoverable ....................................................... 441,397 634,181 Paid loss recoveries................................................................................................ (1,263,016) (1,366,542) Net losses and loss expenses incurred................................................................ $ 3,168,837 $ 3,962,898
(1) Does not include changes in losses incurred related to previous facultative and excess of loss reinsurance of Syncora as such changes are included in “Net loss from operating affiliates.”
The following table represents an analysis of the Company’s paid and unpaid losses and loss expenses incurred and a reconciliation of the beginning and ending unpaid losses and loss expenses for the years indicated: (U.S. dollars in thousands) 2009 2008 Unpaid losses and loss expenses at beginning of year .......................................................... $ 21,650,315 $ 23,207,694 Unpaid losses and loss expenses recoverable................................................................ 3,964,836 4,665,615 Financial guarantee reserves related to previous reinsurance agreements
with Syncora that were recorded within “Net loss from operating affiliates” ........................................................................................................................... — (350,988)
Net unpaid losses and loss expenses at beginning of year ................................ 17,685,479 18,191,091 Increase (decrease) in net losses and loss expenses incurred in respect of
losses occurring in: Current year ....................................................................................................................... 3,453,577 4,573,562 Prior years.......................................................................................................................... (284,740) (610,664)
Total net incurred losses and loss expenses ................................................................ 3,168,837 3,962,898 Exchange rate effects ................................................................................................ 287,752 (677,664) Net loss reserves (disposed) acquired ................................................................ — — Less net losses and loss expenses paid in respect of losses occurring in:
Current year ....................................................................................................................... 439,638 584,120 Prior years.......................................................................................................................... 3,436,297 3,206,726
Total net paid losses ................................................................................................ 3,875,935 3,790,846 Net unpaid losses and loss expenses at end of year .............................................................. 17,266,133 17,685,479 Financial guarantee reserves related to previous reinsurance agreements
with Syncora that were recorded within “Net loss from operating affiliates” ........................................................................................................................... — —
Unpaid losses and loss expenses recoverable................................................................ 3,557,391 3,964,836 Unpaid losses and loss expenses at end of year................................................................ $ 20,823,524 $ 21,650,315
58
XL INSURANCE (BERMUDA) LTD
NOTES TO CONSOLIDATED FINANCIAL STATEMENTS (Continued) FOR THE YEARS ENDED DECEMBER 31, 2009 AND 2008
11. Losses and Loss Expenses (Continued)
Current year net losses incurred
Net losses incurred decreased by $794.1 million in 2009 as compared to 2008, mainly as a result of the current year loss ratio decreasing by 9.4 loss percentage points during the same period. This decrease is due primarily to lower levels of large property risk and catastrophe losses occurring in 2009 combined with the impact of anticipated sub prime and credit related losses in 2008. The lower level of property losses in 2009 as well as business mix changes more than offset the impacts of a softening rate environment. The decrease in net losses incurred is also due to a reduction in business volume as net premiums earned decreased 14.0% in 2009 relative to 2008.
Net losses incurred increased by $307.1 million in 2008 as compared to 2007, mainly as a result, of the 2008 year loss ratio increasing by 10.0 loss percentage points, mainly due to an increase in attritional and catastrophe-related property losses. Business volume reduced as net premiums earned related to the Company’s P&C operations decreased by 6.7% over this period. Overall, windstorm activity in the Atlantic and Gulf regions increased in 2008 as compared to 2007 and included the impacts of Hurricanes Gustav and Ike, which both made landfall in the U.S. in the third quarter of 2008. Hurricane Ike was estimated to have caused the third largest ever insured loss in the U.S. from a windstorm. Combined, Hurricanes Gustav and Ike had a significant impact on the results of the Company for the year ended December 31, 2008. In 2008, the Company incurred losses, net of reinsurance recoveries and reinstatement premiums, of $22.5 million and $210.0 million related to Hurricanes Gustav and Ike, respectively.
Net losses incurred for 2007 (excluding financial guarantee reserves previously related to reinsurance agreements with Syncora that were recorded within “Net loss from operating affiliates”) decreased from 2006 due to a reduction in business volume as the Company’s net premiums earned decreased by 4.6% from 2006 to 2007. However, the current year loss ratio increased by 2.4 loss percentage points from 2006 to 2007 as a result of an increase in attritional and catastrophe-related property experience as well as the impact of a softening rate environment. In 2007, six hurricanes formed in the Atlantic region including two Category 5 hurricanes, one of which, Hurricane Dean, resulted in a limited amount of insured damage to areas of Mexico affected by the hurricane. Other natural catastrophes in 2007 included European windstorms Kyrill and Per/Hanno, California wildfires, floods in the U.K. and Mexico, the Peruvian earthquake and five hurricanes in the Eastern Pacific region.
Prior year net losses incurred
The following table presents the net (favorable) adverse prior years loss development of the Company’s loss and loss expense reserves for its property and casualty operations by operating segment for each of the years indicated: (U.S. dollars in millions) 2009 2008 Insurance segment....................................................................................................... $ (62.9) $ (305.5) Reinsurance segment................................................................................................... (221.8) (305.2) Total ............................................................................................................................ $ (284.7) $ (610.7)
The significant developments in prior year loss reserve estimates for each of the years indicated within the Company’s Insurance and Reinsurance segments are discussed below.
During 2009, net favorable prior year development totaled $284.7 million in the Company’s property and casualty operations and included net favorable development in the Insurance and Reinsurance segments of $62.9 million and $221.8 million, respectively.
Insurance Segment
Net favorable prior year reserve development of $62.9 million for the year ended December 31, 2009 was mainly attributable to the following:
59
XL INSURANCE (BERMUDA) LTD
NOTES TO CONSOLIDATED FINANCIAL STATEMENTS (Continued) FOR THE YEARS ENDED DECEMBER 31, 2009 AND 2008
11. Losses and Loss Expenses (Continued)
Prior year net losses incurred (Continued)
§ For property lines, net prior year development during the year was $50.7 million favorable largely as a result of a lower than expected level of attritional non-catastrophe claims across older accident years as well as reserve releases in the 2008 European general property portfolio due to lower than expected reported loss activity. Prior year catastrophe loss estimates remained stable.
§ For casualty lines, net prior year development during the year was $29.4 million unfavorable due to reserve strengthening on the European excess lines for accident years 2000-2004, and the recognition of potential excess casualty exposures on the discontinued casualty lines. Offsetting this reserve strengthening were reserve releases from the casualty primary business due to better than expected loss activity from the more recent accident years, and US risk management lines due to greater reliance on actual loss experience over initial target loss ratios.
§ For professional lines, net prior year development was $70.4 million favorable, primarily as a result of lower incurred activity than expected based on the Company’s prior valuation in global D&O lines, primarily for underwriting years 2002 to 2006. This release was partially offset by strengthening of global E&O reserves primarily in the 2000 and 2001 years due to large claims. In addition, there was a reallocation of subprime and related credit crisis reserves from the 2007 to 2008 report year to better reflect the indications of our latest exposure-based reserve analysis for these years.
§ For specialty and other lines, net prior year adverse development was $28.8 million due in part to a deterioration in environmental lines but mainly from discontinued specialty lines, specifically, for surety to reflect our assessment of the potential impact of the economic downturn on ultimate loss activity, the Lloyd’s Accident & Health book where incurred development was higher than implied by the Company’s selected benchmarks and the resulting lengthening of loss reporting patterns, and political risks where there was reserve strengthening on a specific potential claim. Offsetting the adverse development was favorable reserve development on the aerospace and marine and offshore energy lines due to better than expected activity and an update of development assumptions to reflect recent historical experience.
Net favorable prior year development of $305.5 million for the year ended December 31, 2008 was mainly attributable to the following:
§ For property and casualty lines, reserve releases in certain casualty lines primarily in 2003 to 2006 accident years due to lower than expected reported loss activity and favorable reserve development in global property lines of business as a result of favorable claim development. In addition, net reserve releases resulted from an agreement with Axa/Winterthur of approximately $80.9 million in the fourth quarter of 2008 in regards to certain reinsurance recoverable balances relating to casualty lines and to a lesser extent, certain property lines of business.
§ For professional lines, reserve releases in the 2003 to 2006 accident years were largely offset by strengthening of reserves in the 2007 year.
§ For specialty lines, modest reserve strengthening within specialty lines, primarily in the environmental lines of business, as well as strengthening associated with certain structured indemnity contracts.
Net favorable prior year reserve development of $158.1 million for the year ended December 31, 2007 consisted of $95.0 million in property and $162.1 million in casualty lines of business, partially offset by net adverse development of $23.0 million, $7.0 million and $69.0 million in certain professional, marine and other lines of business, respectively. Casualty releases relate primarily to the European casualty portfolio in accident years 2002-2005. The professional lines development reflects net adverse prior year development of the Bermuda E&O portfolio and releases from the U.S. and European professional lines portfolios. Net adverse prior year development in other insurance lines relates to adverse development in
60
XL INSURANCE (BERMUDA) LTD
NOTES TO CONSOLIDATED FINANCIAL STATEMENTS (Continued) FOR THE YEARS ENDED DECEMBER 31, 2009 AND 2008
11. Losses and Loss Expenses (Continued)
Prior year net losses incurred (Continued)
discontinued specialty lines, surety and environmental, partially offset by favorable development in aerospace and political risk. Gross prior year releases totaled $177.6 million for the Insurance segment during 2007.
There is no assurance that conditions and trends that have affected the development of liabilities in the past will continue. Accordingly, it may not be appropriate to extrapolate future redundancies or deficiencies based on the Company’s historical results.
Reinsurance Segment
Net favorable prior year reserve development for the Reinsurance segment of $221.8 million for the year ended December 31, 2009 was mainly attributable to the following:
§ Net favorable prior year development of $142.5 million for the short-tailed lines in the year and details of these by specific lines are as follows:
§ $46.2 million in favorable property catastrophe development due to lower than expected loss development, particularly on the 2008 underwriting year and $12.3 million in reserve reductions for several 2005 natural catastrophe events including European floods, windstorm Erwin and California wildfires.
§ $88.8 million in favorable development due primarily to lower than expected claim emergence from underwriting years 2005-2008 in Latin America ($27.5 million), Europe ($21.6 million), Bermuda ($20.6 million) and US ($13.8 million).
§ $7.5 million in marine and aviation lines due to lower than expected claim emergence in the European marine book for underwriting years 2007 and 2008 offset by minimal net reserve increases on the aviation book.
§ Net favorable prior year development of $79.3 million for the long-tailed lines in the year and details of these by specific lines are as follows:
§ $21.0 million in favorable casualty development related primarily to the European General Liability and UK Motor portfolios in underwriting years 2004-2007.
§ $40.7 million in favorable professional development due primarily to US exposures for underwriting years 2002 and prior in addition to professional indemnity exposures for European underwriting years 2006 and prior.
§ $17.6 million in favorable development in non-casualty long tail lines largely in Latin America due to favorable emergence from surety exposures.
For the year ended December 31, 2008 net favorable prior year development totaled $305.2 million as explained below.
§ Net favorable prior year development of $138.4 million for the property and other short-tailed lines development were attributable to most business units globally.
§ Net favorable prior year development of $166.8 million for the casualty and other lines in both European and U.S. casualty and professional portfolios as well as reserve releases associated with the reinsurance-to-close relating to the 2005 year of account on certain Lloyd’s sourced business.
Gross prior year favorable development for the year ended December 31, 2008 of $144.3 million exceeded the corresponding net favorable development during the same period of $305.2 million as the impact of favorable loss experience related to a large crop program was mostly offset by the impact of retrocession protection related to this program.
Net favorable prior year reserve development for the Reinsurance segment of $267.3 million for the year ended December 31, 2007 consisted of $188.7 million primarily in property and other short-tail lines
61
XL INSURANCE (BERMUDA) LTD
NOTES TO CONSOLIDATED FINANCIAL STATEMENTS (Continued) FOR THE YEARS ENDED DECEMBER 31, 2009 AND 2008
11. Losses and Loss Expenses (Continued)
Prior year net losses incurred (Continued)
of business and $87.4 million in casualty and other lines, was partially offset by adverse prior year development of $8.8 million within the structured indemnity line of business. Releases in the short-tail lines relate primarily to the 2005 and 2006 accident years. The casualty and other lines favorable development of $87.4 million reflects the net result of releases of $121.4 million primarily in the U.S. and non-U.S. casualty portfolios, partially offset by net adverse development of $13.0 million associated with the results of an external review of the Company’s asbestos and environmental reserves and $21.0 million related to a commutation of a stop loss reinsurance agreement. Favorable gross prior year development of $259.7 million was in line with the net development.
There is no assurance that conditions and trends that have affected the development of liabilities in the past will continue. Accordingly, it may not be appropriate to extrapolate future redundancies or deficiencies based on the Company’s historical results.
Exchange rate effects
Exchange rate effects on net loss reserves in each of the three years ended December 31, 2009 related to the global operations of the Company primarily where reporting units have a functional currency that is not the U.S. dollar. The decrease in the value of the U.S. dollar in 2009 and 2007 combined with the increase in the value of the U.S. dollar in 2008 mainly compared to the Swiss franc, U.K. Sterling and the Euro, gave rise to translation and revaluation exchange movements related to carried loss reserve balances of $287.8 million, ($677.7) million and $421.6 million in 2009, 2008 and 2007, respectively.
Net paid losses
Total net paid losses were $3.9 billion in 2009 and $3.8 billion in each of 2008 and 2007.
Other loss information
The Company did not dispose of or acquire net loss reserves in 2009 or 2008.
Net losses disposed in 2007 in the amount of $155.3 million represent reserves associated with the de-consolidation of Syncora following the secondary offering on June 6, 2007 of $181.4 million, partially offset by net losses acquired of $26.2 million related to a reinsurance-to-close loss portfolio transfer.
The Company’s net unpaid losses and loss expenses included estimates of actual and potential non-recoveries from reinsurers. As at December 31, 2009 and 2008, the reserve for potential non-recoveries from reinsurers was $189.8 million and $187.6 million, respectively.
Except for certain financial guarantee and workers’ compensation liabilities, the Company does not discount its unpaid losses and loss expenses.
With respect to financial guarantee liabilities the amount of the case basis reserve is based on the net present value of the expected ultimate loss and loss adjustment expense payments that the Company expects to make, net of expected recoveries under salvage and subrogation rights. Case basis reserves are determined using cash flow or similar models to estimate the net present value of the anticipated shortfall between (i) scheduled payments on the insured obligation plus anticipated loss adjustment expenses and (ii) anticipated cash flow from the proceeds to be received on sales of any collateral supporting the obligation and other anticipated recoveries.
The net income impact in 2007 of case basis reserves with respect to reinsurance previously provided to Syncora subsequent to the secondary sale of Syncora common shares on June 6, 2007 of $351.0 million was included in “Net loss from operating affiliates”, and the unpaid case reserves related to such losses were recorded in unpaid losses and loss expenses. However, following the closing of the Master Agreement
62
XL INSURANCE (BERMUDA) LTD
NOTES TO CONSOLIDATED FINANCIAL STATEMENTS (Continued) FOR THE YEARS ENDED DECEMBER 31, 2009 AND 2008
11. Losses and Loss Expenses (Continued)
Prior year net losses incurred (Continued)
and the consideration paid to Syncora, the liabilities associated with the reinsurance previously provided to Syncora were settled. See Note 4, “Syncora Holdings Ltd. (“Syncora”) for further information.
The Company utilizes tabular reserving for workers’ compensation (including long-term disability) unpaid losses that are considered fixed and determinable, and discounts such losses using an interest rate of 5% in 2009 and 2008. The interest rate approximates the average yield to maturity on specific fixed income investments that support these liabilities. The tabular reserving methodology results in applying uniform and consistent criteria for establishing expected future indemnity and medical payments (including an explicit factor for inflation) and the use of mortality tables to determine expected payment periods. Tabular unpaid losses and loss expenses, net of reinsurance, at December 31, 2009 and 2008 on an undiscounted basis were $734.1 million and $755.8 million, respectively. The related discounted unpaid losses and loss expenses were $343.7 million and $346.0 million as of December 31, 2009 and 2008, respectively.
The nature of the Company’s high excess of loss liability and catastrophe business can result in loss events that are both irregular and significant. Similarly, adjustments to reserves for individual years can be irregular and significant. Such adjustments are part of the normal course of business for the Company. Conditions and trends that have affected development of liability in the past may not continue in the future. Accordingly, it is inappropriate to extrapolate future redundancies or deficiencies based upon historical experience.
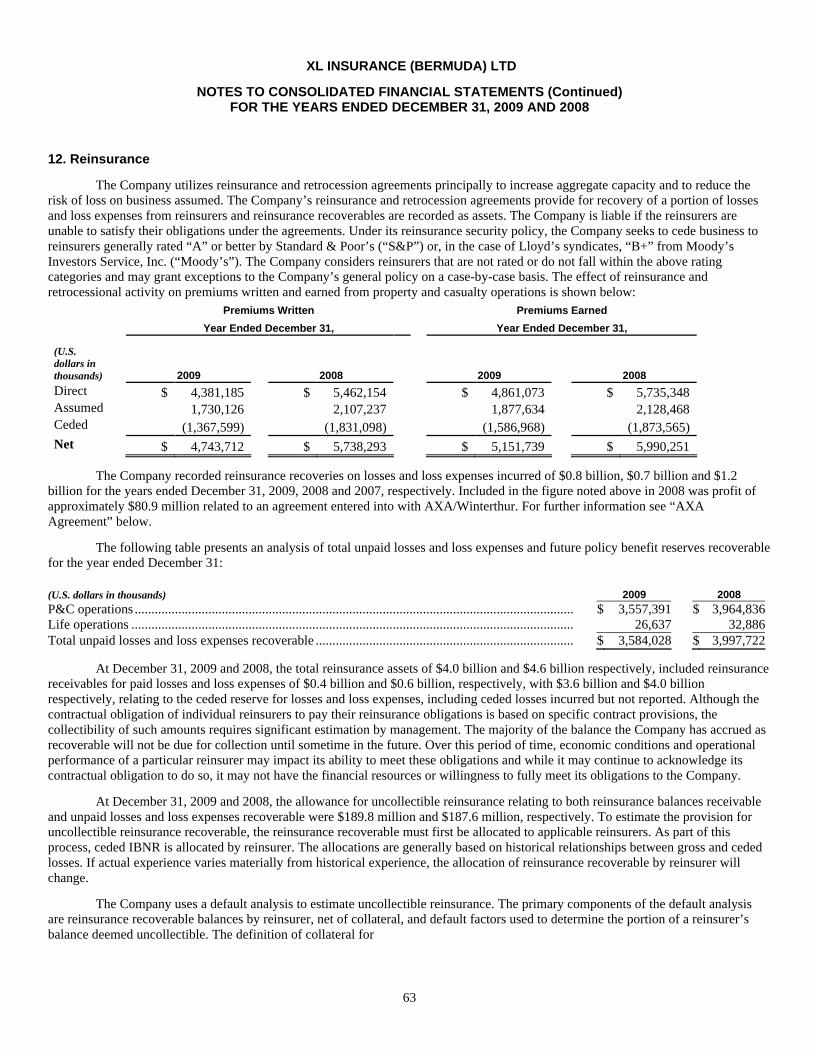
63
XL INSURANCE (BERMUDA) LTD
NOTES TO CONSOLIDATED FINANCIAL STATEMENTS (Continued) FOR THE YEARS ENDED DECEMBER 31, 2009 AND 2008
12. Reinsurance
The Company utilizes reinsurance and retrocession agreements principally to increase aggregate capacity and to reduce the risk of loss on business assumed. The Company’s reinsurance and retrocession agreements provide for recovery of a portion of losses and loss expenses from reinsurers and reinsurance recoverables are recorded as assets. The Company is liable if the reinsurers are unable to satisfy their obligations under the agreements. Under its reinsurance security policy, the Company seeks to cede business to reinsurers generally rated “A” or better by Standard & Poor’s (“S&P”) or, in the case of Lloyd’s syndicates, “B+” from Moody’s Investors Service, Inc. (“Moody’s”). The Company considers reinsurers that are not rated or do not fall within the above rating categories and may grant exceptions to the Company’s general policy on a case-by-case basis. The effect of reinsurance and retrocessional activity on premiums written and earned from property and casualty operations is shown below:
Premiums Written Premiums Earned
Year Ended December 31, Year Ended December 31,
(U.S. dollars in thousands) 2009 2008 2009 2008 Direct $ 4,381,185 $ 5,462,154 $ 4,861,073 $ 5,735,348 Assumed 1,730,126 2,107,237 1,877,634 2,128,468 Ceded (1,367,599) (1,831,098) (1,586,968) (1,873,565) Net $ 4,743,712 $ 5,738,293 $ 5,151,739 $ 5,990,251
The Company recorded reinsurance recoveries on losses and loss expenses incurred of $0.8 billion, $0.7 billion and $1.2 billion for the years ended December 31, 2009, 2008 and 2007, respectively. Included in the figure noted above in 2008 was profit of approximately $80.9 million related to an agreement entered into with AXA/Winterthur. For further information see “AXA Agreement” below.
The following table presents an analysis of total unpaid losses and loss expenses and future policy benefit reserves recoverable for the year ended December 31: (U.S. dollars in thousands) 2009 2008 P&C operations ................................................................................................................................... $ 3,557,391 $ 3,964,836 Life operations .................................................................................................................................... 26,637 32,886 Total unpaid losses and loss expenses recoverable ............................................................................. $ 3,584,028 $ 3,997,722
At December 31, 2009 and 2008, the total reinsurance assets of $4.0 billion and $4.6 billion respectively, included reinsurance receivables for paid losses and loss expenses of $0.4 billion and $0.6 billion, respectively, with $3.6 billion and $4.0 billion respectively, relating to the ceded reserve for losses and loss expenses, including ceded losses incurred but not reported. Although the contractual obligation of individual reinsurers to pay their reinsurance obligations is based on specific contract provisions, the collectibility of such amounts requires significant estimation by management. The majority of the balance the Company has accrued as recoverable will not be due for collection until sometime in the future. Over this period of time, economic conditions and operational performance of a particular reinsurer may impact its ability to meet these obligations and while it may continue to acknowledge its contractual obligation to do so, it may not have the financial resources or willingness to fully meet its obligations to the Company.
At December 31, 2009 and 2008, the allowance for uncollectible reinsurance relating to both reinsurance balances receivable and unpaid losses and loss expenses recoverable were $189.8 million and $187.6 million, respectively. To estimate the provision for uncollectible reinsurance recoverable, the reinsurance recoverable must first be allocated to applicable reinsurers. As part of this process, ceded IBNR is allocated by reinsurer. The allocations are generally based on historical relationships between gross and ceded losses. If actual experience varies materially from historical experience, the allocation of reinsurance recoverable by reinsurer will change.
The Company uses a default analysis to estimate uncollectible reinsurance. The primary components of the default analysis are reinsurance recoverable balances by reinsurer, net of collateral, and default factors used to determine the portion of a reinsurer’s balance deemed uncollectible. The definition of collateral for
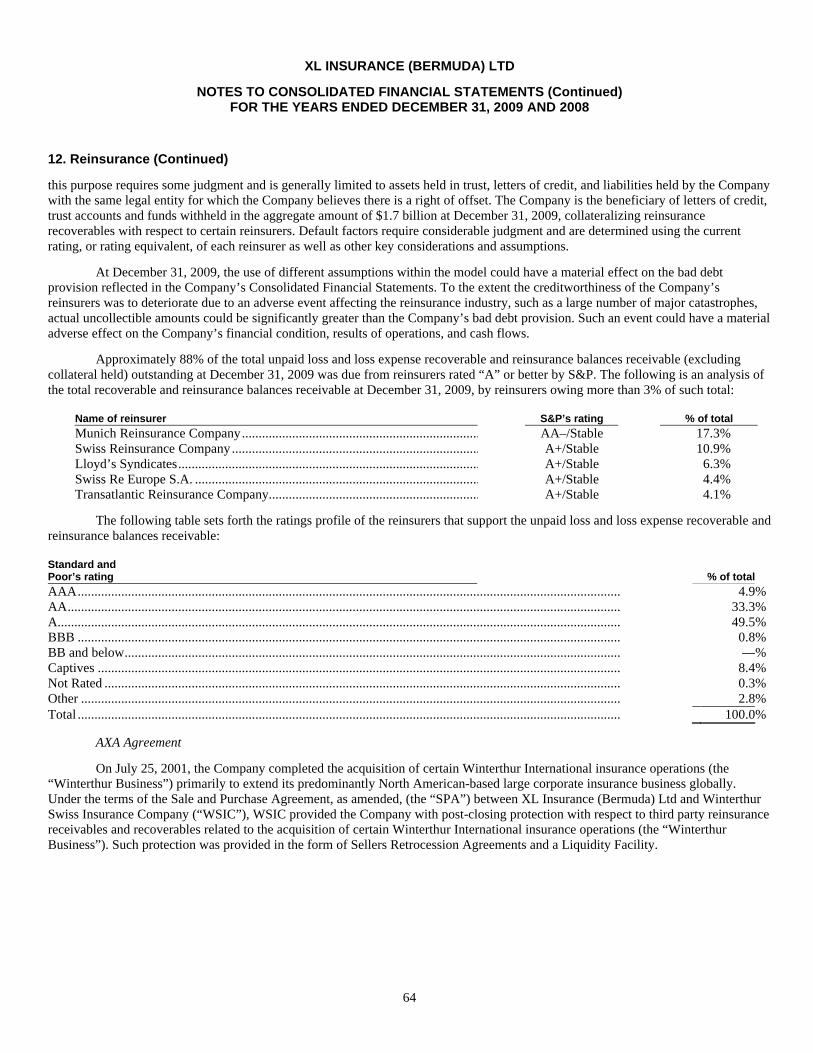
64
XL INSURANCE (BERMUDA) LTD
NOTES TO CONSOLIDATED FINANCIAL STATEMENTS (Continued) FOR THE YEARS ENDED DECEMBER 31, 2009 AND 2008
12. Reinsurance (Continued)
this purpose requires some judgment and is generally limited to assets held in trust, letters of credit, and liabilities held by the Company with the same legal entity for which the Company believes there is a right of offset. The Company is the beneficiary of letters of credit, trust accounts and funds withheld in the aggregate amount of $1.7 billion at December 31, 2009, collateralizing reinsurance recoverables with respect to certain reinsurers. Default factors require considerable judgment and are determined using the current rating, or rating equivalent, of each reinsurer as well as other key considerations and assumptions.
At December 31, 2009, the use of different assumptions within the model could have a material effect on the bad debt provision reflected in the Company’s Consolidated Financial Statements. To the extent the creditworthiness of the Company’s reinsurers was to deteriorate due to an adverse event affecting the reinsurance industry, such as a large number of major catastrophes, actual uncollectible amounts could be significantly greater than the Company’s bad debt provision. Such an event could have a material adverse effect on the Company’s financial condition, results of operations, and cash flows.
Approximately 88% of the total unpaid loss and loss expense recoverable and reinsurance balances receivable (excluding collateral held) outstanding at December 31, 2009 was due from reinsurers rated “A” or better by S&P. The following is an analysis of the total recoverable and reinsurance balances receivable at December 31, 2009, by reinsurers owing more than 3% of such total: Name of reinsurer S&P’s rating % of total Munich Reinsurance Company................................................................................................ AA–/Stable 17.3% Swiss Reinsurance Company................................................................................................ A+/Stable 10.9% Lloyd’s Syndicates................................................................................................ A+/Stable 6.3% Swiss Re Europe S.A. ................................................................................................ A+/Stable 4.4% Transatlantic Reinsurance Company................................................................ A+/Stable 4.1%
The following table sets forth the ratings profile of the reinsurers that support the unpaid loss and loss expense recoverable and reinsurance balances receivable: Standard and Poor’s rating % of total AAA.................................................................................................................................................................. 4.9% AA..................................................................................................................................................................... 33.3% A........................................................................................................................................................................ 49.5% BBB .................................................................................................................................................................. 0.8% BB and below.................................................................................................................................................... —% Captives ............................................................................................................................................................ 8.4% Not Rated .......................................................................................................................................................... 0.3% Other ................................................................................................................................................................. 2.8% Total .................................................................................................................................................................. 100.0%
AXA Agreement
On July 25, 2001, the Company completed the acquisition of certain Winterthur International insurance operations (the “Winterthur Business”) primarily to extend its predominantly North American-based large corporate insurance business globally. Under the terms of the Sale and Purchase Agreement, as amended, (the “SPA”) between XL Insurance (Bermuda) Ltd and Winterthur Swiss Insurance Company (“WSIC”), WSIC provided the Company with post-closing protection with respect to third party reinsurance receivables and recoverables related to the acquisition of certain Winterthur International insurance operations (the “Winterthur Business”). Such protection was provided in the form of Sellers Retrocession Agreements and a Liquidity Facility.

65
XL INSURANCE (BERMUDA) LTD
NOTES TO CONSOLIDATED FINANCIAL STATEMENTS (Continued) FOR THE YEARS ENDED DECEMBER 31, 2009 AND 2008
12. Reinsurance (Continued)
On June 7, 2006, subsidiaries of the Company, entered into an agreement (the “Agreement”) with WSIC. The purpose of this Agreement was to release all actual or potential disputes, claims or issues arising out of or related in any way to: (i) the Liquidity Facility and the Sellers Retrocession Agreements, as well as (ii) subject to certain exceptions, the SPA. The Agreement further provided for a four-year term, collateralized escrow arrangement (the “Fund”) of up to $185 million (plus interest) to protect certain subsidiaries from future nonperforming third party reinsurance related to the Winterthur Business. The Fund was structured to align the parties’ interests by providing for any sums remaining in the Fund at the end of its term to be shared in agreed percentages.
On December 16, 2008, the Company entered into an agreement with AXA Insurance Ltd (the successor company to WSIC) (“AXA”), (the “AXA Agreement”). The AXA Agreement releases to the parties all funds from the Fund that was put in place in June 2006 as described above and releases both parties from all further obligations thereunder. Since the Fund was created, the Company was able to successfully collect more than 95% of such third-party reinsurance receivables on paid claims enabling the Company to agree with AXA to terminate the Fund early.
The AXA Agreement provided that the Fund, which contained approximately $172 million as at December 16, 2008, be terminated and that the Company be paid a greater share of the remaining funds than was originally agreed. In return, the Company released AXA, subject to certain exceptions, from the SPA, as amended, between the Company and AXA, and commuted AXA’s share of various reinsurance contracts where AXA reinsured subsidiaries of the Company relating to certain parts of the Winterthur Business. In addition, the Company and AXA reached a definitive claims handling agreement governing defined Excluded Winterthur Business, including asbestos claims and business written prior to 1986, which remain the financial responsibility of AXA. In connection with the execution of the AXA Agreement and the adjustment of related provisions, the Company recorded income of approximately $80.9 million in 2008, which was recorded as favorable net prior year development within the Company’s Insurance segment.
13. Deposit Liabilities
At December 31, 2009, deposit liabilities include remaining funding agreement contracts as well as reinsurance and insurance deposits. Funding agreements do not meet the definition of an insurance contract under FASB issued authoritative guidance. These contracts were sold with a guaranteed rate of return and the proceeds from the sale of such contracts were invested with the intent of realizing a greater return than is called for in the investment contracts. The Company has also entered into certain insurance and reinsurance policies that transfer insufficient risk under GAAP to be accounted for as insurance or reinsurance transactions and are deposit accounted. These structured property and casualty agreements, guaranteed investment contracts and funding agreements have been recorded as deposit liabilities and are initially matched by an equivalent amount of investments. The Company has investment risk related to its ability to generate sufficient investment income to enable the total invested assets to cover the payment of the ultimate liability. See Note 8, “Investments” for further information relating to the Company’s net investment income as well as realized and unrealized investment (losses) gains. Each deposit liability accrues at a rate equal to the internal rate of return of the payment receipts and obligations due during the life of the agreement. Where the timing and/or amount of future payments are uncertain, cash flows reflecting the Company’s actuarially determined best estimates are utilized. Deposit liabilities are initially recorded at an amount equal to the assets received. At December 31, 2009, the remaining balance of funding agreements, excluding accrued interest of $6.5 million, was $450 million, with the full balance scheduled for settlement in August 2010.
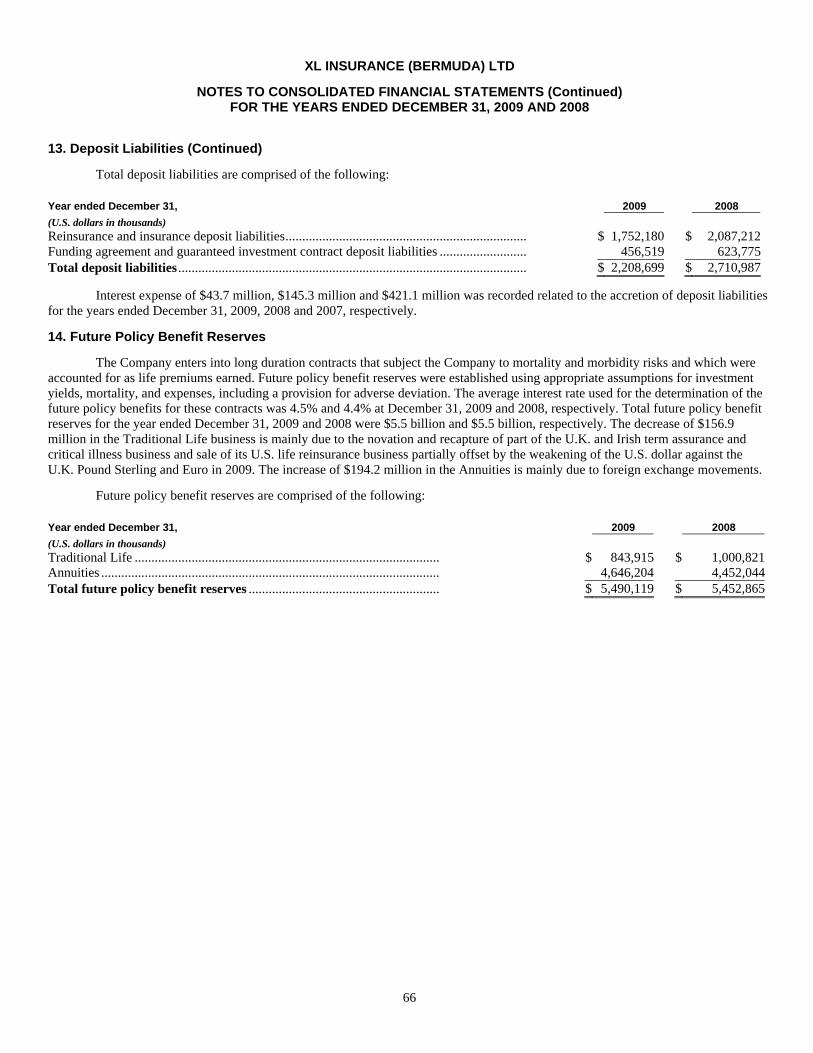
66
XL INSURANCE (BERMUDA) LTD
NOTES TO CONSOLIDATED FINANCIAL STATEMENTS (Continued) FOR THE YEARS ENDED DECEMBER 31, 2009 AND 2008
13. Deposit Liabilities (Continued)
Total deposit liabilities are comprised of the following: Year ended December 31, 2009 2008 (U.S. dollars in thousands) Reinsurance and insurance deposit liabilities........................................................................ $ 1,752,180 $ 2,087,212 Funding agreement and guaranteed investment contract deposit liabilities .......................... 456,519 623,775 Total deposit liabilities ........................................................................................................ $ 2,208,699 $ 2,710,987
Interest expense of $43.7 million, $145.3 million and $421.1 million was recorded related to the accretion of deposit liabilities for the years ended December 31, 2009, 2008 and 2007, respectively.
14. Future Policy Benefit Reserves
The Company enters into long duration contracts that subject the Company to mortality and morbidity risks and which were accounted for as life premiums earned. Future policy benefit reserves were established using appropriate assumptions for investment yields, mortality, and expenses, including a provision for adverse deviation. The average interest rate used for the determination of the future policy benefits for these contracts was 4.5% and 4.4% at December 31, 2009 and 2008, respectively. Total future policy benefit reserves for the year ended December 31, 2009 and 2008 were $5.5 billion and $5.5 billion, respectively. The decrease of $156.9 million in the Traditional Life business is mainly due to the novation and recapture of part of the U.K. and Irish term assurance and critical illness business and sale of its U.S. life reinsurance business partially offset by the weakening of the U.S. dollar against the U.K. Pound Sterling and Euro in 2009. The increase of $194.2 million in the Annuities is mainly due to foreign exchange movements.
Future policy benefit reserves are comprised of the following: Year ended December 31, 2009 2008 (U.S. dollars in thousands) Traditional Life ........................................................................................... $ 843,915 $ 1,000,821 Annuities ..................................................................................................... 4,646,204 4,452,044 Total future policy benefit reserves ......................................................... $ 5,490,119 $ 5,452,865
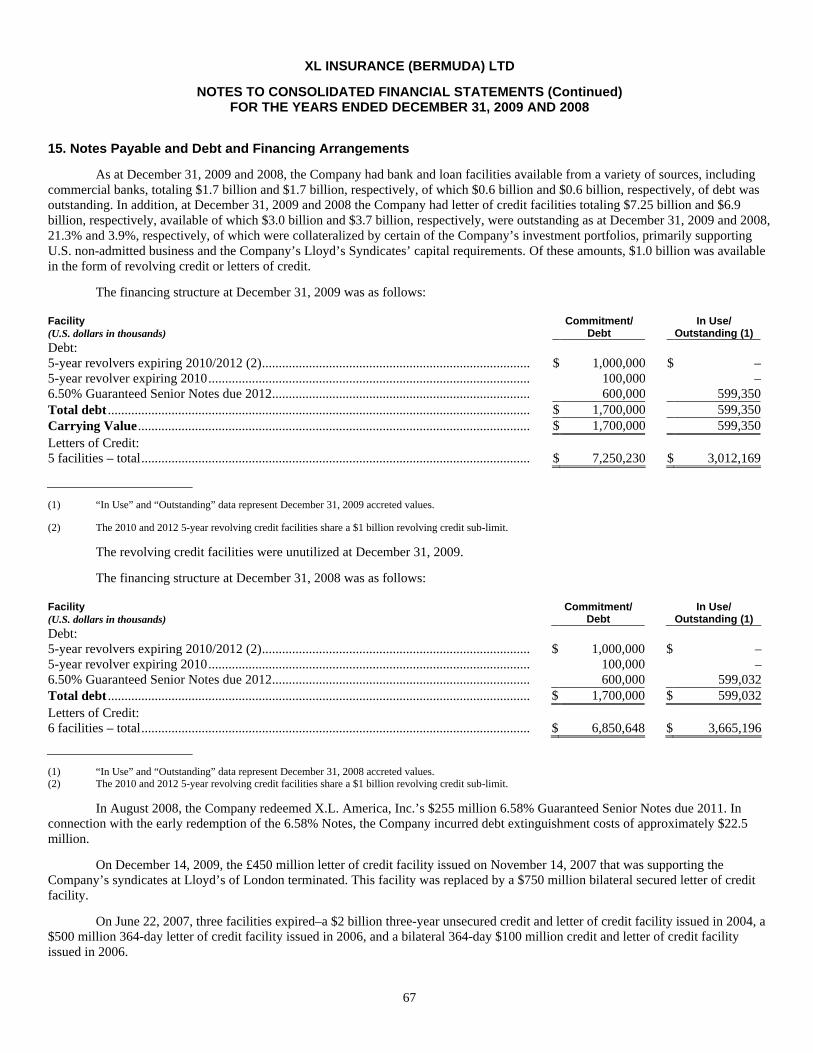
67
XL INSURANCE (BERMUDA) LTD
NOTES TO CONSOLIDATED FINANCIAL STATEMENTS (Continued) FOR THE YEARS ENDED DECEMBER 31, 2009 AND 2008
15. Notes Payable and Debt and Financing Arrangements
As at December 31, 2009 and 2008, the Company had bank and loan facilities available from a variety of sources, including commercial banks, totaling $1.7 billion and $1.7 billion, respectively, of which $0.6 billion and $0.6 billion, respectively, of debt was outstanding. In addition, at December 31, 2009 and 2008 the Company had letter of credit facilities totaling $7.25 billion and $6.9 billion, respectively, available of which $3.0 billion and $3.7 billion, respectively, were outstanding as at December 31, 2009 and 2008, 21.3% and 3.9%, respectively, of which were collateralized by certain of the Company’s investment portfolios, primarily supporting U.S. non-admitted business and the Company’s Lloyd’s Syndicates’ capital requirements. Of these amounts, $1.0 billion was available in the form of revolving credit or letters of credit.
The financing structure at December 31, 2009 was as follows: Facility (U.S. dollars in thousands)
Commitment/ Debt
In Use/ Outstanding (1)
Debt: 5-year revolvers expiring 2010/2012 (2)....................................................................................... $ 1,000,000 $ – 5-year revolver expiring 2010....................................................................................................... 100,000 – 6.50% Guaranteed Senior Notes due 2012.................................................................................... 600,000 599,350 Total debt ................................................................................................................................ $ 1,700,000 599,350 Carrying Value............................................................................................................................ $ 1,700,000 599,350 Letters of Credit: 5 facilities – total........................................................................................................................... $ 7,250,230 $ 3,012,169
(1) “In Use” and “Outstanding” data represent December 31, 2009 accreted values.
(2) The 2010 and 2012 5-year revolving credit facilities share a $1 billion revolving credit sub-limit.
The revolving credit facilities were unutilized at December 31, 2009.
The financing structure at December 31, 2008 was as follows: Facility (U.S. dollars in thousands)
Commitment/ Debt
In Use/ Outstanding (1)
Debt: 5-year revolvers expiring 2010/2012 (2)....................................................................................... $ 1,000,000 $ – 5-year revolver expiring 2010....................................................................................................... 100,000 – 6.50% Guaranteed Senior Notes due 2012.................................................................................... 600,000 599,032 Total debt ................................................................................................................................ $ 1,700,000 $ 599,032 Letters of Credit: 6 facilities – total........................................................................................................................... $ 6,850,648 $ 3,665,196
(1) “In Use” and “Outstanding” data represent December 31, 2008 accreted values. (2) The 2010 and 2012 5-year revolving credit facilities share a $1 billion revolving credit sub-limit.
In August 2008, the Company redeemed X.L. America, Inc.’s $255 million 6.58% Guaranteed Senior Notes due 2011. In connection with the early redemption of the 6.58% Notes, the Company incurred debt extinguishment costs of approximately $22.5 million.
On December 14, 2009, the £450 million letter of credit facility issued on November 14, 2007 that was supporting the Company’s syndicates at Lloyd’s of London terminated. This facility was replaced by a $750 million bilateral secured letter of credit facility.
On June 22, 2007, three facilities expired–a $2 billion three-year unsecured credit and letter of credit facility issued in 2004, a $500 million 364-day letter of credit facility issued in 2006, and a bilateral 364-day $100 million credit and letter of credit facility issued in 2006.
68
XL INSURANCE (BERMUDA) LTD
NOTES TO CONSOLIDATED FINANCIAL STATEMENTS (Continued) FOR THE YEARS ENDED DECEMBER 31, 2009 AND 2008
15. Notes Payable and Debt and Financing Arrangements (Continued)
On June 22, 2007, the Company closed a new $4 billion unsecured revolving credit and letter of credit facility. The new facility has a term of five years. The facility is available in the form of revolving credit in the amount of $1 billion (such limit is shared with the Company’s other syndicated revolving credit facility that closed in June 2005) and in the form of letters of credit in the aggregate amount of $4 billion.
On December 31, 2008, a $150 million unsecured letter of credit facility expired and was not replaced.
On December 16, 2006, the Company replaced a $100 million credit facility that matured in December 2006 with a new 364-day facility of the same amount.
The Company has several letter of credit facilities provided on a syndicated and bilateral basis from commercial banks. These facilities are utilized primarily to support non-admitted insurance and reinsurance operations in the U.S. and capital requirements at Lloyd’s. The commercial facilities are scheduled for renewal during 2010 through 2012. In addition to letters of credit, the Company has established insurance trusts in the U.S. that provide cedants with statutory relief required under state insurance regulation in the U.S. It is anticipated that the commercial facilities may be renewed on expiry but such renewals are subject to the availability of credit from banks utilized by the Company. In the event that such credit support is insufficient, the Company could be required to provide alternative security to cedants. This could take the form of additional insurance trusts supported by the Company’s investment portfolio or funds withheld using the Company’s cash resources. The value of letters of credit required is driven by, among other things, loss development of existing reserves, the payment pattern of such reserves, the expansion of business written by the Company and the loss experience of such business.
In general, all of the Company’s bank facilities, indentures and other documents relating to the Company’s outstanding indebtedness (collectively, the “Company’s Debt Documents”), as described above, contain cross default provisions to each other and the Company’s Debt Documents (other than the 6.5% Guaranteed Senior Notes indentures) contain affirmative covenants. These covenants provide for, among other things, minimum required ratings of the Company’s insurance and reinsurance operating subsidiaries and the level of secured indebtedness in the future. In addition, generally each of the Company’s Debt Documents provide for an event of default in the event of a change of control of the Company or some events involving bankruptcy, insolvency or reorganization of the Company. The Company’s credit facilities also contain minimum consolidated net worth covenants.
Under the Company’s five-year credit facilities, in the event that the Company XL Insurance (Bermuda) Ltd and XL Re Ltd fail to maintain a financial strength rating of at least “A–” from A.M. Best, an event of default would occur.
The 6.5% Guaranteed Senior Notes indenture contain a cross default provision. In general, in the event that the Company defaults in the payment of indebtedness in the amount of $50.0 million or more, an event of default would be triggered under both the 6.5% Guaranteed Senior Notes indentures.
Given that all of the Company’s Debt Documents contain cross default provisions, this may result in all holders declaring such debt due and payable and an acceleration of all debt due under those documents. If this were to occur, the Company may not have funds sufficient at that time to repay any or all of such indebtedness.
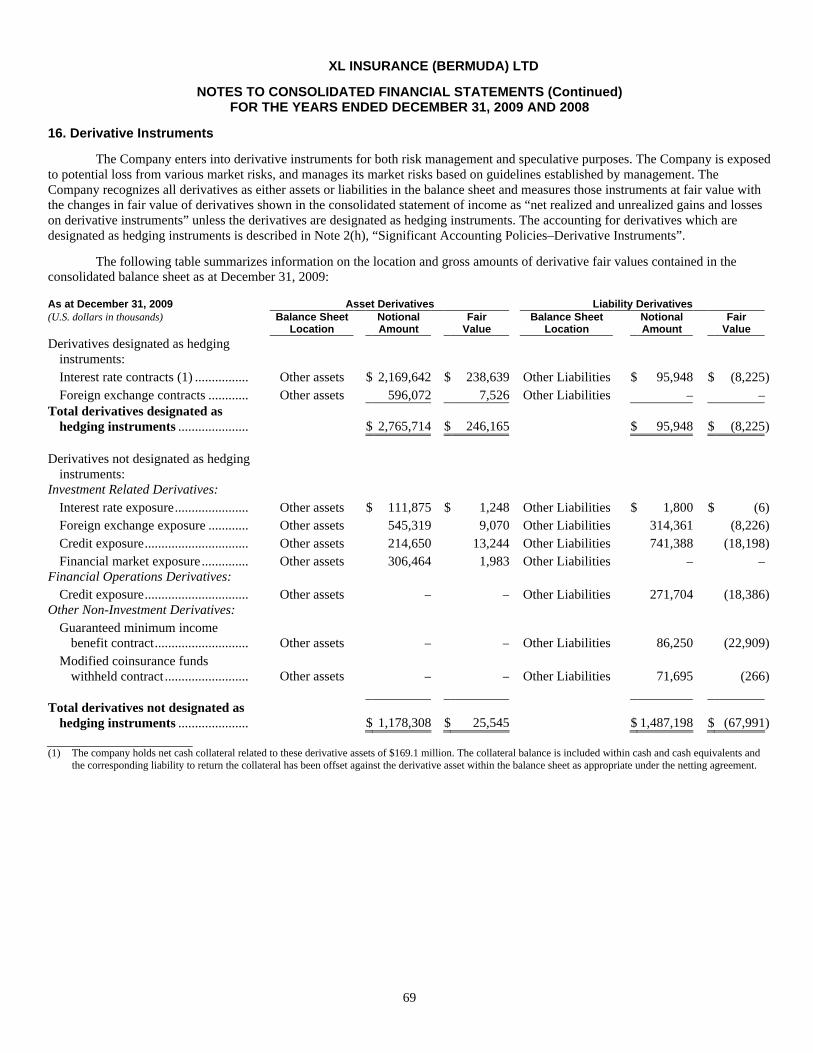
69
XL INSURANCE (BERMUDA) LTD
NOTES TO CONSOLIDATED FINANCIAL STATEMENTS (Continued) FOR THE YEARS ENDED DECEMBER 31, 2009 AND 2008
16. Derivative Instruments
The Company enters into derivative instruments for both risk management and speculative purposes. The Company is exposed to potential loss from various market risks, and manages its market risks based on guidelines established by management. The Company recognizes all derivatives as either assets or liabilities in the balance sheet and measures those instruments at fair value with the changes in fair value of derivatives shown in the consolidated statement of income as “net realized and unrealized gains and losses on derivative instruments” unless the derivatives are designated as hedging instruments. The accounting for derivatives which are designated as hedging instruments is described in Note 2(h), “Significant Accounting Policies–Derivative Instruments”.
The following table summarizes information on the location and gross amounts of derivative fair values contained in the consolidated balance sheet as at December 31, 2009:
As at December 31, 2009 Asset Derivatives Liability Derivatives (U.S. dollars in thousands)
Balance Sheet
Location Notional Amount
Fair Value
Balance Sheet Location
Notional Amount
Fair Value
Derivatives designated as hedging instruments: Interest rate contracts (1) ................ Other assets $ 2,169,642 $ 238,639 Other Liabilities $ 95,948 $ (8,225) Foreign exchange contracts ............ Other assets 596,072 7,526 Other Liabilities – –
Total derivatives designated as hedging instruments ..................... $ 2,765,714 $ 246,165 $ 95,948 $ (8,225)
Derivatives not designated as hedging
instruments: Investment Related Derivatives:
Interest rate exposure...................... Other assets $ 111,875 $ 1,248 Other Liabilities $ 1,800 $ (6) Foreign exchange exposure ............ Other assets 545,319 9,070 Other Liabilities 314,361 (8,226) Credit exposure............................... Other assets 214,650 13,244 Other Liabilities 741,388 (18,198) Financial market exposure.............. Other assets 306,464 1,983 Other Liabilities – –
Financial Operations Derivatives: Credit exposure............................... Other assets – – Other Liabilities 271,704 (18,386)
Other Non-Investment Derivatives: Guaranteed minimum income
benefit contract............................ Other assets – – Other Liabilities 86,250 (22,909) Modified coinsurance funds
withheld contract ......................... Other assets – – Other Liabilities 71,695 (266) Total derivatives not designated as
hedging instruments ..................... $ 1,178,308 $ 25,545 $ 1,487,198 $ (67,991)
(1) The company holds net cash collateral related to these derivative assets of $169.1 million. The collateral balance is included within cash and cash equivalents and the corresponding liability to return the collateral has been offset against the derivative asset within the balance sheet as appropriate under the netting agreement.
70
XL INSURANCE (BERMUDA) LTD
NOTES TO CONSOLIDATED FINANCIAL STATEMENTS (Continued) FOR THE YEARS ENDED DECEMBER 31, 2009 AND 2008
16. Derivative Instruments (Continued)
(a) Derivative Instruments Designated as Fair Value Hedges
The Company designates certain of its derivative instruments as fair value hedges, or hedges of the net investment in a foreign operation and formally and contemporaneously documents all relationships between the hedging instruments and hedged items and links the hedging derivative to specific assets and liabilities. The Company assesses the effectiveness of the hedge, both at inception and on an ongoing basis and determines whether the hedge is highly effective in offsetting changes in fair value or cash flows of the linked hedged item.
As at December 31, 2009, a portion of the Company’s liabilities are hedged against changes in the applicable designated benchmark interest rate. Interest rate swaps are also used to hedge the changes in fair value of certain fixed rate liabilities and fixed income securities due to changes in the designated benchmark interest rate. In addition, the company utilizes foreign exchange contracts to hedge the fair value of certain fixed income securities as well as to hedge certain net investments in foreign operations.
The following table provides the total impact on earnings relating to derivative instruments formally designated as fair value hedges along with the impacts of the related hedged items for the year ended December 31, 2009:
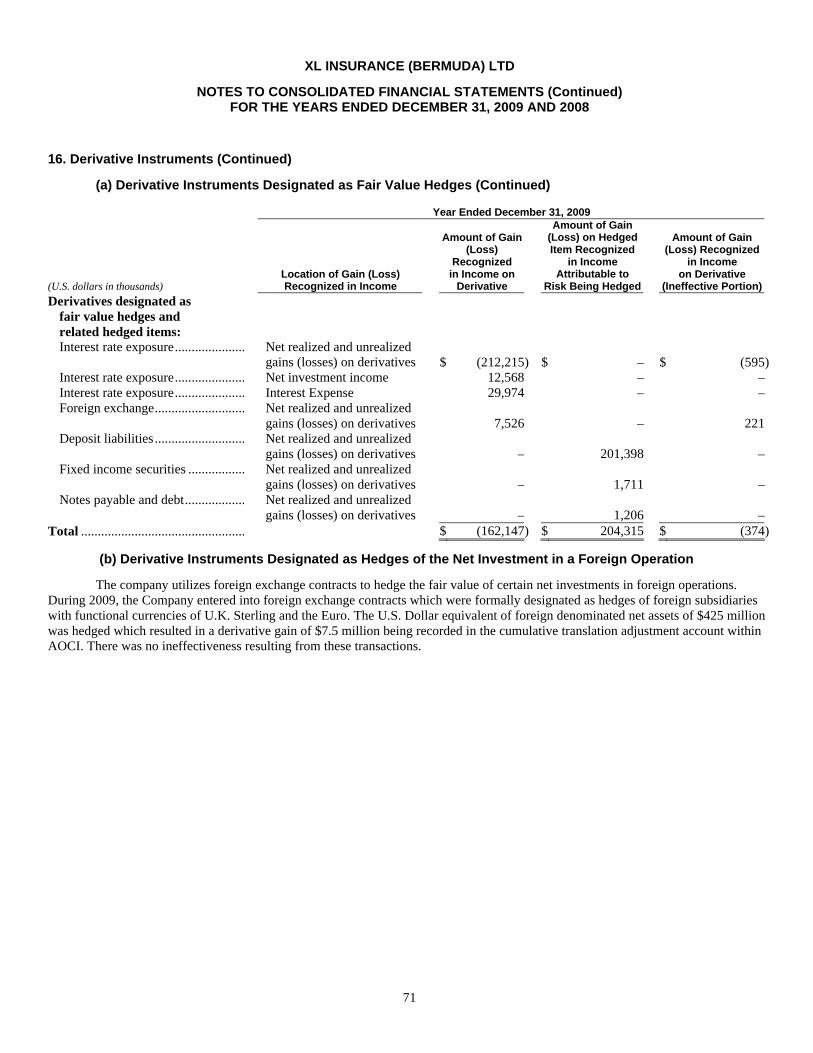
71
XL INSURANCE (BERMUDA) LTD
NOTES TO CONSOLIDATED FINANCIAL STATEMENTS (Continued) FOR THE YEARS ENDED DECEMBER 31, 2009 AND 2008
16. Derivative Instruments (Continued)
(a) Derivative Instruments Designated as Fair Value Hedges (Continued)
Year Ended December 31, 2009
(U.S. dollars in thousands) Location of Gain (Loss) Recognized in Income
Amount of Gain (Loss)
Recognized in Income on
Derivative
Amount of Gain (Loss) on Hedged Item Recognized
in Income Attributable to
Risk Being Hedged
Amount of Gain (Loss) Recognized
in Income on Derivative
(Ineffective Portion) Derivatives designated as
fair value hedges and related hedged items: Interest rate exposure......................
Net realized and unrealized gains (losses) on derivatives $ (212,215) $ – $ (595)
Interest rate exposure...................... Net investment income 12,568 – – Interest rate exposure...................... Interest Expense 29,974 – – Foreign exchange............................
Net realized and unrealized gains (losses) on derivatives 7,526 – 221
Deposit liabilities ............................
Net realized and unrealized gains (losses) on derivatives – 201,398 –
Fixed income securities ..................
Net realized and unrealized gains (losses) on derivatives – 1,711 –
Notes payable and debt................... Net realized and unrealized gains (losses) on derivatives – 1,206 – Total .................................................. $ (162,147) $ 204,315 $ (374)
(b) Derivative Instruments Designated as Hedges of the Net Investment in a Foreign Operation
The company utilizes foreign exchange contracts to hedge the fair value of certain net investments in foreign operations. During 2009, the Company entered into foreign exchange contracts which were formally designated as hedges of foreign subsidiaries with functional currencies of U.K. Sterling and the Euro. The U.S. Dollar equivalent of foreign denominated net assets of $425 million was hedged which resulted in a derivative gain of $7.5 million being recorded in the cumulative translation adjustment account within AOCI. There was no ineffectiveness resulting from these transactions.
72
XL INSURANCE (BERMUDA) LTD
NOTES TO CONSOLIDATED FINANCIAL STATEMENTS (Continued) FOR THE YEARS ENDED DECEMBER 31, 2009 AND 2008
16. Derivative Instruments (Continued)
(c) Derivative Instruments Not Formally Designated As Hedging Instruments
The following table provides the total impact on earnings relating to derivative instruments not formally designated as hedging instruments under authoritative accounting guidance. The impacts are all recorded through Net realized and unrealized gains (losses) on derivatives in the income statement.
(U.S. dollars and shares in thousands) Amount of Gain (Loss) Recognized in
Income on Derivative
Derivatives not designated as hedging instruments: Year ended
December 31, 2009 Investment Related Derivatives:
Interest rate exposure....................................................................................................... $ 9,124 Foreign exchange exposure ............................................................................................. 9,497 Credit exposure................................................................................................................ (51,579) Financial market exposure............................................................................................... 3,948
Financial Operations Derivatives: Credit exposure................................................................................................................ (2,667)
Other Non-Investment Derivatives: Guaranteed minimum income benefit contract................................................................ 4,644 Modified coinsurance funds withheld contract................................................................ (388)
Weather and Energy Derivatives: Structured weather risk management products ................................................................ 2,979
Total derivatives not designated as hedging instruments .................................................... (24,442) Amount of gain (loss) recognized in income from ineffective portion of fair value
hedges .............................................................................................................................. (374) Net realized and unrealized gains (losses) on derivative instruments ................................. $ (24,816)
The Company’s objectives in using these derivatives are explained in sections (d) and (e) of this note below.
(c)(i) Investment Related Derivatives
The Company, either directly or through its investment managers, may use derivative instruments within its investment portfolio, including interest rate swaps, inflation swaps, credit derivatives (single name and index credit default swaps), options, forward contracts and financial futures (foreign exchange, bond and stock index futures), primarily as a means of economically hedging exposures to interest rate, credit spread, equity price changes and foreign currency risk or in limited instances for investment purposes. The Company is exposed to credit risk in the event of non-performance by the counterparties under any swap contracts although the Company generally seeks to use credit support arrangements with counterparties to help manage this risk.
Investment Related Derivatives–Interest Rate Exposure
The Company utilizes risk management and overlay strategies that incorporate the use of derivative financial instruments, primarily to manage its fixed income portfolio duration and exposure to interest rate risks associated with certain of its assets and liabilities primarily in relation to certain legacy other financial lines and structured indemnity transactions. The Company uses interest rate swaps to convert certain liabilities from a fixed rate to a variable rate of interest and may also use them to convert a variable rate of interest from one basis to another.
73
XL INSURANCE (BERMUDA) LTD
NOTES TO CONSOLIDATED FINANCIAL STATEMENTS (Continued) FOR THE YEARS ENDED DECEMBER 31, 2009 AND 2008
16. Derivative Instruments (Continued)
(c)(i) Investment Related Derivatives (Continued)
Investment Related Derivatives – Foreign Exchange Exposure
The Company uses foreign exchange contracts to manage its exposure to the effects of fluctuating foreign currencies on the value of certain of its foreign currency fixed maturities primarily within its Life operations portfolio. These contracts are not designated as specific hedges for financial reporting purposes and therefore, realized and unrealized gains and losses on these contracts are recorded in income in the period in which they occur. These contracts generally have maturities of twelve months or less.
In addition, certain of the Company’s investment managers may, subject to investment guidelines, enter into forward contracts where potential gains may exist. The Company has exposure to foreign currency exchange rate fluctuations through its operations and in its investment portfolio.
Investment Related Derivatives – Credit Exposure
Credit derivatives are purchased within the Company’s investment portfolio in the form of single name and basket credit default swaps, which are used to mitigate credit exposure through a reduction in credit spread duration (i.e. macro credit strategies rather than single-name credit hedging) or exposure to selected issuers, including issuers that are not held in the underlying bond portfolio.
Investment Related Derivatives – Financial Market Exposure
Stock index futures may be purchased with the Company’s investment portfolio in order to create synthetic equity exposure and to add value to the portfolio with overlay strategies where market inefficiencies are believed to exist. The Company previously wrote a number of resettable strike swaps contracts relating to an absolute return index and diversified baskets of funds. Finally, from time to time, the Company may enter into other financial market exposure derivative contracts on various indices including, but not limited to, inflation, commodity and correlation contracts.
(c)(ii) Financial Operations Derivatives – Credit Exposure
The Company held credit derivative exposures through a limited number of contracts written as part of the Company’s previous financial lines businesses, and through the Company’s prior reinsurance agreements with Syncora, as described below. Following the secondary sale of Syncora common shares, the Company retained some credit derivative exposures written by Syncora and certain of its subsidiaries through reinsurance agreements that had certain derivatives exposures embedded within them. The change in value of the derivative portion of the financial guarantee reinsurance agreements the Company had with Syncora was included in “Net (loss) income from operating affiliates.” Following the closing of the Master Agreement during August 2008, as described in Note 4, “Syncora Holdings Ltd.” which terminated certain reinsurance and other agreements, these credit derivative exposures were eliminated by virtue of the commutation of the relevant reinsurance agreements.
As of December 31, 2009 and December 31, 2008 the remaining credit derivative exposures outside of the Company’s investment portfolio consisted of 2 and 23 contracts, respectively, written by the Company that provide credit protection on senior tranches of structured finance transactions with total insured contractual payments outstanding of $271.7 million ($244.9 million principal and $26.8 million interest), and $639.5 million ($499.5 million principal and $140.0 million of interest), weighted average contractual term to maturity of 6.0 years and 5.7 years, a total liability recorded of $18.4 million and $28.6 million, respectively, and an average rating of A and AA underlying obligations at December 31, 2009 and December 31, 2008, respectively. As of December 31, 2009, there were no reported events of default on the underlying obligations. Credit derivatives are recorded at fair value, which is determined using either models developed by the Company or third party prices and are dependent upon a number of factors, including changes in interest rates, future default rates, credit spreads, changes in credit quality, future expected recovery rates and other market factors. The change resulting from movements in credit and credit quality spreads is unrealized as the credit derivatives are not traded to realize this resultant value.
74
XL INSURANCE (BERMUDA) LTD
NOTES TO CONSOLIDATED FINANCIAL STATEMENTS (Continued) FOR THE YEARS ENDED DECEMBER 31, 2009 AND 2008
16. Derivative Instruments (Continued)
(c)(iii) Other Non-Investment Derivatives
The Company entered into derivatives as part of its contingent capital facility including interest rate swaps, and asset return swaps. These derivatives are recorded at fair value with changes in fair value recognized in earnings.
The Company also has derivatives embedded in certain reinsurance contracts. For a particular life reinsurance contract, the Company pays the ceding company a fixed amount equal to the estimated present value of the excess of guaranteed benefit GMIB over the account balance upon the policyholder’s election to take the income benefit. The fair value of this derivative is determined based on the present value of expected cash flows. In addition, the Company has modified coinsurance and funds withheld reinsurance agreements that provide for a return based on a portfolio of fixed income securities. As such, the agreements contain embedded derivatives. The embedded derivative is bifurcated from the funds withheld balance and recorded at fair value with changes in fair value recognized in earnings through net realized and unrealized gains and losses on derivative instrument.
(c)(iv) Weather and Energy Derivatives
Prior to August 2008, the Company offered weather and energy risk management products in insurance or derivative form to end-users and managed the risks in the OTC and exchange traded derivative markets or through the use of quota share or excess of loss arrangements. However, as part of the Company’s strategy to focus on its core lines of business within its Insurance and Reinsurance segments, the Company closed this unit in August 2008 and ceased writing such weather and energy risk management products. Weather and energy derivatives are recorded at fair value, which is determined through the use of quoted market prices where available. Where quoted market prices are unavailable, the fair values are estimated using available market data and internal pricing models based upon consistent statistical methodologies. Estimating fair value of instruments that do not have quoted market prices requires management’s judgment in determining amounts that could reasonably be expected to be received from, or paid to, a third party in settlement of the contracts. The amounts could be materially different from the amounts that might be realized in an actual sale transaction. Fair values are subject to change in the near-term and reflect management’s best estimate based on various factors including, but not limited to, actual and forecasted weather conditions, changes in commodity prices, changes in interest rates and other market factors. The majority of existing weather and energy contracts expired at the end of 2008 and the remainder expired during 2009.
(d) Contingent Credit Features
Certain derivatives agreements entered into by the Company or its subsidiaries contain rating downgrade provisions that permit early termination of the agreement by the counterparty if collateral is not posted following failure to maintain certain credit ratings from one or more of the principal credit rating agencies. If the Company were required to early terminate such agreements due to rating downgrade, it could potentially be in a net liability position at time of settlement. The aggregate fair value of all derivatives agreements containing such rating downgrade provisions that were in a liability position on December 31, 2009 was $30.8 million. The Company has not been required to post collateral under any of these agreements as of December 31, 2009.
17. Variable Interest Entities
At times, the Company has utilized VIEs both indirectly and directly in the ordinary course of the Company’s business.
The Company invests in CDOs, and other investment vehicles that are issued through variable interest entities as part of the Company’s investment portfolio. The activities of these VIEs are generally limited to holding the underlying collateral used to service investments therein. Our involvement in these entities is passive in nature and we are not the arranger of these entities. The Company has not been involved in establishing these entities. The Company is not the primary beneficiary of these variable interest entities as contemplated in current authoritative accounting guidance.
The company has a limited number of remaining outstanding credit enhancement exposures including written financial guarantee and credit default swap contracts. The obligations related to these transactions are often securitized through variable interest entities. The Company is not the primary beneficiary of these variable interest entities as contemplated in current authoritative accounting guidance. For further details on the nature of the obligations and the size of the company’s maximum exposure see Note 2(p), “Recent Accounting Pronouncements”, and Note 16, “Derivative Instruments”.
75
XL INSURANCE (BERMUDA) LTD
NOTES TO CONSOLIDATED FINANCIAL STATEMENTS (Continued) FOR THE YEARS ENDED DECEMBER 31, 2009 AND 2008
18. Commitments and Contingencies
(a) Concentrations of Credit Risk
The creditworthiness of any counterparty is evaluated by the Company, taking into account credit ratings assigned by rating agencies. The credit approval process involves an assessment of factors including, among others, the counterparty and country and industry credit exposure limits. Collateral may be required, at the discretion of the Company, on certain transactions based on the creditworthiness of the counterparty.
The areas where significant concentrations of credit risk may exist include unpaid losses and loss expenses recoverable and reinsurance balances receivable (collectively, “reinsurance assets”) and investments balances.
The Company’s reinsurance assets at December 31, 2009 and 2008 amounted to $4.0 billion and $4.6 billion respectively and resulted from reinsurance arrangements in the course of its operations. A credit exposure exists with respect to reinsurance assets as they may be uncollectible. The Company manages its credit risk in its reinsurance relationships by transacting with reinsurers that it considers financially sound, and if necessary, the Company may hold collateral in the form of funds, trust accounts and/or irrevocable letters of credit. This collateral can be drawn on for amounts that remain unpaid beyond specified time periods on an individual reinsurer basis.
The Company did not have an aggregate direct investment in any single corporate issuer, in excess of 5% of shareholder’s equity at December 31, 2009 or December 31, 2008, which excludes government-backed, government-sponsored enterprises, government-guaranteed paper, cash and cash equivalents, and asset and mortgage backed securities that were issued, sponsored or serviced by the parent.
In addition, the Company underwrites a significant amount of its insurance and reinsurance property and casualty business through brokers and a credit risk exists should any of these brokers be unable to fulfill their contractual obligations with respect to the payments of insurance and reinsurance balances to the Company. During the three years ended December 31, 2009, 2008 and 2007, approximately 18%, 17% and 18%, respectively, of the Company’s consolidated gross written premiums from property and casualty operations were generated from or placed by Marsh & McLennan Companies. During 2009, 2008 and 2007, approximately 20%, 19% and 19%, respectively, of the Company’s consolidated gross written premiums from property and casualty operations were generated from or placed by AON Corporation and its subsidiaries. Both of these companies are large, well established companies and there are no indications that either of them is financially troubled. No other broker and no one insured or reinsured accounted for more than 10% of gross premiums written from property and casualty operations in any of the three years ended December 31, 2009, 2008, or 2007.
(b) Other Investments
The Company has committed to invest in several limited partnerships and provide liquidity financing to a structured investment vehicle. As of December 31, 2009, the Company has commitments which include potential additional add-on clauses, to fund a further $97.5 million.
(c) Investments in Affiliates
The Company owns a minority interest in certain closed-end funds, certain limited partnerships and similar investment vehicles, including funds managed by those companies. The Company has commitments, which include potential additional add-on clauses, to invest a further $36.6 million over the next five years.
(d) Properties
The Company rents space for certain of its offices under leases that expire up to 2031. Total rent expense under operating leases for the years ended December 31, 2009, 2008 and 2007 was approximately $34.4 million, $35.4 million and $34.5 million, respectively. Future minimum rental commitments under existing operating leases are expected to be as follows:
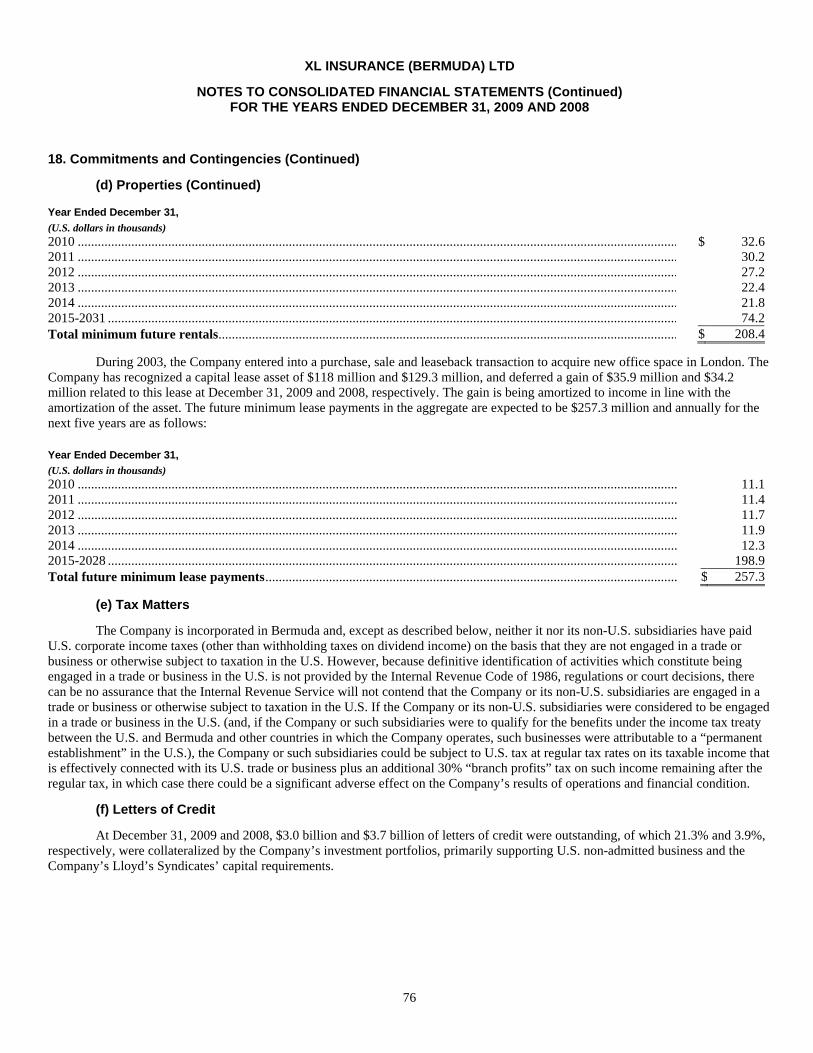
76
XL INSURANCE (BERMUDA) LTD
NOTES TO CONSOLIDATED FINANCIAL STATEMENTS (Continued) FOR THE YEARS ENDED DECEMBER 31, 2009 AND 2008
18. Commitments and Contingencies (Continued)
(d) Properties (Continued)
Year Ended December 31, (U.S. dollars in thousands) 2010 ................................................................................................................................................................................... $ 32.6 2011 ................................................................................................................................................................................... 30.2 2012 ................................................................................................................................................................................... 27.2 2013 ................................................................................................................................................................................... 22.4 2014 ................................................................................................................................................................................... 21.8 2015-2031 .......................................................................................................................................................................... 74.2 Total minimum future rentals......................................................................................................................................... $ 208.4
During 2003, the Company entered into a purchase, sale and leaseback transaction to acquire new office space in London. The Company has recognized a capital lease asset of $118 million and $129.3 million, and deferred a gain of $35.9 million and $34.2 million related to this lease at December 31, 2009 and 2008, respectively. The gain is being amortized to income in line with the amortization of the asset. The future minimum lease payments in the aggregate are expected to be $257.3 million and annually for the next five years are as follows: Year Ended December 31, (U.S. dollars in thousands) 2010 ................................................................................................................................................................................... 11.1 2011 ................................................................................................................................................................................... 11.4 2012 ................................................................................................................................................................................... 11.7 2013 ................................................................................................................................................................................... 11.9 2014 ................................................................................................................................................................................... 12.3 2015-2028 .......................................................................................................................................................................... 198.9 Total future minimum lease payments........................................................................................................................... $ 257.3
(e) Tax Matters
The Company is incorporated in Bermuda and, except as described below, neither it nor its non-U.S. subsidiaries have paid U.S. corporate income taxes (other than withholding taxes on dividend income) on the basis that they are not engaged in a trade or business or otherwise subject to taxation in the U.S. However, because definitive identification of activities which constitute being engaged in a trade or business in the U.S. is not provided by the Internal Revenue Code of 1986, regulations or court decisions, there can be no assurance that the Internal Revenue Service will not contend that the Company or its non-U.S. subsidiaries are engaged in a trade or business or otherwise subject to taxation in the U.S. If the Company or its non-U.S. subsidiaries were considered to be engaged in a trade or business in the U.S. (and, if the Company or such subsidiaries were to qualify for the benefits under the income tax treaty between the U.S. and Bermuda and other countries in which the Company operates, such businesses were attributable to a “permanent establishment” in the U.S.), the Company or such subsidiaries could be subject to U.S. tax at regular tax rates on its taxable income that is effectively connected with its U.S. trade or business plus an additional 30% “branch profits” tax on such income remaining after the regular tax, in which case there could be a significant adverse effect on the Company’s results of operations and financial condition.
(f) Letters of Credit
At December 31, 2009 and 2008, $3.0 billion and $3.7 billion of letters of credit were outstanding, of which 21.3% and 3.9%, respectively, were collateralized by the Company’s investment portfolios, primarily supporting U.S. non-admitted business and the Company’s Lloyd’s Syndicates’ capital requirements.
77
XL INSURANCE (BERMUDA) LTD
NOTES TO CONSOLIDATED FINANCIAL STATEMENTS (Continued) FOR THE YEARS ENDED DECEMBER 31, 2009 AND 2008
18. Commitments and Contingencies (Continued)
(g) Claims and Other Litigation
The Company is subject to litigation and arbitration in the normal course of its business. These lawsuits and arbitrations principally involve claims on policies of insurance and contracts of reinsurance and are typical for the Company and for the property and casualty insurance and reinsurance industry in general. Such legal proceedings are considered in connection with the Company’s loss and loss expense reserves. Reserves in varying amounts may or may not be established in respect of particular claims proceedings based on many factors, including the legal merits thereof. In addition to litigation relating to insurance and reinsurance claims, the Company and its subsidiaries are subject to lawsuits and regulatory actions in the normal course of business that do not arise from or directly relate to claims on insurance or reinsurance policies. This category of business litigation typically involves, amongst other things, allegations of underwriting errors or misconduct, employment claims, regulatory activity, shareholder disputes or disputes arising from business ventures. The status of these legal actions is actively monitored by management. If management believed, based on available information, that an adverse outcome upon resolution of a given legal action was probable and the amount of that adverse outcome was reasonable to estimate, a loss would be recognized and a related liability recorded. No such liabilities were recorded by the Company at December 31, 2009 and 2008. In addition, the Company believes that the expected ultimate outcome of all outstanding litigation and arbitration will not have a material adverse effect on its consolidated financial condition, operating results and/or cash flow, although an adverse resolution of one or more of these items could have a material adverse effect on the Company’s results of operations in a particular fiscal quarter or year. The following information highlights ongoing legal proceedings related to the Company.
In November 2006, a subsidiary of the Company received a grand jury subpoena from the Antitrust Division of the U.S. Department of Justice (“DOJ”) and a subpoena from the SEC, both of which sought documents in connection with an investigation into the municipal GICs market and related products. In June 2008, subsidiaries of the Company also received a subpoena from the Connecticut Attorney General and an Antitrust Civil Investigative Demand from the Office of the Florida Attorney General in connection with a coordinated multi-state Attorneys General investigation into the matters referenced in the DOJ and SEC subpoenas. The Company is fully cooperating with these investigations.
Commencing in March 2008, two of the Company’s subsidiaries and the Company’s ultimate parent were named, along with approximately 20 other providers and insurers of municipal Guaranteed Investment Contracts and similar derivative products in the U.S. (collectively “Municipal Derivatives”) as well as fourteen brokers of such products, in several purported federal antitrust class actions. The Judicial Panel on Multidistrict Litigation ordered that these be consolidated for pretrial purposes and assigned them to the Southern District of New York. The consolidated amended complaint filed in August 2008 alleges that there was a conspiracy among the defendants during the period from January 1, 1992 to the present to rig bids and otherwise unlawfully decrease the yield for Municipal Derivative products. The purported class of plaintiffs consists of purchasers of Municipal Derivatives. On October 21, 2008 most of the defendants filed motions to dismiss the consolidated amended complaint. The District Judge granted the motions by order dated April 29, 2009, but allowed plaintiffs leave to file a second amended complaint within 20 days of the order. Plaintiffs filed a Second Consolidated Amended Class Action Complaint on June 18, 2009, but did not include the Company or any subsidiaries as a defendant. In addition, the Company and three subsidiaries of the Company were named in eleven individual (i.e., non-class) actions filed by various municipalities or other local government bodies in California state courts. The Defendants removed those cases to federal court and the cases were then transferred to the Southern District of New York by the Judicial Panel on Multidistrict Litigation. On February 9, 2010, the Company and subsidiaries filed a motion to dismiss all eleven actions and intends to vigorously defend them.
78
XL INSURANCE (BERMUDA) LTD
NOTES TO CONSOLIDATED FINANCIAL STATEMENTS (Continued) FOR THE YEARS ENDED DECEMBER 31, 2009 AND 2008
18. Commitments and Contingencies (Continued)
(g) Claims and Other Litigation (Continued)
In August 2005, plaintiffs in a proposed class action (the “Class Action”) that was consolidated into a multidistrict litigation in the United States District Court for the District of New Jersey, captioned In re Brokerage Antitrust Litigation, MDL No. 1663, Civil Action No. 04-5184 (the “MDL”), filed a consolidated amended complaint (the “Amended Complaint”), which named as new defendants approximately 30 entities, including Greenwich Insurance Company, Indian Harbor Insurance Company and the company’s ultimate parent, XL Capital Ltd. In the MDL, the Class Action plaintiffs asserted various claims purportedly on behalf of a class of commercial insureds against approximately 113 insurance companies and insurance brokers through which the named plaintiffs allegedly purchased insurance. The Amended Complaint alleged that the defendant insurance companies and insurance brokers conspired to manipulate bidding practices for insurance policies in certain insurance lines and failed to disclose certain commission arrangements and asserted statutory claims under the Sherman Act, various state antitrust laws and the Racketeer Influenced and Corrupt Organizations Act (“RICO”), as well as common law claims alleging breach of fiduciary duty, aiding and abetting a breach of fiduciary duty and unjust enrichment. By Opinion and Order dated August 31, 2007, the Court dismissed the Sherman Act claims with prejudice and, by Opinion and Order dated September 28, 2007, the Court dismissed the RICO claims with prejudice. The plaintiffs then appealed both Orders to the U.S. Court of Appeals for the Third Circuit. Oral argument before the appellate court was held on April 21, 2009. In accordance with the Third Circuit’s April 23, 2009 directive, the parties submitted on May 13, 2009 their respective supplemental letter briefs addressing a question raised by the Court. The appeal remains pending.
Various XL entities have been named as defendants in three of the many tag-along actions that have been consolidated into the MDL for pretrial purposes. The complaints in these tag-along actions make allegations similar to those made in the Amended Complaint but do not purport to be class actions. On April 4, 2006, a tag-along complaint was filed in the U.S. District Court for the Northern District of Georgia on behalf of New Cingular Wireless Headquarters LLC and several other corporations against approximately 100 defendants, including Greenwich Insurance Company, XL Specialty Insurance Company, XL Insurance America, Inc., XL Insurance Company Limited, Lloyd’s syndicates 861, 588 and 1209 and the Company’s parent, XL Capital Ltd.. On or about May 21, 2007, a tag-along complaint was filed in the U.S. District Court for the District of New Jersey on behalf of Henley Management Company, Big Bear Properties, Inc., Northbrook Properties, Inc., RCK Properties, Inc., Kitchens, Inc., Aberfeldy LP and Payroll and Insurance Group, Inc. against multiple defendants, including “XL Winterthur International”. On October 12, 2007, a complaint in a third tag-along action was filed in the U.S. District Court for the Northern District of Georgia by Sears, Roebuck & Co., Sears Holdings Corporation, Kmart Corporation and Lands’ End Inc. against many named defendants including X.L. America, Inc., XL Insurance America, Inc., XL Specialty Insurance Company and XL Insurance (Bermuda) Ltd. The three tag-along actions are currently stayed. The Judge presiding over the MDL has set a conference for March 2, 2010 to review whether he should suggest to the Judicial Panel on Multidistrict Litigation that the remaining tag-along actions be remanded to the respective courts in which they were originally filed.
Three purported class actions on behalf of shareholders of Syncora have been filed in the Southern District of New York against the Company and one of its subsidiaries (collectively “XL”), Syncora, four Syncora officers, and various underwriters of Syncora securities. The Judge ordered that these be consolidated. The consolidated amended complaint, filed in August 2008, alleges violations of the Securities Act of 1933 arising out of the secondary public offering of Syncora common shares held by XL on June 6, 2007 and sales/exchanges by Syncora of certain preferred shares as well as under the Securities Exchange Act of 1934 arising out of trading in Syncora securities during the asserted class period of March 15, 2007 to March 17, 2008. The principal allegations are that Syncora failed to appropriately and timely disclose its exposures under certain derivative contracts and insurance of tranches of structured securities. XL is named as a party that “controlled” Syncora during the relevant time period. In October 2008, XL and other defendants filed motions to dismiss the consolidated amended complaint, which motions have been fully briefed. The Company intends to vigorously defend these actions.

79
XL INSURANCE (BERMUDA) LTD
NOTES TO CONSOLIDATED FINANCIAL STATEMENTS (Continued) FOR THE YEARS ENDED DECEMBER 31, 2009 AND 2008
18. Commitments and Contingencies (Continued)
(g) Claims and Other Litigation (Continued)
In connection with the secondary offering of the Company’s Syncora shares, the Company and Syncora each agreed to indemnify the several underwriters of that offering against certain liabilities, including liabilities under the Securities Act of 1933 for payment of legal fees and expenses, settlements and judgments incurred with respect to litigation such as this. The Company and Syncora have agreed to each bear 50% of this indemnity obligation.
Legal actions are subject to inherent uncertainties, and future events could change management’s assessment of the probability or estimated amount of potential losses from pending or threatened legal actions. Based on available information, it is the opinion of management that the ultimate resolution of pending or threatened legal actions, both individually and in the aggregate, will not result in losses having a material effect on the Company’s financial position at December 31, 2009.
19. Compensation Plans
a) Stock Plans
The company’s ultimate parent, XL Capital, operates stock-based performance incentive programs, which provide for grants of stock options and restricted stock to employees of the Company. The plans are administered by the Board of Directors and the Compensation Committee of the Board of Directors of XL Capital Ltd.
XL Capital’s 1991 Performance Incentive Program, as amended and restated effective February 27, 2009, provides for grants of non-qualified or incentive stock options, restricted stock, restricted stock units, performance shares, performance units and stock appreciation rights (“SARs”). The plan is administered by the Management Development & Compensation Committee of the Board of Directors of XL Capital. Stock options may be granted with or without SARs. No SARs have been granted to date. Grant prices are established at the fair market value of XL Capital’s common stock at the date of grant. Options and SARs have a life of not longer than ten years and vest as set forth at the time of grant. Generally, options currently vest annually over three years from date of grant; however, options granted to NEOs in August, 2008, vest in full on the later of (i) three years from the grant date or (ii) the date that the closing price of XL Capital’s common shares on the NYSE equals or exceeds 130% of the option exercise price (approximately $25.51 per share) for a period of at least 10 consecutive trading days.
Restricted stock awards issued under the 1991 and 1999 Performance Incentive Programs vest as set forth in the applicable award agreements. These XL Capital shares contained certain restrictions, prior to vesting, relating to, among other things, forfeiture in the event of termination of employment and transferability. The award recipients generally have the rights and privileges of an XL Capital shareholder as to the restricted stock, including the right to receive dividends and the right to vote such restricted stock. The recipients are not entitled to receive delivery of an XL Capital stock certificate prior to vesting, nor may any restricted stock be sold, transferred, pledged, or otherwise disposed of prior to the satisfaction of all vesting requirements.
(b) Options
The fair value of each option grant is estimated on the date of grant using the Black-Scholes option pricing model with the following weighted average assumptions: 2009 2008 Dividend yield................................................................................................................................ 3.25 % 3.24% Risk free interest rate ................................................................................................................................ 2.38 % 3.22% Volatility ................................................................................................................................ 94.27 % 34.3% Expected lives ................................................................................................................................ 6.0 years 6.0 years
The risk free interest rate is based on U.S. Treasury rates. The expected lives are estimated using the historical exercise behavior of grant recipients. The expected volatility is determined based upon a combination of the historical volatility of the Company’s stock and the implied volatility derived from publicly traded options.
During the years ended December 31, 2009 and 2008, XL Capital granted 534,000 and 4,738,500 options, respectively, to purchase XL Capital’s ordinary shares to employees of the Company related to incentive compensation plans, with a weighted average grant-date fair value of $3.13 and $7.21. respectively. During the years ended December 31, 2009 and 2008, the Company recognized $8.7 million and $10.9 million, respectively, of compensation expense, net of tax, related to the stock option plan. Total intrinsic value of stock options exercised during the years ended December 31, 2009 and 2008 was nil.
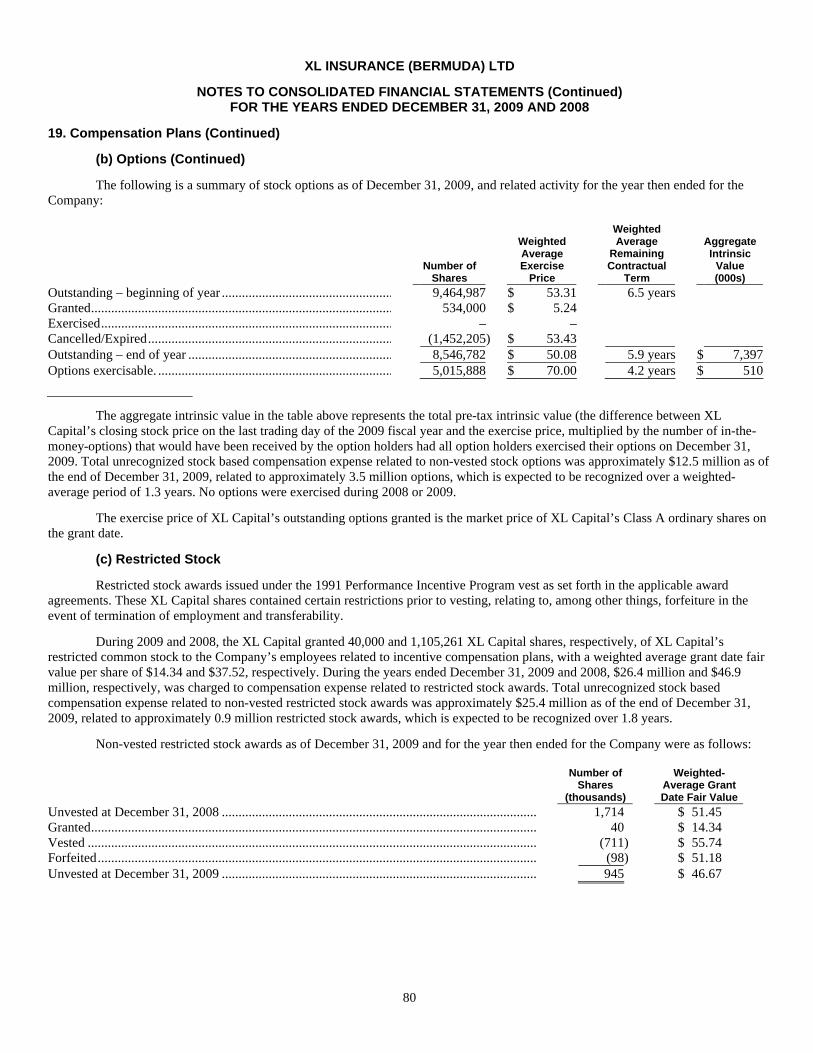
80
XL INSURANCE (BERMUDA) LTD
NOTES TO CONSOLIDATED FINANCIAL STATEMENTS (Continued) FOR THE YEARS ENDED DECEMBER 31, 2009 AND 2008
19. Compensation Plans (Continued)
(b) Options (Continued)
The following is a summary of stock options as of December 31, 2009, and related activity for the year then ended for the Company:
Number of
Shares
Weighted Average Exercise
Price
Weighted Average
Remaining Contractual
Term
Aggregate Intrinsic
Value (000s)
Outstanding – beginning of year ................................................................ 9,464,987 $ 53.31 6.5 years Granted................................................................................................ 534,000 $ 5.24 Exercised................................................................................................ – – Cancelled/Expired................................................................................................ (1,452,205) $ 53.43 Outstanding – end of year ................................................................ 8,546,782 $ 50.08 5.9 years $ 7,397 Options exercisable. ................................................................................................ 5,015,888 $ 70.00 4.2 years $ 510
The aggregate intrinsic value in the table above represents the total pre-tax intrinsic value (the difference between XL Capital’s closing stock price on the last trading day of the 2009 fiscal year and the exercise price, multiplied by the number of in-the-money-options) that would have been received by the option holders had all option holders exercised their options on December 31, 2009. Total unrecognized stock based compensation expense related to non-vested stock options was approximately $12.5 million as of the end of December 31, 2009, related to approximately 3.5 million options, which is expected to be recognized over a weighted-average period of 1.3 years. No options were exercised during 2008 or 2009.
The exercise price of XL Capital’s outstanding options granted is the market price of XL Capital’s Class A ordinary shares on the grant date.
(c) Restricted Stock
Restricted stock awards issued under the 1991 Performance Incentive Program vest as set forth in the applicable award agreements. These XL Capital shares contained certain restrictions prior to vesting, relating to, among other things, forfeiture in the event of termination of employment and transferability.
During 2009 and 2008, the XL Capital granted 40,000 and 1,105,261 XL Capital shares, respectively, of XL Capital’s restricted common stock to the Company’s employees related to incentive compensation plans, with a weighted average grant date fair value per share of $14.34 and $37.52, respectively. During the years ended December 31, 2009 and 2008, $26.4 million and $46.9 million, respectively, was charged to compensation expense related to restricted stock awards. Total unrecognized stock based compensation expense related to non-vested restricted stock awards was approximately $25.4 million as of the end of December 31, 2009, related to approximately 0.9 million restricted stock awards, which is expected to be recognized over 1.8 years.
Non-vested restricted stock awards as of December 31, 2009 and for the year then ended for the Company were as follows:
Number of Shares
(thousands)
Weighted- Average Grant Date Fair Value
Unvested at December 31, 2008 ................................................................................................ 1,714 $ 51.45 Granted................................................................................................................................................................ 40 $ 14.34 Vested ................................................................................................................................................................ (711) $ 55.74 Forfeited................................................................................................................................................................ (98) $ 51.18 Unvested at December 31, 2009 ................................................................................................ 945 $ 46.67
81
XL INSURANCE (BERMUDA) LTD
NOTES TO CONSOLIDATED FINANCIAL STATEMENTS (Continued) FOR THE YEARS ENDED DECEMBER 31, 2009 AND 2008
20. Retirement Plans
The Company provides pension benefits to eligible employees through various defined contribution and defined benefit retirement plans sponsored by the Company, which vary for each subsidiary. Plan assets are invested principally in equity securities and fixed maturities.
Defined contribution plans
The Company has qualified defined contribution plans which are managed externally and whereby employees and the Company contribute a certain percentage of the employee’s gross compensation (base salary and annual bonus) into the plan each month. The Company’s contribution generally vests over five years. The Company’s expenses for its qualified contributory defined contribution retirement plans were $36.9 million and $41.1 million at December 31, 2009 and 2008, respectively.
Defined benefit plans
The Company maintains defined benefit plans that cover certain employees as follows:
U.S. Plan
A qualified non-contributory defined benefit pension plan exists to cover a number of its U.S. employees. This plan also includes a non-qualified supplemental defined benefit plan designed to compensate individuals to the extent that their benefits under the Company’s qualified plan are curtailed due to Internal Revenue Code limitations. Benefits are based on years of service and compensation, as defined in the plan, during the highest consecutive three years of the employee’s last ten years of employment. Under these plans, the Company’s policy is to make annual contributions to the plan that are deductible for federal income tax purposes and that meet the minimum funding standards required by law. The contribution level is determined by utilizing the entry age cost method and different actuarial assumptions than those used for pension expense purposes.
In addition, certain former employees have received benefit type guarantees, not formally a part of any established plan. The liability recorded with respect to these agreements as at December 31, 2009 and 2008 was $3.3 million and $3.4 million, respectively, representing the entire unfunded projected benefit obligations.
Several assumptions and statistical variables are used in the models to calculate the expenses and liability related to the plans. The Company, in consultation with its actuaries, determines assumptions about the discount rate, the expected rate of return on plan assets and the rate of compensation increase. The table below includes disclosure of these rates on a weighted-average basis, encompassing all the international plans.
82
XL INSURANCE (BERMUDA) LTD
NOTES TO CONSOLIDATED FINANCIAL STATEMENTS (Continued) FOR THE YEARS ENDED DECEMBER 31, 2009 AND 2008
20. Retirement Plans (Continued)
Defined benefit plans (Continued) Net Benefit Cost – Weighted-average assumptions for the year ended December 31 2009 2008 Discount rate 6.00% 6.25% Expected long-term rate of return on plan assets 8.50% 8.50% Benefit Obligation – Weighted-average assumptions as of December 31 Discount rate 6.00% 6.00%
The US Retirement plan assets at December 31, 2009 consist of two mutual funds. The first fund employs a core bond portfolio strategy that seeks maximum current income and price appreciation consistent with the preservation of capital and prudent risk taking with a focus on investing in intermediate-term high quality bonds from the fastest growing economies in the Pacific Rim, including Japan.
The second fund seeks long term growth of capital by investing in a diversified group of domestic and international companies. Using a quantitative approach, portfolio managers identify companies that are expected to outperform in the next six to twelve months and include them in the fund.
The fair value of the US Plan assets at December 31, 2009 and 2008 was $22.0 million and $12.9 million, respectively. As both of the retirement plan’s investments are mutual funds, they fall within Level 1 in the fair value hierarchy.
U.K. Plans
A contributory defined benefit pension plan exists in the U.K., but has been closed to new entrants since 1996. The Scheme has approximately 110 members, of whom approximately 70 are active or deferred members of the Scheme. Benefits are based on length of service and compensation as defined in the Trust Deed and Rules, and the Plan is subject to triennial funding valuations, the most recent of which was conducted in 2009 and will be reported in 2010. Current contribution rates are 19.6% and 3% of pensionable salary for employer and employee respectively.
The U.K. pension plan assets are held in a separate Trustee administered fund to meet long term liabilities to past and present employees. The table below shows the composition of the Plan’s assets and the fair value of each major category of plan assets as of December 31, 2009 and 2008, as well as the potential returns of the different asset classes. The total of the asset values held in various externally managed portfolios are provided by third party pricing vendors. There is no significant concentration of risk within plan assets.
(U.S. dollars in thousands)
The assets in the scheme and the expected rates of return were as follows:
Expected Return on Assets for
2009
Value at December 31,
2009
Expected Return on Assets for
2008
Value at December 31,
2008 Equities ................................................................................................ 6.70% $ 3,774 7.70% $ 4,996 Gilts................................................................................................................................ 3.70% 1,951 4.70% 1,720 Corporate Bonds ................................................................................................ 6.50% 1,501 6.00% 1,693 Other (cash)................................................................................................ 2.00% 318 5.50% 451 Total market value of assets................................................................ $ 7,544 $ 8,860
In addition, during 2003 six members who are still employed by the Company in the U.K. transferred from a defined benefit plan into a defined contribution plan. These employees have a contractual agreement with the Company that provides a “no worse than final salary pension” guarantee in the event that they are employed by the Company until retirement, whereby the Company guarantees to top-up their defined
83
XL INSURANCE (BERMUDA) LTD
NOTES TO CONSOLIDATED FINANCIAL STATEMENTS (Continued) FOR THE YEARS ENDED DECEMBER 31, 2009 AND 2008
20. Retirement Plans (Continued)
Defined benefit plans (Continued)
contribution pension to the level of pension that they would have been entitled to receive had they remained in the defined benefit scheme. The pension liability recorded with respect to these individuals was $2.9 million and $2.6 million at December 31, 2009 and 2008, respectively, representing the entire unfunded projected obligation.
European Plans
Certain contributory defined benefit pension plans exist in several European countries, most notably Germany, which are closed to new entrants. Benefits are generally based on length of service and compensation defined in the related agreements. In relation to these defined benefit schemes, the total unfunded projected obligations recorded at December 31, 2009 and 2008 as included in the tables below, were $14.3 million and $10.7 million, respectively.
As a part of the purchase of GAPS, as described in Note 8, “Business Combinations,” the Company acquired certain defined benefit pension liabilities. The related balances are not included in the tables below as the liabilities are insured under an annuity type contract.
The status of the above mentioned plans at December 31, 2009 and 2008 is as follows:
(U.S. dollars in thousands) 2009 2008 Change in projected benefit obligation: Projected benefit obligation – beginning of year ................................................................................................ $ 54,134 $ 52,692 Service cost (1). ................................................................................................................................................... 977 1,212 Interest cost .......................................................................................................................................................... 2,980 3,032 Actuarial (gain) / loss. ................................................................................................................................ (1,210) 2,508 Benefits and expenses paid ................................................................................................................................ (1,359) (1,050) Foreign currency losses / (gains).......................................................................................................................... 1,476 (4,260) Projected benefit obligation – end of year. ................................................................................................ $ 56,998 $ 54,134
(1) Service costs include cost of living adjustments on curtailed plans. 2009 2008 Change in plan assets: Fair value of plan assets – beginning of year ................................................................................................ $ 20,917 $ 30,859 Actual return on plan assets ................................................................................................................................ 4,928 (6,121) Employer contributions................................................................................................................................ 5,600 1,637 Benefits and expenses paid ................................................................................................................................ (994) (750) Foreign currency gains (losses)............................................................................................................................ 803 (2,930) Actuarial (losses) / gains ................................................................................................................................ (1,706) - Other transfers to defined contribution plan................................................................................................ - (1,778) Fair value of plan assets – end of year ................................................................................................................. $ 29,548 $ 20,917 Funded status – end of year................................................................................................................................ $ (27,450) $ (33,217) Accrued pension liability ................................................................................................................................ $ 32,250 $ 28,026
84
XL INSURANCE (BERMUDA) LTD
NOTES TO CONSOLIDATED FINANCIAL STATEMENTS (Continued) FOR THE YEARS ENDED DECEMBER 31, 2009 AND 2008
20. Retirement Plans (Continued)
Defined benefit plans (Continued)
The components of the net benefit cost for the years ended December 31, 2009 and 2008 are as follows:
(U.S. dollars in thousands) 2009 2008 Components of net benefit cost: Service cost ............................................................................................................................................... $ 977 $ 1,212 Interest cost ............................................................................................................................................... 2,980 3,032 Expected return on plan assets .................................................................................................................. (1,610) (1,570) Amortization of net actuarial loss. ............................................................................................................ 131 125 Net benefit cost ......................................................................................................................................... $ 2,478 $ 2,799
21. Accumulated Other Comprehensive Income (Loss)
The related tax effects allocated to each component of the change in accumulated other comprehensive income (loss) were as follows:
Before Tax Tax (Benefit) Net of Tax (U.S. dollars in thousands) Amount Expense Amount Year Ended December 31, 2009: Unrealized gains on investments:
Unrealized gains arising during year. ................................................................ $ 1,250,328 $ 97,942 $ 1,152,386 Less reclassification for (losses) realized in income.............................................. (1,255,770) (32,050) (1,223,720)
Net unrealized gains on investments ......................................................................... 2,506,098 129,992 2,376,106 Change in net unrealized gain on future policy benefit reserves............................... 5,382 — 5,382 Additional pension liability. ...................................................................................... (2,255) — (2,255) Foreign currency translation adjustments ................................................................ 169,263 (11,627) 180,890 Change in accumulated other comprehensive income .............................................. $ 2,678,488 $ 118,365 $ 2,560,123 Year Ended December 31, 2008: Unrealized (losses) on investments:
Unrealized (losses) arising during year. ................................................................ $ (3,878,772) $ (87,957) $ (3,790,815) Less reclassification for (losses) realized in income.............................................. (917,304) (12,772) (904,532)
Net unrealized (losses) on investments ................................................................ (2,961,468) (75,185) (2,886,283) Change in net unrealized gain on future policy benefit reserves............................... (6,412) — (6,412) Additional pension liability. ...................................................................................... (2,710) — (2,710) Foreign currency translation adjustments ................................................................ (448,592) 17,799 (466,391) Change in accumulated other comprehensive income (loss)................................. $ (3,419,182) $ (57,386) $ (3,361,796)
85
XL INSURANCE (BERMUDA) LTD
NOTES TO CONSOLIDATED FINANCIAL STATEMENTS (Continued) FOR THE YEARS ENDED DECEMBER 31, 2009 AND 2008
22. Dividends
The company paid a dividend of $2,071.5 million in 2009, $394 million was cash, $1,046.6 million was investments and $630.9 million was reduction of inter company balances. The company paid a cash dividend of $90.0 million in 2008.
23. Taxation
The Company and its Bermuda subsidiaries are not subject to any income, withholding or capital gains taxes under current Bermuda law. In the event that there is a change such that these taxes are imposed, the Company and its Bermuda subsidiaries would be exempted from any such tax until March 2016 pursuant to the Bermuda Exempted Undertakings Tax Protection Act of 1966, and Amended Act of 1987.
The Company’s Indian subsidiary is not subject to certain income and capital gains taxes under current Indian law. Following a change in the law this subsidiary is exempt from these taxes for a further year until March 31, 2011 pursuant to the Income Tax Act 1961. The subsidiary is subject to a Minimum Alternative Tax as of April 1, 2007.
The Company’s U.S. subsidiaries are subject to federal, state and local corporate income taxes and other taxes applicable to U.S. corporations. The provision for federal income taxes has been determined under the principles of the consolidated tax provisions of the Internal Revenue Code and Regulations thereunder. Should the U.S. subsidiaries pay a dividend to the Company, withholding taxes will apply.
The Company has operations in subsidiary and branch form in various other jurisdictions around the world, including but not limited to the U.K., Switzerland, Ireland, Germany, France, India, and various countries in Latin America that are subject to relevant taxes in those jurisdictions.
Deferred income taxes have not been accrued with respect to certain undistributed earnings of foreign subsidiaries. If the earnings were to be distributed, as dividends or otherwise, such amounts may be subject to withholding taxation in the state of the paying entity. Currently however, no withholding taxes are accrued with respect to the earnings, as it is the intention that such earnings will remain reinvested indefinitely. The company has a 50% interest in an affiliate, the undistributed earnings of which are recognized for deferred tax as earned.
The Company adopted the provisions of the final authoritative guidance on accounting for uncertainty in income taxes, on January 1, 2007. The Company did not recognize any liabilities for unrecognized tax benefits as a result of its implementation. The Company has open examinations by tax authorities in Germany, the U.K. and the U.S. The years under review are 2001 to 2005, 2007, and 2006 to 2008, respectively. The Company believes that these examinations will be concluded within the next 24 months; however, it is not currently possible to estimate the outcome of these examinations.
The Company has open tax years, that are potentially subject to examinations by local tax authorities, in the following major tax jurisdictions, the U.S. 2009, the U.K. 2008 to 2009, Switzerland 2007 to 2009; Ireland 2005 to 2009, Germany 2006 to 2009 and France 2007 to 2009.
The Company’s policy is to recognize any interest accrued related to unrecognized tax benefits as a component of interest expense and penalties in the tax charge. At December 31, 2009 and 2008, the Company had accrued liabilities, relating to interest and penalties of nil and $1.0 million, respectively.
86
XL INSURANCE (BERMUDA) LTD
NOTES TO CONSOLIDATED FINANCIAL STATEMENTS (Continued) FOR THE YEARS ENDED DECEMBER 31, 2009 AND 2008
23. Taxation (Continued)
The income tax provisions for the years ended December 31, 2009 and 2008 are as follows: Year Ended December 31 (U.S. dollars in thousands) 2009 2008 Current expense:
U.S......................................................................................................................... $ 29,112 $ 118,411 Non U.S ................................................................................................................. 90,079 71,343
Total current expense ............................................................................................. $ 119,191 $ 189,754 Deferred expense (benefit):
U.S......................................................................................................................... $ (4,604) $ (8,534) Non U.S ................................................................................................................. (62) 41,358
Total deferred expense (benefit) ............................................................................ $ (4,666) $ 32,824 Total Tax Expense ............................................................................................... $ 114,525 $ 222,578
The weighted average expected tax provision has been calculated using the pre-tax accounting income (loss) in each jurisdiction multiplied by that jurisdiction’s applicable statutory tax rate. The applicable statutory tax rates of the most significant jurisdictions contributing to the overall taxation of the Company are, Cayman Islands and Bermuda 0%, the U.S. 35%, the U.K 28%, Switzerland 8.5%, Ireland 12.5%, Germany 15%, and France 34.43%. Reconciliation of the difference between the provision for income taxes and the expected tax provision at the weighted average tax rate for the years ended December 31, 2009 and 2008 is provided below: (U.S. dollars in thousands) 2009 2008 Expected tax provision at weighted average rate ...................................................... $ 123,354 $ 6,835 Permanent differences: Non taxable investment income ................................................................................ (5,715) (3,568)
Non taxable income ............................................................................................... (91,968) (15,095) Prior year adjustments ........................................................................................... (15,360) (13,317) State, local and foreign taxes ................................................................................. 59,835 54,622 Valuation allowance .............................................................................................. 11,439 192,703 Allocated investment income ................................................................................ 20,045 (20,597) Stock options ......................................................................................................... 6,222 3,401 Non deductible expenses ....................................................................................... 6,673 17,594
Total tax expense ..................................................................................................... $ 114,525 $ 222,578

87
XL INSURANCE (BERMUDA) LTD
NOTES TO CONSOLIDATED FINANCIAL STATEMENTS (Continued) FOR THE YEARS ENDED DECEMBER 31, 2009 AND 2008
23. Taxation (Continued)
Significant components of the Company’s deferred tax assets and liabilities as of December 31, 2009 and 2008 were as follows: (U.S. dollars in thousands) 2009 2008 Deferred Tax Asset:
Net unpaid loss reserve discount ................................................................................................ $ 102,657 $ 100,815 Net unearned premiums......................................................................................................................... 45,786 50,898 Compensation liabilities ........................................................................................................................ 48,904 46,649 Net operating losses............................................................................................................................... 314,026 317,354 Investment adjustments ......................................................................................................................... 18,300 10,411 Deferred commission............................................................................................................................. - 4,237 Pension .................................................................................................................................................. 6,356 7,079 Bad debt reserve ................................................................................................................................ 1,483 3,622 Guarantee fund recoupment................................................................................................................... 4,346 3,008 Currency translation adjustments................................................................................................ - 2,440 Untaxed Lloyd’s result .......................................................................................................................... 12,772 - Net unrealized depreciation on investments .......................................................................................... 18,972 142,314 Stock options ................................................................................................................................ 12,519 5,339 Depreciation ................................................................................................................................ 16,680 23,708 Net unrealized capital losses.................................................................................................................. 32,289 84,000 Net realized capital losses...................................................................................................................... 86,440 1,113 Deferred intercompany capital losses ................................................................................................ 168,700 195,195 Other ...................................................................................................................................................... 23,325 16,969 Deferred tax asset, gross of valuation allowance................................................................................... $ 913,555 $ 1,015,151 Valuation allowance .............................................................................................................................. 517,582 551,653 Deferred tax asset, net of valuation allowance ...................................................................................... $ 395,973 $ 463,498
Deferred Tax Liability: Net unrealized appreciation on investments .......................................................................................... 51,764 11,627 Unremitted earnings .............................................................................................................................. 1,015 524 Deferred acquisition costs...................................................................................................................... 14,651 11,057 Currency translation adjustments................................................................................................ 9,407 - Deferred gain on investments ................................................................................................................ 1,613 12,574 Regulatory reserves ............................................................................................................................... 127,186 87,282 Untaxed Lloyd’s result .......................................................................................................................... - 16,009 Other ...................................................................................................................................................... 221 2,610 Deferred tax liability.............................................................................................................................. $ 205,857 $ 141,683
Net Deferred Tax Asset........................................................................................................................... $ 190,116 $ 321,815
The valuation allowance at December 31, 2009 and December 31, 2008 of $517.6 million and $551.7 million, respectively, related primarily to net operating loss carry forwards in Switzerland and net unrealized capital losses and realized capital loss carry forwards in the U.S. that may not be realized within a reasonable period. As of December 31, 2009, the Company had net unrealized capital losses and realized capital loss carry forwards of approximately $92.2 million and $749.9 million respectively in the U.S., against which a valuation allowance of approximately $294.7 million had been established. Included within the capitalized realized losses are $482.0 million of losses arising from the sale of investments to a group company, against which a valuation allowance of $168.7 million has been established. These losses cannot be utilized to offset any future U.S. realized capital gains until the underlying assets have been sold to unrelated parties. Management believes it is more likely than not that the tax benefit of the remaining net deferred tax assets will be realized.
88
XL INSURANCE (BERMUDA) LTD
NOTES TO CONSOLIDATED FINANCIAL STATEMENTS (Continued) FOR THE YEARS ENDED DECEMBER 31, 2009 AND 2008
23. Taxation (Continued)
As of December 31, 2009, net operating loss carry forwards in the U.K. were approximately $166.6 million and have no expiration. As of December 31, 2009, net operating loss carry forwards in Switzerland were approximately $980.1 million and will expire in future years through 2015.
Management has reviewed historical taxable income and future taxable income projections for its U.K. group and has determined that in its judgment, the net operating losses will more likely than not be realized as reductions of future taxable income within a reasonable period. Specifically with regard to the U.K. group, management has determined that the projected U.K. group taxable income (using U.K. rules for group loss relief) will be sufficient to utilize the net operating losses of approximately $166.6 million. Management will continue to evaluate income generated in future periods by the U.K. group in determining the reasonableness of its position. If management determines that future income generated by the U.K. group is insufficient to cause the realization of the net operating losses within a reasonable period, a valuation allowance would be required for the U.K. portion of the net deferred tax asset, in the amount of $46.6 million.
Shareholder’s equity at December 31, 2009 and 2008 reflected tax benefits of nil million and $1.1 million, respectively, related to compensation expense deductions for stock options exercised by employees of the Company’s U.S. subsidiaries.
24. Statutory Financial Data
The Company’s ability to pay dividends is subject to certain regulatory restrictions on the payment of dividends by its subsidiaries. The payment of such dividends is limited by applicable laws and statutory requirements of the various countries in which the Company operates, including Bermuda, the U.S., Ireland and the U.K., among others. Statutory capital and surplus for the principal operating subsidiaries of the Company for the years ended December 31, 2009 and 2008 are summarized below. 2009 information is preliminary as many regulatory returns are due later in 2010 for many jurisdictions in which the Company does business. Bermuda (3) U.S. (1) U.K., Europe and Other (U.S. dollars in thousands) 2009 2008 2009 2008 2009 2008 Required statutory capital and
surplus ................................... $ 4,714,421 $ 5,083,385 $ 641,160 $ 608,128 $ 1,274,212 $ 903,830 Actual statutory capital and
surplus(2)............................... $ 8,541,341 $ 10,645,196 $ 2,191,298 $ 2,319,107 $ 3,044,703 $ 2,805,418
(1) Required statutory capital and surplus represents 100% RBC level for principle U.S. operating subsidiaries.
(2) Statutory assets in Bermuda include investments in other U.S. and international subsidiaries reported separately herein.
(3) Required statutory capital and surplus represents 100% BSCR level for principle Bermuda operating subsidiaries.
The difference between statutory financial statements and statements prepared in accordance with GAAP varies by jurisdiction however the primary difference is that statutory financial statements do not reflect deferred policy acquisition costs, deferred income tax net assets, intangible assets, unrealized appreciation on investments and any unauthorized/authorized reinsurance charges.
Certain statutory restrictions on the payment of dividends from retained earnings by the Company’s subsidiaries are further detailed below.
Management has evaluated the principal operating subsidiaries’ ability to maintain adequate levels of statutory capital, liquidity and rating agency capital and believes they will be able to do so. In performing this analysis, management has considered the current statutory capital position of each of the principal operating subsidiaries as well as the ability of the holding company to allocate capital and liquidity around the group as and when needed.
89
XL INSURANCE (BERMUDA) LTD
NOTES TO CONSOLIDATED FINANCIAL STATEMENTS (Continued) FOR THE YEARS ENDED DECEMBER 31, 2009 AND 2008
24. Statutory Financial Data (Continued)
Bermuda Operations
In early July, the Insurance Amendment Act of 2008 was passed, which introduced a number of changes to the Bermuda Insurance Act 1978, such as allowing the Bermuda Monetary Authority (BMA) to prescribe standards for an enhanced capital requirement and a capital and solvency return that insurers and reinsurers must comply with. The Bermuda Solvency Capital Requirement (BSCR) employs a standard mathematical model that can relate more accurately the risks taken on by (re)insurers to the capital that is dedicated to their business. (Re)insurers may adopt the BSCR model or, where an insurer or reinsurer believes that its own internal model better reflects the inherent risk of its business, an in-house model approved by the BMA. Class 4 (re)insurers, such as the Company, were required to implement the new capital requirements under the BSCR model beginning with fiscal years ending on or after December 31, 2009. The Company’s capital requirements under the BSCR are highlighted in the table above. In addition to the BSCR based requirements, the BMA also prescribes minimum liquidity standards which must be met.
Under the Insurance Act 1978, amendments thereto and related regulations of Bermuda, the Company’s Bermuda subsidiaries, XL Re Ltd and XL Insurance (Bermuda) Ltd. are prohibited from declaring or paying dividends of more than 25% of each of their prior year’s statutory capital and surplus unless the Company filed with the Bermuda Monetary Authority a signed affidavit by at least two members of the Company’s Board of Directors and the Company’s Principal Representative attesting that a dividend in excess of this amount would not cause the company to fail to meet its relevant margins is required. At December 31, 2009 and 2008, the maximum dividend that the Bermuda operating entities could pay, without a signed affidavit, having met minimum levels of statutory capital and surplus and liquidity requirements, was approximately $1.3 billion and $2.4 billion, respectively.
U.S. Property and Casualty Operations
Unless permitted by the New York Superintendent of Insurance, the Company’s lead property and casualty subsidiary in the United States (“XLRA”) may not pay dividends to shareholders which in any twelve month period exceeds the lesser of 10 percent of XLRA’s statutory policyholders’ surplus or 100 percent of its “adjusted net investment income,” as defined. The New York State insurance law also provides that any distribution that is a dividend may only be paid out of statutory earned surplus. At December 31, 2009, and 2008, XLRA had statutory earned surplus of $126.0 million and $287.8 million, respectively. At December 31, 2009, XLRA’s statutory policyholders’ surplus was $2.2 billion, and accordingly, the maximum amount of dividends XLRA can declare and pay in 2009, without prior regulatory approval, is $126.0 million. One of the seven property and casualty subsidiaries directly or indirectly owned by XLRA had a statutory earned deficit of $3.4 million and $5.8 million at December 31, 2009 and December 31, 2008, respectively.
International Operations
The Company’s international subsidiaries prepare statutory financial statements based on local laws and regulations. Some jurisdictions impose complex regulatory requirements on insurance companies while other jurisdictions impose fewer requirements. In some countries, the Company must obtain licenses issued by governmental authorities to conduct local insurance business. These licenses may be subject to reserves and minimum capital and solvency tests. Jurisdictions may impose fines, censure, and/or impose criminal sanctions for violation of regulatory requirements. The majority of the actual statutory capital outside of the U.S. and Bermuda is held in Ireland $1.8 billion and the U.K. $1.1 billion. Dividends from the U.K. and Ireland are limited to the equivalent of retained earnings. As a part of the restructuring that established XL Re (Europe), the Company is required to notify the regulator in order to reduce capital levels below $1.5 billion in Ireland.

90
XL INSURANCE (BERMUDA) LTD
NOTES TO CONSOLIDATED FINANCIAL STATEMENTS (Continued) FOR THE YEARS ENDED DECEMBER 31, 2009 AND 2008
25. Related Party Transactions
For detailed information regarding the Company’s transactions with Syncora see Note 4 “Syncora Holdings Ltd.”
At both December 31, 2009 and 2008, the Company owned minority stakes in nine independent investment management companies (“Investment Manager Affiliates”). The Company sought to develop relationships with specialty investment management organizations, generally acquiring an equity interest in the business. The Company also invests in certain of the funds and limited partnerships and other legal entities managed by these affiliates and through these funds and partnerships pay management and performance fees to the Company’s Investment Manager Affiliates.
In the normal course of business, the Company enters into certain quota share reinsurance contracts with a subsidiary of one of its other strategic affiliates, ARX Holding Corporation. During the year ended December 31, 2009, these contracts resulted in reported net premiums written of $44.1 million, net paid claims of $20.0 million and reported acquisition costs of $19.1 million. During the year ended December 31, 2008, these contracts resulted in reported net premiums written of $60.1 million, net paid claims of $30.0 million and reported acquisition costs of $37.2 million. During the year ended December 31, 2007, these contracts resulted in reported net premiums written of $100.7 million, net paid claims of $29.7 million and reported acquisition costs of $52.9 million Management believes that these transactions are conducted at market rates consistent with negotiated arms-length contracts.
In addition, the Company has entered into a reinsurance contract with another strategic affiliate, ITAÙ XL Seguros Corporativos S.A. The reinsurance contract resulted in reported net premiums of approximately $3.1 million, loss reserves of $1.2 million, and reported acquisition costs of $1.4 million during the year ended December 31, 2009, while in 2008, the same reinsurance contract resulted in reported net premiums of approximately $3.2 million, loss reserves of nil million, and reported acquisition costs of $0.2 million during the year ended December 31, 2008, and approximately $0.3 million, loss reserves of nil million, and reported acquisition costs of $0.1 million during the year ended December 31, 2007.
In the normal course of business, the Company enters into cost sharing and service level agreement transactions with certain other strategic affiliates, which management believes to be conducted consistent with arms-length rates. Such transactions, individually and in the aggregate, are not material to the Company’s financial condition, results of operations and cash flows.
Affiliate balances payable and receivable are in respect of amounts due to and from companies within the XL Capital Group. The balances arise as a result of the Company’s operating and investing activities. All amounts are due on demand and are non interest bearing. The net inter-company receivable as at December 31, 2009 was $359.7 million (2008: $2,426.9 million).
During 2009, the company received a net $1,436.6 million from its ultimate parent company, reducing the inter-company
balance receivable from that entity as at December 31, 2009 to $143.6 million (2008: $1,580.2 million). The company has an inter-company balance receivable from its immediate parent company of $97.7 million as at December 31, 2008 (2008: $732.5 million).
91
XL INSURANCE (BERMUDA) LTD
NOTES TO CONSOLIDATED FINANCIAL STATEMENTS (Continued) FOR THE YEARS ENDED DECEMBER 31, 2009 AND 2008
26. XL Capital Finance (Europe) plc
XL Capital Finance (Europe) plc (“XLFE”) is a wholly owned finance subsidiary of the Company. In January 2002, XLFE issued $600 million par value 6.5% Guaranteed Senior Notes due January 2012. These notes are fully and unconditionally guaranteed by the Company. The Company’s ability to obtain funds from its subsidiaries to satisfy any of its obligations under this guarantee is subject to certain contractual restrictions, applicable laws and statutory requirements of the various countries in which the Company operates including among others, Bermuda, the U.S., Ireland and the U.K. Required statutory capital and surplus for the principal operating subsidiaries of the Company was $7.0 billion as of December 31, 2009.
27. Subsequent Events On February 27, 2010 a magnitude 8.8 earthquake occurred in Chile and on February 27 and 28, 2010 a powerful Atlantic
storm battered western Europe. The Company’s preliminary loss estimate related to these events, net of reinsurance and reinstatement premium, range from $140m to $205m and $20m to $25m, respectively. The Company’s estimate is based on its review of individual treaties and policies expected to be impacted and client data received to date and has taken into account current total insured market loss estimates, both from published sources and the Company’s internal analysis. Given there is currently a wide range of estimates for the extent of total economic and insured industry losses, the Company’s loss estimate involves the exercise of considerable judgment and is accordingly subject to revision as additional information becomes available. Actual losses may differ materially from this preliminary estimate.