consolidated financial statements year ended 31 december 2017
TRANSCRIPT
Consolidated Financial Statements
Year Ended 31 December 2017
(Expressed in Canadian Dollars)
New Zealand Energy Corp. Year ended 31 December 2017
2
MANAGEMENT’S REPORT
Management of New Zealand Energy Corp. (the “Company”) is responsible for the reliability and integrity of the consolidated
financial statements, and the notes to the consolidated financial statements.
The consolidated financial statements were prepared by management in accordance with International Financial Reporting
Standards as issued by the International Accounting Standards Board. Since a precise determination of many assets and
liabilities is dependent on future events, the timely preparation of financial statements requires management to make estimates
and assumptions and use judgment. When alternate accounting methods exist, management has chosen those it deems most
appropriate in the circumstances.
PricewaterhouseCoopers, an independent firm of Chartered Accountants, were appointed by shareholders as the external
auditor of the Company to express an audit opinion on the consolidated financial statements. Their examination included such
tests and procedures as they considered necessary to provide reasonable assurance the consolidated financial statements are
in accordance with International Financial Reporting Standards.
The Board of Directors is responsible for ensuring management fulfils its responsibilities for financial reporting and internal
control. The Board exercises this responsibility through the Audit Committee. The Audit Committee recommends appointment
of the external auditors to the Board, ensures their independence and approves their fees. The Audit Committee meets regularly
with management and the external auditors to ensure management’s responsibilities are properly discharged, to review the
consolidated financial statements and recommend the consolidated financial statements be presented to the Board for approval.
The external auditors have full and unrestricted access to the Audit Committee to discuss their audit and their findings.
“Michael Adams” “Derek Gardiner” Michael Adams, Chief Executive Officer Derek Gardiner, Chief Financial Officer
PricewaterhouseCoopers, 113-119 The Terrace, PO Box 243, Wellington 6140, New ZealandT: +64 4 462 7000, F: +64 4 462 7001, pwc.co.nz
30 April 2018
Independent Auditor’s Report
To the Shareholders of New Zealand Energy Corp.
We have audited the accompanying consolidated financial statements of New Zealand Energy Corp. andits subsidiaries, which comprise the consolidated balance sheets as at 31 December 2017 and 31 December2016 and the consolidated statement of changes in equity, consolidated statement of comprehensive lossand consolidated statement cash flows for the years then ended, and the related notes, which comprise asummary of significant accounting policies and other explanatory information.
Management’s responsibility for the consolidated financial statementsManagement is responsible for the preparation and fair presentation of these consolidated financialstatements in accordance with International Financial Reporting Standards, and for such internal controlas management determines is necessary to enable the preparation of consolidated financial statementsthat are free from material misstatement, whether due to fraud or error.
Auditor’s responsibilityOur responsibility is to express an opinion on these consolidated financial statements based on our audits.We conducted our audits in accordance with Canadian generally accepted auditing standards. Thosestandards require that we comply with ethical requirements and plan and perform the audit to obtainreasonable assurance about whether the consolidated financial statements are free from materialmisstatement.
An audit involves performing procedures to obtain audit evidence about the amounts and disclosures inthe consolidated financial statements. The procedures selected depend on the auditor’s judgment,including the assessment of the risks of material misstatement of the consolidated financial statements,whether due to fraud or error. In making those risk assessments, the auditor considers internal controlrelevant to the entity’s preparation and fair presentation of the consolidated financial statements in orderto design audit procedures that are appropriate in the circumstances, but not for the purpose of expressingan opinion on the effectiveness of the entity’s internal control. An audit also includes evaluating theappropriateness of accounting policies used and the reasonableness of accounting estimates made bymanagement, as well as evaluating the overall presentation of the consolidated financial statements.
We believe that the audit evidence we have obtained in our audits is sufficient and appropriate to provide abasis for our audit opinion.
PwC
OpinionIn our opinion, the consolidated financial statements present fairly, in all material respects, the financialposition of New Zealand Energy Corp. and its subsidiaries as at 31 December 2017 and 31 December 2016and its financial performance and its cash flows for the years then ended in accordance with InternationalFinancial Reporting Standards.
Emphasis of matterWithout qualifying our opinion, we draw attention to note 1 to the financial statements which indicatesthat the Company’s ability to continue as a going concern is dependent upon its ability to expand thefinancial capacity of the Company. This condition, along with other matters as set forth in note 1, indicatethe existence of a material uncertainty that may cast significant doubt about the Group’s ability tocontinue as a going concern and therefore, the Group may be unable to realise its assets and discharge itsliabilities in the normal course of business.
(signed) “PricewaterhouseCoopers”
Chartered Accountants Wellington, New Zealand30 April 2018
New Zealand Energy Corp. Year ended 31 December 2017
5
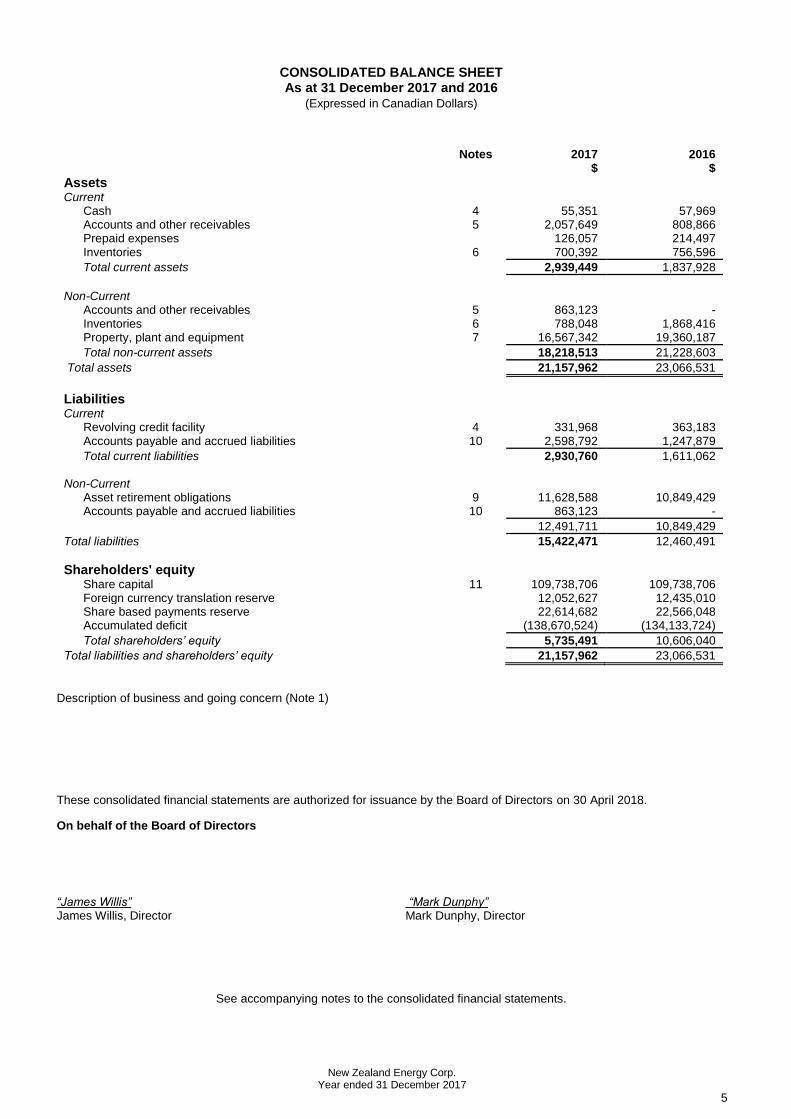
CONSOLIDATED BALANCE SHEET As at 31 December 2017 and 2016
(Expressed in Canadian Dollars)
Notes 2017 2016
$ $
Assets
Current Cash 4 55,351 57,969 Accounts and other receivables 5 2,057,649 808,866 Prepaid expenses 126,057 214,497 Inventories 6 700,392 756,596
Total current assets 2,939,449 1,837,928
Non-Current Accounts and other receivables 5 863,123 - Inventories 6 788,048 1,868,416 Property, plant and equipment 7 16,567,342 19,360,187
Total non-current assets 18,218,513 21,228,603
Total assets 21,157,962 23,066,531
Liabilities
Current Revolving credit facility 4 331,968 363,183 Accounts payable and accrued liabilities 10 2,598,792 1,247,879
Total current liabilities 2,930,760 1,611,062 Non-Current
Asset retirement obligations 9 11,628,588 10,849,429 Accounts payable and accrued liabilities 10 863,123 -
12,491,711 10,849,429
Total liabilities 15,422,471 12,460,491
Shareholders' equity
Share capital 11 109,738,706 109,738,706 Foreign currency translation reserve 12,052,627 12,435,010 Share based payments reserve 22,614,682 22,566,048 Accumulated deficit (138,670,524) (134,133,724)
Total shareholders’ equity 5,735,491 10,606,040
Total liabilities and shareholders’ equity 21,157,962 23,066,531
Description of business and going concern (Note 1)
These consolidated financial statements are authorized for issuance by the Board of Directors on 30 April 2018.
On behalf of the Board of Directors
“James Willis” “Mark Dunphy” James Willis, Director Mark Dunphy, Director
See accompanying notes to the consolidated financial statements.
New Zealand Energy Corp. Year ended 31 December 2017
6
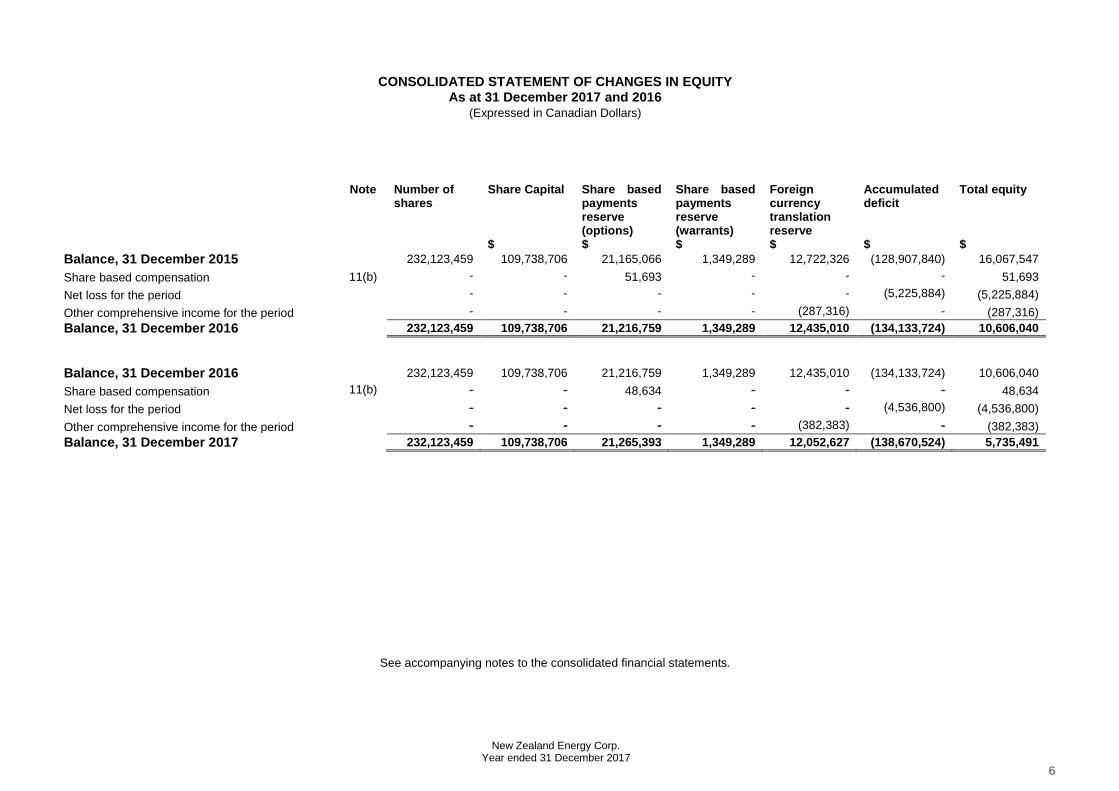
CONSOLIDATED STATEMENT OF CHANGES IN EQUITY As at 31 December 2017 and 2016
(Expressed in Canadian Dollars)
Note Number of shares
Share Capital Share based payments reserve (options)
Share based payments reserve (warrants)
Foreign currency translation reserve
Accumulated deficit
Total equity
$ $ $ $ $ $
Balance, 31 December 2015 232,123,459 109,738,706 21,165,066 1,349,289 12,722,326 (128,907,840) 16,067,547
Share based compensation 11(b) - - 51,693 - - - 51,693
Net loss for the period - - - - - (5,225,884) (5,225,884)
Other comprehensive income for the period - - - - (287,316) - (287,316)
Balance, 31 December 2016 232,123,459 109,738,706 21,216,759 1,349,289 12,435,010 (134,133,724) 10,606,040
Balance, 31 December 2016 232,123,459 109,738,706 21,216,759 1,349,289 12,435,010 (134,133,724) 10,606,040
Share based compensation 11(b) - - 48,634 - - - 48,634
Net loss for the period - - - - - (4,536,800) (4,536,800)
Other comprehensive income for the period - - - - (382,383) - (382,383)
Balance, 31 December 2017 232,123,459 109,738,706 21,265,393 1,349,289 12,052,627 (138,670,524) 5,735,491
See accompanying notes to the consolidated financial statements.
New Zealand Energy Corp. Year ended 31 December 2017
7
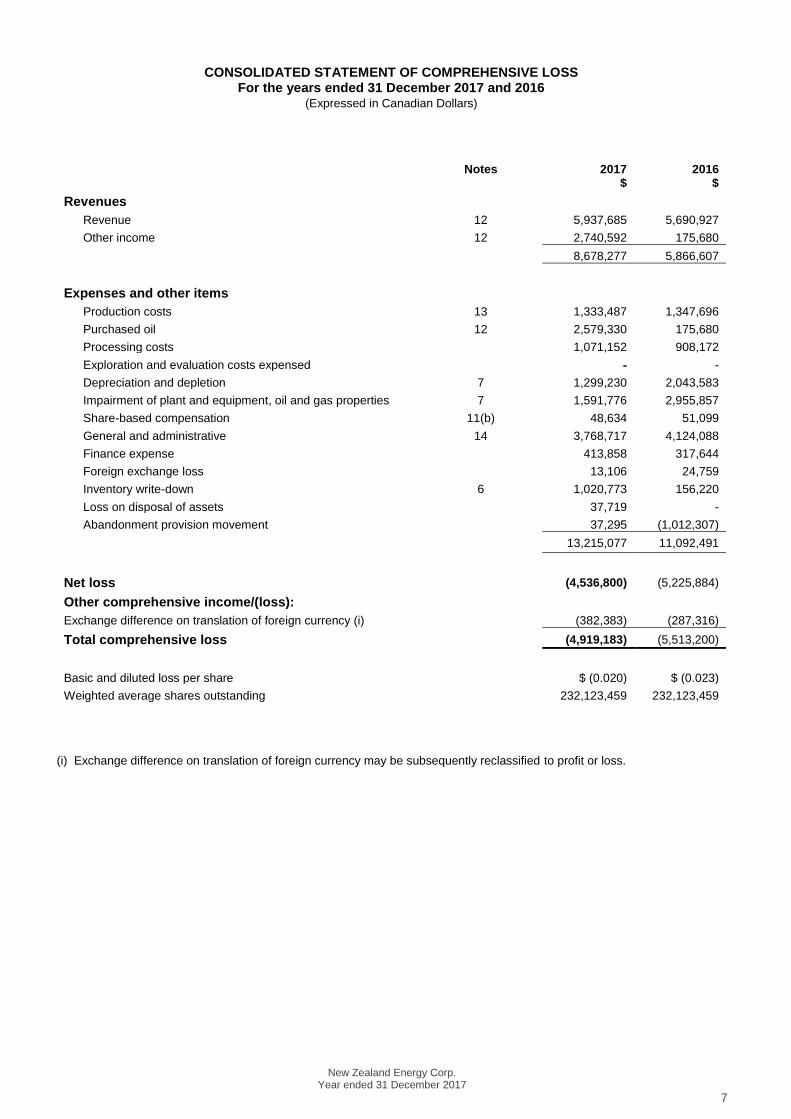
CONSOLIDATED STATEMENT OF COMPREHENSIVE LOSS For the years ended 31 December 2017 and 2016
(Expressed in Canadian Dollars)
Notes 2017 2016 $ $
Revenues
Revenue 12 5,937,685 5,690,927
Other income 12 2,740,592 175,680
8,678,277 5,866,607
Expenses and other items
Production costs 13 1,333,487 1,347,696
Purchased oil 12 2,579,330 175,680
Processing costs 1,071,152 908,172
Exploration and evaluation costs expensed - -
Depreciation and depletion 7 1,299,230 2,043,583
Impairment of plant and equipment, oil and gas properties 7 1,591,776 2,955,857
Share-based compensation 11(b) 48,634 51,099
General and administrative 14 3,768,717 4,124,088
Finance expense 413,858 317,644
Foreign exchange loss 13,106 24,759
Inventory write-down 6 1,020,773 156,220
Loss on disposal of assets 37,719 -
Abandonment provision movement 37,295 (1,012,307)
13,215,077 11,092,491
Net loss (4,536,800) (5,225,884)
Other comprehensive income/(loss):
Exchange difference on translation of foreign currency (i) (382,383) (287,316)
Total comprehensive loss (4,919,183) (5,513,200)
Basic and diluted loss per share $ (0.020) $ (0.023)
Weighted average shares outstanding 232,123,459 232,123,459
(i) Exchange difference on translation of foreign currency may be subsequently reclassified to profit or loss.
New Zealand Energy Corp. Year ended 31 December 2017
8
See accompanying notes to the consolidated financial statements.
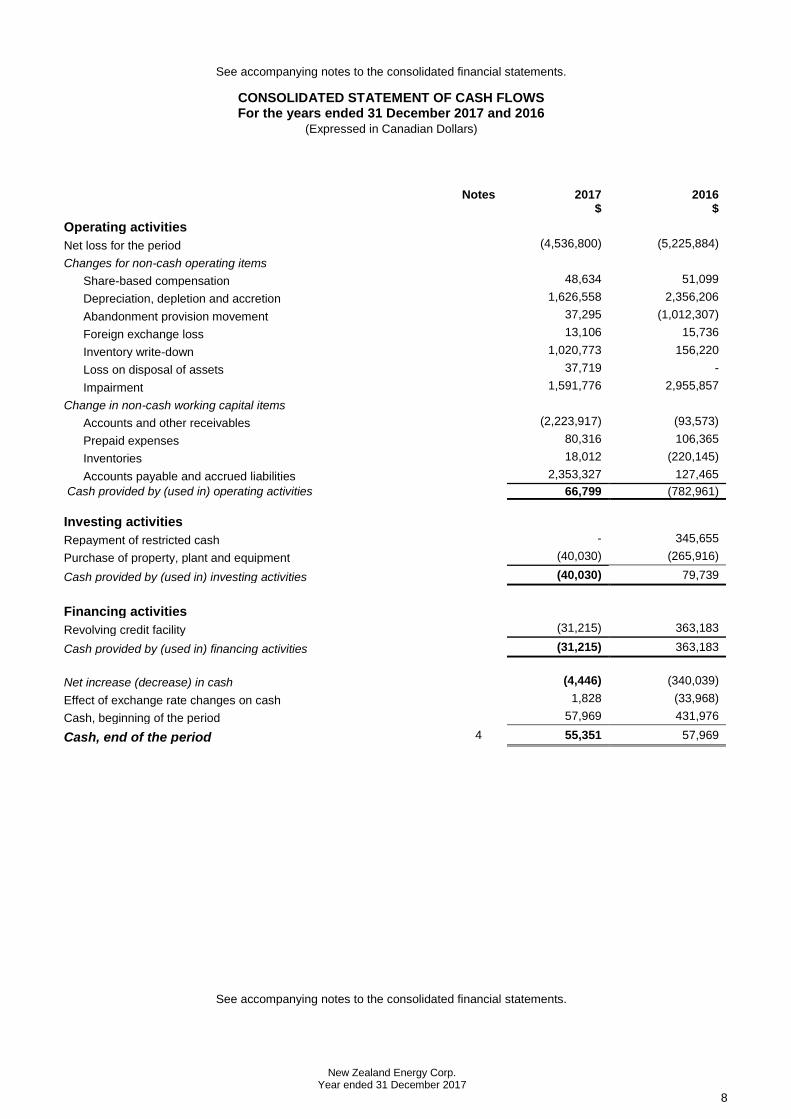
CONSOLIDATED STATEMENT OF CASH FLOWS For the years ended 31 December 2017 and 2016
(Expressed in Canadian Dollars)
Notes 2017 2016
$ $
Operating activities
Net loss for the period (4,536,800) (5,225,884)
Changes for non-cash operating items
Share-based compensation 48,634 51,099
Depreciation, depletion and accretion 1,626,558 2,356,206
Abandonment provision movement 37,295 (1,012,307)
Foreign exchange loss 13,106 15,736
Inventory write-down 1,020,773 156,220
Loss on disposal of assets 37,719 -
Impairment 1,591,776 2,955,857
Change in non-cash working capital items
Accounts and other receivables (2,223,917) (93,573)
Prepaid expenses 80,316 106,365
Inventories 18,012 (220,145)
Accounts payable and accrued liabilities 2,353,327 127,465
Cash provided by (used in) operating activities 66,799 (782,961)
Investing activities
Repayment of restricted cash - 345,655
Purchase of property, plant and equipment (40,030) (265,916)
Cash provided by (used in) investing activities (40,030) 79,739
Financing activities
Revolving credit facility (31,215) 363,183
Cash provided by (used in) financing activities (31,215) 363,183
Net increase (decrease) in cash (4,446) (340,039)
Effect of exchange rate changes on cash 1,828 (33,968)
Cash, beginning of the period 57,969 431,976
Cash, end of the period 4 55,351 57,969
See accompanying notes to the consolidated financial statements.
NOTES TO THE CONSOLIDATED FINANCIAL STATEMENTS
31 December 2017 (Expressed in Canadian Dollars)
New Zealand Energy Corp. Year ended 31 December 2017
9
1. DESCRIPTION OF BUSINESS AND GOING CONCERN
New Zealand Energy Corp. (the “Company”) commenced operations on 19 April 2010 through wholly-owned subsidiary, East
Coast Energy Ventures Limited. The Company was subsequently incorporated on 29 October 2010 under the name 0894134
B.C. Ltd. pursuant to the Business Corporation Act (British Columbia). On 10 November 2010, 0894134 B.C. Ltd. changed its
name to New Zealand Energy Corp.
The Company, through its subsidiaries, is engaged in the exploration and production of oil and natural gas, as well as the
operation of midstream assets, in New Zealand.
The Company’s registered and records office is located at Suite 2800, Park Place, 666 Burrard St, Vancouver BC V6C 2Z7. The
Company’s principal place of business is 14 Connett Road, New Plymouth, New Zealand 4312.
The Company’s shares are listed on the TSX Venture Exchange under the symbol “NZ”.
Going Concern
While these consolidated financial statements have been prepared using International Financial Reporting Standards (“IFRS”)
applicable to a going concern, which contemplates the realization of assets and settlement of liabilities in the normal course of
business as they come due, material uncertainty exists related to certain conditions that may cast significant doubt on the validity
of this assumption. For the year ended 31 December 2017, the Group reported a Net Loss of $4,536,800 (2016: $5,225,884)
and a cash inflow from operating activities of $66,800 (2016: $(782,961)) and as at that date, the Group had working capital of
$8,689 (2016: $226,866). The Group also has several permit expenditure plans (Note 19) which are associated with the Group’s
interest in its oil and gas properties and exploration and evaluation assets.
The Group continues to pursue a number of options to improve its financial capacity, including cash flow from oil and gas
production (production has increased to >200b/d since March 2018), credit facilities, commercial arrangements or other financing
alternatives.
The Group’s ability to continue as a going concern is reliant upon its ability to retain financing facilities that are currently in place
and generate budgeted cash flows from operations which are reliant on achieving planned production levels and forecast oil
prices, all of which are uncertain.
These consolidated financial statements do not reflect adjustments to the carrying values of the assets and liabilities, the
reported revenues and expenses, and the balance sheet classifications used that would be necessary if the Group were unable
to realize its assets and settle its liabilities in the normal course of operations. Such adjustments could be material.
2. SUMMARY OF SIGNIFICANT ACCOUNTING POLICIES
Accounting policies specific to certain balances are described within the detailed note in the sections below.
General accounting policies adhered to in these financial statements are as follows:
Basis of Preparation
The consolidated financial statements have been prepared in accordance with IFRS as issued by the International Accounting
Standards Board (“IASB”).
These consolidated financial statements have been prepared on a historical cost basis except as disclosed in the accounting
policies. In addition, these consolidated financial statements have been prepared using the accrual basis of accounting except
for cash flow information.
Basis of Consolidation
The consolidated financial statements include the assets, liabilities, revenues and expenses of the Company and its subsidiaries.
Subsidiaries are all entities over which the Company is able to exercise control. Control exists when the Company has the
power, directly or indirectly, to govern the financial and operating policies of an entity so as to obtain benefits from its activities.
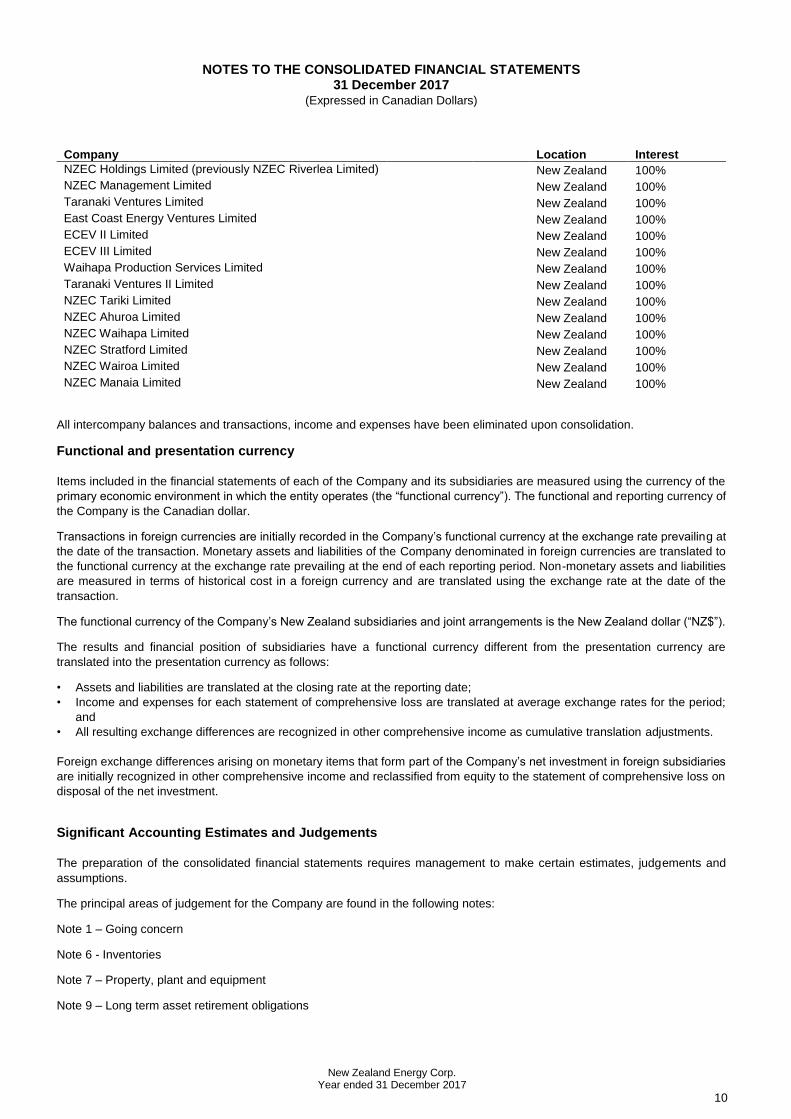
The subsidiaries of the Company are as follows:
NOTES TO THE CONSOLIDATED FINANCIAL STATEMENTS
31 December 2017 (Expressed in Canadian Dollars)
New Zealand Energy Corp. Year ended 31 December 2017
10
Company Location Interest
NZEC Holdings Limited (previously NZEC Riverlea Limited) New Zealand 100%
NZEC Management Limited New Zealand 100%
Taranaki Ventures Limited New Zealand 100%
East Coast Energy Ventures Limited New Zealand 100%
ECEV II Limited New Zealand 100%
ECEV III Limited New Zealand 100%
Waihapa Production Services Limited New Zealand 100%
Taranaki Ventures II Limited New Zealand 100%
NZEC Tariki Limited New Zealand 100%
NZEC Ahuroa Limited New Zealand 100%
NZEC Waihapa Limited New Zealand 100%
NZEC Stratford Limited New Zealand 100%
NZEC Wairoa Limited New Zealand 100%
NZEC Manaia Limited New Zealand 100%
All intercompany balances and transactions, income and expenses have been eliminated upon consolidation.
Functional and presentation currency
Items included in the financial statements of each of the Company and its subsidiaries are measured using the currency of the
primary economic environment in which the entity operates (the “functional currency”). The functional and reporting currency of
the Company is the Canadian dollar.
Transactions in foreign currencies are initially recorded in the Company’s functional currency at the exchange rate prevailing at
the date of the transaction. Monetary assets and liabilities of the Company denominated in foreign currencies are translated to
the functional currency at the exchange rate prevailing at the end of each reporting period. Non-monetary assets and liabilities
are measured in terms of historical cost in a foreign currency and are translated using the exchange rate at the date of the
transaction.
The functional currency of the Company’s New Zealand subsidiaries and joint arrangements is the New Zealand dollar (“NZ$”).
The results and financial position of subsidiaries have a functional currency different from the presentation currency are
translated into the presentation currency as follows:
• Assets and liabilities are translated at the closing rate at the reporting date;
• Income and expenses for each statement of comprehensive loss are translated at average exchange rates for the period;
and
• All resulting exchange differences are recognized in other comprehensive income as cumulative translation adjustments.
Foreign exchange differences arising on monetary items that form part of the Company’s net investment in foreign subsidiaries
are initially recognized in other comprehensive income and reclassified from equity to the statement of comprehensive loss on
disposal of the net investment.
Significant Accounting Estimates and Judgements
The preparation of the consolidated financial statements requires management to make certain estimates, judgements and
assumptions.
The principal areas of judgement for the Company are found in the following notes:
Note 1 – Going concern
Note 6 - Inventories
Note 7 – Property, plant and equipment
Note 9 – Long term asset retirement obligations
NOTES TO THE CONSOLIDATED FINANCIAL STATEMENTS
31 December 2017 (Expressed in Canadian Dollars)
New Zealand Energy Corp. Year ended 31 December 2017
11
Adoption of New or Revised IFRSs
There have been no new or revised accounting standards, interpretations or amendments effective during the year which have
a material impact on the Company’s accounting policies or disclosures.
Future IFRS Not Yet Effective
IFRS 9 – Financial Instruments IFRS 9 Financial Instruments (“IFRS 9”) is effective for annual reporting periods beginning on or after 1 January 2018. The
Company has assessed the impact of applying the new standard on the consolidated financial statements and has not identified
any material differences from its current reporting.
IFRS 15 Revenue from Contracts with Customers IFRS 15 Revenue from Contracts with Customers (“IFRS 15”) is effective for annual reporting periods beginning on or after 1
January 2018. The Company has made a preliminary assessment of the impact of applying the new standard on the
consolidated financial statements and has not identified any material differences from its current revenue recognition practice.
This assessment has not yet been subject to a full audit.
IFRS 16 Leases IFRS 16 Leases (“IFRS 16”) is effective for annual reporting periods beginning on or after 1 January 2019. The Company has
yet to determine the impact this standard will have on the financial statements. The Company is not expected to early adopt this
standard.
All other standards, interpretations and amendments approved but not yet effective in the current year are either not applicable
to the Company or are not expected to have a material impact on the Company’s consolidated financial statements and therefore
have not been discussed.
3. JOINT ARRANGEMENTS
The consolidated financial statements include the Company’s share of the assets, liabilities and cash flows of the joint
arrangements, as they are accounted for as joint operations. The Company combines its share of the joint arrangements’
individual income and expenses, assets and liabilities and cash flows on a line-by-line basis with similar items in the Company’s
financial statements. Income taxes are recorded based on the Company’s share of the joint arrangement’s activities.
The Company accounts for the following joint arrangements.
Company Principal activity Location Interest TWN Limited Partnership Operate the Waihapa Production Station New Zealand 50% Tariki Joint Arrangement Operate the Tariki license New Zealand 50% Waihapa-Ngaere Joint Arrangement Operate the Waihapa and Ngaere licenses New Zealand 50%
4. CASH, AND REVOLVING CREDIT FACILITY
Cash is composed of cash on hand and deposits held at banks. Cash equivalents consist of short-term highly liquid investments with original maturities of three months or less that are readily convertible to known amounts of cash and are subject to an insignificant risk of change in value.
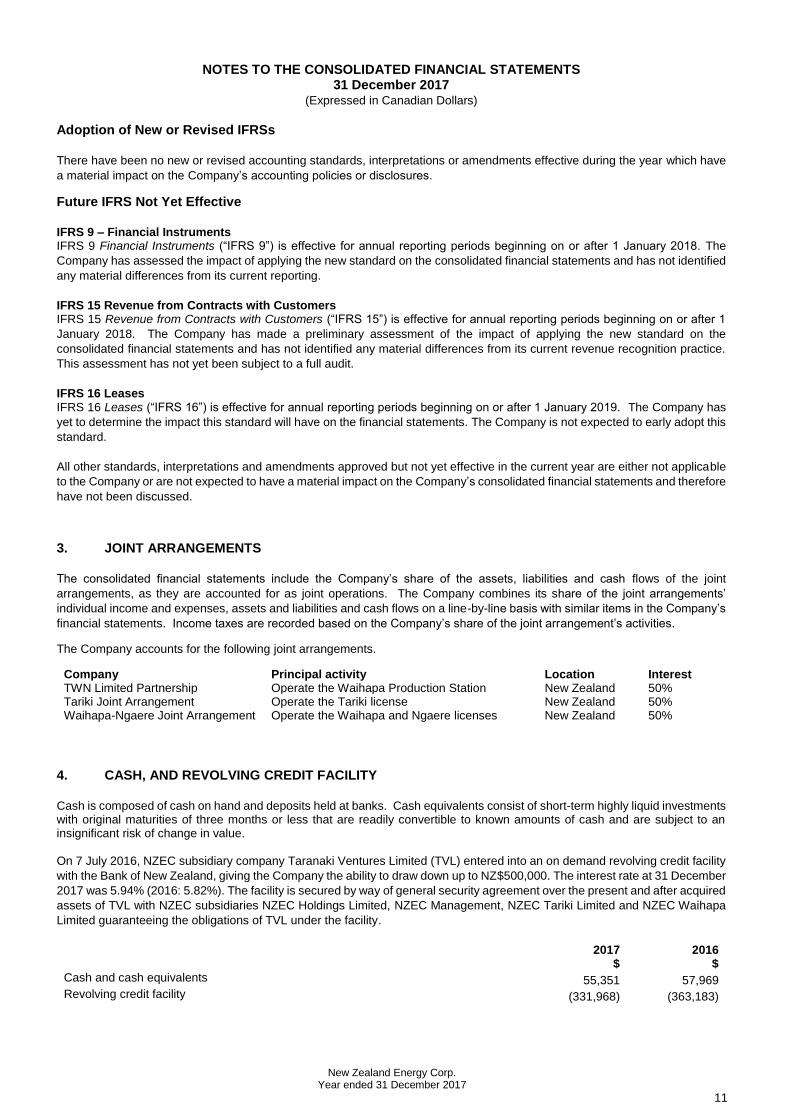
On 7 July 2016, NZEC subsidiary company Taranaki Ventures Limited (TVL) entered into an on demand revolving credit facility
with the Bank of New Zealand, giving the Company the ability to draw down up to NZ$500,000. The interest rate at 31 December
2017 was 5.94% (2016: 5.82%). The facility is secured by way of general security agreement over the present and after acquired
assets of TVL with NZEC subsidiaries NZEC Holdings Limited, NZEC Management, NZEC Tariki Limited and NZEC Waihapa
Limited guaranteeing the obligations of TVL under the facility.
2017 2016 $ $ Cash and cash equivalents 55,351 57,969 Revolving credit facility (331,968) (363,183)
NOTES TO THE CONSOLIDATED FINANCIAL STATEMENTS
31 December 2017 (Expressed in Canadian Dollars)
New Zealand Energy Corp. Year ended 31 December 2017
12
5. ACCOUNTS AND OTHER RECEIVABLES
Receivables are recognized initially at fair value and subsequently measured at amortized cost using the effective interest rate
method less any provisions for uncollectible accounts.
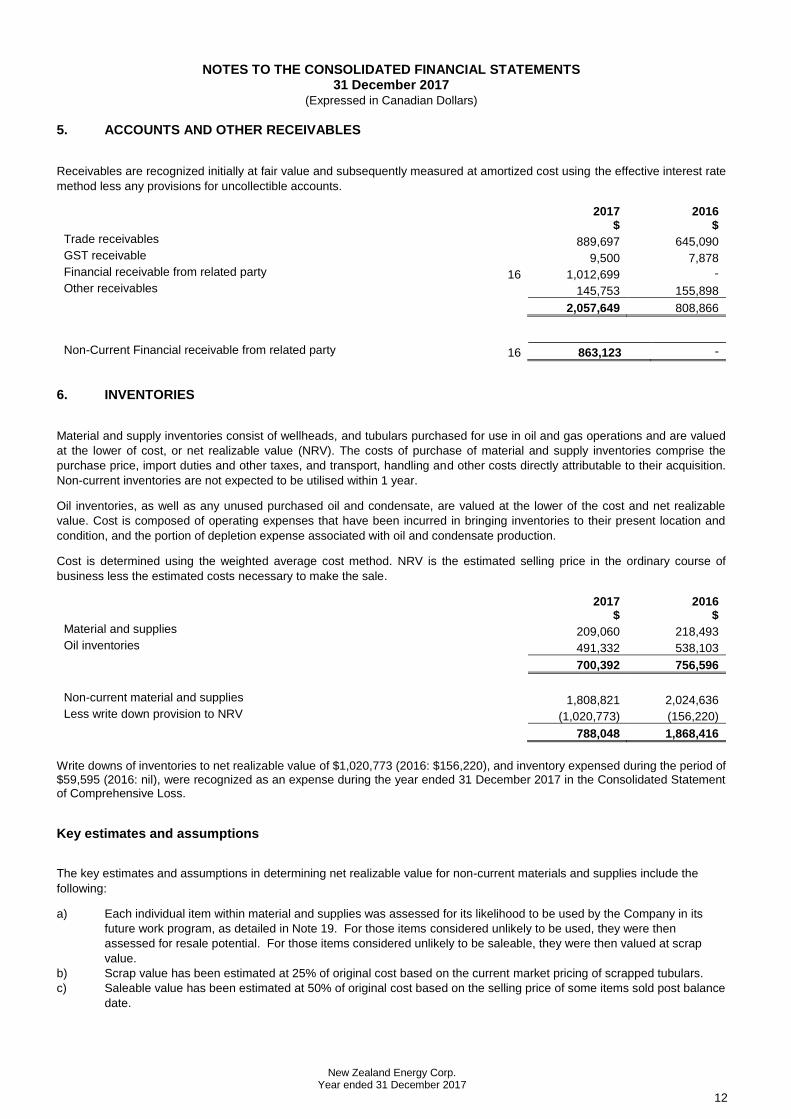
2017 2016 $ $ Trade receivables 889,697 645,090 GST receivable 9,500 7,878 Financial receivable from related party 16 1,012,699 -
Other receivables 145,753 155,898 2,057,649 808,866
Non-Current Financial receivable from related party 16 863,123 -
6. INVENTORIES
Material and supply inventories consist of wellheads, and tubulars purchased for use in oil and gas operations and are valued
at the lower of cost, or net realizable value (NRV). The costs of purchase of material and supply inventories comprise the
purchase price, import duties and other taxes, and transport, handling and other costs directly attributable to their acquisition.
Non-current inventories are not expected to be utilised within 1 year.
Oil inventories, as well as any unused purchased oil and condensate, are valued at the lower of the cost and net realizable
value. Cost is composed of operating expenses that have been incurred in bringing inventories to their present location and
condition, and the portion of depletion expense associated with oil and condensate production.
Cost is determined using the weighted average cost method. NRV is the estimated selling price in the ordinary course of
business less the estimated costs necessary to make the sale.
2017 2016 $ $ Material and supplies 209,060 218,493 Oil inventories 491,332 538,103
700,392 756,596
Non-current material and supplies 1,808,821 2,024,636 Less write down provision to NRV (1,020,773) (156,220)
788,048 1,868,416
Write downs of inventories to net realizable value of $1,020,773 (2016: $156,220), and inventory expensed during the period of $59,595 (2016: nil), were recognized as an expense during the year ended 31 December 2017 in the Consolidated Statement of Comprehensive Loss.
Key estimates and assumptions
The key estimates and assumptions in determining net realizable value for non-current materials and supplies include the
following:
a) Each individual item within material and supplies was assessed for its likelihood to be used by the Company in its
future work program, as detailed in Note 19. For those items considered unlikely to be used, they were then
assessed for resale potential. For those items considered unlikely to be saleable, they were then valued at scrap
value.
b) Scrap value has been estimated at 25% of original cost based on the current market pricing of scrapped tubulars.
c) Saleable value has been estimated at 50% of original cost based on the selling price of some items sold post balance
date.
NOTES TO THE CONSOLIDATED FINANCIAL STATEMENTS
31 December 2017 (Expressed in Canadian Dollars)
New Zealand Energy Corp. Year ended 31 December 2017
13
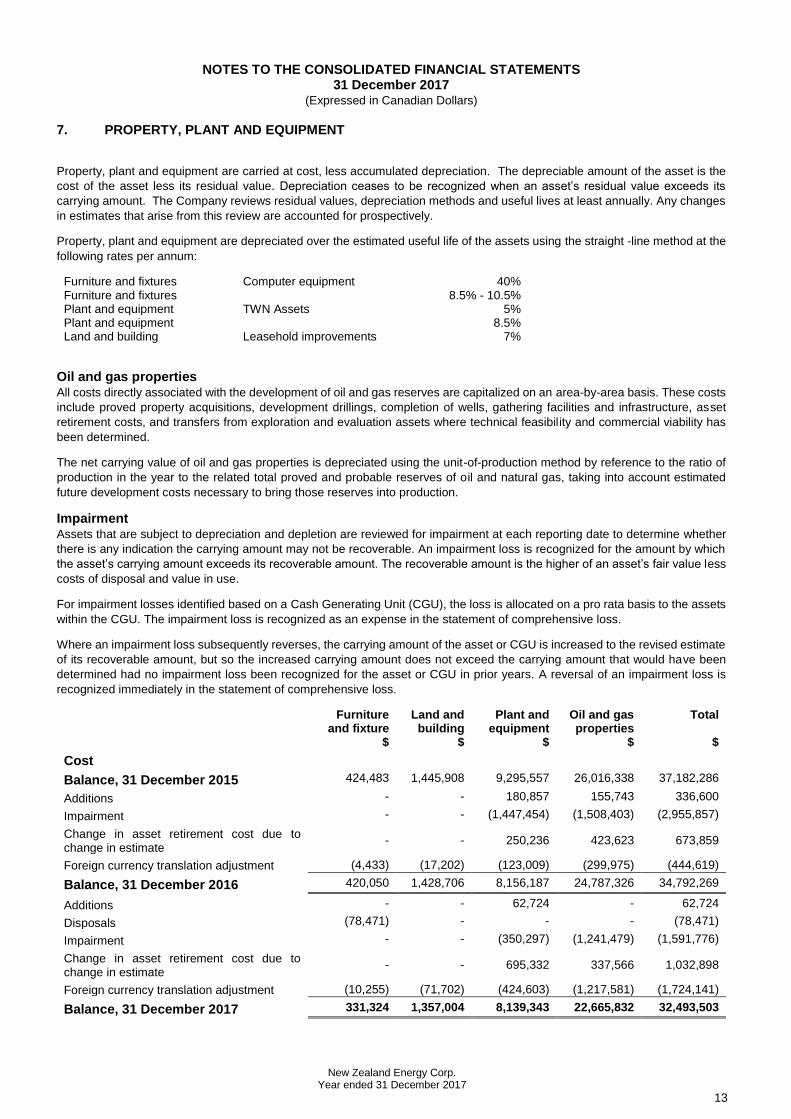
7. PROPERTY, PLANT AND EQUIPMENT
Property, plant and equipment are carried at cost, less accumulated depreciation. The depreciable amount of the asset is the
cost of the asset less its residual value. Depreciation ceases to be recognized when an asset’s residual value exceeds its
carrying amount. The Company reviews residual values, depreciation methods and useful lives at least annually. Any changes
in estimates that arise from this review are accounted for prospectively.
Property, plant and equipment are depreciated over the estimated useful life of the assets using the straight -line method at the
following rates per annum:
Furniture and fixtures Computer equipment 40% Furniture and fixtures 8.5% - 10.5% Plant and equipment TWN Assets 5% Plant and equipment 8.5% Land and building Leasehold improvements 7%
Oil and gas properties All costs directly associated with the development of oil and gas reserves are capitalized on an area-by-area basis. These costs
include proved property acquisitions, development drillings, completion of wells, gathering facilities and infrastructure, asset
retirement costs, and transfers from exploration and evaluation assets where technical feasibility and commercial viability has
been determined.
The net carrying value of oil and gas properties is depreciated using the unit-of-production method by reference to the ratio of
production in the year to the related total proved and probable reserves of oil and natural gas, taking into account estimated
future development costs necessary to bring those reserves into production.
Impairment Assets that are subject to depreciation and depletion are reviewed for impairment at each reporting date to determine whether
there is any indication the carrying amount may not be recoverable. An impairment loss is recognized for the amount by which
the asset’s carrying amount exceeds its recoverable amount. The recoverable amount is the higher of an asset’s fair value less
costs of disposal and value in use.
For impairment losses identified based on a Cash Generating Unit (CGU), the loss is allocated on a pro rata basis to the assets
within the CGU. The impairment loss is recognized as an expense in the statement of comprehensive loss.
Where an impairment loss subsequently reverses, the carrying amount of the asset or CGU is increased to the revised estimate
of its recoverable amount, but so the increased carrying amount does not exceed the carrying amount that would have been
determined had no impairment loss been recognized for the asset or CGU in prior years. A reversal of an impairment loss is
recognized immediately in the statement of comprehensive loss.
Furniture and fixture
Land and building
Plant and equipment
Oil and gas properties
Total
$ $ $ $ $
Cost
Balance, 31 December 2015 424,483 1,445,908 9,295,557 26,016,338 37,182,286
Additions - - 180,857 155,743 336,600
Impairment - - (1,447,454) (1,508,403) (2,955,857)
Change in asset retirement cost due to change in estimate
- - 250,236 423,623 673,859
Foreign currency translation adjustment (4,433) (17,202) (123,009) (299,975) (444,619)
Balance, 31 December 2016 420,050 1,428,706 8,156,187 24,787,326 34,792,269
Additions - - 62,724 - 62,724
Disposals (78,471) - - - (78,471)
Impairment - - (350,297) (1,241,479) (1,591,776)
Change in asset retirement cost due to change in estimate
- - 695,332 337,566 1,032,898
Foreign currency translation adjustment (10,255) (71,702) (424,603) (1,217,581) (1,724,141)
Balance, 31 December 2017 331,324 1,357,004 8,139,343 22,665,832 32,493,503
NOTES TO THE CONSOLIDATED FINANCIAL STATEMENTS
31 December 2017 (Expressed in Canadian Dollars)
New Zealand Energy Corp. Year ended 31 December 2017
14
Furniture and fixture
Land and building
Plant and equipment
Oil and gas properties
Total
$ $ $ $ $
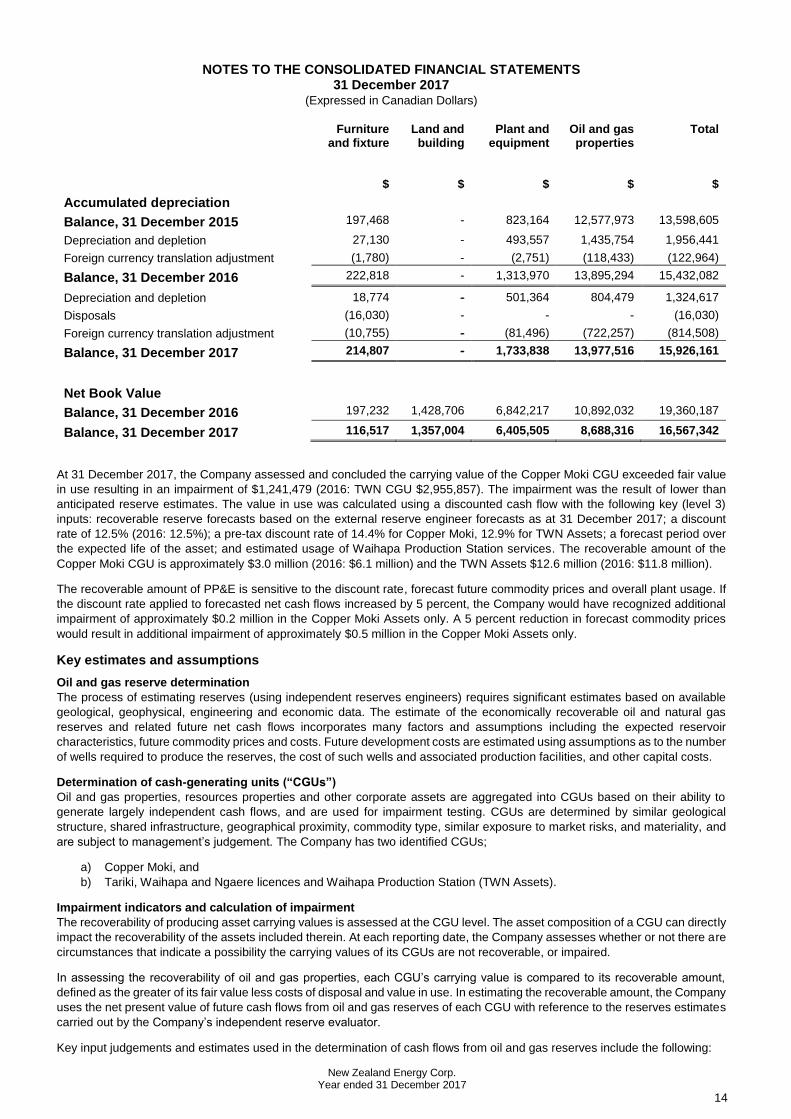
Accumulated depreciation
Balance, 31 December 2015 197,468 - 823,164 12,577,973 13,598,605
Depreciation and depletion 27,130 - 493,557 1,435,754 1,956,441
Foreign currency translation adjustment (1,780) - (2,751) (118,433) (122,964)
Balance, 31 December 2016 222,818 - 1,313,970 13,895,294 15,432,082
Depreciation and depletion 18,774 - 501,364 804,479 1,324,617
Disposals (16,030) - - - (16,030)
Foreign currency translation adjustment (10,755) - (81,496) (722,257) (814,508)
Balance, 31 December 2017 214,807 - 1,733,838 13,977,516 15,926,161
Net Book Value
Balance, 31 December 2016 197,232 1,428,706 6,842,217 10,892,032 19,360,187
Balance, 31 December 2017 116,517 1,357,004 6,405,505 8,688,316 16,567,342
At 31 December 2017, the Company assessed and concluded the carrying value of the Copper Moki CGU exceeded fair value
in use resulting in an impairment of $1,241,479 (2016: TWN CGU $2,955,857). The impairment was the result of lower than
anticipated reserve estimates. The value in use was calculated using a discounted cash flow with the following key (level 3)
inputs: recoverable reserve forecasts based on the external reserve engineer forecasts as at 31 December 2017; a discount
rate of 12.5% (2016: 12.5%); a pre-tax discount rate of 14.4% for Copper Moki, 12.9% for TWN Assets; a forecast period over
the expected life of the asset; and estimated usage of Waihapa Production Station services. The recoverable amount of the
Copper Moki CGU is approximately $3.0 million (2016: $6.1 million) and the TWN Assets $12.6 million (2016: $11.8 million).
The recoverable amount of PP&E is sensitive to the discount rate, forecast future commodity prices and overall plant usage. If
the discount rate applied to forecasted net cash flows increased by 5 percent, the Company would have recognized additional
impairment of approximately $0.2 million in the Copper Moki Assets only. A 5 percent reduction in forecast commodity prices
would result in additional impairment of approximately $0.5 million in the Copper Moki Assets only.
Key estimates and assumptions
Oil and gas reserve determination
The process of estimating reserves (using independent reserves engineers) requires significant estimates based on available
geological, geophysical, engineering and economic data. The estimate of the economically recoverable oil and natural gas
reserves and related future net cash flows incorporates many factors and assumptions including the expected reservoir
characteristics, future commodity prices and costs. Future development costs are estimated using assumptions as to the number
of wells required to produce the reserves, the cost of such wells and associated production facilities, and other capital costs.
Determination of cash-generating units (“CGUs”)
Oil and gas properties, resources properties and other corporate assets are aggregated into CGUs based on their ability to
generate largely independent cash flows, and are used for impairment testing. CGUs are determined by similar geological
structure, shared infrastructure, geographical proximity, commodity type, similar exposure to market risks, and materiality, and
are subject to management’s judgement. The Company has two identified CGUs;
a) Copper Moki, and
b) Tariki, Waihapa and Ngaere licences and Waihapa Production Station (TWN Assets).
Impairment indicators and calculation of impairment
The recoverability of producing asset carrying values is assessed at the CGU level. The asset composition of a CGU can directly
impact the recoverability of the assets included therein. At each reporting date, the Company assesses whether or not there are
circumstances that indicate a possibility the carrying values of its CGUs are not recoverable, or impaired.
In assessing the recoverability of oil and gas properties, each CGU’s carrying value is compared to its recoverable amount,
defined as the greater of its fair value less costs of disposal and value in use. In estimating the recoverable amount, the Company
uses the net present value of future cash flows from oil and gas reserves of each CGU with reference to the reserves estimates
carried out by the Company’s independent reserve evaluator.
Key input judgements and estimates used in the determination of cash flows from oil and gas reserves include the following:
NOTES TO THE CONSOLIDATED FINANCIAL STATEMENTS
31 December 2017 (Expressed in Canadian Dollars)
New Zealand Energy Corp. Year ended 31 December 2017
15
a) Reserves – Assumptions that are valued at the time of reserve estimation may change significantly when new
information becomes available. Changes in forward price estimates, production costs or recovery rates may change the
economic status of reserves and may ultimately result in reserves being restated.
b) Oil and natural gas prices – Forward price estimates of oil and natural gas prices are used in the cash flow model.
Commodity prices have fluctuated widely in recent years due to global and regional factors including supply and demand
fundamentals, inventory levels, exchange rates, weather, economic and geopolitical factors.
c) Discount rate – The discount rate used to calculate the net present value of cash flows is based on estimates of an
approximate industry peer group weighted average cost of capital. Changes in the general economic environment could result
in significant changes to this estimate.
8. EXPLORATION AND EVALUATION ASSETS
The Company uses the successful efforts method of accounting for oil and gas exploration costs. All general exploration and
evaluation costs are expensed as incurred except the direct costs of acquiring the rights to explore, drilling exploratory wells
and evaluating the results of drilling. These direct costs are capitalised as exploration and evaluation assets pending the
determination of the success of the well. If a well does not result in a successful discovery, the previously capitalised costs are
immediately expensed.
Exploration and evaluation assets are assessed for impairment if facts and circumstances suggest the carrying amount exceeds
the recoverable amount. Exploration and evaluation assets can be allocated to CGUs or groups of CGUs for the purposes of
assessing such assets for impairment. At 31 December 2017 exploration and evaluation assets were nil and therefore not
allocated to CGUs.
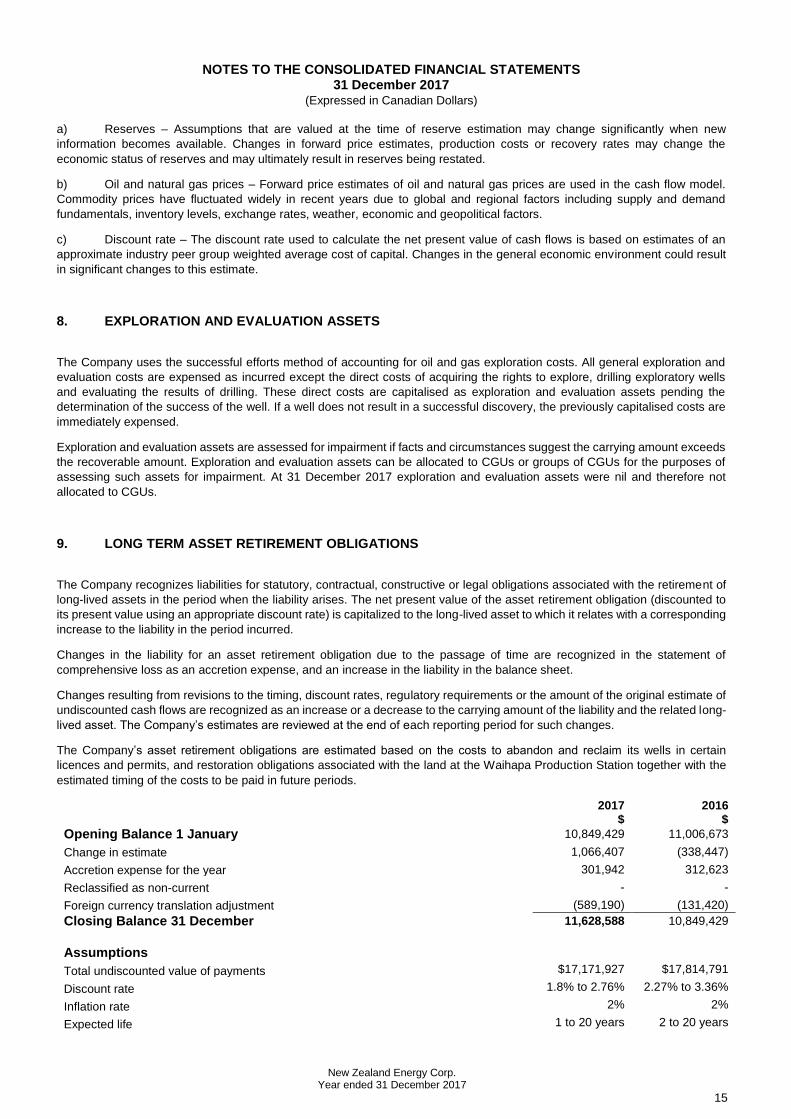
9. LONG TERM ASSET RETIREMENT OBLIGATIONS
The Company recognizes liabilities for statutory, contractual, constructive or legal obligations associated with the retirement of
long-lived assets in the period when the liability arises. The net present value of the asset retirement obligation (discounted to
its present value using an appropriate discount rate) is capitalized to the long-lived asset to which it relates with a corresponding
increase to the liability in the period incurred.
Changes in the liability for an asset retirement obligation due to the passage of time are recognized in the statement of
comprehensive loss as an accretion expense, and an increase in the liability in the balance sheet.
Changes resulting from revisions to the timing, discount rates, regulatory requirements or the amount of the original estimate of
undiscounted cash flows are recognized as an increase or a decrease to the carrying amount of the liability and the related long-
lived asset. The Company’s estimates are reviewed at the end of each reporting period for such changes.
The Company’s asset retirement obligations are estimated based on the costs to abandon and reclaim its wells in certain
licences and permits, and restoration obligations associated with the land at the Waihapa Production Station together with the
estimated timing of the costs to be paid in future periods.
2017 2016 $ $
Opening Balance 1 January 10,849,429 11,006,673
Change in estimate 1,066,407 (338,447)
Accretion expense for the year 301,942 312,623
Reclassified as non-current - -
Foreign currency translation adjustment (589,190) (131,420)
Closing Balance 31 December 11,628,588 10,849,429
Assumptions
Total undiscounted value of payments $17,171,927 $17,814,791
Discount rate 1.8% to 2.76% 2.27% to 3.36%
Inflation rate 2% 2%
Expected life 1 to 20 years 2 to 20 years
NOTES TO THE CONSOLIDATED FINANCIAL STATEMENTS
31 December 2017 (Expressed in Canadian Dollars)
New Zealand Energy Corp. Year ended 31 December 2017
16
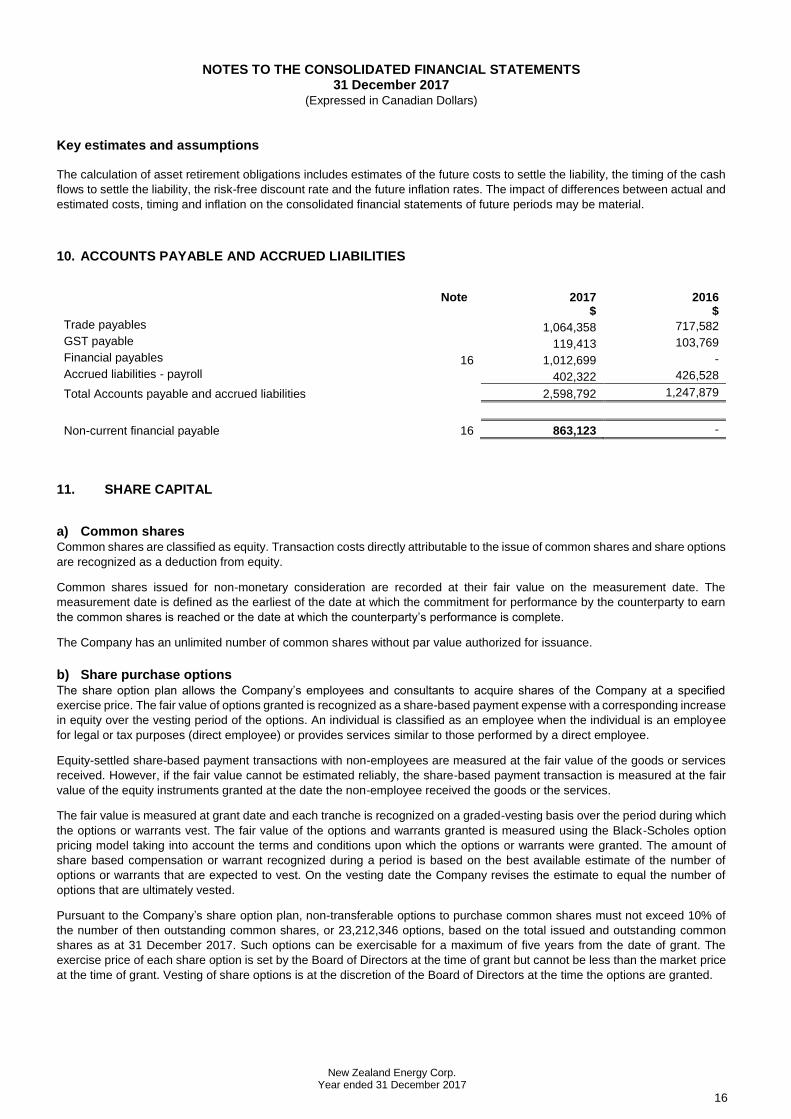
Key estimates and assumptions
The calculation of asset retirement obligations includes estimates of the future costs to settle the liability, the timing of the cash
flows to settle the liability, the risk-free discount rate and the future inflation rates. The impact of differences between actual and
estimated costs, timing and inflation on the consolidated financial statements of future periods may be material.
10. ACCOUNTS PAYABLE AND ACCRUED LIABILITIES
Note 2017 2016 $ $ Trade payables 1,064,358 717,582
GST payable 119,413 103,769
Financial payables 16 1,012,699 -
Accrued liabilities - payroll 402,322 426,528
Total Accounts payable and accrued liabilities 2,598,792 1,247,879
Non-current financial payable 16 863,123 -
11. SHARE CAPITAL
a) Common shares Common shares are classified as equity. Transaction costs directly attributable to the issue of common shares and share options
are recognized as a deduction from equity.
Common shares issued for non-monetary consideration are recorded at their fair value on the measurement date. The
measurement date is defined as the earliest of the date at which the commitment for performance by the counterparty to earn
the common shares is reached or the date at which the counterparty’s performance is complete.
The Company has an unlimited number of common shares without par value authorized for issuance.
b) Share purchase options The share option plan allows the Company’s employees and consultants to acquire shares of the Company at a specified
exercise price. The fair value of options granted is recognized as a share-based payment expense with a corresponding increase
in equity over the vesting period of the options. An individual is classified as an employee when the individual is an employee
for legal or tax purposes (direct employee) or provides services similar to those performed by a direct employee.
Equity-settled share-based payment transactions with non-employees are measured at the fair value of the goods or services
received. However, if the fair value cannot be estimated reliably, the share-based payment transaction is measured at the fair
value of the equity instruments granted at the date the non-employee received the goods or the services.
The fair value is measured at grant date and each tranche is recognized on a graded-vesting basis over the period during which
the options or warrants vest. The fair value of the options and warrants granted is measured using the Black-Scholes option
pricing model taking into account the terms and conditions upon which the options or warrants were granted. The amount of
share based compensation or warrant recognized during a period is based on the best available estimate of the number of
options or warrants that are expected to vest. On the vesting date the Company revises the estimate to equal the number of
options that are ultimately vested.
Pursuant to the Company’s share option plan, non-transferable options to purchase common shares must not exceed 10% of
the number of then outstanding common shares, or 23,212,346 options, based on the total issued and outstanding common
shares as at 31 December 2017. Such options can be exercisable for a maximum of five years from the date of grant. The
exercise price of each share option is set by the Board of Directors at the time of grant but cannot be less than the market price
at the time of grant. Vesting of share options is at the discretion of the Board of Directors at the time the options are granted.
NOTES TO THE CONSOLIDATED FINANCIAL STATEMENTS
31 December 2017 (Expressed in Canadian Dollars)
New Zealand Energy Corp. Year ended 31 December 2017
17
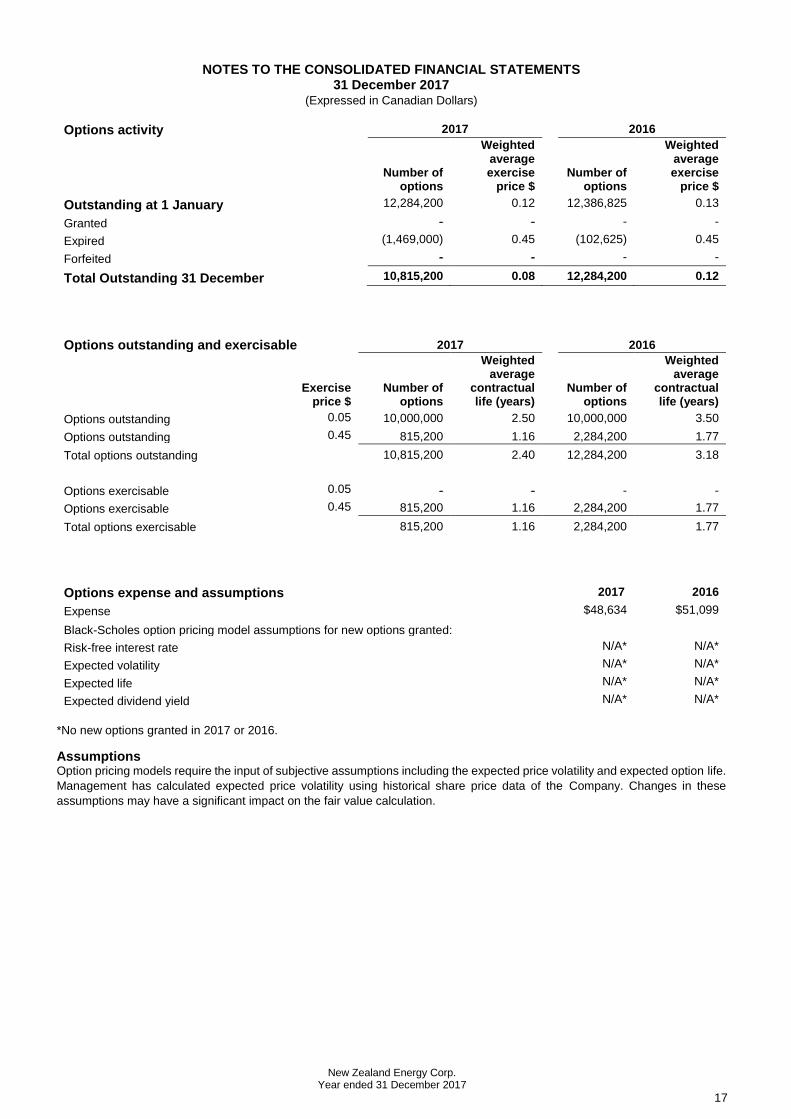
Options activity 2017 2016
Number of options
Weighted average exercise
price $ Number of
options
Weighted average exercise
price $
Outstanding at 1 January 12,284,200 0.12 12,386,825 0.13
Granted - - - -
Expired (1,469,000) 0.45 (102,625) 0.45
Forfeited - - - -
Total Outstanding 31 December 10,815,200 0.08 12,284,200 0.12
Options outstanding and exercisable 2017 2016
Exercise price $
Number of options
Weighted average
contractual life (years)
Number of options
Weighted average
contractual life (years)
Options outstanding 0.05 10,000,000 2.50 10,000,000 3.50
Options outstanding 0.45 815,200 1.16 2,284,200 1.77
Total options outstanding 10,815,200 2.40 12,284,200 3.18
Options exercisable 0.05 - - - -
Options exercisable 0.45 815,200 1.16 2,284,200 1.77
Total options exercisable 815,200 1.16 2,284,200 1.77
Options expense and assumptions 2017 2016
Expense $48,634 $51,099
Black-Scholes option pricing model assumptions for new options granted:
Risk-free interest rate N/A* N/A*
Expected volatility N/A* N/A*
Expected life N/A* N/A*
Expected dividend yield N/A* N/A*
*No new options granted in 2017 or 2016.
Assumptions Option pricing models require the input of subjective assumptions including the expected price volatility and expected option life.
Management has calculated expected price volatility using historical share price data of the Company. Changes in these
assumptions may have a significant impact on the fair value calculation.

NOTES TO THE CONSOLIDATED FINANCIAL STATEMENTS
31 December 2017 (Expressed in Canadian Dollars)
New Zealand Energy Corp. Year ended 31 December 2017
18
c) Warrants Warrants that have been issued by the Company are measured at fair value at the issue date. This value is recognized as an
expense with a corresponding increase in equity.
The fair value of warrants is measured as for options as discussed above.
Warrants activity 2017 2016
Number of
warrants
Weighted average
exercise price $
Number of warrants
Weighted average
exercise price $
Outstanding at 1 January 41,452,178 0.29 41,452,178 0.29
Total Outstanding 31 December 41,452,178 0.29 41,452,178 0.29
Warrants outstanding and exercisable 2017 2016
Exercise price $
Number of options
Weighted average
contractual life (years)
Number of options
Weighted average
contractual life (years)
Warrants outstanding and exercisable 0.07 17,000,000 0.96 17,000,000 1.96
Warrants outstanding and exercisable 0.45 24,452,178 0.83 24,452,178 1.83
Total outstanding and exercisable 41,452,178 0.88 41,452,178 1.88
12. REVENUE
Revenue from the sale of oil and natural gas is recorded when the significant risks and rewards of ownership of the product are
transferred to the buyer, which is at the delivery point. Revenue is measured at the fair value of the consideration received or
receivable. Revenue is presented net of royalties.
Revenue from the sale of purchased oil and purchased condensate is recognized when the product is delivered and title and
significant risks of the product is transferred to the other party. Revenue from the sale of purchased oil and purchased
condensate is measured at the gross amount net of any relevant fees paid or payable.
Processing revenue is recognized at the time the service has been rendered, provided the amount can be measured reliably
and management has determined it is probable that economic benefit associated with the services will flow to the Group.
Note 2017 2016
$ $
Oil sales 3,174,677 3,195,196 Gas sales 148,460 436,143 Processing revenue 2,461,946 2,091,165 Interest revenue 93,716 - Other revenue 304,101 149,114 Royalties (245,215) (180,691)
5,937,685 5,690,927
Purchased oil sold a) 2,579,330 175,680 Other income 161,262 -
2,740,592 175,680
a) The Company has an arrangement with a third party whereby the Company purchases oil, charges a processing fee and subsequently sells the oil. Any unsold oil is carried as inventory.

NOTES TO THE CONSOLIDATED FINANCIAL STATEMENTS
31 December 2017 (Expressed in Canadian Dollars)
New Zealand Energy Corp. Year ended 31 December 2017
19
13. PRODUCTION COSTS
Production costs incurred by the Company include the transportation, day-to-day servicing of the production facilities and other
costs directly relating to the revenue recognized from the oil and gas or purchased oil and condensate. Costs paid by the
Company for the transportation of oil, natural gas and condensate from the wellhead to the point of title transfer are recognized
when the transportation is provided.
14. GENERAL AND ADMINISTRATIVE EXPENSES
2017 2016
$ $
Professional fees 167,799 158,166
Consulting fees 76,015 102,729
Travel and promotion 34,718 31,567
Administrative expenses 373,619 344,418
Rent 111,975 148,038
Filing and transfer agent fees 27,407 16,143
Insurance 188,976 189,602
Salary and wages 2,788,208 3,133,425 3,768,717 4,124,088
15. INCOME TAXES
Any income tax on profit or loss for the periods presented comprises current and deferred tax. Income tax is recognized in the
statement of comprehensive loss except to the extent it relates to items recognized directly in equity, in which case it is
recognized in equity.
Deferred tax assets and liabilities are recognized for deferred tax consequences attributable to differences between the financial
statement carrying amounts of existing assets and liabilities and their respective tax bases. Deferred tax assets and liabilities
are measured using the enacted or substantively enacted tax rates expected to apply when the asset is realized or the liabili ty
settled. The effect on deferred tax assets and liabilities of a change in tax rates is recognized in income in the period substantive
enactment occurs.
A deferred tax asset is recognized to the extent it is probable future taxable profits will be available in the foreseeable future
against which the asset can be used. To the extent the Company does not consider it probable a deferred tax asset will be
recovered, the deferred tax asset is reduced.
A reconciliation of the income tax benefit determined by applying the Canadian income tax rates to the consolidated loss for the
years ended 31 December 2017 and 2016 has been prepared as follows:
2017 2016
$ $
Loss before income taxes 4,536,800 5,225,884
Statutory tax rate 26.0% 26.0%
Income tax (recovery) at statutory rates (1,179,568) (1,358,729)
Effect of tax rates in other jurisdictions (88,995) (104,028)
Effect of changes in foreign exchange rates 107,067 65,363
Change in unrecognized tax assets (315,239) (409,661)
Adjustment to return 42,737 1,806,034
Tax on royalty agreement transaction (See Note 16 (i)) 903,070 -
Other 530,928 1,021 - -
NOTES TO THE CONSOLIDATED FINANCIAL STATEMENTS
31 December 2017 (Expressed in Canadian Dollars)
New Zealand Energy Corp. Year ended 31 December 2017
20
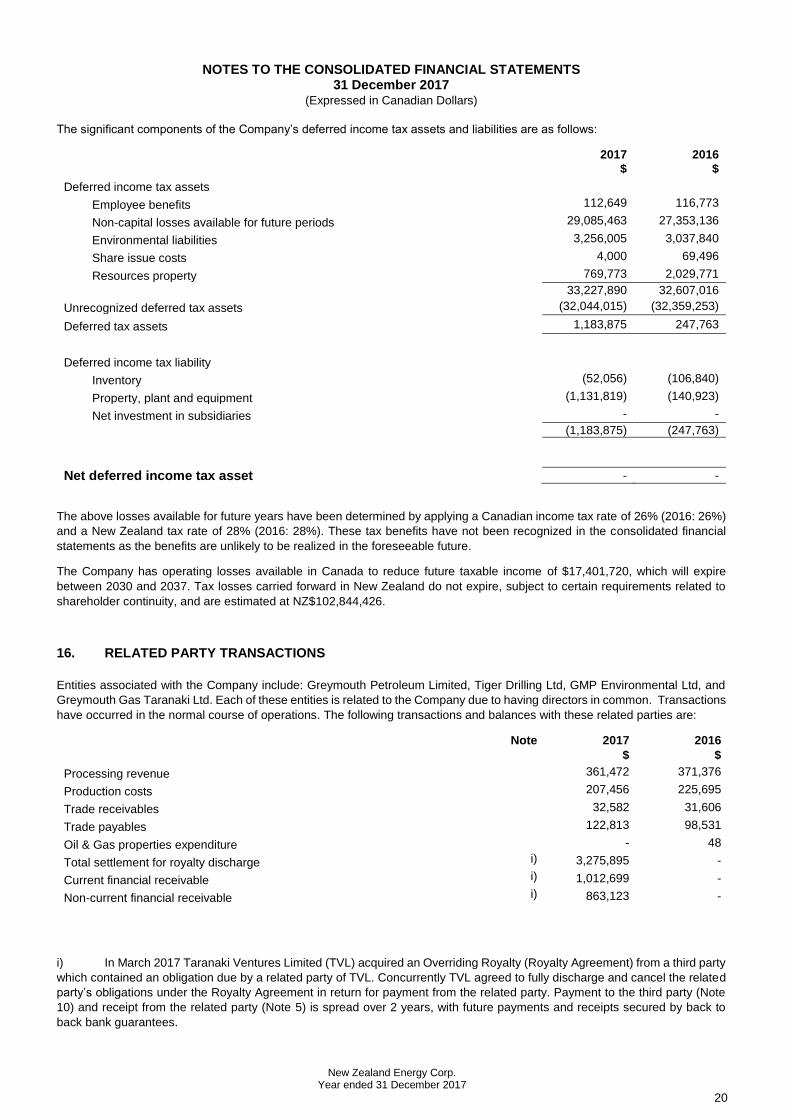
The significant components of the Company’s deferred income tax assets and liabilities are as follows:
2017 2016
$ $
Deferred income tax assets
Employee benefits 112,649 116,773
Non-capital losses available for future periods 29,085,463 27,353,136
Environmental liabilities 3,256,005 3,037,840
Share issue costs 4,000 69,496
Resources property 769,773 2,029,771
33,227,890 32,607,016
Unrecognized deferred tax assets (32,044,015) (32,359,253)
Deferred tax assets 1,183,875 247,763
Deferred income tax liability
Inventory (52,056) (106,840)
Property, plant and equipment (1,131,819) (140,923)
Net investment in subsidiaries - -
(1,183,875) (247,763)
Net deferred income tax asset - -
The above losses available for future years have been determined by applying a Canadian income tax rate of 26% (2016: 26%)
and a New Zealand tax rate of 28% (2016: 28%). These tax benefits have not been recognized in the consolidated financial
statements as the benefits are unlikely to be realized in the foreseeable future.
The Company has operating losses available in Canada to reduce future taxable income of $17,401,720, which will expire
between 2030 and 2037. Tax losses carried forward in New Zealand do not expire, subject to certain requirements related to
shareholder continuity, and are estimated at NZ$102,844,426.
16. RELATED PARTY TRANSACTIONS
Entities associated with the Company include: Greymouth Petroleum Limited, Tiger Drilling Ltd, GMP Environmental Ltd, and
Greymouth Gas Taranaki Ltd. Each of these entities is related to the Company due to having directors in common. Transactions
have occurred in the normal course of operations. The following transactions and balances with these related parties are:
Note 2017 2016
$ $
Processing revenue 361,472 371,376
Production costs 207,456 225,695
Trade receivables 32,582 31,606
Trade payables 122,813 98,531
Oil & Gas properties expenditure - 48
Total settlement for royalty discharge i) 3,275,895 -
Current financial receivable i) 1,012,699 -
Non-current financial receivable i) 863,123 -
i) In March 2017 Taranaki Ventures Limited (TVL) acquired an Overriding Royalty (Royalty Agreement) from a third party
which contained an obligation due by a related party of TVL. Concurrently TVL agreed to fully discharge and cancel the related
party’s obligations under the Royalty Agreement in return for payment from the related party. Payment to the third party (Note
10) and receipt from the related party (Note 5) is spread over 2 years, with future payments and receipts secured by back to
back bank guarantees.
NOTES TO THE CONSOLIDATED FINANCIAL STATEMENTS
31 December 2017 (Expressed in Canadian Dollars)
New Zealand Energy Corp. Year ended 31 December 2017
21
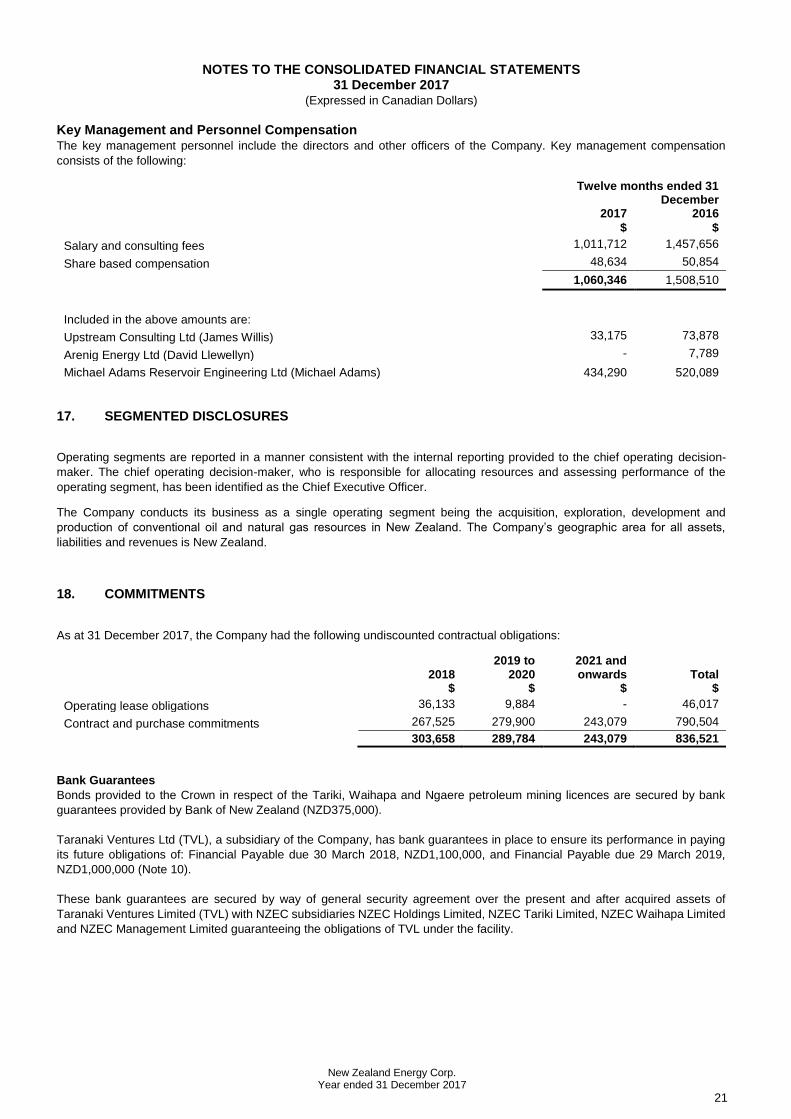
Key Management and Personnel Compensation The key management personnel include the directors and other officers of the Company. Key management compensation
consists of the following:
Twelve months ended 31 December
2017 2016
$ $
Salary and consulting fees 1,011,712 1,457,656
Share based compensation 48,634 50,854
1,060,346 1,508,510
Included in the above amounts are:
Upstream Consulting Ltd (James Willis) 33,175 73,878
Arenig Energy Ltd (David Llewellyn) - 7,789
Michael Adams Reservoir Engineering Ltd (Michael Adams) 434,290 520,089
17. SEGMENTED DISCLOSURES
Operating segments are reported in a manner consistent with the internal reporting provided to the chief operating decision-
maker. The chief operating decision-maker, who is responsible for allocating resources and assessing performance of the
operating segment, has been identified as the Chief Executive Officer.
The Company conducts its business as a single operating segment being the acquisition, exploration, development and
production of conventional oil and natural gas resources in New Zealand. The Company’s geographic area for all assets,
liabilities and revenues is New Zealand.
18. COMMITMENTS
As at 31 December 2017, the Company had the following undiscounted contractual obligations:
2018
2019 to 2020
2021 and onwards Total
$ $ $ $
Operating lease obligations 36,133 9,884 - 46,017
Contract and purchase commitments 267,525 279,900 243,079 790,504
303,658 289,784 243,079 836,521
Bank Guarantees
Bonds provided to the Crown in respect of the Tariki, Waihapa and Ngaere petroleum mining licences are secured by bank
guarantees provided by Bank of New Zealand (NZD375,000).
Taranaki Ventures Ltd (TVL), a subsidiary of the Company, has bank guarantees in place to ensure its performance in paying
its future obligations of: Financial Payable due 30 March 2018, NZD1,100,000, and Financial Payable due 29 March 2019,
NZD1,000,000 (Note 10).
These bank guarantees are secured by way of general security agreement over the present and after acquired assets of
Taranaki Ventures Limited (TVL) with NZEC subsidiaries NZEC Holdings Limited, NZEC Tariki Limited, NZEC Waihapa Limited
and NZEC Management Limited guaranteeing the obligations of TVL under the facility.
NOTES TO THE CONSOLIDATED FINANCIAL STATEMENTS
31 December 2017 (Expressed in Canadian Dollars)
New Zealand Energy Corp. Year ended 31 December 2017
22
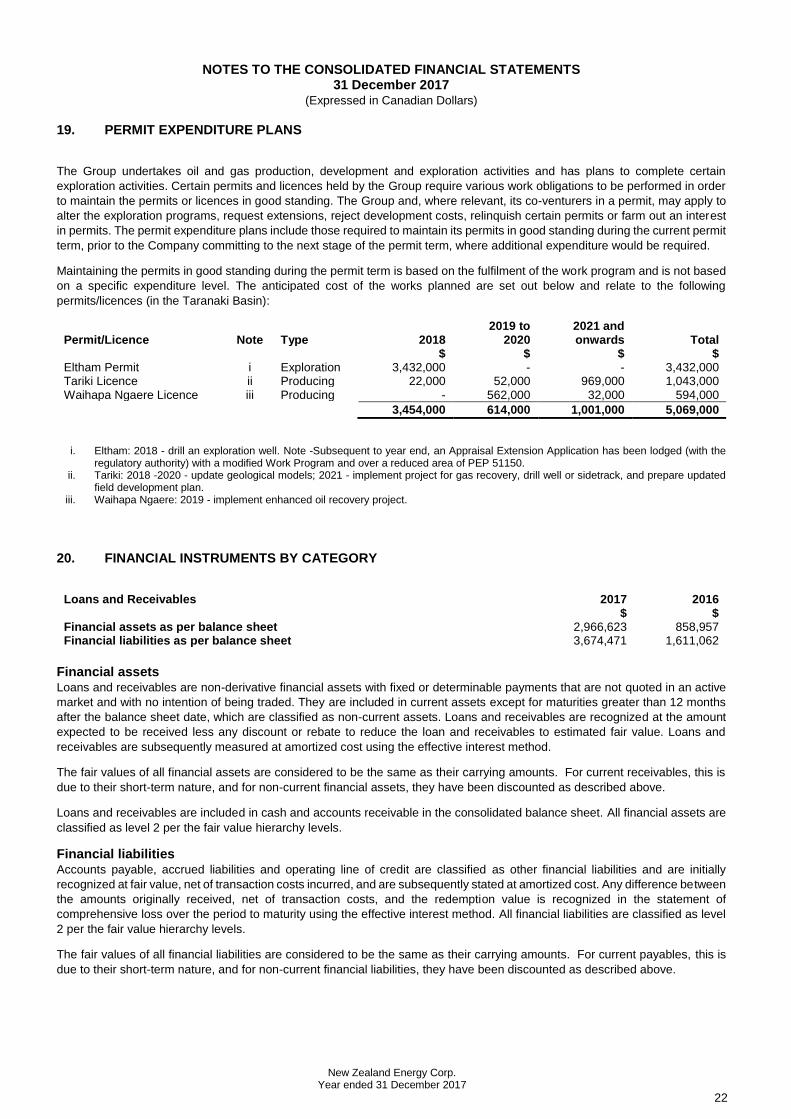
19. PERMIT EXPENDITURE PLANS
The Group undertakes oil and gas production, development and exploration activities and has plans to complete certain
exploration activities. Certain permits and licences held by the Group require various work obligations to be performed in order
to maintain the permits or licences in good standing. The Group and, where relevant, its co-venturers in a permit, may apply to
alter the exploration programs, request extensions, reject development costs, relinquish certain permits or farm out an interest
in permits. The permit expenditure plans include those required to maintain its permits in good standing during the current permit
term, prior to the Company committing to the next stage of the permit term, where additional expenditure would be required.
Maintaining the permits in good standing during the permit term is based on the fulfilment of the work program and is not based
on a specific expenditure level. The anticipated cost of the works planned are set out below and relate to the following
permits/licences (in the Taranaki Basin):
Permit/Licence Note Type 2018 2019 to
2020 2021 and onwards Total
$ $ $ $ Eltham Permit i Exploration 3,432,000 - - 3,432,000 Tariki Licence ii Producing 22,000 52,000 969,000 1,043,000 Waihapa Ngaere Licence iii Producing - 562,000 32,000 594,000
3,454,000 614,000 1,001,000 5,069,000
i. Eltham: 2018 - drill an exploration well. Note -Subsequent to year end, an Appraisal Extension Application has been lodged (with the regulatory authority) with a modified Work Program and over a reduced area of PEP 51150.
ii. Tariki: 2018 -2020 - update geological models; 2021 - implement project for gas recovery, drill well or sidetrack, and prepare updated field development plan.
iii. Waihapa Ngaere: 2019 - implement enhanced oil recovery project.
20. FINANCIAL INSTRUMENTS BY CATEGORY
Loans and Receivables 2017 2016 $ $ Financial assets as per balance sheet 2,966,623 858,957 Financial liabilities as per balance sheet 3,674,471 1,611,062
Financial assets Loans and receivables are non-derivative financial assets with fixed or determinable payments that are not quoted in an active
market and with no intention of being traded. They are included in current assets except for maturities greater than 12 months
after the balance sheet date, which are classified as non-current assets. Loans and receivables are recognized at the amount
expected to be received less any discount or rebate to reduce the loan and receivables to estimated fair value. Loans and
receivables are subsequently measured at amortized cost using the effective interest method.
The fair values of all financial assets are considered to be the same as their carrying amounts. For current receivables, this is
due to their short-term nature, and for non-current financial assets, they have been discounted as described above.
Loans and receivables are included in cash and accounts receivable in the consolidated balance sheet. All financial assets are
classified as level 2 per the fair value hierarchy levels.
Financial liabilities Accounts payable, accrued liabilities and operating line of credit are classified as other financial liabilities and are initially
recognized at fair value, net of transaction costs incurred, and are subsequently stated at amortized cost. Any difference between
the amounts originally received, net of transaction costs, and the redemption value is recognized in the statement of
comprehensive loss over the period to maturity using the effective interest method. All financial liabilities are classified as level
2 per the fair value hierarchy levels.
The fair values of all financial liabilities are considered to be the same as their carrying amounts. For current payables, this is
due to their short-term nature, and for non-current financial liabilities, they have been discounted as described above.
NOTES TO THE CONSOLIDATED FINANCIAL STATEMENTS
31 December 2017 (Expressed in Canadian Dollars)
New Zealand Energy Corp. Year ended 31 December 2017
23
Impairment of financial assets Financial assets, other than those at fair value through profit or loss, are assessed for indicators of impairment at each period-
end. Financial assets are impaired when there is objective evidence that, as a result of one or more events that occurred after
the initial recognition of the financial asset, the estimated future cash flows of the asset have been impacted.
Objective evidence of impairment may include the following:
• Significant financial difficulty of the issuer or counterparty;
• Default or delinquency in interest or principal payments; or
• It has become probable the borrower will enter bankruptcy or financial reorganization.
For financial assets carried at amortized cost, the amount of the impairment is the difference between the asset’s carrying
amount and the present value of the estimated future cash flows, discounted at the financial asset’s original effective interest
rate.
21. CAPITAL RISK MANAGEMENT
The Company’s capital includes share capital, shares subscribed, and the cumulative deficit. The Company’s objectives when
managing capital are to safeguard its ability to continue as a going concern, so it can continue to provide returns for shareholders
and benefits for other stakeholders. The Company manages its capital structure and adjusts it in the light of changes in economic
conditions and the risk characteristics of the underlying assets. The Company’s short-term operating budgets and capital
budgets are reviewed and updated annually and as necessary depending on various factors, including successful capital
deployment. The Company may issue new shares, issue new debt or dispose of interests in assets in order to meet its financial
obligations.
22. FINANCIAL RISK MANAGEMENT
The Company’s activities expose it to a variety of financial risks, including credit risk, liquidity risk, foreign exchange risk, interest
rate risk, price risk and fair value risk. The Company’s overall risk management program focuses on the unpredictability of
financial markets and seeks to minimise potential adverse effects on the financial performance of the Company. This note
presents information about the Company’s exposure to each of these risks, the Company’s objectives and processes for
measuring and managing risk, and the Company’s management of capital. The Board of Directors has overall responsibility for
the establishment and oversight of the Company’s risk management framework.
Credit Risk Credit risk is the risk of potential loss to the Company if the counterparty to a financial instrument fails to meet its contractual
obligations. The Company’s credit risk is primarily attributable to its liquid financial assets including cash and cash equivalents
and trade receivables.
Cash consist of cash deposits that are held with a registered New Zealand bank.
All of the Company’s production is sold directly to a major oil company. The Company has assessed the risk of non-collection
from the buyer as low due to the buyer’s financial condition. Trade receivables reported in the Company’s balance sheet are
aged at or under 30 days and are exposed to the risk of provisional pricing adjustment due to near-term price movements of oil.
Financial receivable from related party is secured by a bank guarantee.
The carrying value of the Company’s cash, and trade receivables represents the maximum exposure to credit risk. There were
no significant amounts past due or impaired as at 31 December 2017.
Liquidity Risk Liquidity risk is the risk the Company will not be able to meet its capital commitments, and other financial obligations as they are
due. The Company’s approach to managing liquidity is to ensure, to the extent possible, that it will have sufficient liquid ity to
meet its liabilities when due without incurring unacceptable losses or risking harm to the Company’s reputation.
The Company’s liquidity is dependent upon maintaining its current working capital balances, operating cash flows and ability to
raise funds. To forecast and monitor liquidity the Company prepares operating and capital expenditure budgets which are
monitored and updated as considered necessary.
At 31 December 2017, the Company had ($331,968) in a revolving credit facility (2016: ($363,183)), and $55,351 in cash (2016:
$57,969) and $8,689 in working capital (2016: $226,866). As disclosed in Note 19, the Company has various ongoing permit
NOTES TO THE CONSOLIDATED FINANCIAL STATEMENTS
31 December 2017 (Expressed in Canadian Dollars)
New Zealand Energy Corp. Year ended 31 December 2017
24
expenditure plans which are associated with the Company’s interest in its exploration and evaluat ion assets. To the extent the
Company elects not to carry out the permit expenditure plans pertaining to a specific permit, the Company stands to forfeit its
interest in the relevant permit.
Management has estimated the Company has sufficient working capital to meet short-term operating requirements. However,
in light of the reliance on ongoing efforts to increase financial capacity and successful completion of development activities,
there is significant doubt about the Company’s ability to continue as a going concern. Refer Note 1, Going Concern.
The following are the expected maturities of financial liabilities and obligations at 31 December 2017:
Less than 1 year 2 to 5 years Thereafter Total $ $ $ $ Accounts payable and accrued liabilities 2,479,380 863,123 - 3,342,503 Revolving credit facility 331,968 - - 331,968
Foreign Exchange Risk The Company operates in New Zealand only. All of the Company’s petroleum sales are denominated in United States dollars
and operational and capital activities related to our properties are transacted primarily in New Zealand dollars and/or United
States dollars with some costs also being incurred in Canadian dollars. Foreign exchange risk arises when the future commercial
transactions, recognized assets and liabilities are denominated in a currency that is not the entity’s functional currency.
The Company currently does not have significant exposure to other currencies and this is not expected to change in the
foreseeable future as the work commitments in New Zealand are expected to be carried out in New Zealand and to a lesser
extent, in United States dollars.
The sensitivity of profit or loss to changes in the USD/NZD exchange rate of an increase in the rate by 10% is a loss of $288,607
(2016: $290,472), and a decrease in the rate of 10% is a gain of $352,742 (2016: $355,022).
Interest Rate Risk Interest rate risk is the risk future cash flows will fluctuate as a result of changes in market interest rates. The Company is
exposed to interest rate fluctuations on its cash and cash equivalents that bear a variable rate of interest. The risk is not
considered significant.
The Company did not have any interest rate swaps or financial contracts with variable interest rates in place during the period
ended 31 December 2017 and any variations in interest rates would not have materially affected net income.
Price Risk The Company is exposed to price movements as part of its operations in relation to the prices received for its oil production.
Such prices may also affect the value of resources properties and the level of spending for future activities. Prices received by
the Company for its production are largely beyond the Company’s control as petroleum prices are impacted by numerous factors,
including, but not limited to, industrial and retail demand, levels of worldwide production, short-term changes in supply and
demand related to speculative activities, forward sales by producers and speculators, and other factors. The Company’s oil
production is priced based on an agreed contract price marker based on spot prices, exposing the Company to the risk of price
movements. The Company has not entered into any hedge instruments and because oil sales are derived from spot prices, the
impact of price risk on the Company’s financial instruments is minimal.
Fair Value Financial instruments recognized at fair value on the consolidated balance sheets must be classified into one of the three
following fair value hierarchy levels:
Level 1 – measurement based on quoted prices (unadjusted) observed in active markets for identical assets or liabilities.
Level 2 – measurement based on inputs other than quoted prices included in Level 1 that are observable for the assets or
liability.
Level 3 – measurement based on inputs that are not observable (supported by little or no market activity) for the assets or
liability.
23. SUBSEQUENT EVENTS
There have been no subsequent events.