consolidated report on indicators of agriculture of agriculture_april_june 2016... · consolidated...
TRANSCRIPT

Consolidated Report on
INDICATORS OF AGRICULTURE
Quarterly Report: April – June 2016
A.V. Manjunatha
Agricultural Development and Rural Transformation Centre (ADRTC)
INSTITUTE FOR SOCIAL AND ECONOMIC CHANGE
Bangalore – 560 072

Quarterly Report: April–June 2016
i
Acknowledgement
The Ministry of Agriculture and Farmers Welfare, Government of India, as
well as the National Institution for Transformation of India (NITI), intend to
know the agriculture situation in different States using various agricultural
indicators. Thirteen Agro Economic Research Centres (AERCs) spread across the
Country are supposed to collect the required information for the State under
their jurisdiction quarterly and submit the data to the Agricultural Development
and Rural Transformation Centre (ADRTC) of the Institute for Social and
Economic Change (ISEC), Bangalore. The ADRT Centre has to prepare a
consolidated report for all the major States in the country and submit the report
for every quarter of the year. We are grateful to the Ministry of Agriculture
and Farmers Welfare, Government of India, for reposing confidence in the ADRT
Centre, and assigning the responsibility for co-ordination of the study and
consolidation of data/information on agricultural indicators for States.
We are grateful to Prof. M.G. Chandrakanth, Director, Institute for Social
and Economic Change (ISEC), Bangalore, for his encouragement and support for
this work. We also thank Ms. Prema Kumari and Mr. Keshava Murthy for involving
in consolidation of the report. We will be failing in our duty if we do not thank our
colleagues from various AERCs for compiling the data from various sources for
the States under their jurisdiction and transmitting the same to facilitate
consolidation of the quarterly reports at ISEC.
A.V. Manjunatha

Quarterly Report: April–June 2016
ii
Table of Contents
Acknowledgement ............................................................................................................................... i
List of Figures ..................................................................................................................................... iii
1. Average Rainfall ............................................................................................................................. 2
2. Percentage of Districts Received Deficit Rainfall ............................................................... 4
3. Area Covered Under Major Crops ............................................................................................ 5
4. Incidence of Major Pests and Diseases in Principal Crops Sown .................................. 8
5. Farm Output Prices of Major Crops ......................................................................................... 8
6. Seed Availability in the Local Market for Major Crops ..................................................... 9
7. Prevailing Market Price of Seeds of Major Crops ............................................................... 9
8. Chemical Fertilizer (NPK) Availability in the Local Market ......................................... 10
9. Prevailing Market Prices of Fertilizers ................................................................................ 11
10. Availability of Agricultural Labourers .............................................................................. 11
11. Prevailing Wage Rate for Casual Labourers in Agriculture ....................................... 12
12. Availability of Institutional Credit for Agriculture in the State ................................ 13
13. Electricity Availability for Irrigation Pump sets ............................................................ 13
14. Availability of Farm Machinery for Timely Sowing, Harvesting and Other
Operations .......................................................................................................................................... 13
15. Availability of Organic Manure, Farm-Yard-Manure, Vermin Compost, Bio
Fertilizer ............................................................................................................................................. 14
Filled in Questionnaires of Different States ........................................................................... 15
Quarterly Report: April–June 2016
iii
List of Figures
Figure 1: State wise Distribution of Actual and Normal Rainfall (in mm)
which have received Rainfall in Excess of the Normal…………………………………… 3
Figure 2: State wise Distribution of Actual and Normal Rainfall (in mm)
which have received Rainfall Less than Normal…………………………………………….. 4
Figure 3: Districts Received Deficit Rainfall as per cent to Total Districts of
State........................................................................................................................................... 5
Figure 4: Area covered under Major Crops in 1st quarter of last 5 years as per
cent to Targeted Area……………………………………………………………………………… 6
Figure 5: State-wise Area covered under Major Crops as per cent to Targeted
Area……………………………………………………………………………………………………………….. 7
Figure 6: Area covered under Different Crops (Area in lakh hectares)………….. 8
Figure 7: Prevailing Market Price of Fertilizer (Rs. per Kg)………………………..... 11
Figure 8: Prevailing Wage Rate for Casual Labourers in Agriculture (Rs. per
day)……………………………………………………………………………………………………………….. 12
Quarterly Report: April–June 2016
1
AGRICULTURAL INDICATORS
Agriculture plays a vital role in India’s economy. Over 58 per cent of the rural households
depend on agriculture as their principle means of livelihood. The Agriculture and allied
sectors are contributing approximately 16.1 per cent of the nation’s GDP, 10 per cent of
its exports as at the end of 2014-15. About half of the population still depends on
agriculture as its primary source of income (GoI, 2014-15). There has been an increase in
the share of agriculture and allied sectors in the GDP from 13.9 per cent in 2013-14 to
16.1 per cent in 2014-15 (at constant 2011-12 prices). This increasing trend in the GDP of
agriculture and allied sectors is not surprising and is expected in a fast growing and
changing economy (GoI, 2014-15). During FY 2016, agriculture and allied sectors grew at
an annual average growth rate of 1.9 per cent and contributed 14.2 per cent to the GVA.
The production of food grains increased by about five times in 2014-15 (252.68 million
tons) as compared with 1950-51 (50.82 million tons). This increase in the food grain
production resulted mainly from productivity gains rather than expansion of cultivated
area.
The NITI Aayog, Government of India desired Agricultural Development and Rural
Transformation Centre (ADRTC), Institute for Social and Economic Change (ISEC),
Bangalore, to undertake study on “Indicators of Agriculture”. This report is compiled
from data furnished by Agro-Economic Centers (AERCs) located across India. The data
refers to the period April to June 2016. The basic data about agricultural indicators were
received from nineteen States, namely Andhra Pradesh, Arunachal Pradesh, Assam, Bihar,
Gujarat, Himachal Pradesh, Jharkhand, Karnataka, Madhya Pradesh, Manipur, Meghalaya,
Mizoram, Nagaland, Punjab, Rajasthan, Tamil Nadu, Tripura, Uttar Pradesh and West
Bengal. About 15 agriculture related indicators were selected for this study which is as
under:

Quarterly Report: April–June 2016
2
1. Average Rainfall
2. Number of districts received deficit rainfall in the State
3. Area covered under major crops
4. Incidence of major pests and diseases in principal crops
5. Farm output prices of major crops
6. Seed availability in the local market for major crops
7. Prevailing market price of seed of major crops
8. Chemical fertilizer (NPK) availability in the local market
9. Prevailing market price of fertilizers
10. Availability of agricultural labourers
11. Prevailing wage rate for casual labourers in agriculture
12. Availability of institutional credit for agriculture in the State
13. Electricity availability for irrigation pump sets
14. Availability of farm machinery for timely sowing, harvesting and other operations
15. Availability of organic manure, farmyard manure, vermi compost and bio-
fertilizers
1. Average Rainfall
The overall rainfall status for 2nd quarter of 2016, as per the data received for 19 states
from AERCs indicated that six states received rainfall in excess of their normal rainfall
and the remaining thirteen states received rainfall lower than their normal rainfall. The
excess rainfall was observed mainly in North-Western and Southern India comprising
Punjab, Rajasthan, Uttar Pradesh, Assam, Andhra Pradesh and Tamil Nadu states. Uttar
Pradesh and Assam received less rainfall than the normal during the corresponding
quarter of previous year. However, Tamil Nadu, Rajasthan and Punjab received excess
rainfall in the second quarter of 2015. All the North-Eastern states of the country had
rainfall less than the normal except Assam. Among the southern states, only Karnataka
had received rainfall less than the normal. The comparative figures for actual and normal
Quarterly Report: April–June 2016
3
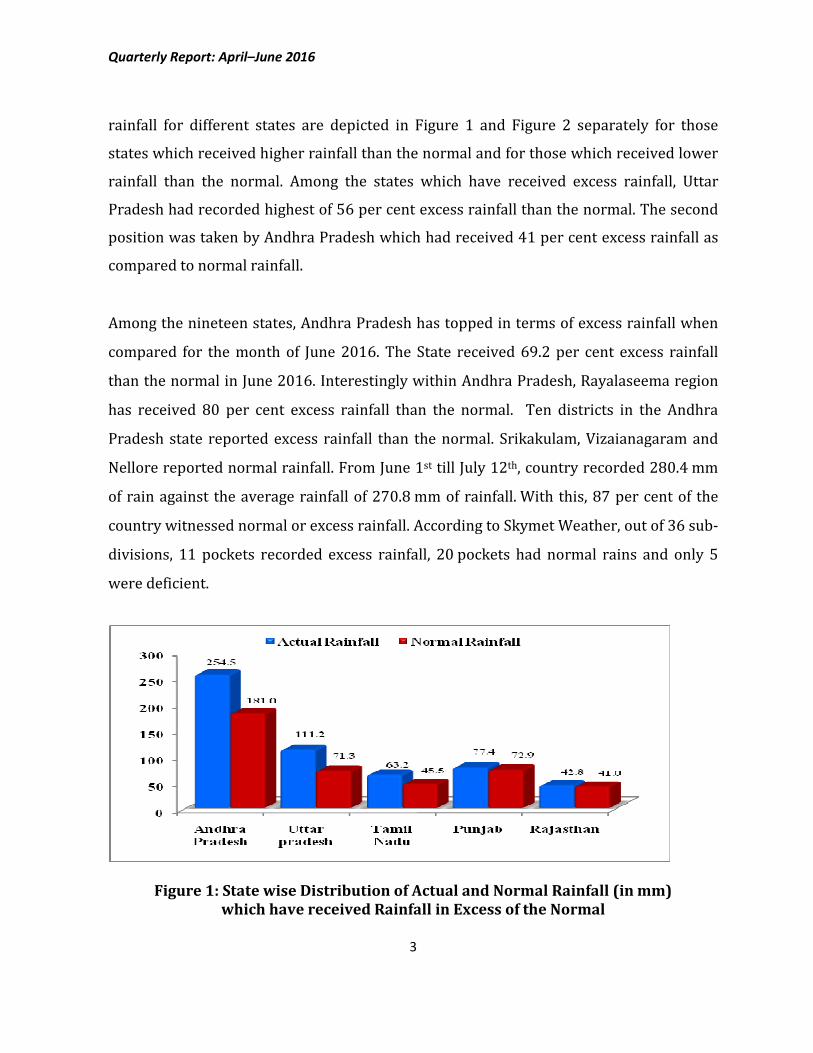
rainfall for different states are depicted in Figure 1 and Figure 2 separately for those
states which received higher rainfall than the normal and for those which received lower
rainfall than the normal. Among the states which have received excess rainfall, Uttar
Pradesh had recorded highest of 56 per cent excess rainfall than the normal. The second
position was taken by Andhra Pradesh which had received 41 per cent excess rainfall as
compared to normal rainfall.
Among the nineteen states, Andhra Pradesh has topped in terms of excess rainfall when
compared for the month of June 2016. The State received 69.2 per cent excess rainfall
than the normal in June 2016. Interestingly within Andhra Pradesh, Rayalaseema region
has received 80 per cent excess rainfall than the normal. Ten districts in the Andhra
Pradesh state reported excess rainfall than the normal. Srikakulam, Vizaianagaram and
Nellore reported normal rainfall. From June 1st till July 12th, country recorded 280.4 mm
of rain against the average rainfall of 270.8 mm of rainfall. With this, 87 per cent of the
country witnessed normal or excess rainfall. According to Skymet Weather, out of 36 sub-
divisions, 11 pockets recorded excess rainfall, 20 pockets had normal rains and only 5
were deficient.
Figure 1: State wise Distribution of Actual and Normal Rainfall (in mm)
which have received Rainfall in Excess of the Normal

Quarterly Report: April–June 2016
4
Figure 2: State wise Distribution of Actual and Normal Rainfall (in mm)
which have received Rainfall Less than Normal
2. Percentage of Districts Received Deficit Rainfall
The rainfall data received for 19 states represented for 455 districts in the nineteen
states. More than 30 per cent of these districts have not received sufficient rainfall, and
hence they have been classified as districts with deficit rainfall. The situation is worse
when compared to the same quarter of the previous year 2015 where only 21 per cent of
the districts have reported deficit rainfall. It is to note that, none of the districts of Andhra
Pradesh had received deficit rainfall in this quarter. Around 84 per cent of districts of
West Bengal state had received deficit rainfall. The deficit rainfall was observed in 13 per
cent and 25 per cent of districts of Uttar Pradesh and Tamil Nadu, respectively. This is
despite of the state receiving 56 per cent and 39 per cent excess rainfall than the normal
in Uttar Pradesh and Tamil nadu. In case of Gujarat and Karnataka except for six districts
in each of the state, all the districts received surplus rainfall. However, the overall rainfall
received in these two states was in deficit as compared to normal rainfall. Around 58 per
cent districts of Jharkhand and 55 per cent of districts of Rajasthan had deficit rainfall
Quarterly Report: April–June 2016
5
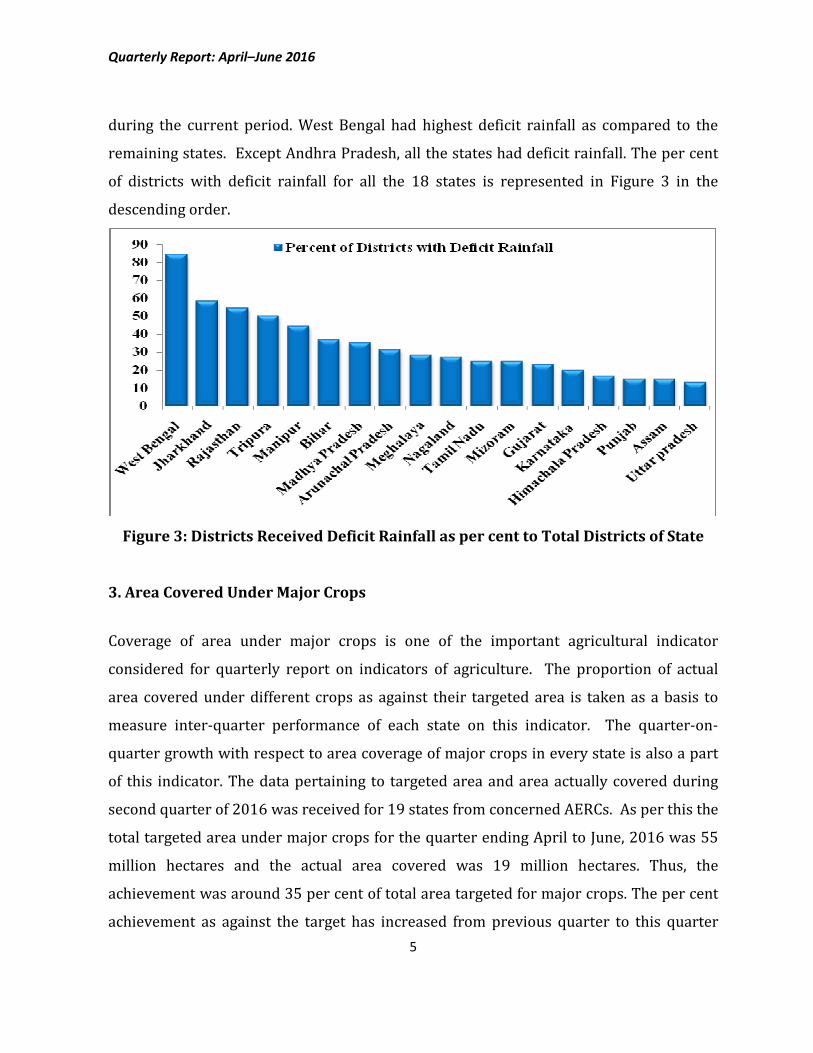
during the current period. West Bengal had highest deficit rainfall as compared to the
remaining states. Except Andhra Pradesh, all the states had deficit rainfall. The per cent
of districts with deficit rainfall for all the 18 states is represented in Figure 3 in the
descending order.
Figure 3: Districts Received Deficit Rainfall as per cent to Total Districts of State
3. Area Covered Under Major Crops
Coverage of area under major crops is one of the important agricultural indicator
considered for quarterly report on indicators of agriculture. The proportion of actual
area covered under different crops as against their targeted area is taken as a basis to
measure inter-quarter performance of each state on this indicator. The quarter-on-
quarter growth with respect to area coverage of major crops in every state is also a part
of this indicator. The data pertaining to targeted area and area actually covered during
second quarter of 2016 was received for 19 states from concerned AERCs. As per this the
total targeted area under major crops for the quarter ending April to June, 2016 was 55
million hectares and the actual area covered was 19 million hectares. Thus, the
achievement was around 35 per cent of total area targeted for major crops. The per cent
achievement as against the target has increased from previous quarter to this quarter

Quarterly Report: April–June 2016
6
which can be clearly seen in Figure 4. For some states like Haryana, Chhattisgarh,
Maharashtra and Uttarakhand data was not received for the second quarter of current
year. Few States of North eastern India had not provided data for last three years. This
was another reason for variations in overall per cent in achievement.
Figure 4: Area covered under Major Crops in 2nd quarter of last 5 years as
per cent to Targeted Area
The performance of states, on the basis of per cent achievement to targeted area, within
this quarter is presented in Figure 5. Punjab is the only state which has recorded more
than hundred per cent achievement during this quarter. There are instances of states
namely, Arunachal Pradesh, Assam, Himachal Pradesh, Manipur, Meghalaya and Tripura
which have crossed 80 per cent of the targeted area of major crops.

Quarterly Report: April–June 2016
7
Figure 5: State-wise Area covered under Major Crops as per cent to Targeted Area
The percent of area under cereals, pulses, oilseeds and other crops is presented in Figure
6. Cereals are the most important group of crops covered in the second quarter of 2016
invariably in all the 19 states for which data was received. Cereals covered around 72 per
cent of the total area covered under major crops. Among the cereals, area under Paddy
was the highest not only under cereals but among all the crops. It accounted for 53 per
cent of area under cereals and 38 per cent total area under major crops. Wheat was
another cereal crop which claimed 25 per cent of area under cereals and 18 per cent of
total area under major crops. The share of pulses and oil seeds in the total area covered
under major crops was 10.37 and 9.01 per cent, respectively. Gram, Moong, Green gram
and Urd were the main pulse crops. Some horticultural crops like vegetables, cash crops
like sugarcane, jute and cotton were the other major crops sown during second quarter of
2016 period. These crops accounted for 9 per cent of the total area covered and were
sown in very few states for which data was received. The area covered under cereals,
pulses and other crops is given in figure 6.

Quarterly Report: April–June 2016
8
Figure 6: Area covered under Different Crops (Area in lakh hectares)
4. Incidence of Major Pests and Diseases in Principal Crops Sown
The incidence of major pests and diseases in principle crops were found to be moderate
in Assam, Arunachal Pradesh, Manipur, Meghalaya, Mizoram, Nagaland and Tripura. The
incidence was low in the case of Gujarat, Karnataka, Punjab, Tamil Nadu, Uttar Pradesh
and West Bengal. It is quite interesting to note that there was no attack of pests on
principal crops in the states of Bihar, Himachal Pradesh, Jharkhand, Madhya Pradesh and
Rajasthan as reported by the respective AERCs.
5. Farm Output Prices of Major Crops
Farm output prices of major crops across different States have shown wide variations.
For instance, price of paddy was highest in Jharkhand (Rs. 2400/qtl) and lowest in
Tripura (Rs. 1250/qtl). The price of Maize varied between Rs. 4750/qtl in Uttar Pradesh
and Rs. 1050/qtl in Bihar and Jharkhand. The price of wheat was highest in Rajasthan
(Rs. 1625/qtl) and lowest in Bihar and Jharkhand (Rs. 1300/qtl). The prices varied

Quarterly Report: April–June 2016
9
depending upon the type of produce i.e. Hybrid or HYV, time of sale i.e. immediately after
harvesting or after few months of harvesting, where it was sold and such other factors.
6. Seed Availability in the Local Market for Major Crops
Seeds are available in Andhra Pradesh, Bihar, Gujarat, Himachal Pradesh, Jharkhand,
Karnataka, Madhya Pradesh, Punjab, Rajasthan, Tamil Nadu, Uttar Pradesh and West
Bengal and no shortage has been reported in these States. The shortage of seeds is
reported for the States of Assam, Arunachal Pradesh, Manipur, Meghalaya, Mizoram,
Nagaland and Tripura.
7. Prevailing Market Price of Seeds of Major Crops
The market prices of seeds of major crops prevailed during the period from April 2016 to
June 2016 and as received from concerned AERCs are presented in Table 1. The prices
depended on the type of seed i.e. Hybrid or HYV; source of purchase i.e. open market or
from departments with subsidy, selling of seeds in terms of bags or loose and such other
factors. Hence, the prices varied very widely as can be seen in Table 1. The seed prices of
other crops like oilseeds, pulses which were sown in few states is in questionnaires filled
by the AERCs for the respective states.

Quarterly Report: April–June 2016
10
Table 1: Market Prices of Seeds of Major Crops (Amount in Rs./kg)
States Paddy Maize Remarks
Andhra Pradesh 280 200-300
Arunachal Pradesh 21.5 18.5
Assam 22 20
Bihar (Hybrid) 300 250
Gujarat 15-300 45-150
Himachal Pradesh 250 71.5
Jharkhand (Hybrid) 300 250
Karnataka 25.63 163.67
Madhya Pradesh 33 32.65
Manipur 20 18
Meghalaya 23 20
Mizoram 20.50 17.5
Nagaland 20.5 18
Punjab 35-40 175-350(hybrid)
Rajasthan
Crop not
sown
Crop not sown
Given for other
crops, Moong(105
Rs/kg), Urad
(140Rs./kg)
Tamil Nadu NA NA
Tripura 21.5 17.5
Uttar Pradesh 30-300 60-110
West Bengal 25-30 15 Source: AERCs of respective states
8. Chemical Fertilizer (NPK) Availability in the Local Market
Supply of chemical fertilizers namely, Urea, SSP and DAP was adequate in Andhra
Pradesh, Bihar, Gujarat, Himachal Pradesh, Jharkhand, Karnataka, Madhya Pradesh,
Punjab, Rajasthan, Tamil Nadu, Uttara Pradesh and West Bengal. On the contrary, Assam,
Arunachal Pradesh, Manipur, Meghalaya, Mizoram, Nagaland and Tripura had
experienced scarcity of Chemical Fertilizers except Urea. There was no deficit with
respect to Urea because of the mandatory policy for the supply neem coated urea to the
farmers by the central government.

Quarterly Report: April–June 2016
11
9. Prevailing Market Prices of Fertilizers
Prevailing Market Price of Fertilizer are given in Figure 7. The prices of fertilizers are
relatively higher in West Bengal (Urea - Rs. 9.75/kg, DAP - Rs. 29.00/kg and SSP - Rs.
11.00/kg). The prices of Urea (Nitrogenous fertilizer) ranged from Rs. 5.16/kg in
Himachal Pradesh to Rs. 9.75/kg in West Bengal. Similarly, prices of DAP varied between
Rs. 10.38/kg in Himachal Pradesh and Rs. 29.00/kg in West Bengal. The prices of SSP
varied between Rs. 6.47/kg in Madhya Pradesh and Rs. 11.00/kg in West Bengal.
Figure 7: Prevailing Market Price of Fertilizer (Rs. per Kg)
Note: Data not received from Punjab for the SSP fertilizer
10. Availability of Agricultural Labourers
In the States of Andhra Pradesh, Himachal Pradesh, Madhya Pradesh and Tamil Nadu
agricultural labourers were easily available. However, shortage of Agricultural labourers
was reported in Assam, Arunachal Pradesh, Bihar, Gujarat, Jharkhand, Karnataka,

Quarterly Report: April–June 2016
12
Manipur, Meghalaya, Mizoram, Nagaland, Punjab, Rajasthan, Tripura, Uttar Pradesh and
West Bengal.
11. Prevailing Wage Rate for Casual Labourers in Agriculture
Prevailing wage rate for casual labourers in agriculture is presented in Figure 8. It is
noticed from the figure that that male and female laborers had received same wage rates
in Himachal Pradesh and West Bengal. In the remaining States, the wage rates of males
were relatively higher than the females. Further, there was also variation in wage rates
among most of the States. For instance, the wage rate was Rs. 235/day and Rs. 150/day in
West Bengal and Himachal Pradesh for both male and female, respectively.
Figure 8: Prevailing Wage Rate for Casual Labourers in Agriculture (Rs. per day)
Note: Data not received from Punjab for the Female wage rate
Quarterly Report: April–June 2016
13
12. Availability of Institutional Credit for Agriculture in the State
Targets will be fixed annually for the credit disbursement to agricultural sector in India.
The data about targets and achievements for most of the States are not available. Only
twelve States have provided the information about targets and achievements of
institutional agricultural credit. On the basis of this data, it has been observed that
Karnataka and Tamil Nadu had achieved about 135 per cent and 106 per cent of the
target flow of institutional credit to agriculture, respectively. The achievement was 98 per
cent, 96 per cent, 95 per cent and 78 per cent of the target in the case of Punjab, West
Bengal, Himachal Pradesh and Madhya Pradesh, respectively. The remaining States
namely, Andhra Pradesh, Assam, Bihar, Jharkhand, Manipur and Uttar Pradesh achieved
less than 35 per cent of the target in the respective States.
13. Electricity Availability for Irrigation Pump sets
Out of nineteen States, ten States have furnished the data on per day availability of
electricity for agricultural purposes. Results showed that the electricity was available for
20 hrs in Himachal Pradesh, 13 hours in Uttar Pradesh, 8 hrs in Madhya Pradesh, 7 to 8
hrs in Andhra Pradesh, Bihar, Gujarat and Jharkhand, 6 to 7 hrs in Punjab, 5 to 6 hrs in
Rajasthan and 4 hrs in Karnataka. On an average, the availability of power was about 9
hours per day.
14. Availability of Farm Machinery for Timely Sowing, Harvesting and Other
Operations
Farm machinery is easily available in the States of Andhra Pradesh, Gujarat, Himachal
Pradesh, Karnataka, Madhya Pradesh, Punjab, Rajasthan and Uttara Pradesh for timely
sowing, harvesting and other operations. Shortage of farm machinery was reported in
Assam, Arunachal Pradesh, Bihar, Jharkhand, Manipur, Meghalaya, Mizoram, Nagaland,
Tamil Nadu, Tripura and West Bengal.

Quarterly Report: April–June 2016
14
15. Availability of Organic Manure, Farm-Yard-Manure, Vermin Compost, Bio
Fertilizer
The results indicated that the availability of organic manure, farmyard manure, vermi
compost and bio-fertilizers was reported as adequate in Andhra Pradesh, Gujarat,
Jharkhand, Karnataka, Rajasthan, Tamil Nadu, Uttar Pradesh and West Bengal. States
such as Assam, Arunachal Pradesh, Bihar, Himachal Pradesh, Madhya Pradesh, Manipur,
Meghalaya, Mizoram, Nagaland, Punjab and Tripura had faced shortage of organic
manure.

Quarterly Report: April–June 2016
15
Filled in Questionnaires of Different States
Agro-Economic Research Centre, Andhra University
Indicators of Agriculture Performance
Compiled for the Planning Commission
Name of AERC: Visakhapatnam State: Andhra Pradesh Quarter Covered: Apr-Jun 2016
Sl. No. Indicators Current status
1 Average Rainfall (mm) Actual Normal
254.5 181.0
2 No of districts received deficit rainfall
in the state
No of districts with deficit
rainfall
Total number of
districts
Nil 13
3 Area covered under major crops Sl.
no.
Name of the
crop
Actual area
( Lakh ha)
Targeted area
(Lakh ha)
1 Rice 8.45 17.50
2 Other cereals 0.17 4.01
3 Pulses 0.86 4.90
4 Oilseeds 2.57 9.45
4 Incidence of major pests and diseases
in principal crops sown (√)
Sl.
no.
Name of the
Crop
Severe Moderate Low Not
at
all
1 Paddy
2 Non Paddy
5 Farm output price of major crops Sl.
no.
Name of the crop Price (Rs. per
quintal)
1 Paddy (Common) 1450
2 Paddy (Grade A) 1450
3 Maize 1325
4 Ragi 1650
5 Groundnut 4030
6 Moong 4650
7 Biri 4425
8 Wheat 1525
9 Arhar 4425
10 Gram 3425
11 Til 4700
12 Mustard 3350
Quarterly Report: April–June 2016
16
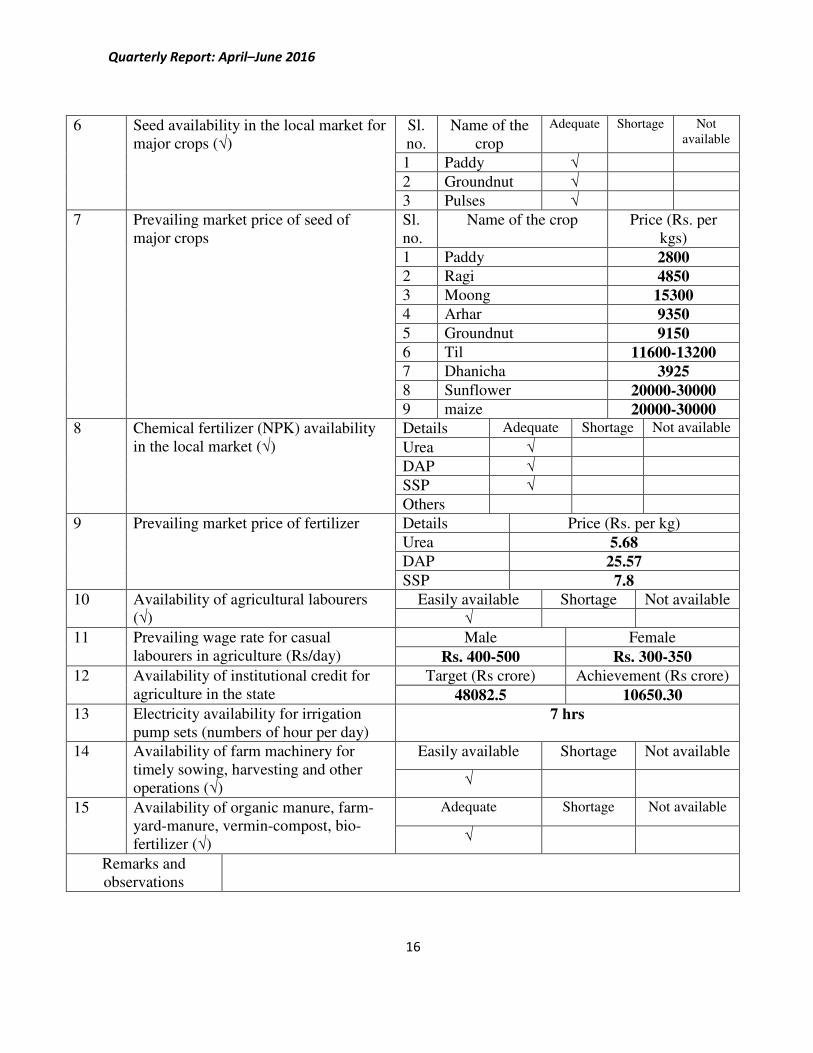
6 Seed availability in the local market for
major crops (√)
Sl.
no.
Name of the
crop
Adequate Shortage Not
available
1 Paddy √
2 Groundnut √
3 Pulses √
7 Prevailing market price of seed of
major crops
Sl.
no.
Name of the crop Price (Rs. per
kgs)
1 Paddy 2800
2 Ragi 4850
3 Moong 15300
4 Arhar 9350
5 Groundnut 9150
6 Til 11600-13200
7 Dhanicha 3925
8 Sunflower 20000-30000
9 maize 20000-30000
8 Chemical fertilizer (NPK) availability
in the local market (√)
Details Adequate Shortage Not available
Urea √
DAP √
SSP √
Others
9 Prevailing market price of fertilizer Details Price (Rs. per kg)
Urea 5.68
DAP 25.57
SSP 7.8
10 Availability of agricultural labourers
(√)
Easily available Shortage Not available
√
11 Prevailing wage rate for casual
labourers in agriculture (Rs/day)
Male Female
Rs. 400-500 Rs. 300-350
12 Availability of institutional credit for
agriculture in the state
Target (Rs crore) Achievement (Rs crore)
48082.5 10650.30
13 Electricity availability for irrigation
pump sets (numbers of hour per day) 7 hrs
14 Availability of farm machinery for
timely sowing, harvesting and other
operations (√)
Easily available Shortage Not available
√
15 Availability of organic manure, farm-
yard-manure, vermin-compost, bio-
fertilizer (√)
Adequate Shortage Not available
√
Remarks and
observations

Quarterly Report: April–June 2016
17
Indicators of Agriculture Performance
Compiled for the Planning Commission
Name of AERC: Jorhat State: Assam Quarter Covered: Apr - Jun 2016
Sr.
No.
Indicators
Current Status
1 Average Rainfall (mm) Actual Normal
1030.05 944.40
2 No. of districts received deficit No of districts with Total number of
rainfall in the State deficit rainfall districts
4 27
3
Area covered under major
crops
Sr.
no.
Name of the crop
Actual area
(lakh ha)
Targeted area
(Lakh ha)
1 Paddy 25.03 29.60
2 Pulses 1.50 2.00
3 Maize 0.24 0.90
4 Jute 0.70 1.22
5 Sugarcane 0.29 0.45
4 Incidence of major pests and Sr. Name of the Crop Severe Moderate Low Not at all
Diseases in principal crops no.
Sown(ha) 1 Paddy √
2 Pulses √
3 Maize √
4 Jute √
5 Sugarcane √
5 Farm output price of major Sr. Name of the crop
Price
(Rs. per quintal)
crops no.
1 Paddy 1310.00
2 Pulses 3700.00
3 Maize 1280.00
4 Jute 2300.00
5 Sugarcane 230.00
6
Seed availability in the local
market for major crops
Sr. Name of the crop Adequate Shortage Not available
no.
1 Paddy √
2 Pulses √
3 Maize √
4 Jute √
5 Sugarcane √

Quarterly Report: April–June 2016
18
7
Prevailing market price of Sr. Name of the crop
Price(Rs. per kg)
seed(certified) of major crops no.
1 Paddy 22.00
2 Pulses 140.00
3 Maize 20.00
4 Jute 85.00
5 Sugarcane 30.00
8 Chemical Fertilizer( NPK) Details Adequate Shortage Not available
availability in the local market Urea √
DAP √
SSP √
Others √
9 Prevailing market price of
fertilizer
Details
Price(Rs. per kgs)
Urea 8.00
DAP 22.00
SSP 10.00
Others 15.00 - 18.00
10 Availability of agricultural Easily available Shortage Not available
labours
√
11 Prevailing wage rate for Male Female
casual labourers in agriculture Rs. 250.00 Rs. 170.00
( Rs/day)
12 Availability of institutional Target (Rs. in Crore) Achievement (Rs. in Crore)
credit for agriculture in the
State* 11910.33 3901.29
13
Electricity available for
irrigation pump sets NA
( numbers of hour per day)
14 Availability of farm machinery Easily available Shortage Not available
for timely sowing, harvesting
√ and other operations
15 Availability of organic manure, Adequate Shortage Not available
farm-yard manure, vermin-
√
compost, bio-fertilizer
Remarks and
observations

Quarterly Report: April–June 2016
19
Indicators of Agriculture Performance
Compiled for the Planning Commission
Name of AERC: Jorhat State: Arunachal Pradesh Quarter Covered: Apr – Jun 2016
Sr.
No.
Indicators
Current Status
1 Average Rainfall (mm) Actual Normal
610.11 671.50
2 No. of districts received deficit No of districts with Total number of
rainfall in the State deficit rainfall districts
5 16
3
Area covered under major
crops
Sr.
no.
Name of the crop
Actual area
(lakh ha)
Targeted area
(Lakh ha)
1 Paddy 1.30 1.50
2 Oilseeds 0.04 0.06
3 Pulses 0.07 0.08
4 Maize 0.47 0.53
5 Sugarcane 0.02 0.03
4 Incidence of major pests and Sr. Name of the Crop Severe Moderate Low Not at all
Diseases in principal crops no.
Sown(ha) 1 Paddy √
2 Oilseeds √
3 Pulses √
4 Maize √
5 Sugarcane √
5 Farm output price of major Sr. Name of the crop
Price
(Rs. per quintal)
crops no.
1 Paddy 1300.00
2 Oilseeds 2900.00
3 Pulses 3600.00
4 Maize 1285.00
5 Sugarcane 235.00
6 Seed availability in the local Sr. Name of the crop Adequate Shortage Not available
market for major crops no.
1 Paddy √
2 Oilseeds √
3 Pulses √
4 Maize √
5 Sugarcane √

Quarterly Report: April–June 2016
20
7
Prevailing market price of Sr. Name of the crop
Price(Rs. per kg)
seed(certified) of major crops no.
1 Paddy 21.50
2 Oilseeds 130.00
3 Pulses 150.00
4 Maize 18.50
5 Sugarcane 30.00
8 Chemical Fertilizer( NPK) Details Adequate Shortage Not available
availability in the local market Urea √
DAP √
SSP √
Others √
9 Prevailing market price of
fertilizer
Details
Price(Rs. per kgs)
Urea 7.50
DAP 22.00
SSP 8.00
Others 15.00 - 20.00
10 Availability of agricultural Easily available Shortage Not available
labours
√
11 Prevailing wage rate for Male Female
casual labourers in agriculture Rs. 230.00 Rs. 150.00
( Rs/day)
12 Availability of institutional Target (Rs. in Crore) Achievement (Rs. in Crore)
credit for agriculture in the
State* NA NA
13
Electricity available for
irrigation pump sets NA
( numbers of hour per day)
14 Availability of farm machinery Easily available Shortage Not available
for timely sowing, harvesting
√ and other operations
15 Availability of organic manure, Adequate Shortage Not available
farm-yard manure, vermin-
√
compost, bio-fertilizer
Remarks and
observations

Quarterly Report: April–June 2016
21
AGRO-ECONOMIC RESEARCH CENTRE FOR BIHAR & JHARKHAND (Ministry of Agriculture, Government of India)
T M BHAGALPUR UNIVERSITY, BHAGALPUR – 812 007
Name of AERC: Bhagalpur State: BIHAR Quarter Covered: Apr - Jun 2016
Sl. No. Indicators Current status
1 Average Rainfall (mm) Actual Normal
190 229
2 No of districts received deficit rainfall in
the state
No of districts with deficit
rainfall
Total number of
districts
14 38
3 Area covered under major crops Sl.
no.
Name of the
crop
Actual area
( Lakh ha)
Targeted area
(Lakh ha)
1 Maize 1.70 2.50
2 Moong 4.75 6.35
3 Paddy 0.85 1.50
4 Sunflower 0.95 0.15
5 Til 0.02 0.03
4 Incidence of major pests and diseases in
principal crops sown (√)
Sl.
no.
Name of the
Crop
Severe Moderate Low Not
at
all
1 Maize √
2 Moong √
3 Paddy √
4 Sunflower √
5 Til √
5 Farm output price of major crops Sl.
no.
Name of the crop Price (Rs. per
quintal)
1 Rice (Medium) 2300.00
2 Wheat 1300.00
3 Maize 1050.00
4 Lentil 7000.00
5 Arhar 9000.00
6 Seed availability in the local market for
major crops (√)
Sl.
no.
Name of the
crop
Adequate Shortage Not
available
1 Maize √
2 Moong √
3 Paddy √
4 Sunflower √
5 Til √

Quarterly Report: April–June 2016
22
7 Prevailing market price of seed of major
crops
Sl.
no.
Name of the crop Price (Rs. per kgs)
1 Paddy (Hybrid) 300
2 Maize (Hybrid) 250
3 Moong 75
4 Til 65
5 Sunflower 40
8 Chemical fertilizer (NPK) availability in
the local market (√)
Details Adequate Shortage Not available
Urea √
DAP √
SSP √
Others √
9 Prevailing market price of fertilizer Details Price (Rs. per kg)
Urea 7.00
DAP 13.00
SSP 10.00
Others 11.00
10 Availability of agricultural labourers (√) Easily available Shortage Not available
√
11 Prevailing wage rate for casual labourers in
agriculture (Rs/day)
Male Female
200 100
12 Availability of institutional credit for
agriculture in the state
Target (Rs. crore) Achievement (Rs. crore)
61656(Annual) 12320(Approx.)
13 Electricity availability for irrigation pump
sets (numbers of hour per day)
7-8 hrs.(approx.)
14 Availability of farm machinery for timely
sowing, harvesting and other operations
(√)
Easily available Shortage Not available
√
15 Availability of organic manure, farm-yard-
manure, vermin-compost, bio-fertilizer (√)
Adequate Shortage Not available
√
Remarks and observations
Note: Data shall be collected quarterly consisting of 1st quarter – Jan to March; 2nd Quarter – April to
June; 3rd Quarter – July to September and 4th Quarter – October to December.
The Agro Centers shall provide the quarterly data immediately in the following week and ADRTC, after
verification, shall compile the All India Report and submit the quarterly All India Report to the Ministry
by the 2nd week after the end of the quarter. Timely submission by the Agro Centres is indispensable for
ADRTC to comply with the above time schedule.

Quarterly Report: April–June 2016
23
Agro-Economic Research Centre, Vallabh Vidyanagar
Indicators of Agriculture Performance
Compiled for the Planning Commission
Name of AERC: VV Nagar State: Gujarat Quarter Covered: Apr - Jun 2016
Sr.
No Indicators Current status
1 Average Rainfall (mm)
(01.06.2016 to 03.07.2016)
Actual Normal
51.1 128.2
2 No of districts received deficit rainfall in
the state (01.06.2016 to 3.07.2016)
No of districts with
deficit rainfall
Total number of districts
6 26
3 Area covered under major crops during
2015 (as on 27.06.2016)
(Source: http://dag.gujarat.gov.in)
Sr.
No
Name of the
crop
Actual Area
(ha.)
Target Area
(ha.)*
1 Paddy 17800 62400
2 Bajra 2600 22100
3 Jowar 0 15100
4 Maize 6600 107500
5 Tur 20000 47700
6 Moong 0 7700
7 Moth 0 400
8 Urad 300 15700
9 Groundnut 108200 879000
10 Sesamum 0 24100
11 Castor 600 2700
12 Soyabean 1300 40800
13 Cotton 327400 1480900
14 Guvar Seed 0 7400
15 Vegetable 18100 44300
16 Fodder 51700 141100
4 Incidence of major pests and diseases in
principal crops sown (√)
Sr.
No
Name of
the Crop
Severe Moderat
e
Low Not at
all
1 Paddy √
2 Bajra √
3 Jowar √
4 Maize √
5 Tur √
6 Moong √
7 Moth √
8 Urad √
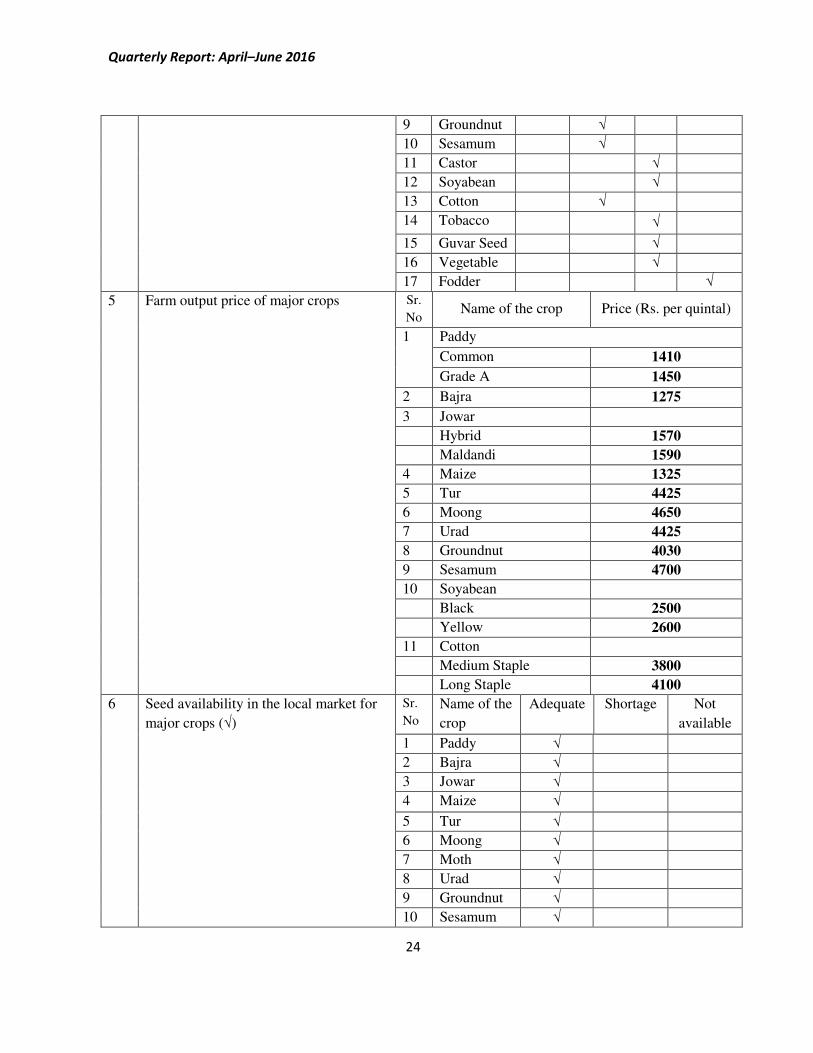
Quarterly Report: April–June 2016
24
9 Groundnut √
10 Sesamum √
11 Castor √
12 Soyabean √
13 Cotton √
14 Tobacco √
15 Guvar Seed √
16 Vegetable √
17 Fodder √
5 Farm output price of major crops
Sr.
No Name of the crop Price (Rs. per quintal)
1 Paddy
Common 1410
Grade A 1450
2 Bajra 1275
3 Jowar
Hybrid 1570
Maldandi 1590
4 Maize 1325
5 Tur 4425
6 Moong 4650
7 Urad 4425
8 Groundnut 4030
9 Sesamum 4700
10 Soyabean
Black 2500
Yellow 2600
11 Cotton
Medium Staple 3800
Long Staple 4100
6
Seed availability in the local market for
major crops (√)
Sr.
No
Name of the
crop
Adequate Shortage Not
available
1 Paddy √
2 Bajra √
3 Jowar √
4 Maize √
5 Tur √
6 Moong √
7 Moth √
8 Urad √
9 Groundnut √
10 Sesamum √

Quarterly Report: April–June 2016
25
11 Castor √
12 Soyabean √
13 Cotton √
14 Tobacco √
15 Guar √
16 Vegetables √
17 Fodder √
7 Prevailing market price of seed of major
crops
Sr.
No
Name of the crop Price (Rs per kg)
1 Paddy 15-300
2 Bajra 90-325
3 Jowar 20-70
4 Maize 45-150
5 Tur 70-200
6 Moong 100-250
7 Moth 90-160
8 Urad 100-225
9 Groundnut 100-150
10 Sesamum 200-350
11 Castor 100-300
12 Cotton 900/450gram
13 Guar seed 190.00
8 Chemical fertilizer (NPK) availability in
the local market (√)
Details Adequate Shortage Not available
Urea √
DAP √
SSP √
Others √
9 Prevailing market price of fertilizer Details Price (Rs. per kg)
Urea 6.25
DAP 24.90
SSP (powder) 6.90
SSP (granules) 7.50
10 Availability of agricultural labourers (√) Easily available Shortage Not available
√
11 Prevailing wage rate for casual labourers
in agriculture (Rs/day)**
Male Female
Rs. 250 Rs. 200
12 Availability of institutional credit for
agriculture and allied activities in the
state (Year 2014-15)
Target (Rs crore) Achievement (Rs crore)
NA NA
13 Electricity availability for irrigation
pump sets (numbers of hour per day) 7-8 Hrs

Quarterly Report: April–June 2016
26
14 Availability of farm machinery for
timely sowing, harvesting and other
operations (√)
Easily available Shortage Not available
√ 15 Availability of organic manure, farm-
yard-manure, vermin-compost, bio-
Adequate Shortage Not available
√ Remarks and
observations
*Because of unavailability of targeted area figures, the previous year area under Kharif
season has been taken as the proxy.
Note: Data reported are provisional. NA implies Not Available.

Quarterly Report: April–June 2016
27
Indicators of Agriculture Performance
Name of AERC: Shimla State: Himachal Pradesh Quarter covered: Apr - Jun 2016
Sr.
No.
Indicators Current status
1. Average Rainfall
(mm.)
Actual Normal
61 73
2. No. of districts
received deficit rainfall
in the state
No. of districts with
deficit rainfall
Total no. of districts
2 12
3. Area covered under
major crops
Sr. no. Name of the crop Actual area (ha.) Targeted area (ha.)
1. Maize 280000 297000
2. Paddy 25000 76000
4. Incidence of major
pests and diseases in
principal crops sown
Sr. no. Name of the crop Severe Moderate Low Not at all
1. - - - √
5.
Farm output price of
major crops
Sr. no. Name of the crop Price( Rs. Per quintal)
1. Maize 1365
2. Paddy 1510
6. Seed availability in the
local market for major
crops
Sr. no. Name of the
crop
Adequate Shortage Not available
1. Maize √
2. Paddy √
7. Prevailing market
price of seed of major
crops
Sr. no. Name of the crop Price (Rs. Per kgs.)
1. Maize 71.50
2. Paddy 250.00
8. Chemical
fertilizers(NPK)
availability in the local
market
Details Adequate Shortage Not available
Urea √
DAP √
SSP √
9. Prevailing market
price of fertilizer
Details Price (Rs. Per kg.)
Urea 5.16
DAP(12:32:16) 10.38
SSP 7.70
Others(C A N) 16.10
10. Availability of
agricultural laborers
Easily available Shortage Not available
√
11. Prevailing wage rate
for casual labourers in
agriculture(Rs./ day)
Male Female
Rs. 150 Rs. 150
12. Availability of
institutional credit for
agriculture in the state
Target(Rs. Crore) Achievement(Rs. Crore)
5716.29 5425.57

Quarterly Report: April–June 2016
28
13. Electricity available
for irrigation pump
sets(no. of hour per
day)
Electricity for irrigation pump is available 20 hours per day
14. Availability of farm
machinery for timely
sowing, harvesting and
other operations
Easily available Shortage Not available
√
15. Availability of organic
manure, farmyard-
manure, vermin-
compost, bio-fertilizer
Adequate Shortage Not available
√
Remarks and observations There is 20% net irrigated area in Himachal Pradesh.
*Note: The credit data is pertaining to April – June 2016

Quarterly Report: April–June 2016
29
AGRO-ECONOMIC RESEARCH CENTRE FOR BIHAR & JHARKHAND
(Ministry of Agriculture, Government of India)
T M BHAGALPUR UNIVERSITY, BHAGALPUR – 812 007
Name of AERC: Bhagalpur State: Jharkhand Quarter Covered: Apr - Jun 2016
Sl. No. Indicators Current status
1 Average Rainfall (mm) Actual Normal
195 (Approx.) 255.87
2 No of districts received deficit rainfall in
the state
No. of districts with deficit
rainfall
Total number of districts
18 24
3 Area covered under major crops Sl.
no.
Name of the
crop
Actual area
(Lakh ha)
Targeted area
(Lakh ha)
1 Paddy 0.028 0.450
2 Maize 0.009 0.0125
3 Moong 0.0025 0.0035
4 Vegetables 0.0605 0.0710
4 Incidence of major pests and diseases in
principal crops sown (√)
Sl.
no.
Name of the
Crop
Severe Moderate Low Not
at all
1 Paddy √
2 Maize √
3 Moong √
4 Vegetables √
5 Farm output price of major crops Sl.
no.
Name of the crop Price (Rs. per quintal)
1 Rice (Medium) 2400
2 Wheat 1300
3 Maize 1050
4 Lentil 6400
5 Arhar 9000
6 Seed availability in the local market for
major crops (√)
Sl.
no.
Name of the
crop
Adequate Shortage Not
available
1 Paddy √
2 Maize √
3 Moong √
4 Vegetables √
7 Prevailing market price of seed of major
crops
Sl.
no.
Name of the crop Price (Rs per kgs)
1 Paddy 300
2 Maize 250
3 Moong 80
8 Chemical fertilizer (NPK) availability in
the local market (√)
Details Adequate Shortage Not available
Urea √
DAP √
SSP √
Others √

Quarterly Report: April–June 2016
30
9 Prevailing market price of fertilizer Details Price (Rs. per kg)
Urea 7.00
DAP 14.00
SSP 10.00
MOP 10.00
10 Availability of agricultural labourers (√) Easily available Shortage Not available
√
11 Prevailing wage rate for casual labourers in
agriculture (Rs/day)
Male Female
200 100
12 Availability of institutional credit for
agriculture in the state
Target (Rs crore) Achievement (Rs crore)
7353.41 (Annual) 1390.00 (Approx)
13 Electricity availability for irrigation pump
sets (numbers of hour per day) 7-8 hrs.
14 Availability of farm machinery for timely
sowing, harvesting and other operations (√)
Easily available Shortage Not available
√
15 Availability of organic manure, farm-yard-
manure, vermin-compost, bio-fertilizer (√)
Adequate Shortage Not available
√
Remarks and
observations
Note: Data shall be collected quarterly consisting of 1st quarter – Jan to March; 2nd Quarter – April to
June; 3rd Quarter – July to September and 4th Quarter – October to December.

Quarterly Report: April–June 2016
31
ADRTC – Bangalore
Indicators of Agriculture Performance
Compiled for the Planning Commission
Name of AERC: ADRTC State: Karnataka Quarter Covered: Apr- Jun 2016
Sl. No. Indicators Current status
1 Average Rainfall (mm) Actual Normal
301.42 312.9
2 No of districts received deficit rainfall
in the state
No of districts with deficit
rainfall
Total number of
districts
Apr - 6
May– 11
Jun - 1
30
3 Area covered under major crops Sl.
no.
Name of the
crop
Actual area
( Lakh ha)
Targeted
area
(Lakh ha)
1 Paddy 1.57 10.56
2 Groundnut 2.48 6.30
3 Maize 7.97 11.91
4 Sunflower 0.87 2.0
5 Tur 7.15 8.51
4 Incidence of major pests and diseases
in principal crops sown (√)
Sl.
no.
Name of the
Crop
Severe Moderate Low Not
at
all
1 Paddy √
2 Groundnut √
3 Maize √
4 Sunflower √
5 Bengal gram √
5 Farm output price of major crops Sl.
no.
Name of the crop Price (Rs. per
quintal)
1 Paddy 2048.68
2 Groundnut 4893.12
3 Maize 1465.79
4 Sunflower 3304.80
5 Bengal gram 5750.24

Quarterly Report: April–June 2016
32
6 Seed availability in the local market for
major crops (√)
Sl.
no.
Name of the
crop
Adequate Shortage Not
available
1 Paddy √
2 Groundnut √
3 Maize √
4 Sunflower √
5 Red gram √
7 Prevailing market price of seed of
major crops
Sl.
no.
Name of the crop Price (Rs. per
kgs)
1 Paddy 25.63
2 Groundnut 68.67
3 Maize 163.67
4 Sunflower 255.83
5 Red gram 135
8 Chemical fertilizer (NPK) availability
in the local market (√)
Details Adequate Shortage Not available
Urea √
DAP √
SSP √
Others
9 Prevailing market price of fertilizer Details Price (Rs. per kg)
Urea 5.69
DAP 25.10
SSP 7.84
Others
10 Availability of agricultural labourers
(√)
Easily available Shortage Not available
√
11 Prevailing wage rate for casual
labourers in agriculture (Rs/day)
Male Female
325 235
12 Availability of institutional credit for
agriculture in the state
Target (Rs crore) Achievement (Rs crore)
62619.42 84834.25
13 Electricity availability for irrigation
pump sets (numbers of hour per day) 4 hrs
14 Availability of farm machinery for
timely sowing, harvesting and other
operations (√)
Easily available Shortage Not available
√
15 Availability of organic manure, farm-
yard-manure, vermin-compost, bio-
fertilizer (√)
Adequate Shortage Not available
√
Remarks and observations
Note: Data shall be collected quarterly consisting of 1st quarter – Jan to March; 2nd Quarter – April to June; 3rd Quarter – July to
September and 4th Quarter – October to December. The Agro Centres shall provide the quarterly data immediately in the following
week and ADRTC, after verification, shall compile the All India Report and submit the quarterly All India Report to the Ministry by
the 2nd week after the end of the quarter. Timely submission by the Agro Centres is indispensable for ADRTC to comply with the
above time schedule.

Quarterly Report: April–June 2016
33
Indicators of Agriculture Performance
Compiled for the Planning Commission
Name of AERC: Jabalpur State: Madhya Pradesh Quarter Covered: Apr – Jun 2016
Sl.
No.
Indicators Current status
1 Average Rainfall (mm) (1st to 23rd June 2016) Actual Normal
49.2 66.4
2 No. of districts received deficit rainfall in the
state (as on 17.6.2016)
No of districts with deficit
rainfall
Total number of districts
18 51
3 Area covered under major crops Sl.
no.
Name of the
crop
Actual area
( Lakh ha)
Targeted area
(Lakh ha)
1 Paddy NA 21.24
2 Maize 1.56 11.00
3 Soyabean 8.55 56.50
4 Jowar NA 2.73
5 Arhar 1.10 7.79
6 Moong NA 2.50
7 Urad NA 11.00
8 Cotton 2.72 5.72
9 Groundnut NA 2.40
4 Incidence of major pests and diseases in
principal crops sown (√)
Sl.
no.
Name of the
Crop
Severe Moderate Low Not at
all
1 Paddy √
2 Maize √
3 Soyabean √
4 Jowar √
5 Arhar √
6 Moong √
7 Urad √
8 Cotton √
9 Groundnut √
5 Farm output price of major crops Sl.
no.
Name of the crop Price (Rs per
quintal)
1 Paddy 1170-1850
2 Maize 1550-1942
3 Soyabean 2500-3750
4 Jowar 1347-1611
5 Arhar 5500-8425
6 Seed availability in the local market for major
crops (√)
Sl.
no.
Name of the
crop
Adequate Shortage Not
available
1 Paddy √
2 Maize √
3 Soyabean √

Quarterly Report: April–June 2016
34
4 Jowar √
5 Arhar √
6 Moong √
7 Urad √
8 Cotton √
9 Groundnut √
7 Prevailing market price of seed of major crops Sl.
no.
Name of the crop Price (Rs per kgs)
1 Paddy 33.00
2 Maize 32.65
3 Soyabean 59.00
4 Jowar 36.00
5 Arhar 150.00
6 Moong 60.00
7 Urad 150.00
8 Til 110.00
9 Groundnut 70.00
8 Chemical fertilizer (NPK) availability in the
local market (√)
Details Adequate Shortage Not available
Urea √
DAP √
SSP √
Others √
9 Prevailing market price of fertilizer Details Price (Rs. per kg)
Neem Coated
Urea 6.03
DAP 25.14
SSP (Granule) 6.47
SSP (Powder) 5.96
Others
(12:32:16) 23.04
10 Availability of agricultural labourers (√) Easily available Shortage Not available
√
11 Prevailing wage rate for casual labourers in
agriculture (Rs/day)
Male Female
180-200 100-120
12 Availability of institutional credit for
agriculture in the state (Achievement data
pertain to financial year ending March 2016)
Target (Rs crore) Achievement (Rs crore)
67186.94 52502.30
13 Electricity availability for irrigation pump sets
(numbers of hour per day) 8 hrs /day
14 Availability of farm machinery for timely
sowing, harvesting and other operations (√)
Easily available Shortage Not available
√
15 Availability of organic manure, farm-yard-
manure, vermin-compost, bio-fertilizer (√)
Adequate Shortage Not available
√
Remarks and observations

Quarterly Report: April–June 2016
35
Indicators of Agricultural Performance
Compiled for the Planning Commission
Name of AERC: Jorhat State: Manipur Quarter Covered: Apr - Jun 2016
Sr. Indicators
Current Status
No.
1 Average Rainfall (mm) Actual Normal
01-4-2016 to 3-06-2016 616.4 741.30 2 No .of districts received deficit
rainfall in the state No. of districts with deficit rainfall Total number of districts
4 9
3 Area covered under major Sr.
no.
Name of the
crop
Actual area
(lakh ha)
Targeted area
(Lakh ha)
crops
1 Paddy 2.40 2.50
2 Oilseeds 0.37 0.39
3 Maize 0.26 0.29
4 Pulses 0.30 0.33
5 Sugarcane 0.05 0.06
4 Incidence of major pests and
diseases in principal crops sown
(ha)
Sr.
no. Name of the
Crop Severe Moderate Low
Not at
all
1 Paddy √
2 Oilseeds √
3 Maize √
4 Pulses √
5 Sugarcane √
5 Farm output price of major Sr. Name of the crop Price(Rs per quintal)
crops no.
1 Paddy 1300.00
2 Oilseeds 3000.00
3 Maize 1280.00
4 Pulses 3650.00
5 Sugarcane 240.00
6
Seed availability in the local
market for major crops
Sr.
no.
Name of the
crop Adequate Shortage Not available
1 Paddy √
2 Oilseeds √
3 Maize √
4 Pulses √
5 Sugarcane
√

Quarterly Report: April–June 2016
36
7 Prevailing market price of Sr. Name of the crop
Price (Rs. per kgs)
seed(certified)of major crops no.
1 Paddy 20.00
2 Oilseeds 115.00
3 Maize 18.00
4 Pulses 130.00
5 Sugarcane 29.00
8 Chemical Fertilizer( NPK) Details Adequate Shortage Not available
availability in the local market Urea √
DAP √
SSP √
Others √
9
Prevailing market price of
Fertilizer
Details Price(Rs per kgs)
Urea 8.00
DAP 22.00
SSP 8.50
Others 15.00-18.00
10 Availability of agricultural Easily available Shortage Not available
Labours
√
11 Prevailing wage rate for Male Female
casual labourers in agriculture Rs. 230.00 Rs.150.00 ( Rs/day)
12 Availability of institutional Target (Rs. in Crore) Achievement (Rs. in Crore)
credit for agriculture in the State 418.79 118.74
13
Electricity available for
irrigation pump sets NA ( numbers of hour per day)
14 Availability of farm machinery Easily available Shortage Not available
for timely sowing, harvesting
√ and other operations
15 Availability of organic manure, Adequate Shortage Not available
farm-yard manure, vermin-
√
compost, bio-fertilizer
Remarks and
Observations

Quarterly Report: April–June 2016
37
Indicators of Agriculture Performance
Compiled for the Planning Commission
Name of AERC: Jorhat State: Meghalaya Quarter Covered: Apr - Jun 2016
Sl.
No.
Indicators Current status
1 Average Rainfall (mm)
Actual Normal
955.01 1016.40
2 No of districts received deficit rainfall in
the state
No of districts with deficit
rainfall
Total number of
districts
2 7
3 Area covered under major crops Sl.
no.
Name of the crop Actual area
( Lakh ha)
Targeted area
(Lakh ha)
1 Paddy 1.09 1.53
2 Maize 0.18 0.20
3 Pulses 0.07 0.09
4 Jute 0.05 0.06
5 Oilseeds 0.13 0.19
4 Incidence of major pests and diseases in
principal crops sown (√)
Sl.
no.
Name of the
Crop
Severe Moderate Low Not
at
all
1 Paddy √
2 Maize √
3 Pulses √
4 Jute √
5 Oilseeds √
5 Farm output price of major crops Sl.
no.
Name of the crop Price (Rs per
quintal)
1 Paddy 1280.00
2 Maize 1260.00
3 Pulses 3700.00
4 Jute 3500.00
5 Oilseeds 3000.00
6 Seed availability in the local market for
major crops (√)
Sl.
no.
Name of the
crop
Adequate Shortage Not
available
1 Paddy √
2 Maize √
3 Pulses √
4 Jute √
5 Oilseeds √

Quarterly Report: April–June 2016
38
7 Prevailing market price of seed of major
crops
Sl.
no.
Name of the crop Price (Rs per kgs)
1 Paddy 23.00
2 Maize 20.00
3 Pulses 140.00
4 Jute 15.00
5 Oilseeds 120.00
8 Chemical fertilizer (NPK) availability in
the local market (√)
Details Adequate Shortage Not available
Urea √
DAP √
SSP √
Others √
9 Prevailing market price of fertilizer Details Price (Rs. per kg)
Urea 7.00
DAP 22.00
SSP 8.50
Others 15.00-19.00
10 Availability of agricultural labourers (√) Easily available Shortage Not available
√
11 Prevailing wage rate for casual labourers
in agriculture (Rs/day)
Male Female
Rs. 250 Rs. 150
12 Availability of institutional credit for
agriculture in the state
Target (Rs crore) Achievement (Rs crore)
NA NA
13 Electricity availability for irrigation
pump sets (numbers of hour per day) NA
14 Availability of farm machinery for
timely sowing, harvesting and other
operations (√)
Easily available Shortage Not available
√
15 Availability of organic manure, farm-
yard-manure, vermin-compost, bio-
fertilizer (√)
Adequate Shortage Not available
√
Remarks and
observations
Note: Data shall be collected quarterly consisting of 1st quarter – Jan to March; 2nd Quarter – April to June; 3rd
Quarter – July to September and 4th Quarter – October to December.
The Agro Centres shall provide the quarterly data immediately in the following week and ADRTC, after verification,
shall compile the All India Report and submit the quarterly All India Report to the Ministry by the 2nd week after the
end of the quarter. Timely submission by the Agro Centres is indispensable for ADRTC to comply with the above time
schedule.

Quarterly Report: April–June 2016
39
Indicators of Agriculture Performance
Compiled for the Planning Commission
Name of AERC: Jorhat State: Mizoram Quarter Covered: Apr - Jun 2016
Sl. No. Indicators Current status
1 Average Rainfall (mm)
Actual Normal
989.60 1086.00
2 No of districts received deficit rainfall in
the state
No of districts with deficit
rainfall
Total number of
districts
2 8
3 Area covered under major crops Sl.
no.
Name of the
crop
Actual area
( Lakh ha)
Targeted area
(Lakh ha)
1 WRC Kharif 0.15 020
2 Oilseeds 0.02 0.05
3 Maize 0.06 0.09
4 Pulses 0.04 0.07
5 Sugarcane 0.01 0.02
4 Incidence of major pests and diseases in
principal crops sown (√)
Sl.
no.
Name of the
Crop
Severe Moderate Low Not
at
all
1 WRC Kharif √
2 Oilseeds √
3 Maize √
4 Pulses √
5 Sugarcane √
5 Farm output price of major crops Sl.
no.
Name of the crop Price (Rs per
quintal)
1 WRC Kharif 1300.00
2 Oilseeds 3000.00
3 Maize 1280.00
4 Pulses 3650.00
5 Sugarcane 240.00
6 Seed availability in the local market for
major crops (√)
Sl.
no.
Name of the
crop
Adequate Shortage Not
available
1 WRC Kharif √
2 Oilseeds √
3 Maize √
4 Pulses √
5 Sugarcane √
7 Prevailing market price of seed of major
crops
Sl.
no.
Name of the crop Price (Rs per kgs)
1 WRC Kharif 20.50
2 Oilseeds 120.00
3 Maize 17.50
4 Pulses 135.00
5 Sugarcane 29.50

Quarterly Report: April–June 2016
40
8 Chemical fertilizer (NPK) availability in
the local market (√)
Details Adequate Shortage Not available
Urea √
DAP √
SSP √
Others √
9 Prevailing market price of fertilizer Details Price (Rs. per kg)
Urea 8.00
DAP 22.50
SSP 7.50
Others 15.00-18.00
10 Availability of agricultural labourers (√) Easily available Shortage Not available
√
11 Prevailing wage rate for casual labourers in
agriculture (Rs/day)
Male Female
Rs. 250 Rs. 200
12 Availability of institutional credit for
agriculture in the state
Target (Rs. crore) Achievement (Rs. crore)
NA NA
13 Electricity availability for irrigation pump
sets (numbers of hour per day) NA
14 Availability of farm machinery for timely
sowing, harvesting and other operations
(√)
Easily available Shortage Not available
√
15 Availability of organic manure, farm-yard-
manure, vermin-compost, bio-fertilizer (√)
Adequate Shortage Not available
√
Remarks and
observations
Note: Data shall be collected quarterly consisting of 1st quarter – Jan to March; 2nd Quarter – April to June; 3rd
Quarter – July to September and 4th Quarter – October to December.
The Agro Centres shall provide the quarterly data immediately in the following week and ADRTC, after verification,
shall compile the All India Report and submit the quarterly All India Report to the Ministry by the 2nd week after the
end of the quarter. Timely submission by the Agro Centres is indispensable for ADRTC to comply with the above time
schedule.

Quarterly Report: April–June 2016
41
Indicators of Agriculture Performance
Compiled for the Planning Commission
Name of AERC: Jorhat State: Nagaland Quarter Covered: Apr - Jun 2016
Sl. No. Indicators Current status
1 Average Rainfall (mm)
Actual Normal
738.75 812.21
2 No of districts received deficit rainfall in
the state
No of districts with deficit
rainfall
Total number of
districts
3 11
3 Area covered under major crops Sl.
no.
Name of the
crop
Actual area
( Lakh ha)
Targeted area
(Lakh ha)
1 Paddy 1.89 2.90
2 Oilseeds 0.67 0.79
3 Pulses 0.37 0.50
4 Maize 0.69 0.86
5 Jute 0.06 0.11
4 Incidence of major pests and diseases in
principal crops sown (√)
Sl.
no.
Name of the
Crop
Severe Moderate Low Not
at
all
1 Paddy √
2 Oilseeds √
3 Pulses √
4 Maize √
5 Sugarcane √
5 Farm output price of major crops Sl.
no.
Name of the crop Price (Rs per
quintal)
1 Paddy 1310.00
2 Oilseeds 3000.00
3 Pulses 3700.00
4 Maize 1280.00
5 Sugarcane 240.00
6 Seed availability in the local market for
major crops (√)
Sl.
no.
Name of the
crop
Adequate Shortage Not
available
1 Paddy √
2 Oilseeds √
3 Pulses √
4 Maize √
5 Sugarcane √
7 Prevailing market price of seed of major
crops
Sl.
no.
Name of the crop Price (Rs. per kgs)
1 Paddy 20.50
2 Oilseeds 110.00

Quarterly Report: April–June 2016
42
3 Pulses 135.00
4 Maize 18.00
5 Sugarcane 31.00
8 Chemical fertilizer (NPK) availability in
the local market (√)
Details Adequate Shortage Not available
Urea √
DAP √
SSP √
Others √
9 Prevailing market price of fertilizer Details Price (Rs. per kg)
Urea 8.50
DAP 21.50
SSP 8.00
Others 15.00-18.00
10 Availability of agricultural labourers (√) Easily available Shortage Not available
√
11 Prevailing wage rate for casual labourers in
agriculture (Rs/day)
Male Female
Rs. 230 Rs. 170
12 Availability of institutional credit for
agriculture in the state
Target (Rs crore) Achievement (Rs crore)
NA NA
13 Electricity availability for irrigation pump
sets (numbers of hour per day) NA
14 Availability of farm machinery for timely
sowing, harvesting and other operations
(√)
Easily available Shortage Not available
√
15 Availability of organic manure, farm-yard-
manure, vermin-compost, bio-fertilizer (√)
Adequate Shortage Not available
√
Remarks and
observations
Note: Data shall be collected quarterly consisting of 1st quarter – Jan to March; 2nd Quarter – April to June; 3rd
Quarter – July to September and 4th Quarter – October to December.
The Agro Centres shall provide the quarterly data immediately in the following week and ADRTC, after verification,
shall compile the All India Report and submit the quarterly All India Report to the Ministry by the 2nd week after the
end of the quarter. Timely submission by the Agro Centres is indispensable for ADRTC to comply with the above time
schedule.

Quarterly Report: April–June 2016
43
Agro-Economic Research Centre, PAU, Ludhiana Indicators of Agriculture Performance
Compiled for the Planning Commission
Name of the AERC: PAU Name of the State: Punjab Quarter Covered: Jan - Mar 2016
Sl. No. Indicators
Current status
1 Average Rainfall (mm)
(01.04.2016 to 30.06.2016)
Actual Normal
77.4 72.9
2 No of districts received deficit rainfall in
the state
No of districts with deficit
rainfall
Total number of districts
3 20*
3 Area covered under major crops
(2015-16)
Sl.
No.
Name of the
crop
Actual area
( Lakh
ha**)
Targeted area
(Lakh ha)
1 Wheat 34.99 34.90
2 Paddy 29.75 26.55
3 Cotton 3.39 5.25
4 Maize 1.15 2.00
5 Mustard 0.34 0.45
6 Sugarcane 0.90 1.20
7 Sunflower 0.07 0.20
4 Incidence of major pests and diseases in
principal crops sown (√)
Sl.
No.
Name of
the Crop
Severe Moderate Low Not
at all
1 Wheat √
2 Paddy √
3 Cotton √
4 Maize √
5 Mustard √
6 Sugarcane √
7 Sunflower √
5
Farm output price of major crops
Sl.
No.
All Crops Price (Rs. per
quintal)
1 Wheat 1525
2 Cotton 4615-4975
3 Maize 1100-1450
4 Mustard 3460-3900
5 Sunflower 2900-3350
6 Seed availability in the local market for
major crops (√)
Sl.
No.
Name of the
crop
Adequate Shortage Not
available
1 Paddy √
2 Cotton √
3 Maize √

Quarterly Report: April–June 2016
44
7 Prevailing market price of seed of major
crops
Sl.
No.
Name of the crop Price (Rs per kg)
1 Paddy 35-40
2 Cotton (BT)-BG 2 1778
3 Maize (Hybrid) 175-350
8 Chemical fertilizer (NPK) availability in
the local market (√)
Details Adequate Shortage Not available
Urea √
DAP √
SSP √
Others
9 Prevailing market price of fertilizer Details Price (Rs. per kg)
Urea 5.70
DAP 23.70
SSP 16.00
Others
10 Availability of agricultural labourers (√) Easily available Shortage Not available
√
11 Prevailing wage rate for casual labourers in
agriculture (Rs/day)
Male Female
Rs. 350-425 -
12 Availability of institutional credit for
agriculture in the state***
Target (Rs. crore) Achievement (Rs. crore)
92135 90012
13 Electricity availability for irrigation pump
sets (numbers of hour per day) 5-8 Hrs.
14 Availability of farm machinery for timely
sowing, harvesting and other operations (√)
Easily available Shortage Not available
√
15 Availability of organic manure, farm-yard-
manure, vermin-compost, bio-fertilizer (√)
Adequate Shortage Not available
√
Remarks and observations
Note: * Data on recently created two districts are not presently available separately, and is part of the
parent districts.
** Provisional estimates
*** Data pertain to financial year ending March 2016

Quarterly Report: April–June 2016
45
Agro-Economic Research Centre, Vallabh Vidyanagar Indicators of Agriculture Performance
Compiled for the Planning Commission
Name of the State: Rajasthan Quarter Covered: Apr - Jun 2016
Sl.
No.
Indicators
Current status
1 Average Rainfall (mm)
(01.06.2016 to 29.06.2016)
Actual Normal
42.8 41.0
2 No of districts received deficit rainfall in
the state (01.06.2016 to 29.06.2016)
No of districts with deficit
rainfall
Total number of districts
18 33
3 Area covered under major crops
(As on 30.06.2016 as per Dir. of Agri,
Jaipur, Rajasthan, data on further progress
not available)
Sl.
No.
Name of the
crop
Actual area
( 000 ha)
Targeted area
(000 ha)
1 Bajra 684.3 4600
2 Maize 250.9 980
3 Moong 106.1 1350
4 Moth 69.8 1150
5. Guar 180.3 3600
6. Soyabean 161.4 1100
7. All crops 2281.5 15957
4 Incidence of major pests and diseases in
principal crops sown (√)
Sl.
No.
Name of
the Crop
Severe Moderate Low Not
at all
1 Bajra √
2 Maize √
3 Moong √
4 Moth √
5
Farm output price of major crops
(As on 1/07/2016 as per mandi online,
Rajasthan website)
Sl.
No.
All Crops Price (Rs. per
quintal)
1 Wheat (1482) 1550-1605
2 Jowar 1425-2170
3 Bajra 1400-1715
4 Maize (Yellow) 1400-1841
5 Moong 5200-6090
6 Urad 8790-12500
7 Groundnut 4000-5250
6 Seed availability in the local market for
major crops (√) (www.seednet.gov.in)
Sl.
No.
Name of the
crop
Adequate Shortage Not
available
1 Jowar √
2 Moong √
3 Groundnut √

Quarterly Report: April–June 2016
46
4 Bajra √
5 Maize √
6 Guar √
7 Prevailing market price of seed of major
crops
Sl.
No.
Name of the crop Price (Rs per kg)
1 Soyabean 45
2 Moong 105
3 Groundnut 50
4 Urad 140
5 Sesamum 100
6 Guar 48
8 Chemical fertilizer (NPK) availability in
the local market (√)
Details Adequate Shortage Not available
Urea √
DAP √
SSP √
Others √
9 Prevailing market price of fertilizer Details Price (Rs. per kg)
Urea 6.20
DAP 22.00
SSP 6.90 (Powder), 7.50 (Grain)
Others /NPK 15.40
10 Availability of agricultural labourers (√) Easily available Shortage Not available
√
11 Prevailing wage rate for casual labourers in
agriculture (Rs/day)
Male Female
Rs. 275 Rs. 250
12 Availability of institutional credit for
agriculture in the state
Target (Rs. crore) Achievement (Rs. crore)
NA NA
13 Electricity availability for irrigation pump
sets (numbers of hour per day) 5-6 Hrs.
14 Availability of farm machinery for timely
sowing, harvesting and other operations (√)
Easily available Shortage Not available
√
15 Availability of organic manure, farm-yard-
manure, vermin-compost, bio-fertilizer (√)
Adequate Shortage Not available
√
Remarks and observations
Note: (1) Data reported are provisional.
(2) NA: Not Available.
(3) Data on seeds requirement and availability for rabi and summer seasons for Rajasthan is not
available.

Quarterly Report: April–June 2016
47
Indicators of Agriculture Performance
Compiled for the Planning Commission
Name of AERC: Madras University State: Tamil Nadu Quarter Covered: Apr - Jun 2016
Sl. No. Indicators Current status
1 Average Rainfall (mm)
Actual Normal
63.2 45.5
2 No of districts received deficit rainfall in
the state
No of districts with deficit
rainfall
Total number of
districts
8 32
3 Area covered under major crops Sl.
no.
Name of the
crop
Actual area
(lakh ha)
Targeted area
(lakh ha)
1 Paddy 0.407 3.264
2 Pulses 0.296 0.499
3 Oilseeds 0.096 6.20
4 Cotton 0.031 1.80
4 Incidence of major pests and diseases in
principal crops sown (√)
Sl.
no.
Name of the
Crop
Severe Moderate Low Not
at
all
1 Paddy √
2 Groundnut √
5 Farm output price of major crops Sl.
no.
Name of the crop Price (Rs. per quintal)
1 Paddy 1400-1520
2 Millets 2000-2500
3 Cotton 3800-4100
4 Sugarcane 285
6 Seed availability in the local market for
major crops (√)
Sl.
no.
Name of the
crop
Adequate Shortage Not
available
1 Paddy √
2 Pulses √
3 Cotton √
4 Millets √
7 Prevailing market price of seed of major
crops
Sl.
no.
Name of the crop Price (Rs. per Kg)
1 Groundnut 90-100
2 Sunflower 35-40
3 Red Gram 65-70
4 Black Gram 110-130
8 Chemical fertilizer (NPK) availability in
the local market (√)
Details Adequate Shortage Not available
Urea √
DAP √
SSP √
Others √

Quarterly Report: April–June 2016
48
9 Prevailing market price of fertilizer Details Price (Rs. Per 50 kg)
Urea 285
DAP 1199
SSP 381
Others (20:20) 900
10 Availability of agricultural labourers (√) Easily available Shortage Not available
√
11 Prevailing wage rate for casual labourers in
agriculture (Rs/day)
Male Female
Rs. 260 Rs. 180
12 Availability of institutional credit for
agriculture in the state
Target (Rs. crore) Achievement (Rs. crore)
87483.57 92404.45
13 Electricity availability for irrigation pump
sets (numbers of hour per day) Shortage
14 Availability of farm machinery for timely
sowing, harvesting and other operations
(√)
Easily available Shortage Not available
√
15 Availability of organic manure, farm-yard-
manure, vermin-compost, bio-fertilizer (√)
Adequate Shortage Not available
√
Remarks and
observations
Note: Data shall be collected quarterly consisting of 1st quarter – Jan to March; 2nd Quarter – April to
June; 3rd Quarter – July to September and 4th Quarter – October to December.
The Agro Centres shall provide the quarterly data immediately in the following week and ADRTC, after
verification, shall compile the All India Report and submit the quarterly All India Report to the Ministry
by the 2nd week after the end of the quarter. Timely submission by the Agro Centres is indispensable for
ADRTC to comply with the above time schedule.
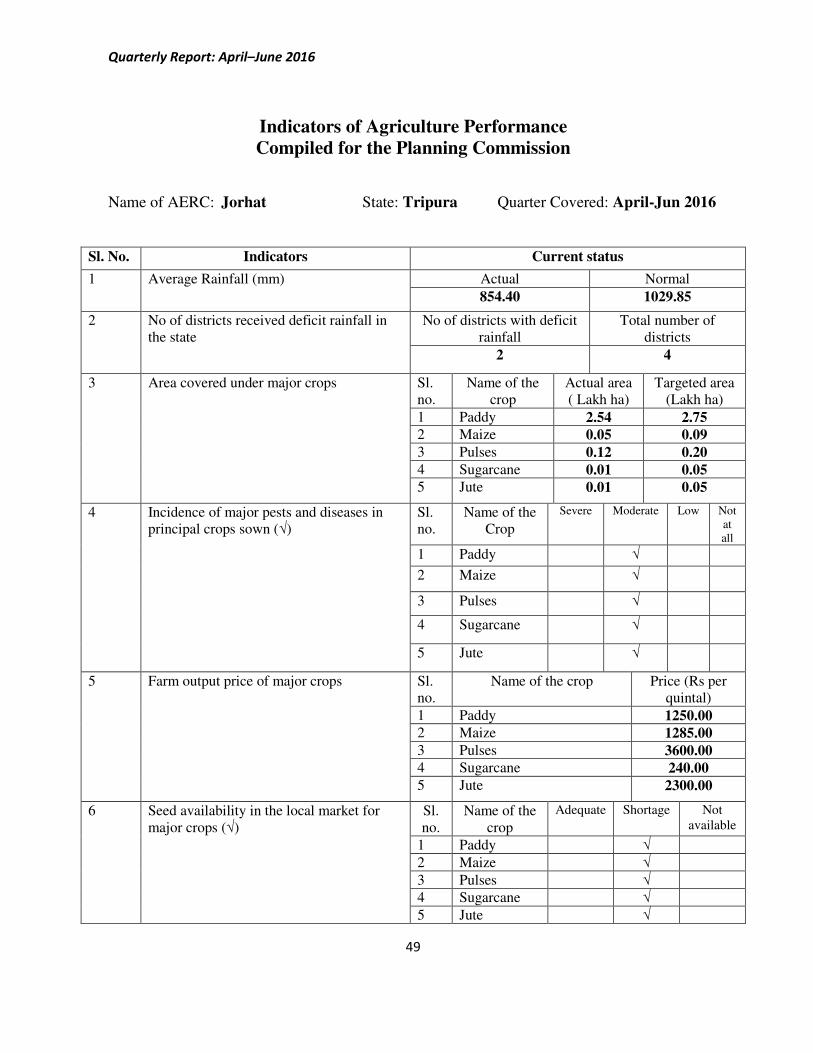
Quarterly Report: April–June 2016
49
Indicators of Agriculture Performance
Compiled for the Planning Commission
Name of AERC: Jorhat State: Tripura Quarter Covered: April-Jun 2016
Sl. No. Indicators Current status
1 Average Rainfall (mm)
Actual Normal
854.40 1029.85
2 No of districts received deficit rainfall in
the state
No of districts with deficit
rainfall
Total number of
districts
2 4
3 Area covered under major crops Sl.
no.
Name of the
crop
Actual area
( Lakh ha)
Targeted area
(Lakh ha)
1 Paddy 2.54 2.75
2 Maize 0.05 0.09
3 Pulses 0.12 0.20
4 Sugarcane 0.01 0.05
5 Jute 0.01 0.05
4 Incidence of major pests and diseases in
principal crops sown (√)
Sl.
no.
Name of the
Crop
Severe Moderate Low Not
at
all
1 Paddy √
2 Maize √
3 Pulses √
4 Sugarcane √
5 Jute √
5 Farm output price of major crops Sl.
no.
Name of the crop Price (Rs per
quintal)
1 Paddy 1250.00
2 Maize 1285.00
3 Pulses 3600.00
4 Sugarcane 240.00
5 Jute 2300.00
6 Seed availability in the local market for
major crops (√)
Sl.
no.
Name of the
crop
Adequate Shortage Not
available
1 Paddy √
2 Maize √
3 Pulses √
4 Sugarcane √
5 Jute √

Quarterly Report: April–June 2016
50
7 Prevailing market price of seed of major
crops
Sl.
no.
Name of the crop Price (Rs per kgs)
1 Paddy 21.50
2 Maize 17.50
3 Pulses 130.00
4 Sugarcane 30.00
5 Jute 85.00
8 Chemical fertilizer (NPK) availability in
the local market (√)
Details Adequate Shortage Not available
Urea √
DAP √
SSP √
Others √
9 Prevailing market price of fertilizer Details Price (Rs. per kg)
Urea 7.00
DAP 22.00
SSP 8.00
Others 15.00-19.00
10 Availability of agricultural labourers (√) Easily available Shortage Not available
√
11 Prevailing wage rate for casual labourers in
agriculture (Rs/day)
Male Female
Rs. 250 Rs. 150
12 Availability of institutional credit for
agriculture in the state
Target (Rs crore) Achievement (Rs crore)
NA NA
13 Electricity availability for irrigation pump
sets (numbers of hour per day) NA
14 Availability of farm machinery for timely
sowing, harvesting and other operations
(√)
Easily available Shortage Not available
√
15 Availability of organic manure, farm-yard-
manure, vermin-compost, bio-fertilizer (√)
Adequate Shortage Not available
√
Remarks and
observations
Note: Data shall be collected quarterly consisting of 1st quarter – Jan to March; 2nd Quarter – April to June; 3rd
Quarter – July to September and 4th Quarter – October to December.
The Agro Centres shall provide the quarterly data immediately in the following week and ADRTC, after verification,
shall compile the All India Report and submit the quarterly All India Report to the Ministry by the 2nd week after the
end of the quarter. Timely submission by the Agro Centres is indispensable for ADRTC to comply with the above time
schedule.
Sources: 1) Economic survey, 2) Statistical handbook, 3) Website of agriculture department, 4) Nedfi data bank,
5) IMD, website and 6) Minutes of SLBC meeting

Quarterly Report: April–June 2016
51
Indicators of Agriculture Performance
Compiled for the Planning Commission
Name of AERC: Allahabad State: Uttar Pradesh Quarter Covered: Apr - Jun 2016
No. Indicators Current status
1 Average Rainfall (mm) Actual Normal
111.2 71.3
2 No of districts received deficit rainfall in
the state
No of districts with deficit
rainfall
Total number of
districts
10 75
3 Area covered under major crops Sl.
no.
Name of the
major crops
Actual area
( Lakh ha)
Targeted area
(Lakh ha)
1 Paddy 3.96 59.48
2 Maize 2.75 7.75
3 Urad 0.33 5.75
4 Moong 0.03 0.48
4 Incidence of major pests and diseases in
principal crops sown (√)
Sl.
no.
Name of the
major crops
Severe Moderate Low Not
at
all
1 Paddy √
2 Maize √
3 Urad √
4 Moong √
5 Farm output price of major crops Sl.
no.
Name of the major crops Price (Rs per
quintal)
1 Paddy 1500-2375
2 Maize 4000-5500
3 Urad 4800-7500
4 Moong 5500-8000
6 Seed availability in the local market for
major crops (√)
Sl.
no.
Name of the
major crops
Adequate Shortage Not
available
1 Paddy √
2 Maize √
3 Urad √
4 Moong √
7 Prevailing market price of seed of major
crops
Sl.
no.
Name of the major crops Price (Rs. per kgs)
1 Paddy (HYV & Hybrid) 30-300
2 Maize 60-110
3 Urad 185-200
4 Moong 170-200
8 Chemical fertilizer (NPK) availability in
the local market (√)
Details Adequate Shortage Not available
Urea √
DAP √
SSP √
Others √

Quarterly Report: April–June 2016
52
9 Prevailing market price of fertilizer Details Price (Rs. per kg)
Urea 6.50-8.00
DAP 23.00-25.00
SSP 9.00-10.00
Others 12.00-14.00
10 Availability of agricultural labourers (√) Easily available Shortage Not available
√
11 Prevailing wage rate for casual labourers
in agriculture (Rs/day)
Male Female
200-250 175-200
12 Availability of institutional credit for
agriculture in the state
Target (Rs. crore) Achievement (Rs. crore)
37285 526.43
13 Electricity availability for irrigation pump
sets (numbers of hour per day) 12 to 14 hrs
14 Availability of farm machinery for timely
sowing, harvesting and other operations
(√)
Easily available Shortage Not available
√
15 Availability of organic manure, farm-yard-
manure, vermin-compost, bio-fertilizer (√)
Adequate Shortage Not available
√
Remarks and
observations
Note: Data shall be collected quarterly consisting of 1st quarter – Jan to March; 2nd Quarter –
April to June; 3rd Quarter – July to September and 4th Quarter – October to December.

Quarterly Report: April–June 2016
53
Indicators of Agriculture Performance
Compiled for the Planning Commission
Name of AERC: Shantiniketan State: West Bengal Quarter Covered: Apr - Jun 2016
Sl. No. Indicators Current status
1 Average Rainfall (mm) Actual Normal
3320.9 3597.7
2 No of districts received deficit rainfall in
the state
No of districts with deficit
rainfall
Total number of
districts
16 19
3 Area covered under major crops Sl.
no.
Name of the
major crops
Actual area
( Lakh ha)
Targeted area
(Lakh ha)
1 Aus paddy 1.12 2.20
2 Aman Paddy 0.52 40.60
3 Maize 0.26 0.54
4 Kalai (Urad) 0.16 0.65
5 Jute 5.10 5.80
4 Incidence of major pests and diseases in
principal crops sown (√)
Sl.
no.
Name of the
major crops
Severe Moderate Low Not
at
all
1 Aus paddy √
2 Aman Paddy √
3 Maize √
4 Kalai (Urad) √
5 Jute √
5 Farm output price of major crops Sl.
no.
Name of the major crops Price (Rs per
quintal)
1 Aus paddy 1050.00
2 Aman Paddy 1270.00
3 Maize 1325.00
4 Kalai (Urad) 7500.00
5 Jute 5600.00
6 Seed availability in the local market for
major crops (√)
Sl.
no.
Name of the
major crops
Adequate Shortage Not
available
1 Aus paddy √
2 Aman Paddy √
3 Maize √
4 Kalai (Urad) √
5 Jute √
7 Prevailing market price of seed of major
crops
Sl.
no.
Name of the major crops Price (Rs. per kgs)
1 Aus paddy 25.00
2 Aman Paddy 30.00
3 Maize 15.00
4 Kalai (Urad) 40.00
5 Jute 45.00

Quarterly Report: April–June 2016
54
8 Chemical fertilizer (NPK) availability in
the local market (√)
Details Adequate Shortage Not available
Urea √
DAP √
SSP √
Others √
9 Prevailing market price of fertilizer Details Price (Rs. per kg)
Urea 9.75
DAP 29.00
SSP 11.00
Others 27.00
10 Availability of agricultural labourers (√) Easily available Shortage Not available
√
11 Prevailing wage rate for casual labourers
in agriculture (Rs/day)
Male Female
235.00 235.00
12 Availability of institutional credit for
agriculture in the state
Target (Rs. crore) Achievement (Rs. crore)
33971.28 32522.00
13 Electricity availability for irrigation pump
sets (numbers of hour per day) NA
14 Availability of farm machinery for timely
sowing, harvesting and other operations
(√)
Easily available Shortage Not available
√
15 Availability of organic manure, farm-yard-
manure, vermin-compost, bio-fertilizer (√)
Adequate Shortage Not available
√
Remarks and
observations
Note: Data shall be collected quarterly consisting of 1st quarter – Jan to March; 2nd Quarter –
April to June; 3rd Quarter – July to September and 4th Quarter – October to December.
The Agro Centres shall provide the quarterly data immediately in the following week and
ADRTC, after verification, shall compile the All India Report and submit the quarterly All India
Report to the Ministry by the 2nd week after the end of the quarter. Timely submission by the
Agro Centres is indispensable for ADRTC to comply with the above time schedule.

Quarterly Report: April–June 2016
55
INSTITUTE FOR SOCIAL AND ECONOMIC CHANGE Dr. V.K.R.V. Rao Road, Nagarabhavi, Bangalore – 560 072. INDIA
Ph. : 91-80-23215468, 23215519 Fax: 91-080-23217008
E-mail : [email protected] Web : http://www.isec.ac.in
Bangalore – 560 072