constructing the monsoon: colonial meteorological
TRANSCRIPT

Corresponding author
Beth Cullen, University of Westminster, [email protected]
Constructing the Monsoon: Colonial Meteorological Cartography, 1844–
1944
Beth Cullen & Christina Leigh Geros
Introduction
During the nineteenth century, the significance of the South Asian monsoon for the
expanding the British Empire made it one of the most anticipated, tracked, and studied weather
phenomena in the world.1 Innovations in mapping techniques and scientific instruments, as
well as advancements in communication technology, converged with the establishment of
colonial rule in South Asia, bringing the monsoon into focus.2 This paper explores
developments in meteorological cartography that highlight constructions of the monsoon
during the nineteenth and early twentieth centuries. The early nineteenth century saw a shift in
meteorological inquiry towards standardisation, quantification, and synchronisation, which led
to the rise of new representational techniques, namely statistical cartography.3 Weather maps
were one of the most remarkable innovations of nineteenth-century meteorology, their
emergence an attempt to better understand the invisible forces of the atmosphere.4 The use of
statistical data to create meteorological images made it possible to identify global atmospheric
patterns for the first time. Through these new strategies of visualisation, weather patterns were
given shape and form, graphically and geographically, thereby enabling weather phenomena
to become the object of scientific inquiry.5 Nineteenth-century statistical cartographies, based
on systematic data collection, were a significant advance in scientific knowledge production
and played an important role in discovering new meteorological objects of inquiry. The art of
1 Sunil Amrith, “Risk and the South Asian Monsoon,” Climatic Change 151, no. 17 (2016): 17-28; Mike Davis, Late Victorian
Holocausts: El Nino Famines and the Making of the Third World (London and New York: Verso, 2002).
2 Fiona Williamson and Clive Wilkinson, “Asian Extremes: Experience and Exchange in the Development of Meteorological
Knowledge c. 1840–1930,” History of Meteorology 8 (2017): 159–78; Martin Mahoney and Georgina Endfield, “Climate and
Colonialism,” WIREs Climate Change 9, no. e510 (2018): 1–16.
3 Vladimir Jankovic, Reading the Skies: A Cultural History of English Weather, 1650–1820 (Manchester: Manchester
University Press, 2000).
4 Katherine Anderson, Predicting the Weather: Victorians and the Science of Meteorology (Chicago and London: University
of Chicago Press, 2005).
5 Birgit Schneider, “Climate Model Simulation Visualization from a Visual Studies Perspective,” WIREs Climate Change 3,
no. 2 (2017): 185–93.

History of Meteorology 9 (2020)
2
making pictorial statements in a precise and repeatable form was critical to the advancement
of monsoon science and greatly informed colonial constructions of the monsoon.
The monsoon is a complex weather phenomenon that, over time, has become
synonymous with South Asia and notions of “tropicality”.6 From the seventeenth century
onwards, monsoons became a defining aspect of “the tropics” and a way of emphasising
differences between the climates of South Asia and Europe.7 The region’s “unusual weather”
and hazardous monsoonal conditions presented obstacles to civil administration and served as
a constant reminder to the British of their tenuous position as interlopers.8 Due to its profound
influence on trade, agriculture, communication, and social life across the British Empire, the
monsoon presented a meteorological challenge to be mastered.9 Science offered a potential
means for understanding and domesticating monsoonal climates and, as such, meteorology was
increasingly recognised as being of fundamental importance to imperial interests.10 New
scientific techniques, enabled by colonial bureaucratic networks, technologies of measurement,
and statistical data sets, advanced understandings of the monsoon by making certain aspects of
its spatial and temporal dimensions visible. Nevertheless, these cartographic depictions were
not neutral; rather, they were an admixture of political, social, and scientific ambitions.11
Despite their seeming objectivity, monsoonal cartographies emerged from, reflected, and were
mobilised in pursuit of colonial agendas.
This paper draws on ideas from post-representational cartography to denaturalise
monsoonal maps in order to understand them as social constructions. Post-representational
theories of cartography question the notion that maps convey scientific, accurate, and objective
representations of reality; instead, they consider them as an agentive set of spatial practices that
do work in the world.12 Maps embed and reflect, as well as create and maintain, social relations
and interests, with practical and material implications for the territories and things they depict.
As Denis Wood and John Fels point out, maps create, transform, and construct the ideological;
they do not mirror nature but produce nature.13 In other words, maps are ideological
constructions that produce the world through the ontologies they advance. From this
perspective, cartographic visualisations of the monsoon were not unmediated representations;
rather, they mapped the monsoon as colonials perceived and sought to utilise, leverage, and
6 David Arnold, “India’s Place in the Tropical World, 1770–1930,” The Journal of Imperial and Commonwealth History 26,
no. 1 (1998): 1–21; Felix Driver and Brenda S.A. Yeoh, “Constructing the Tropics: Introduction,” Singapore Journal of
Tropical Geography 21, no. 1 (2000): 1–5.
7 Arnold, “India’s Place in the Tropical World,” 2.
8 Gunnel Cederlöf, Rule Against Nature: Founding an Empire on India’s North-Eastern Frontiers (NMML Occasional Paper,
History and Society New Series 20) (New Delhi: Nehru Memorial Museum and Library, 2013), 5; Robert Markley, “‘A
Putridness in the Air’: Monsoons and Mortality in Seventeenth-Century Bombay,” Journal for Early Modern Cultural Studies
10, no. 2 (2010): 105–25.
9 Davis, Late Victorian Holocausts, 213 - 238.
10 Fiona Williamson, “Weathering Empire: Meteorological Research in the Early British Straits Settlements,” British Society
for the History of Science 48, no. 3 (2015): 475–92.
11 Georgina Endfield and Sam Randalls, “Climate, Empire, and Environment,” in Eco-Cultural Networks and the British
Empire: New Views on Environmental History, eds. James Beattie, Edward Melillo, and Emily O’Gorman (London, UK:
Bloomsbury, 2014), 21–43.
12 Pablo Iván Azócar Fernández and Manfred Ferdinand Buchroithner, “Post-Representational Cartography,” in
Paradigms in Cartography: An Epistemological Review of the 20th and 21st Centuries, eds. Pablo Iván Azócar Fernández
and Manfred Ferdinand Buchroithner (Berlin: Springer, 2014), 87–99.
13 Denis Wood and John Fels, The Nature of Maps: Cartographic Constructions of the Natural World (Chicago: University
of Chicago Press, 2008), 190; John Pickles, A History of Spaces: Cartographic Reason, Mapping, and the Geo-Coded World
(London: Routledge, 2004).

History of Meteorology 9 (2020)
3
control it. This is not to deny the material reality of monsoon winds and rains, but to
acknowledge that “the monsoon” is also, in part, a social construction, produced through
human ideas, terminology, modes of measurement, and representation. Although the concept
of the monsoon refers to material dynamics that exist independently of human imagination and
cognition, there are different ways of conceiving of this materiality and, therefore, differing
conceptions of the monsoon, dependent on the vantage point of the observer. As meteorological
cartographies are practices of apprehending, understanding, and engaging with climatic
environments, they provide a way of tracing monsoonal understandings.
This paper analyses meteorological representations of monsoons from 1844 to 1944,
which corresponds with the rise of statistical meteorological cartography. The paper is divided
into three sections, structured around the representational formats of maritime charts, synoptic
charts, and upper-air charts, which broadly reflect dominant socio-political agendas. From
1844 to 1875, increased availability and standardisation of measured data, along with
technological advances in global communication and mobile meteorological instruments,
produced Maritime Charts which solidified and extended previous constructions of the
monsoon as periodic and predictable. This section focuses on the work of Matthew Fontaine
Maury, whose cartographic constructions added depth and dimension to earlier representations,
turning them into “powerful imaginative devices” that improved maritime routes of
transportation, trade, and exploitation.14 A move towards Synoptic Charts in 1875 coincided
with the establishment of the Indian Meteorological Department (IMD), which initiated the
expansion of land-based observatories, formalised entanglements between science and
colonialism, and provided an organisational structure for systematic investigations of the
monsoon. This section focuses on the work of Henry Blanford, the IMD’s first director, and
John Eliot, his successor. Blanford put observational structures in place to systematise data
collection, which resulted in graphical representations of the monsoon as a forecastable, closed
system. Following Blanford, Eliot published a Climatological Atlas of India, which positioned
the monsoon within a well-defined geographical region, constructing a notion of the
“climatological solidarity of the British Empire around the Indian Ocean”.15 From 1904 to the
end of British operation of the IMD in 1944, it was realised that atmospheric phenomena could
not be considered in geographic isolation, and regionally-defined scientific constructions of the
monsoon began to expand their territory of inquiry, including a shift into the upper-
atmosphere.16 The resulting Upper-Air Charts produced by the IMD, under the direction of
Gilbert Walker, James Hermann Field, and Charles Normand, revealed global teleconnections,
moving monsoonal explorations into a planetary frame. In part, these endeavours were linked
to ambitions to revitalize the British Empire through aviation.17 In analysing these successive
meteorological cartographies and their modes of production, we attempt to track how Western
understandings of the monsoon have been constructed over time—understandings that were
inextricably linked with processes of colonisation.
14 Jason W. Smith, “Matthew Fontaine Maury: Pathfinder,” International Journal of Maritime History 28, no. 2 (2016): 419.
15 H.R.M., “Review: Climatological Atlas of India by John Eliot,” The Geographical Journal 29, no. 3 (1907): 337.
16 Gisela Kutzbach, “Concepts of Monsoon Physics in Historical Perspective: The Indian Monsoon (Seventeenth to Early
Twentieth Century),” in Monsoons, eds. Jay S. Fein and Pamela L. Stephens (New York: John Wiley & Sons, 1987), 201.
17 Gordon Pirie, Air Empire: British Imperial Civil Aviation, 1919-39 (Manchester: Manchester University Press, 2009).

History of Meteorology 9 (2020)
4
Winds that Influence Currents: Maritime Charts from 1844–1875
The monsoon first became known to European mariners as a seasonal reversal of winds,
associated with the Indian Ocean region. These atmospheric movements fundamentally shaped
patterns of trade and exploration, with voyages timed and routes planned in accordance with
prevailing winds. Whilst the word “monsoon” first appeared in English usage in the late
sixteenth century, the first Western visualisation of monsoon winds was produced by Edmond
Halley in 1687 (Fig. 1).18 Halley’s first voyage at sea was facilitated by the East India
Company (EIC), placing his work in a lineage of mapped knowledge for imperial purposes.
Halley’s Account of the Trade Winds, and Monsoons was based on his own experiences of
living in the “Tropicks” and conversations with navigators “acquainted with all parts of
India”.19 Arguing that the “variation [of winds] is better expressed in the Mapp [sic] . . . than
it can well be in words”, his chart outlined the general principles of the winds of the Indian
Ocean.20 Halley understood monsoons to be periodic and predictable, caused by the march of
the sun: “half the Year they blow one way, and the other half near upon the opposite points”.21
Such ideas became firmly established in maritime imaginaries and were transmitted through
the following centuries.
Subsequent nautical guides continued to draw heavily on Halley’s understanding of the
predictable monsoon. In their description of typical monthly weather in relation to sailing
passages, these guides exaggerated and reinforced a sense of monsoonal regularity, giving an
impression of a “clock-work climate”.22 James Capper’s Observations on the Winds and
Monsoons, written in 1801, describes monsoons as shifting winds which “change alternately
every six months, according to the sun in the eliptic [sic]”.23 According to Capper, monsoons
were a discovery of the “enlightened ages” of the fifteenth and sixteenth centuries when
mariners “by help of the compass could venture to extend their voyages beyond sight of land”,
their “discovery” being intimately associated with oceanic voyages.24 Monsoons were
therefore, first and foremost, associated with oceans and seasonal shipping routes, which
shaped initial understandings and depictions.
18 Sunil Amrith, Unruly Waters: How Mountains Rivers and Monsoons Have Shaped South Asia’s History (London: Penguin
Books, 2018): 22.
19 Edmond Halley, “An Historical Account of the Trade Winds, and Monsoons, Observable in the Seas Between and Near the
Tropicks, with an Attempt to Assign the Physical Cause of the Said Winds,” Philosophical Transactions of the Royal Society
16, no. 183 (1687): 153. Emphasis in original.
20 Ibid., 155.
21 Ibid., 158.
22 Christian O’Brien, “A Brief History of the Monsoon,” (unpublished manuscript, 2011), typescript, 28.
23 James Capper, Observations on the Winds and Monsoons: Illustrated with a Chart, and Accompanied with Notes,
Geographical and Meteorological (London: C. Whittingham, 1801): xx.
24 Ibid., xxi.

History of Meteorology 9 (2020)
5
Fig. 1. Map of the trade winds in the Atlantic and Indian Oceans. Source: Halley, “An Historical
Account,” no page. Image courtesy of Royal Society.
Whilst largely effective in enabling oceanic travel and trade across the region, these
early descriptions of the monsoon did little to provide “adequate instructions for utilizing the
winds to the best advantage”.25 Although Britain had established the largest merchant fleet in
the world by the nineteenth century, voyages were still largely confined to established trading
routes and passages were highly weather dependent. For Britain, ensuring profits from foreign
lands was dependent on identifying optimal transportation, which made improvements to
navigational techniques of the utmost importance.26 Unsurprisingly, oceans and their winds
became the object of intense scientific study, reflecting the geopolitical ambitions of maritime
nations. As much of the British fleet consisted of sailing ships, “a science of the winds had an
obvious national interest”.27 Between Britain and the US, the scientific study of oceans became
a priority in the consolidation of economic and political power.28 Drawing upon the US Navy’s
vast collection of ships’ logs, the American oceanographer Matthew Fontaine Maury
developed a cartographic method of using line weights, line types, and colour that gave depth
to geospatial charts and helped “enable the navigator” to “blaze his way” across the ocean,
“upon the wings of the wind”.29 Whilst mariners were knowledgeable about specific regional
conditions, Maury’s charts were the first comprehensive compilation of wind observations on
a global scale. Consequently, Maury became known as the “pathfinder of the seas” and
produced well-defined navigation routes based on dominant wind patterns, enabling
considerably shorter sailing times.30
25 Norman J.W. Thrower, “Edmond Halley as a Thematic Geo-Cartographer,” Annals of the Association of American
Geographers 59, no. 4 (1969): 659.
26 Vladimir Jankovic, “Climates as Commodities: Jean Pierre Purry and the Modelling of the Best Climate on Earth,” Studies
in History and the Philosophy of Modern Physics 41, no. 201 (2010): 207.
27 Anderson, Predicting the Weather, 3.
28 Michael S. Reidy and Helen M. Rozwadowski, “The Spaces in Between: Science, Ocean and Empire,” Isis 105, no. 2 (2014):
340.
29 Matthew Fontaine Maury, The Physical Geography of the Sea (London: Sampson Low, Son & Co., 1855), 262.
30 Charles Lee Lewis, Matthew Fontaine Maury: The Pathfinder of the Seas (Annapolis: The United States Naval Institute,
1927).

History of Meteorology 9 (2020)
6
Addressing gaps in the data collection of previous generations, Maury saw mariners as
his “corps of observers” and “co-labourers in science”.31 By 1844 he had created and
distributed a systematised logbook for the collection and submission of weather observations.
Aided by the invention of more stable and mobile instruments, like the aneroid barometer, these
observations included wind and current direction and velocity, ocean temperature, latitude and
longitude, and air pressure.
Each navigator was to enter in his abstract-log every day in the year the temperature of air and water, the
direction of the wind, and set of the currents, the height of the barometer, &c. He was also to cast overboard
at stated periods bottles tightly corked, containing, on a slip of paper, his latitude and longitude and the
day of the month and year. He was to pick up all such bottles found floating, note latitude and longitude
of place found, and day of months and year in the abstract-log and forward all to the Observatory.32
The millions of observations that these logs produced provided Maury with the material
to construct his Wind and Current Charts. In gratitude for their contributions, Maury provided
his observers with a free copy of the latest edition of his charts. In doing so, he gave his co-
producers the means to guide themselves “across the pathless ocean” with charts made not by
“theory or conjecture, not the faint glimmering of any one man’s experience, but the entire
blaze and full flood of light which the observations of all the navigators that had preceded him
could shed”.33
Capitalising on the revenue-boosting advantages that ocean and wind currents could
provide when seen as a vast and reliable machine, Maury chose to construct his Wind and
Current Charts of the Indian Ocean in two moments, February and August, representative of
the main monsoon seasons. In Maury’s own words, “monsoons, properly speaking, are winds
which blow one half of the year from one direction and the other half from an opposite, or
nearly opposite direction”.34 He further elaborates on their timing, writing “monsoons of the
Indian Ocean prevail really for about five months each way, viz., from May to September from
the southwest . . . and from November to March inclusive from the northeast”.35 Explaining his
intention to represent only the “prevailing direction” of these winds, Maury’s charts continued
to construct the monsoon as regular and predictable.36 In accordance with these ideas, his charts
“abstracted and generalized atmospheric patterns”, whilst establishing credibility through
increased data collection and enriched forms of representation.37 Although these processes of
simplification created powerful devices, as the written text that appears alongside his chart
(Fig. 2) states, “the winds of this Ocean undergo such great, so many, and such regular changes
31 Matthew Fontaine Maury cited in Smith, “Matthew Fontaine Maury,” 416.
32 Diana Fontaine Maury Corbin, A Life of Matthew Fontaine Maury, Author of the Physical Geography of the Sea and Its
Meteorology (London: Sampson Low, Marston, Searle & Rivington, 1888): 57–58.
33 Maury, The Physical Geography of the Sea, vii.
34 Ibid., 217.
35 Ibid., 224.
36 Ibid.
37 D. Graham Burnett, “Matthew Fontaine Maury’s ‘Sea of Fire’: Hydrography, Biogeography, and Providence in the Tropics,”
in Tropical Visions in an Age of Empire, eds. Felix Driver and Luciana Martins (London and Chicago: University of Chicago
Press, 2005), 125.

History of Meteorology 9 (2020)
7
according to the seasons, that it has been found very difficult to map them”, hinting at a more
complex reality.38
Nevertheless, in charts such as Fig. 2, the seas emerged in quadrants of quantification,
or measured units of space in which data could be plotted or read. Such charts allowed mariners
to access layers of historical information on wind speed and direction for different seasons of
the year at a glance. Like Halley, Maury placed great confidence in the value of cartography to
express “what volumes of written directions could but imperfectly describe”.39 He took great
care to make sure each subsequent production of the Wind and Current Chart helped the
mariner to visualise the winds, currents, ocean temperatures and meteorology “that he could
rarely discern with his own eye”.40 Showing the typical wind patterns for the month of February
during the Northwest Monsoon on the left, and the typical wind patterns for the month of
August during the Southeast Monsoon on the right, Fig. 2 simplifies the complicated arrow
arrangement of Halley’s 1686 construction of the same phenomena. Like Halley, Maury uses
short strokes to illustrate wind direction as it registers against the movement of a ship; however,
differentiated arrows or strokes express variegated wind types. Seen in Fig. 3, these distinctions
add depth, dimension, and credibility through the graphic construction of detail.
Fig. 2. Monsoon & trade wind chart of the Indian Ocean. Source: Maury et al. Monsoon & trade wind
chart of the Indian Ocean, Series B. Image courtesy of Library of Congress. The image shows
wind data in relation to the navigation of ships.
38 Matthew Fontaine Maury, John Julien Guthrie, R.L. May, United States Bureau of Ordnance and Hydrography, United
States Hydrographic Office, and the United States Naval Observatory, Monsoon & Trade Wind Chart of the Indian Ocean
(Washington, DC: United States Hydrographical Office, 1859). Retrieved from the Library of Congress,
<https://loc.gov/item/2009575919>, on 31 January 2018.
39 Matthew Fontaine Maury, “Blank Charts on Board Public Cruisers,” Southern Literary Messenger 9, no. 8 (1843): 459.
40 Smith, “Matthew Fontaine Maury,” 417.

History of Meteorology 9 (2020)
8
Fig. 3. Monsoon & trade wind chart of the Indian Ocean. Source: Maury et al., Monsoon & trade wind
chart of the Indian Ocean, Series B. Image courtesy of Library of Congress. The image shows
the detailed strokes and symbols used to express wind variations.
Navigators came to trust the solidity of these cartographic practices, to the extent that
some mariners would stick to Maury’s routes even when they encountered contrary winds and
currents. “Maury’s paths were powerful imaginative devices . . . so as to convince mariners
that winds and currents were always predictable and systematic when, in fact, they were not”,
demonstrating the capability of such visualisations to “transform mariners’ ideas about the sea
. . . its order, its laws and its design”.41 In 1858, Maury published another version titled Winds
and Routes (Fig. 4) that explicitly depicted ship routes through wind regions by not conflating
the two into simplified line types. Winds are represented as patterns filling the ocean, with
routes of transporting or obstructing winds layered onto these regions almost as an
infrastructure. The process of communicating existing knowledge and experience through the
cartographic image activated powerful “neural assemblages” that created new knowledge and
pathways.42 The inclusion of data points in the construction of these maps, demonstrated by
the explicit appearance of charted tracks of prior routes, denaturalises constructions of
meteorological and oceanic systems, whilst making the social construction of cartographic
knowledge explicit.43 The result was a visualised set of mapping practices, institutionalised
across time and space, that lent a sense of security and validity to the object of the map and the
winds depicted.44
41 Ibid., 419.
42 Rob Kitchin, Chris Perkins, and Martin Dodge, “Thinking About Maps,” in Rethinking Maps: New Frontiers in
Cartographic Theory, eds. Rob Kitchin, Chris Perkins, and Martin Dodge (London and New York: Routledge, 2009), 14.
43 Pickles, A History of Spaces, 66.
44 Rob Kitchin and Martin Dodge, “Rethinking Maps,” Progress in Human Geography 31, no. 3 (2007): 331–44.

History of Meteorology 9 (2020)
9
Fig. 4. Winds and routes. Source: Matthew Fontaine Maury, The Physical Geography of the Sea
(London: Sampson Low, Son & Co, 1855), Plate VIII. Image courtesy of British Library. The
image shows the direction and force of wind, registered against the movement of ships.
Maury’s expansion of data collection networks and improvements to standardised data
collation, together with the first transatlantic telegram and the widespread distribution of
meteorological instruments, provided a solid foundation for an expanded and systematic
approach to marine meteorology. The 1853 Brussels Convention—convened at Maury’s
instigation—led to the founding of the International Meteorological Organisation (IMO).45 One
of its first acts was to create “an international standard meteorological logbook for ships at
sea”.46 The president of the British Association of Science recommended that this system be
extended to the Indian Ocean on speculation that reducing the length of ocean voyages would
result in substantial annual savings. George Buist, president of the Geographical Society of
Bombay, was meant to coordinate the project, but was unable to do so due to his obligations to
the East India Company. Nevertheless, he later sent Maury six “skeletal charts” containing
observations from over a hundred ships, which perhaps contributed to Maury’s 1859 Monsoon
& Trade Wind Chart of the Indian Ocean.47
45 Stephen J. Dick, Sky and Ocean Joined: The US Naval Observatory 1830–2000 (Cambridge: Cambridge University Press,
2003).
46 Paul N. Edwards, A Vast Machine: Computer Models, Climate Data, and the Politics of Global Warming (Cambridge, MA:
The MIT Press, 2012), 24.
47 Kutzbach, “Concepts of Monsoon Physics,” 166.

History of Meteorology 9 (2020)
10
As well as visualising the monsoon, such weather charts “followed the paths of British
ships and traced a geography . . . that conformed to the contours of Britain’s imperial
interests”.48 Following the IMO’s formation, the Board of Trade’s Meteorological Department
was established in London in 1854. Under the leadership of Captain Robert Fitzroy, this newly
established department “tasked with providing information on marine meteorology” became a
centre for industrial and governmental command.49 As Britain’s Empirical reach grew, so did
concerns over how order could be brought to unruly climatological phenomena that continued
to evade representation and challenge imperial control.50 In response, the Meteorological
Department sought to address these concerns at an increasingly global scale.
Winds that Bring Rains: Synoptic Charts from 1875–1904
Western explorations of the monsoon, initially pertaining to the oceans, gradually
extended to land with the expansion of the British Empire. The East India Company undertook
substantial meteorological monitoring and observation programmes, primarily aimed at
maximising revenue generation and resource extraction from a rain-fed terrain, driven by
knowledge that “an appreciation of monsoon patterns would reduce the impact of periodic
revenue-depleting droughts”.51 Observatories were established in Madras (1792), Calcutta
(1825), Lucknow (1832), Trivandrum (1837), and Poona (1842), often as private
undertakings.52 However, early monitoring was piecemeal, limited by faulty instruments and a
lack of standardisation. Following the Indian Rebellion of 1857, the East India Company was
transferred to the Crown. Territorial acquisition and the need for sustained governance saw
British involvement in India transition from mercantile enterprise to bureaucratic
administration.53 Concerns about India’s improvement and natural disaster mitigation,
including droughts brought on by monsoon failure, became increasingly important in the
justification of imperial governance, as reflected by an intensification of meteorological
observation.54 As land-based observatories and agendas became more established, visual
depictions of the monsoon shifted towards synoptic forecasting techniques and focused on
understanding the monsoon in relation to rainfall. Maritime understandings of monsoons as
seasonally reversing winds become significantly more complex when extended to explorations
of precipitation over land. Endeavours to predict monsoon rainfall resulted in a more systematic
approach to meteorology and an expanded understanding of monsoonal dynamics.
48 Simon Naylor, “Log Books and the Law of Storms: Maritime Meteorology and the British Admiralty in the Nineteenth
Century,” Isis 106, no. 4 (2015): 782.
49 Simon Naylor, “Nationalizing Provincial Weather: Meteorology in Nineteenth-Century Cornwall,” British Journal for the
History of Science 39, no. 3 (2006): 414.
50 Siobhan Carroll, An Empire of Air and Water: Uncolonizable Space in the British Imagination, 1750–1850 (Philadelphia:
University of Pennsylvania Press, 2015).
51 George Adamson, “The Discovery of ENSO,” in El Nino in World History, eds. Richard Grove and George Adamson
(London: Palgrave Macmillan, 2018), 109.
52 S.M. Razaullah Ansari, “On Indian Observatories in the Nineteenth Century,” Proceedings of the Indian History Congress
36 (1975): 523.
53 Kapil Raj, “From Merchants to Imperial Bureaucrats? Territorial Administration and the East
India Company, Seventeenth–Nineteenth centuries,” in Serve the Power(s), Serve the State:
America and Eurasia, eds. Juan Carlos Garavaglia, Michael J. Braddick, and Christian
Lamouroux (Newcastle upon Tyne: Cambridge Scholars Publishing, 2016), 244–74.
54 Adamson, “The Discovery of ENSO,” 110.

History of Meteorology 9 (2020)
11
With the establishment of the Indian Meteorological Department (IMD) in 1875,
India’s first centralised system for meteorological observations was put into place, providing
“the organisational structure for systematic investigations of the monsoon and the first attempts
at seasonal forecasts”.55 The appointment of Henry Blanford as Imperial Meteorological
Reporter to the Government of India (GOI), followed by John Eliot from 1886 to 1904, set the
agenda for the IMD’s first thirty years. Less than a year into the job, Blanford’s first report to
the GOI “practically laid the foundation of the pursuit of scientific meteorology in India”,
establishing key steps for the centralisation of Indian meteorology.56 Blanford, already resident
in Calcutta, requested a central observatory that would enable “the systematic study of the
climate and India as a whole” and the “adoption of uniform methods of observation” to “secure
a basis of accurate data”.57 His initial proposal included a call to expand the number of
observatories, ensure their distribution across the provinces, and establish additional
observatories in Burma, Rajputana, Central India, and the Bombay Presidency. These were to
be networked with those of “neighbouring countries and Europe” to gain a better sense of the
state of weather across the subcontinent.58 Approved in full by the GOI, the quick expansion
of land-based observatories allowed this newly established arm of the imperial government to
take significant strides in defining the monsoon as scientific object.
Immediately following the IMD’s formation, severe drought and subsequent famine
occurred in 1876 and 1877, setting a clear priority for monsoon forecasting. Even with the
assistance of an expanded network of observatories and standardised instruments—in
particular, the thermometer, rain gauge, anemometer, and barometer—Blanford commented,
“we are in the position of a commander on a vast battle-field who can find no eminence from
which he may gain a bird’s eye view of the combat”.59 Determined to find causes and patterns
that would enable the forecasting of future deficits and excesses, Blanford limited his scope of
inquiry to the distribution of air pressure and winds that carried rains across the landmass of
the Indian subcontinent. Reflective of this detailed and mathematical study of the atmosphere,
meteorological cartography shifted towards synoptic charts. These charts, which summarised
atmospheric conditions over a wide area by displaying information on temperature, pressure,
precipitation, wind speed, and direction, became the basis for action for the first thirty years of
the IMD’s investigative practice.
Blanford’s approach appears to have been influenced by Balfour Stewart, director of
Kew Observatory in England, who championed splitting meteorology into two branches of
inquiry: climatic and physical. In an influential article in Nature, he wrote, “we are so mixed
up with the earth and its atmosphere, and the motions of the latter are on so large a scale, that
we find the greatest possible difficulty in grasping their true import”.60 Calling for “a bird’s
eye view of the atmosphere”, Stewart described the need to distance the measurer from that
55 Kutzbach, “Concepts of Monsoon Physics,” 205.
56 D.R. Sikka, “The Role of the India Meteorological Department, 1875–1947,” in History of Science, Philosophy and Culture
in Indian Civilization, Volume XV, Part 4, Science and Modern India: An Institutional History, c.1784–1947, ed. Debi Prasad
Chattopadhyaya (New Delhi: Pearson Longman, 1999), 388.
57 John Eliot, Climatological Atlas of India, published by the authority of the Government of India under the direction of Sir
John Eliot; Issued by the Indian Meteorological Department (Edinburgh: J. Bartholomew & Co., 1906), xi.
58 Sikka, “The Role of the India Meteorological Department,” 388.
59 Henry F. Blanford, The Indian Meteorologist’s Vade-mecum (Calcutta: Office of the Superintendent of Government
Printing, 1877), 99.
60 Balfour Stewart, “Physical Meteorology I: Its Present Condition”, Nature 1, (1869): 102.

History of Meteorology 9 (2020)
12
being measured in order to gain a “general plan of the whole”.61 Blanford recognised the
capacity of the synoptic chart to construct this view, enabling observers to advance their
“knowledge of the laws that regulate the internal movements of the atmosphere”.62 Referring
to Stewart, he outlined the potential for these techniques to put sections of the atmosphere
“under a meteorological blockade”, believing that “a few years would suffice to place our
knowledge of meteorological laws on a very advanced footing”.63 As central concerns of the
British Empire, the Indian subcontinent and its weather were placed at the forefront of
meteorological inquiry.
Tropical settings were understood as natural laboratories, where natural laws could be
traced.64 The notion that “atmospheric change” in the tropics could be “reduced to its
essentials”, presenting “meteorologists with fewer fluctuations to unravel”, underwrote early
synoptic constructions of the monsoon and related cartographic experiments.65 In the early
years of his tenure at the IMD, Blanford wrote, “order and regularity are as prominent
characteristics of our [India’s] atmospheric phenomena as are caprice and uncertainty to those
of their European counterparts”.66 As such, monsoonal dynamics continued to contribute to
constructions of a tropical region defined by regularity. These notions informed the conceptual
invention of distinctions between the temperate and the tropical, “one of the most enduring
themes in the history of global imagining”.67 Conceptions of a simplified atmosphere greatly
informed the IMD’s early work as it began to impose Western scientific ideas on India’s
weather and climate, an effort to reconcile imperial governance with a monsoonal climate.68
In A Practical Guide to the Climates and Weather of India, Ceylon and Burmah,
Blanford describes the process of making synoptic charts, “to render the facts of pressure
distribution evident at a glance”, describing the resulting lines as representing “differences of
pressure in the same way that the contour lines of a map show differences of elevation and the
slope of the ground, enabling one to gather notions of the form of its surface”.69 The
enumerated monsoon emerged through a process of culling and averaging data, and the general
trajectory of the monsoon was revealed through “the course and position of the isobars”.70 For
the first time, synoptic weather maps made it “possible to ‘watch’ storms and other phenomena
develop and move” through dramatic God’s-eye views.71 Whilst Blanford and the IMD were
not the first to use this method of representation, synoptic charts provided a new perspective
for meteorological investigations of the monsoon, as previous charts presented “only idealised
models”.72 Through synoptic depictions, the monsoon emerged as an identifiable, trackable
entity, profoundly transforming representations of, and relations with, atmosphere and
61 Ibid.
62 Blanford, The Indian Meteorologist’s Vade-mecum, 99.
63 Ibid.
64 Anderson, Predicting the Weather, 250.
65 Ibid., 261.
66 Blanford, The Indian Meteorologist’s Vade-mecum, 48.
67 Felix Driver and Luciana Martins, eds., Tropical Visions in an Age of Empire (Chicago: University of Chicago Press, 2005),
3.
68 Mahoney and Endfield, “Climate and Colonialism,” 5.
69 Blanford, A Practical Guide to the Climates and Weather of India, 24.
70 Ibid., 27.
71 Paul N. Edwards, “Meteorology as Infrastructural Globalism,” Osiris 21, no. 1 (2006): 231.
72 Martin Mahoney, “The ‘Genie of the Storm’: Cyclonic Reasoning and the Spaces of Weather Observation in the Southern
Indian Ocean, 1851–1925,” British Journal for the History of Science 51, no. 4 (2018): 618.

History of Meteorology 9 (2020)
13
weather.73 Such charts (Fig. 5) gave a general picture of the atmospheric pressure that
structured seasonal monsoon cycles; however, in their “use of means, without standard
deviations” such constructions concealed variation and variability, and so continued to distort
monsoonal dynamics.74
Fig. 5. Average barometric and wind chart for January (left) and July (right). Source: Blanford, A
Practical Guide to the Weather and Climates of India, 25–26. Image courtesy of British
Library.
In Fig. 5, the weight, or thickness, of the isobaric contour line is the dominant feature
within the frame, drawing the atmosphere into conversation with land—a departure from
previous constructions of ocean and wind currents as correlational and defined by the seas. The
limited field of data collection, then excluding the Indian Ocean, restricts the map to the Indian
subcontinent and the immediate coasts of the British Empire surrounding the Bay of Bengal.
Two types of lines express large- and small-scale barometric changes that occur over the
subcontinent, demonstrating a distinctive pattern of exchange between “January and July, when
the two monsoons [summer and winter] are respectively at their height”.75 Winds are shown
by strokes of variable length that “exhibit the average wind directions” and “the relative
steadiness of the wind is indicated by the lengths of the arrows”, while the air surface is defined
by continuous, solid lines marking isobaric contours of atmospheric pressure.76 In January (Fig.
5, left) the “seat of the highest pressure is in the north-western corner of India” and as it
“decreases steadily southwards” to Ceylon and Sumatra, the isobar in the lower right-hand
corner is shown as “incomplete”.77 In July (Fig. 5, right) the northwestern seat of high pressure
73 Fabian Locher, “Atmosphere of Globalisation: Depressions, the Astronomer and the Telegraph,” Revue d’histoire moderne
et contemporaine 56, no. 4 (2009): 77–103.
74 Chris O’Brien, “Imported Understandings: Calendars, Weather, and Climate in Tropical Australia, 1870s–1940s,” in
Climate, Science and Colonization: Histories from Australia and New Zealand, eds. James Beattie, Emily O’Gorman, and
Matthew Henry (New York: Palgrave Macmillan, 2014), 206.
75 Blanford, A Practical Guide to the Climates and Weather of India, 37.
76 Ibid.
77 Ibid., 27.

History of Meteorology 9 (2020)
14
is replaced by low pressure centres with high pressures occupying the equatorial seas. In all
instances, the isobaric lines meet an abrupt end at the Indian State’s northern and eastern
boundaries. As Blanford and the IMD’s first synoptic construction of the monsoon, these charts
reflect political realities and climatic imaginations. The northern Indian border is treated as a
hard stop and the southern edge of the map is questioned with several “strokes” of wind
extending beyond the frame.
John Eliot succeeded Blanford in 1886 and published the Climatological Atlas of India
in 1906. Drawing upon data collected between 1875 and 1900, the GOI ordered the preparation
of the Atlas to illustrate “all the important features of the climatology of that tropical area as
determined from the results of the observations”.78 According to the GOI, observations from
this period, as “imperial and directed from a central office”, had “reached such a level of
uniformity and accuracy as could warrant the detailed treatment necessary to turn them to
account in establishing the climatology of India”.79 Constructed through careful review of
Blanford’s data, the Atlas is a manifestation of Blanford’s enumerated monsoon, only hinting
at Eliot’s own ideas of a far more complex monsoon system inclusive of vertical and horizontal
dynamical structures reaching well outside of India and the Bay of Bengal. Reminiscent of
Blanford’s earlier work, Eliot’s Atlas includes two double-page charts of the Indian Ocean
(Figs. 6 & 7) illustrating “two seasons of nearly equal period, one being characterized by the
prevalence of dry land winds (Fig. 6), and the other (Fig. 7) by the prevalence of sea winds of
great volume and intensity”.80 These seasons, otherwise known as the North-east Monsoon and
the South-west Monsoon, continued to be considered India’s two defining climatic conditions.
In 1893, Eliot organised an expedition “to collect all available ship-weather data from
the Indian Ocean”.81 This initiative was perhaps prompted by Blanford’s view that
meteorological knowledge of India would remain incomplete until “some system of taking
observation over the middle and northern portion of the India Ocean has been devised and
brought into operation”.,82 Blanford hypothesized that the “distribution of pressure over the
land and sea areas” was the primary driving force behind rainfall “irregularities” over land.83
Following this lead, Eliot’s collation of ship data helped to contextualise the wind strokes and
incomplete isobars from Fig. 5 within the larger framework of data in Figs. 6 & 7. Eliot’s
research provided a “dynamical explanation of the structure of monsoon depressions” as a set
of interconnected forces defined by the horizontal convergence and uplift of air currents over
extended periods of time.84 Reflecting this knowledge in Figs. 6 & 7, the use of colour within
the isobaric contours implies a weighted surface of air oscillating between different locations
over the course of the year. The distinction between highs, depicted in orange to yellow tones,
and lows, depicted in green to blue tones, expresses conditions of hot and dry to cool and wet,
showing “the chief conditions” of “the monsoon alterations of climate and weather in India”.85
These binary representations of two opposing climatic conditions were constructions not only
78 Eliot, Climatological Atlas of India, preface.
79 H.R.M., “Review: Climatological Atlas of India,” 336.
80 John Eliot, “On the Origin of Cold Weather Storms of the Year 1893 in India,” Quarterly Journal of the Royal
Meteorological Society 22, no. 97 (1896): 1.
81 Sikka, “The Role of the India Meteorological Department,” 395.
82 Blanford cited in Ibid., 388-89.
83 Ibid.
84 Ibid., 395.
85 Eliot, Climatological Atlas of India, xxiv.

History of Meteorology 9 (2020)
15
of the monsoon, but of the British Empire surrounding the Indian Ocean and Bay of Bengal. In
depicting a cohesive, bounded atmospheric territory the charts were an attempt to naturalise
colonial state space whilst creating a soothing picture of the chaotic weather events that
presented such obstacles to colonial control.86
Fig. 6. Southern Asia and Indian Ocean showing isobars and winds for January. Source: Eliot,
Climatological Atlas of India, plate 7–8. Image courtesy of British Library.
Reflective of prevailing climatic understandings and their relation to Empire, the
Climatological Atlas of India is not, however, representative of the IMD’s efforts at
forecasting. Whilst such cartographic representations were useful for informing short-term
prediction, they were less informative for long-range prediction. For both Blanford and
Eliot, the project of long-range monsoon forecasting was a matter of great importance, due
to the urgent need to foresee drought and flood events that could harm India’s economy.
The distinctly different frames, presented by Blanford’s 1889 study of isobaric changes over
India and the Bay of Bengal and Eliot’s inclusion of the Indian Ocean in the 1906 Atlas,
convey Eliot’s instinct to look towards the sea for the origins of monsoon winds. From 1893
attention turned to understanding the monsoon’s origins and driving forces through the
routine generation of daily charts using observations extracted from logs of ocean-going
ships, an activity that continued until 1904.87
86 Manu Goswami, Producing India: From Colonial Economy to National Space (Chicago: University of Chicago Press,
2004).
87 Indian Meteorological Department, Administration Report of the India Meteorological Department for the Year 1924–25
and A History of the Department During the Half Century 1875–1924 (Simla: Government of India Press, 1925), 10.

History of Meteorology 9 (2020)
16
Fig. 7. Southern Asia and Indian Ocean showing isobars and winds for July. Source: Eliot,
Climatological Atlas of India, plate 9–10. Image courtesy of British Library.
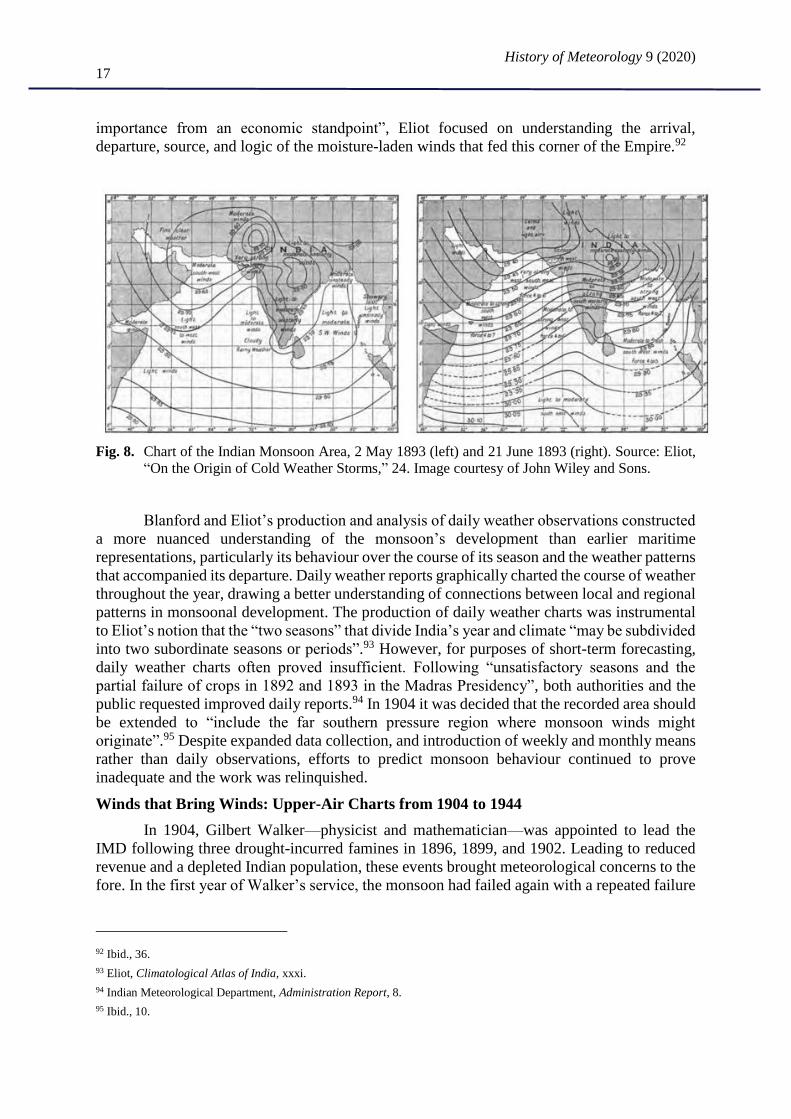
Known as the Indian Monsoon Area Charts, these visualisations outlined the prevailing
characteristics of the Indian monsoon region.88 Comparing two such synoptic charts—Fig. 8,
2 May 1893, and Fig. 9, 21 June 1893—covering the subcontinent including both the Bay of
Bengal and Indian Ocean, Eliot addresses the development of the southwest monsoon relative
to its expected onset. For Eliot, these charts “throw a considerable amount of light” on air
movements and oceanic currents as the monsoon advances and retreats.89 Whilst failing to
garner consensus among meteorologists as to the causes of such meteorological movements,
these studies worked towards defining measurable indicators of monsoon onset.90 Eliot
deduced that shifts in isobaric distribution were not produced by thermal conditions; rather,
they indicated “the transition from the hot weather to the rainy season”, or the “burst of the
monsoon”.91 According to Eliot, erroneous meteorological descriptions of its arrival served
only to produce confusion, as well as suggesting false origins for the monsoon, with
implications for an informed understanding of India’s wet season. As a “subject of the greatest
88 Eliot, “On the Origin of Cold Weather Storms,” 1.
89 Ibid., 7.
90 Ibid.
91 Ibid., 7.
History of Meteorology 9 (2020)
17
importance from an economic standpoint”, Eliot focused on understanding the arrival,
departure, source, and logic of the moisture-laden winds that fed this corner of the Empire.92
Fig. 8. Chart of the Indian Monsoon Area, 2 May 1893 (left) and 21 June 1893 (right). Source: Eliot,
“On the Origin of Cold Weather Storms,” 24. Image courtesy of John Wiley and Sons.
Blanford and Eliot’s production and analysis of daily weather observations constructed
a more nuanced understanding of the monsoon’s development than earlier maritime
representations, particularly its behaviour over the course of its season and the weather patterns
that accompanied its departure. Daily weather reports graphically charted the course of weather
throughout the year, drawing a better understanding of connections between local and regional
patterns in monsoonal development. The production of daily weather charts was instrumental
to Eliot’s notion that the “two seasons” that divide India’s year and climate “may be subdivided
into two subordinate seasons or periods”.93 However, for purposes of short-term forecasting,
daily weather charts often proved insufficient. Following “unsatisfactory seasons and the
partial failure of crops in 1892 and 1893 in the Madras Presidency”, both authorities and the
public requested improved daily reports.94 In 1904 it was decided that the recorded area should
be extended to “include the far southern pressure region where monsoon winds might
originate”.95 Despite expanded data collection, and introduction of weekly and monthly means
rather than daily observations, efforts to predict monsoon behaviour continued to prove
inadequate and the work was relinquished.
Winds that Bring Winds: Upper-Air Charts from 1904 to 1944
In 1904, Gilbert Walker—physicist and mathematician—was appointed to lead the
IMD following three drought-incurred famines in 1896, 1899, and 1902. Leading to reduced
revenue and a depleted Indian population, these events brought meteorological concerns to the
fore. In the first year of Walker’s service, the monsoon had failed again with a repeated failure
92 Ibid., 36.
93 Eliot, Climatological Atlas of India, xxxi.
94 Indian Meteorological Department, Administration Report, 8.
95 Ibid., 10.

History of Meteorology 9 (2020)
18
in 1905, producing what appeared to be a statistical anomaly.96 Within a decade, five years of
monsoon failure had eluded all attempts at long-range prediction. A preoccupation with
synoptic charts had restricted the spatial and temporal scope of geographic and seasonal
inquiries. Towards the end of the nineteenth century meteorologists began to accept that
“atmospheric phenomena could not be considered in isolation”.97 Walker was certain that the
subcontinental dimensions of the monsoon must have some relation to other features of the
global land-ocean-atmosphere system; putting his mathematical training to use he adopted a
more quantitative approach to tackling the problem of long-range forecasting.98 With the global
reach of the British Empire and the early work of the IMO, Walker had access to meteorological
records from across the globe; under his direction, the IMD pioneered statistical forecasting.99
Although cartographic methods had allowed previous generations of meteorologists to use
graphics as a way of drawing-out and establishing hypotheses regarding interrelating factors
of meteorological concern, Walker moved away from geographic limitations and maps, instead
examining the monsoon as a pan-oceanic, planetary system through carefully plotted tables,
charts, and line graphs of numerical data.100
Walker’s quantitative approach to monsoon science differed from previous attempts.
While Eliot’s methods for monsoon forecasting had grown more complex by considering
possible extra-Indian factors, Blanford and Eliot’s work still depended very much on intuition
when it came to interpreting tables and charts.101 In contrast, Walker’s approach was
“resolutely empirical”. 102 Reliant on numerical methods such as correlation-coefficients and
multiple-regression equations, he attempted to eliminate “the personal factor” from the
seasonal forecasting formula.103 With the vast global resources available to him, Walker’s
range of inquiry expanded geographically and considered atmospheric relationships between
the Indian monsoon and inter-seasonal weather in distant parts of the globe. His hypotheses
were informed by previous findings including: Blandford’s discovery of an isobaric opposition
between Siberia and the Indo-Malay region in 1800; and Hoffmeyer’s discovery of associative
isobaric relationships between North Atlantic and European weather systems in 1878.104
Through the lens of the monsoon, Walker’s studies of the atmosphere established foundational
“knowledge of the connections between weather in distant parts of the earth”.105 Skeptical of
graphic representation and the intuitive biases that it might induce, Walker focused instead on
collecting and analysing quantitative information that revealed relationships which could
inform forecasting. This “made the study of conditions over a very wide area unavoidable” and
demanded calculations based on “seasonal, not annual, value” to account for time-based
variability.106 Walker agreed with Eliot’s division of four separate seasons in India and further
asserted that “there was no hope of unravelling the tangled threads of causes and effects” unless
96 Sikka, “The Role of the India Meteorological Department,” 399–400.
97 Kutzbach, “Concepts of Monsoon Physics,” 201.
98 Sikka, “The Role of the India Meteorological Department, 400.
99 Amrith, Unruly Waters, 138-139.
100 Ibid., 139.
101 Baini Prashad, ed., The Progress of Science in India During the Past Twenty-Five Years (Calcutta: Indian Science Congress
Association, 1939), 732.
102 Amrith, Unruly Waters, 138.
103 Prashad, The Progress of Science, 733.
104 Gilbert Walker, “World Weather,” Quarterly Journal of the Royal Meteorological Society 54, no. 226 (1928): 79.
105 Ibid.
106 Ibid.

History of Meteorology 9 (2020)
19
relationships between one or two factors could be proven to have occurred “one or two seasons
before those of the other”, providing some statistical significance.107 This meant that Walker’s
equations worked across seasons to determine the causes of seasonal rotation, rather than
between adjacent periods.
The sheer quantity of data at Walker’s disposal gave multiple dimensions to “empirical
methods”; yet, he writes that graphic representations “are open to some objection”, particularly
when “the disturbing factors are numerous or the connection sought is slight”, as the graphs
may be interpreted differently by each observer.108 Walker did recognize that the “purely
graphic” methods used in the discovery of the isobaric “see-saw” between Argentina and India
or Australia had “produced the first map showing the distribution of the world-wide surge”.109
However, referencing a similar study by Bigelow that had included a more complex set of
values, Walker continued to point to graphic failings stating that the work had been “lessened
by excessive and rather arbitrary smoothing” of data.110 Subsequently, when assessing
scientific methods applied to studies of the Indian monsoon and forecasting models, he stressed
the importance of “not mere visual impressions from plotted curves”, but statistically-proven
relationships.111 With the Empire’s social and economic health dependent on monsoon rainfall
and facing the same challenge as his predecessors, Walker chartered a new territory for
monsoon forecasting based on “twenty-eight factors” which he used to “systematically
examine” interrelations between the Indian monsoon and global circulation patterns.112 For
Walker, thirty years of weather data and comparative numerical analysis revealed clues about
global meteorological affairs through tables and line graphs rather than cartographic depictions.
Through his examinations of global weather data, Walker continued to tweak
calculation methods for monsoon rainfall forecasts. By 1908, he had made significant changes
to the IMD’s mathematical formulas using correlation analysis and multiple regression
equations.113 From this work, Walker determined that his forecasting model required the
“calculated departure” to be “relatively large” for reliable rainfall prediction.114 Significantly,
Walker’s expanded field of study and methods of calculation (Fig. 10) shed light on a “see-
saw” relationship between two atmospheric “centres of action”, one in the Indian Ocean and
the other in the southeast Pacific Ocean.115 Known as the “Walker Circulation”, this discovery
was an important milestone towards understanding dynamic atmosphere-ocean couplings and
is still thought to account for rainfall variations across the tropics.116 While Walker’s
observations helped to put monsoon failures and consequent droughts into wider perspective,
107 Ibid., 79–80.
108 Gilbert Walker, “Correlation in Seasonal Variation of Climate,” in Memoirs of the Indian Meteorological Department, Vol.
XX, Part 6 (Simla: Government Central Branch Press, 1909), 117.
109 Walker, “World Weather,” 79.
110 Ibid.
111 Ibid. Italics not original.
112 D.A. Mooley and B. Parthasarathy, “Indian Summer Monsoon and the East Equatorial Pacific Sea Surface Temperature,”
Atmosphere-Ocean 22, no. 1 (1984): 24.
113 Richard W. Katz, “Sir Gilbert Walker and a Connection Between El Nino and Statistics,” Statistical Science 17, no. 1
(2002): 97–112.
114 Kutzbach, “Concepts of Monsoon Physics,” 203.
115 Katz, “Sir Gilbert Walker,” 97.
116 Mooley and Parthasarathy, “Indian Summer Monsoon,” 24.

History of Meteorology 9 (2020)
20
his work offered “more promise for prediction of events in other regions” than for India.117
Through studying the monsoon, Walker constructed “a productive starting point for a theory
of global teleconnections”.118 Like his predecessors, Walker’s long-range forecasting models
were unsuccessful; however, he remained confident that physical relationships with
“commercial value” were not a “mathematical figment”. 119 If Blanford and Eliot had
attempted to define the origins of the Indian monsoon through regional borders, Walker, who
believed that “knowledge of the connections between weather in distant parts of the earth” had
to be won step by step, had worked to define them by limitless inquiry.120
Fig. 9. Line graph showing the calculated prediction for monsoon rainfall, from June to September,
versus actual rainfall measurements taken from 1880 to 1920. Source: Walker, World
Weather, 86. Image courtesy of John Wiley & Sons.
Walker’s focus on atmospheric dynamics precipitated a shift towards the vertical
expansion of meteorological exploration. Although both Blanford and Eliot contributed to
expanding observation stations across India, especially at higher altitudes, India’s membership
in the International Meteorological Commission (IMC) after 1891 secured further
expansion.121 By 1900–1901, India’s network of surface observatories had grown to 230
stations.122 In 1912, with support from the Royal Society of London, Walker persuaded the
English Secretary of State to fund an upper air observatory in Agra “to systematically undertake
upper-air experiments for a period of ten years”.123 Under Walker’s direction, James Hermann
Field designed and led the Agra Observatory. Previously based in Simla, Field had made early
upper-air observations using balloons and kites across India “with the object of investigating
upper-air conditions during the south-west monsoon”.124 Field charted the position of his kites
in daily weather reports (Fig. 10), locating them in relation to air pressure, wind, and rainfall
117 Charles Normand, “Monsoon Seasonal Forecasting,” Quarterly Journal of the Royal Meteorological Society 79, no. 342
(1953): 469.
118 Kutzbach, “Concepts of Monsoon Physics,” 205.
119 Gilbert Walker, “Seasonal Weather and Its Prediction,” Nature 132 (1933): 807.
120 Walker, “World Weather,” 79.
121 Edwards, A Vast Machine, 53.
122 Sikka, “The Role of the India Meteorological Department,” 396.
123 Ibid., 397.
124 G.C. Simpson, “Obituary: James Hermann Field, C.S.I.,” The Meteorological Magazine 72, no. 857 (1937): 119.

History of Meteorology 9 (2020)
21
data. Located in India’s northern plains, “near the boundary of the two main monsoon
currents”, Agra was ideally positioned as a launch pad for investigating the upper air dynamics
of the monsoon—charting a future path for the IMD.125
Fig. 10. Pressure in millimetres (mm.) and winds at 8:00 on 14 July 1907 with rainfall in the mm. of
ensuing 24 hours (left). Pressure in mm. and winds at 8:00 on 17 July 1907 with rainfall in
the mm. of ensuing 24 hours (right). Source: James Hermann Field, Kite flights in India and
over the neighbouring sea areas during 1907, Memoirs of the Indian Meteorological
Department, Vol. XX, Part 7 (Simla: Government Central Branch Press, 1908), 141. Image
courtesy of British Library.
Field succeeded Walker as director of the IMD in 1924. Whilst in Agra, he had
pioneered investigations of the “free atmosphere”, and importantly his early analysis of upper-
air temperature over India uncovered discrepancies between air temperatures at different
altitudes within the stratosphere. 126, His discoveries included a “fall in temperature over India
. . . marked by strong temperature inversion”, which differed from Europe and the USA.127
These were significant findings for long-range forecasting models and indicated a new
exploratory plan for monsoon science. By the end of the nineteenth century, meteorologists
had gained a basic knowledge of global atmospheric flows, but establishing a scientific basis
for seasonal prediction would require “observations at different altitudes”.128 This indicated a
125 India Meteorological Department, Report on the Administration of the Meteorological Department of the Government of
India in 1938–39 (New Delhi: Government of India Press, 1939), 2.
126 James Hermann Field, “The Meteorology of India,” Journal of the Royal Society of Arts 82, no. 4256 (1934): 787.
127 Sikka, “The Role of the India Meteorological Department,” 397.
128 Normand, “Monsoon Seasonal Forecasting,” 468.

History of Meteorology 9 (2020)
22
shift in perspective with an emphasis on vertical analysis as a way of seeing, ordering, and
understanding atmospheric circulations.129
This shift ushered in a new era of exploratory mapping. The number of observatories
producing upper-air data significantly increased, enabling “an understanding of the whole body
of air up to the greatest accessible heights”.130 By 1928, in addition to daily weather charts,
trajectories of kite and balloon missions were granted graphic representation (Fig. 11); their
flight patterns indicated wind force and direction at different altitudes and began to draw a
more complex image of the atmosphere. These visualisations improved aviation safety and
advanced understandings of meteorological dangers within India’s air space; these included
“sudden dust storms which may blot out invisibility, rainfall that loses all control of itself,
drifting cloud so low that a landing ground may be lost, and now and again a tornado”.131 Much
like earlier nineteenth-century cartographies of shipping routes, these maps progressed
knowledge about atmospheric phenomena that could be utilised for new, more efficient
transportation routes. Whereas colonial activities on land and sea had relied on surface
knowledge of winds and rain, aviation required knowledge of the upper-airs to extend the
imperial reach vertically.
Reflecting preoccupations with aviation, upper-atmospheric meteorological
explorations constructed the atmosphere as a traversable space.132 As James Hermann Field
wrote, “a great revolution in weather requirements has had to be met in India as the flying
services have developed eastwards”, describing advances between 1924 and 1934 as “little
short of magical”.133 By 1934, the IMD’s daily meteorological maps included “a complete and
connected bird’s eye view of the winds sheets over India at seven levels” and improved the
accuracy of daily forecasts.134 Through these efforts, meteorologists achieved the vantage
point Blanford had envisioned in 1877, enabling them to depict atmospheric territories and
geophysical dynamics. Meteorological measurements taken from Agra’s upper-air exploratory
surveys revealed that the height of the tropopause—the atmospheric limit of the troposphere—
is higher over the tropics and shifts with the summer monsoon (Fig. 12).135 Building on these
findings, recent meteorological studies exploring “folds” in the tropopause surface have shown
relationality with “monsoon intensity”.136 Such studies continue to indicate the monsoon’s
importance for knowledge construction.
129 Michael S. Reidy, “The Most Recent Orogeny: Verticality and Why Mountains Matter,” Historical Studies in the Natural
Sciences 47 (2017): 578–87.
130 Field, “The Meteorology of India,” 787.
131 Ibid., 790.
132 Roger Turner, “Weathering Heights: The Emergence of Aeronautical Meteorology as an Infrastructural Science” (PhD
diss., University of Pennsylvania, 2010).
133 Field, “The Meteorology of India,” 788.
134 Ibid.
135 Ibid., 798.
136 Yutian Wu, Gang Chen, Lindsey Taylor, and Pengfei Zhang, “On the Linkage Between the Asian Summer Monsoon and
Tropopause Folds,” Journal of Geophysical Research: Atmospheres 123, no 4 (2018): 2037–49.

History of Meteorology 9 (2020)
23
Fig. 11. Height-time curves of eight special pilot balloon ascents at Agra on 30 March 1928. Source:
Field, The Meteorology of India, 795. Image courtesy of Royal Society of Arts (RSA)
London.
Fig. 12. Temperatures (absolute) in the upper air and stratosphere, from Equator to North Pole:
Summer and Winter half-years. Source: Field, The Meteorology of India, 798. Image
courtesy of Royal Society of Arts (RSA) London.

History of Meteorology 9 (2020)
24
Between 1928 and 1944, Charles Normand served as the IMD’s last British director.
Still under pressure to develop better seasonal forecasting models, he introduced the
“Performance Test”, furthering Walker’s commitments to quantitative monsoon science.137
Whereas Walker had relied on regression equations for eliminating personal bias from
forecasting, Normand’s test provided a new method for determining significant and
insignificant factors.138 Although his meteorological predecessors had long understood the
monsoon to be “pulsatory in character and not characterized by steady conditions”, Normand
continued to advance understandings of its dynamic behaviour.139 In The Weather of India,
Normand describes monsoon conditions over the subcontinent and the location of the monsoon
trough as “not stationary” but moving North and South affecting “rainfall distribution as it
moves”, indicating ongoing concerns with variations in monsoon rainfall over India.140
Significantly, the World Wars brought meteorologists from around the world into
discussion about atmospheric dynamics. Norway’s Bergen School developed models to
examine “frontal surfaces and instabilities” in the “mid-latitude extra-tropical cyclones” which
were found to be controlled by “atmospheric waves in the upper air”.141 Bjerknes’s model for
frontal analysis provided a “powerful method” to aid in forecasting “weather that is caused by
interaction between different types of air masses”.142 As a result, concepts based on air-mass
interactions became so important in India between the 1930s and 1950s that investigations
focused heavily on examining the interplay between them and “the formation of the
monsoon”.143 Conjunctly, Normand’s studies of the monsoon’s atmospheric dynamics led him
to insist that the monsoon is “an active, not a passive feature in world weather”, whose
behaviour advanced understandings of world-wide weather.144 From the late nineteenth century
onwards, meteorologists had worked to uncover the “vertical structure of the monsoon” and
“the three-dimensional nature of atmospheric processes”.145 Building on these developments,
the winds of the upper atmosphere, or the “winds that bring winds”, a piece of the monsoon
puzzle that had been inaccessible to earlier surface investigations, finally found cartographic
expression in the Meteorological Atlas of the International Indian Ocean Expedition in 1972
(Fig. 13). Combining Maury’s oceanic winds, Blanford and Eliot’s regional winds, and Walker,
Field, and Normand’s atmospheric winds, the 1972 Meteorological Atlas constructs a monsoon
of all three.
137 S.R. Savur, "Application of the Performance Test to Seasonal Forecasting of Rainfall in India," Sankhyā: The Indian
Journal of Statistics 2, no. 1 (1935): 2.
138 Prashad, The Progress of Science, 733; Savur, “Application of the Performance Test to Seasonal Forecasting”, 2.
139 E.V. Chelham, “Synoptic Aspects of the Monsoon Circulation and Rainfall Over Indo-Pakistan,” Geology and Geophysics
4, no. 3 (1953): 264.
140 Ibid., citing Normand.
141 Sikka, “The Role of the India Meteorological Department,” 407.
142 Prashad, The Progress of Science, 734.
143 Sikka, “The Role of the India Meteorological Department,” 408.
144 Charles Normand, “Monsoon Seasonal Forecasting,” Quarterly Journal of the Royal Meteorological Society 79, no. 342
(1953): 468.
145 Kutzbach, “Concepts of Monsoon Physics,” 184.

History of Meteorology 9 (2020)
25
Fig. 13. Upper air chart showing mean wind flow for July at 850 millibars (mb). Source:
International Indian Ocean Expedition, Meteorological Atlas of the International Indian
Ocean Expedition (Washington, DC: US Government Publishing Office, 1972), chart 62.
Image courtesy of British Library.
Conclusion
From 1844 to 1944, various meteorological constructions saw the monsoon transition
from a predictable and seasonally reversing wind at sea, to an unpredictable travelling rain
cloud over land, to a tele-connected planetary phenomenon extending into the upper reaches
of the atmosphere. As part of ongoing, nonlinear progressions of monsoonal understandings,
these perspectives were intimately tied to processes of imperial expansion: each phase of
cartographic construction reflected advancing colonial agendas, from oceanic trade and
exploration, to land-based revenue extraction and exploitation, to aerial transportation and
atmospheric globalisation. Tracing the histories of monsoonal cartography reveals the intimate
relations between colonial rule and meteorological science and their contributions to modern
understandings of weather and climate. As an entanglement of material realities and human
concerns, the monsoon has always been as much an ideological construction as a material

History of Meteorology 9 (2020)
26
entity; a meteorological assemblage that has variously catalysed, sustained and thwarted human
ambitions.146
Nineteenth-century understandings of the monsoon were predominantly formed
through measurement and quantification, largely directed by British attempts to master India’s
weather and climate. Towards the end of the period, the graphic techniques that initially
brought shape and form to the monsoon were superseded by mathematical equations which
sought to eliminate personal bias and human intuition. In part, such quantitative explorations
were an attempt to escape the subjectivity of the observer. Through such endeavours, the
monsoon became an abstraction, purified and naturalised through science.147 In the minds of
imperial meteorologists, such techniques of order and measurement would reveal the “laws”
of natural entities, establishing knowledge that could be utilised in the productive control of
nature, the pursuit of governance, and the improvement of colonial territories. Despite these
ambitions and the huge leaps in understanding brought about by constellations of technologies,
instruments, data, and representational techniques, the monsoon continued to defy definition
and prediction.
The various historic constructions of the monsoon that emerge, converge, and diverge
throughout the period considered here describe the monsoon’s different aspects in their
manifest complexity. Like the Indian proverb of blind men touching different parts of an
elephant and giving different accounts of its form, each cartographic construction depicts a
different part of the monsoon system. As a result, the monsoon remains elusive, moving in and
out of focus as successive generations seek to understand, predict, leverage, and control it.
Whilst contemporary meteorology now identifies the monsoon as a “fully coupled ocean-land-
atmospheric system”, it is widely acknowledged that many of its mechanisms, including the
coupled feedbacks, are “yet to be fully explored”.148 As a result, there is still no common
consensus about the monsoon and its dynamics, and no unified scientific definition.149 This
ambiguity demonstrates that human encounters with the monsoon are always inherently partial,
regardless of the methods of observation and associated modes of representation.
Acknowledgements
This work was conducted as part of Monsoon Assemblages, a research project supported by
the European Research Council under the European Union’s Horizon 2020 research and
innovation programme (Grant Agreement no. 679873).
146 Endfield and Randalls, “Climate and Empire.”
147 Bruno Latour, We Have Never Been Modern (New York, London: Harvester Wheatsheaf, 1993).
148 Andrew G. Turner and H. Annamalai, “Climate Change and the South Asian Summer Monsoon,” Nature Climate Change,
vol. 2, (2012): 587.
149 Matthew Alexander Stiller-Reeve, Md. Abu Syed, Thomas Spengler, Jennifer A. Spinney, and Rumana Hossain,
“Complementing Scientific Monsoon Definitions with Social Perception in Bangladesh,” Bulletin of the American
Meteorological Society 96, no 1 (2015): 49–57.