consultation on the second levy triennium: 2015/16 to … · consultation on the second levy...
TRANSCRIPT

1
Consultation on the second Levy Triennium:
2015/16 to 2017/18
Combined Annex
2
CONTENTS Annex A: The PPF-specific model: Definitions and scorecards ..................................................................... 3
1. Experian definitions ............................................................................................................................... 3
2. Scorecards ........................................................................................................................................... 10
Annex B: Analysis of Score Changes from D&B to PPF-specific model ....................................................... 14
Annex C: Impact Analysis............................................................................................................................. 17
Annex D: Asset backed contributions .......................................................................................................... 33
Annex E: Last Man Standing Schemes - example calculation ...................................................................... 34
Annex F: Asset backed contributions – example voluntary certificate ....................................................... 37
3
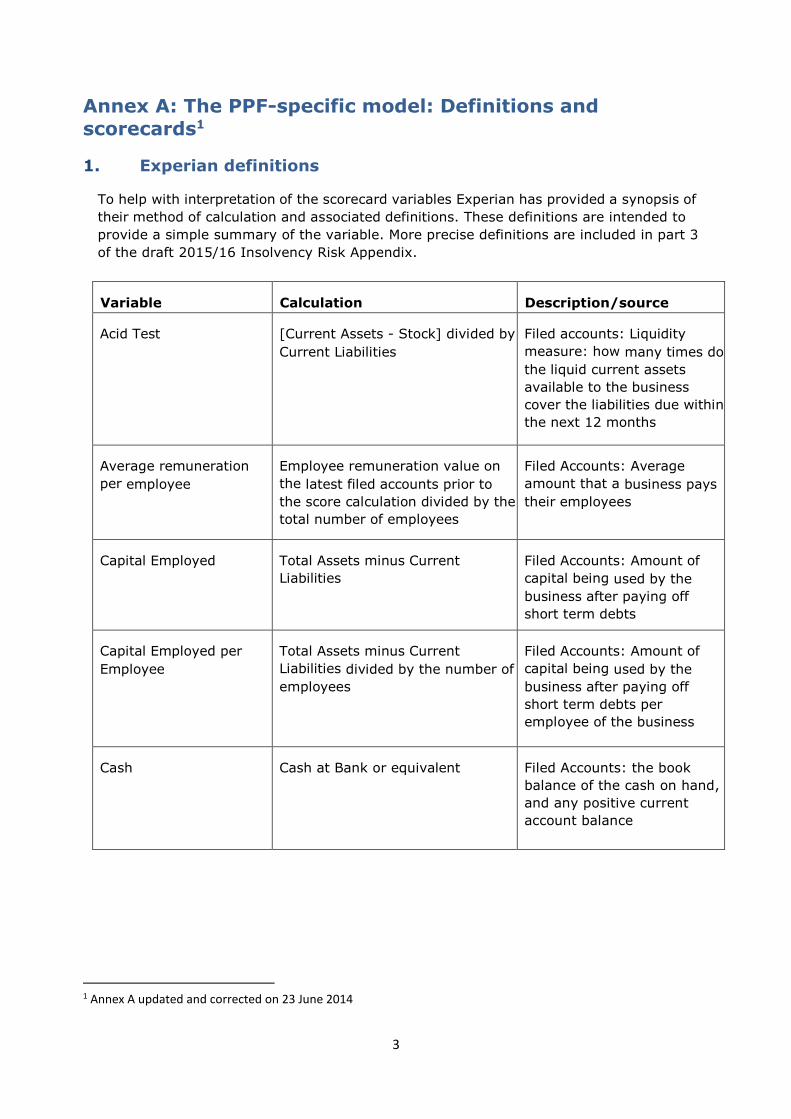
Annex A: The PPF-specific model: Definitions and
scorecards1
1. Experian definitions
To help with interpretation of the scorecard variables Experian has provided a synopsis of
their method of calculation and associated definitions. These definitions are intended to
provide a simple summary of the variable. More precise definitions are included in part 3
of the draft 2015/16 Insolvency Risk Appendix.
Variable
Calculation
Description / source
Calculation Description/source
Acid Test [Current Assets - Stock] divided by
Current Liabilities
Filed accounts: Liquidity
measure: how many times do
the liquid current assets
available to the business
cover the liabilities due within
the next 12 months
Average remuneration
per employee
Employee remuneration value on
the latest filed accounts prior to
the score calculation divided by the
total number of employees
Filed Accounts: Average
amount that a business pays
their employees
Capital Employed Total Assets minus Current
Liabilities
Filed Accounts: Amount of
capital being used by the
business after paying off
short term debts
Capital Employed per
Employee
Total Assets minus Current
Liabilities divided by the number of
employees
Filed Accounts: Amount of
capital being used by the
business after paying off
short term debts per
employee of the business
Cash Cash at Bank or equivalent Filed Accounts: the book
balance of the cash on hand,
and any positive current
account balance
1 Annex A updated and corrected on 23 June 2014
4
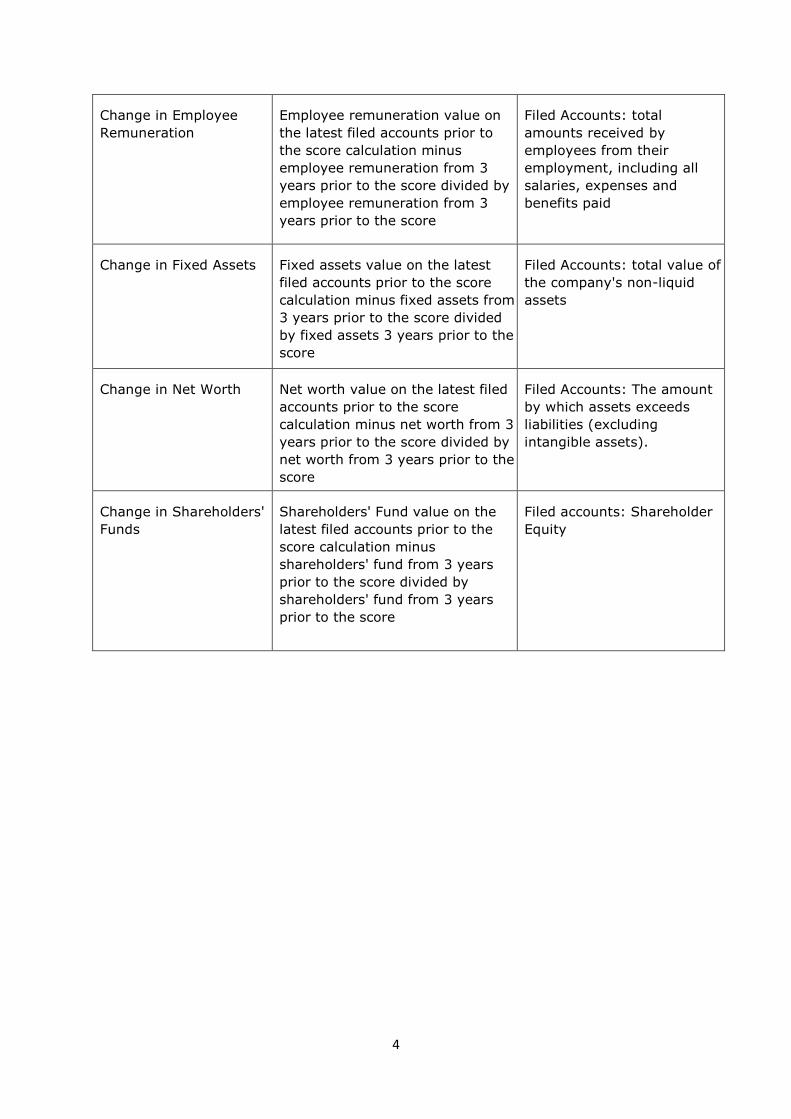
Change in Employee
Remuneration
Employee remuneration value on
the latest filed accounts prior to
the score calculation minus
employee remuneration from 3
years prior to the score divided by
employee remuneration from 3
years prior to the score
Filed Accounts: total
amounts received by
employees from their
employment, including all
salaries, expenses and
benefits paid
Change in Fixed Assets Fixed assets value on the latest
filed accounts prior to the score
calculation minus fixed assets from
3 years prior to the score divided
by fixed assets 3 years prior to the
score
Filed Accounts: total value of
the company's non-liquid
assets
Change in Net Worth Net worth value on the latest filed
accounts prior to the score
calculation minus net worth from 3
years prior to the score divided by
net worth from 3 years prior to the
score
Filed Accounts: The amount
by which assets exceeds
liabilities (excluding
intangible assets).
Change in Shareholders'
Funds
Shareholders' Fund value on the
latest filed accounts prior to the
score calculation minus
shareholders' fund from 3 years
prior to the score divided by
shareholders' fund from 3 years
prior to the score
Filed accounts: Shareholder
Equity

5
Change in Stock and
Work in Progress
Stock and work in progress value
on the latest filed accounts prior to
the score calculation minus stock
and work in progress from 3 years
prior to the score divided by stock
and work in progress 3 years prior
to the score
Filed Accounts: value of
stock held by the company.
This includes goods or
other assets purchased for
re-sale, consumable stores,
raw materials, finished
goods and payments on
accounts for items yet to be
received. When looking at
Stock it is important to
recognise that not all items
are intended for re-sale,
e.g. consumable stores, like
oil for machines, are
included but will never be
sold, they simply assist in
the running of the business.
Work in progress is stock of
an intangible nature. For
example, it will include
work on longer-term
contracts where the end
product is not yet
completed
Change in Total Assets Total assets value on the latest
filed accounts prior to the score
calculation minus total assets from
3 years prior to the score divided
by total assets 3 years prior to the
score
Filed Accounts: all assets
owned by the business
Change in Total Net
Assets
Total net assets value on the latest
filed accounts prior to the score
calculation minus total assets from
3 years prior to the score divided
by total assets 3 years prior to the
score
Filed Accounts: Within the
Not-for-Profit scorecard,
“shareholders funds” are
replaced by Total Net Assets,
which is essentially the same
calculation (the difference
between Total Assets and
Total Liabilities), but reflects
the nature of NFPs and the
lack of shareholders within
these types of organisation.
Change in Turnover Latest turnover figure
minus turnover from 3
years prior to the score
divided by turnover 3
years prior to the score
Filed Accounts: Sales
accrued by the business
6
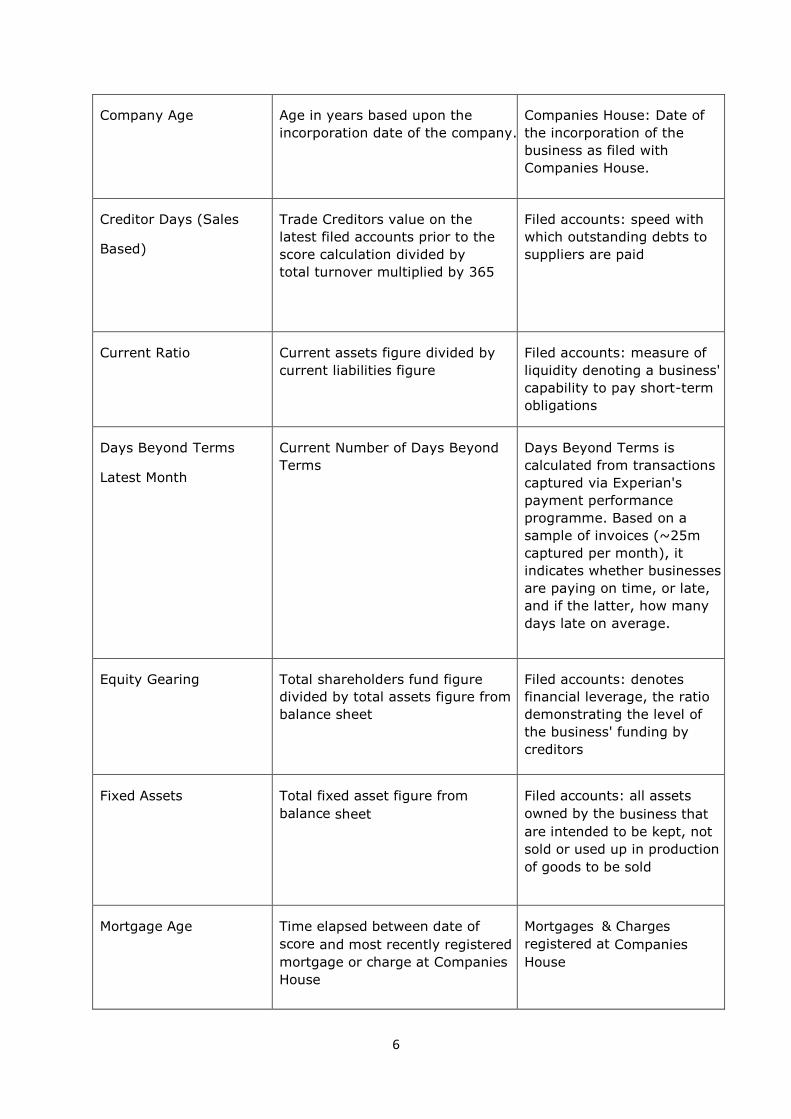
Company Age Age in years based upon the
incorporation date of the company.
Companies House: Date of
the incorporation of the
business as filed with
Companies House.
Creditor Days (Sales
Based)
Trade Creditors value on the
latest filed accounts prior to the
score calculation divided by
total turnover multiplied by 365
Filed accounts: speed with
which outstanding debts to
suppliers are paid
Current Ratio Current assets figure divided by
current liabilities figure
Filed accounts: measure of
liquidity denoting a business'
capability to pay short-term
obligations
Days Beyond Terms
Latest Month
Current Number of Days Beyond
Terms
Days Beyond Terms is
calculated from transactions
captured via Experian's
payment performance
programme. Based on a
sample of invoices (~25m
captured per month), it
indicates whether businesses
are paying on time, or late,
and if the latter, how many
days late on average.
Equity Gearing Total shareholders fund figure
divided by total assets figure from
balance sheet
Filed accounts: denotes
financial leverage, the ratio
demonstrating the level of
the business' funding by
creditors
Fixed Assets Total fixed asset figure from
balance sheet
Filed accounts: all assets
owned by the business that
are intended to be kept, not
sold or used up in production
of goods to be sold
Mortgage Age Time elapsed between date of
score and most recently registered
mortgage or charge at Companies
House
Mortgages & Charges
registered at Companies
House

7
Parent Strength Insolvency score of the parent
corporate group, based upon the
corporate group consolidated
scorecard
Experian's insolvency score;
largely filed accounts but also
including mortgages &
charges registered at
Companies House and days
beyond terms is calculated
from transactions captured
via Experian's payment
performance programme.
Pre-Tax Margin Pre-tax Profit from the P&L divided
by total turnover
Filed accounts: Proportion of
sales over the last accounting
period that can be considered
as profit
Pre-Tax Profit Pre-tax Profit from the P&L Filed accounts: Pre-Tax profit
accrued over the last
accounting period
Retained Earnings Retained earnings figure from the
balance sheet
Filed accounts: Earnings not
paid out as Dividends, but
instead re-invested in the
core business or used to pay
off debt
Return on Assets Pre-tax profit figure from P&L divided by total assets from the
balance sheet
Filed accounts: shows the profit generated from the
assets owned by the business
Return on Capital Pre-tax profit figure from P&L
divided by capital employed from
the balance sheet
Filed accounts: shows the
profit generated from the net
assets owned by the business
Return on Shareholder
Funds
Pre-tax profit figure from P&L
divided by shareholders funds from
the balance sheet
Filed accounts: shows the
profit generated from the
total financial investment in
the company, generated from
and on behalf of the
shareholders
8
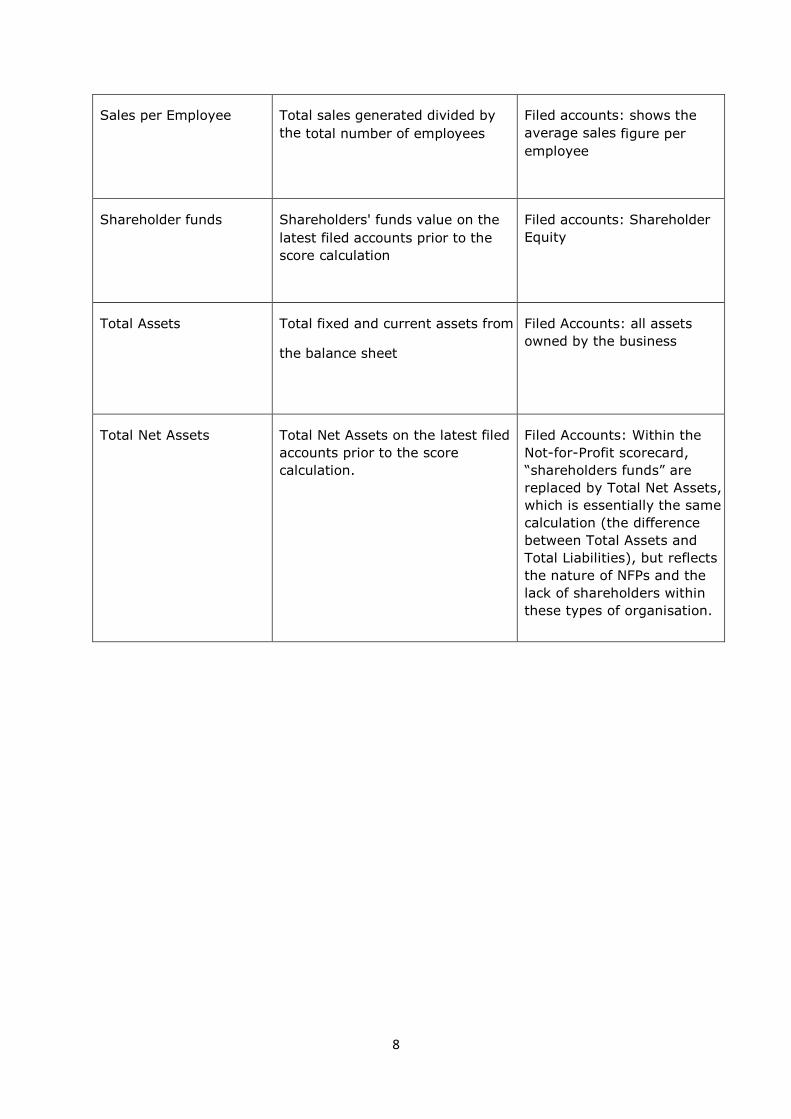
Sales per Employee Total sales generated divided by
the total number of employees
Filed accounts: shows the
average sales figure per
employee
Shareholder funds Shareholders' funds value on the
latest filed accounts prior to the
score calculation
Filed accounts: Shareholder
Equity
Total Assets Total fixed and current assets from
the balance sheet
Filed Accounts: all assets
owned by the business
Total Net Assets Total Net Assets on the latest filed
accounts prior to the score
calculation.
Filed Accounts: Within the
Not-for-Profit scorecard,
“shareholders funds” are
replaced by Total Net Assets,
which is essentially the same
calculation (the difference
between Total Assets and
Total Liabilities), but reflects
the nature of NFPs and the
lack of shareholders within
these types of organisation.
9
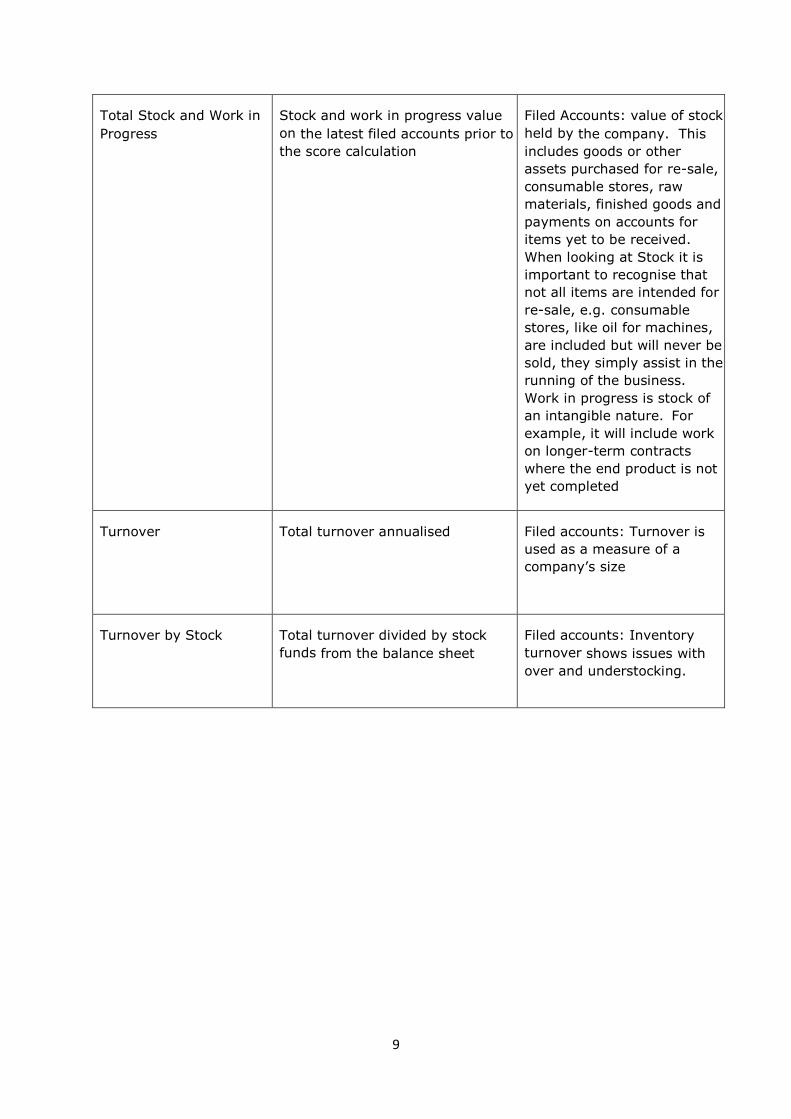
Total Stock and Work in
Progress
Stock and work in progress value
on the latest filed accounts prior to
the score calculation
Filed Accounts: value of stock
held by the company. This
includes goods or other
assets purchased for re-sale,
consumable stores, raw
materials, finished goods and
payments on accounts for
items yet to be received.
When looking at Stock it is
important to recognise that
not all items are intended for
re-sale, e.g. consumable
stores, like oil for machines,
are included but will never be
sold, they simply assist in the
running of the business.
Work in progress is stock of
an intangible nature. For
example, it will include work
on longer-term contracts
where the end product is not
yet completed
Turnover Total turnover annualised Filed accounts: Turnover is
used as a measure of a
company’s size
Turnover by Stock Total turnover divided by stock
funds from the balance sheet
Filed accounts: Inventory
turnover shows issues with
over and understocking.

10
2. Scorecards
Pension Protection Fund (PPF) insolvency risk scores - synopsis of input
variables to scorecards
The following is a list of data input variables identified by Experian that provide a
measure of insolvency risk when applied to the PPF universe of levy payers.
The variables have been used to create 8 insolvency risk scorecards. We show here
the (rounded) weight that each variable has in the scorecard, as estimated by
Experian. These weights do not form a part of the levy calculation. The constants
and gradients needed to calculate a score are set out in the draft levy rules
published alongside this paper – in the Insolvency Risk Appendix.
Independents: Small Accounts Scorecard
Variable
Weight within scorecard
Fixed Assets 22%
Total Stock & Work in Progress 10%
Acid Test 32%
Retained Earnings 23%
Days Beyond Terms: Last Months 13%
Independents: Full Accounts Scorecard
Variable Weight within scorecard
Capital Employed 18%
Return on Shareholder Funds 24%
Turnover 15%
Creditor Days Sales Based 16%
Mortgage Age 18%
Change in Total Assets 9%
11
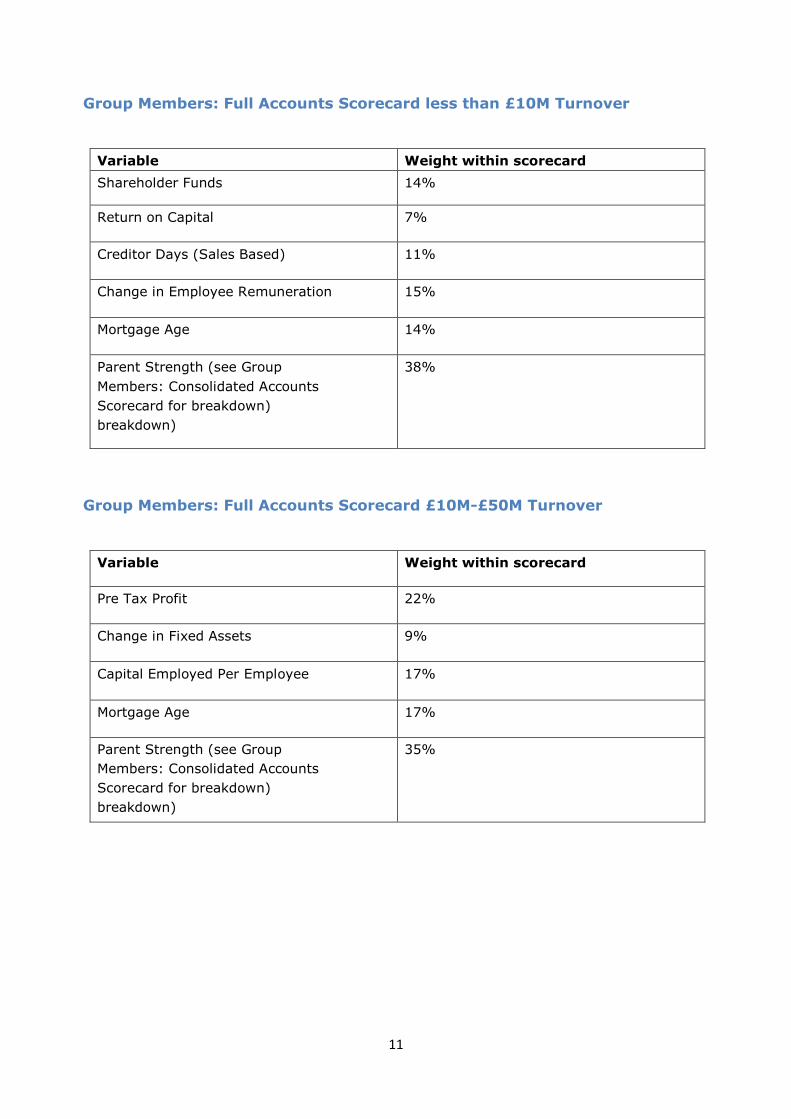
Group Members: Full Accounts Scorecard less than £10M Turnover
Variable Weight within scorecard
Shareholder Funds 14%
Return on Capital 7%
Creditor Days (Sales Based) 11%
Change in Employee Remuneration 15%
Mortgage Age 14%
Parent Strength (see Group
Members: Consolidated Accounts
Scorecard for breakdown)
breakdown)
38%
Group Members: Full Accounts Scorecard £10M-£50M Turnover
Variable Weight within scorecard
Pre Tax Profit 22%
Change in Fixed Assets 9%
Capital Employed Per Employee 17%
Mortgage Age 17%
Parent Strength (see Group
Members: Consolidated Accounts
Scorecard for breakdown)
breakdown)
35%

12
Group Members: Full Accounts Scorecard £50M+ Turnover
Variable Weight within scorecard
Pre Tax Margin 27%
Average Remuneration per Employee 9%
Change in Turnover 15%
Mortgage Age 27%
Parent Strength (see Group
Members: Consolidated Accounts
Scorecard for breakdown)
breakdown)
22%
Group Members: Small Accounts Scorecard
Variable Weight within scorecard
Cash 21%
Retained Earnings 9%
Shareholder Funds 7%
Change in Stock or Work in Progress 21%
Company Age 9%
Parent Strength (see Group
Members: Consolidated Accounts
Scorecard for breakdown)
33%
Group Members: Consolidated Accounts/Large Company Scorecard
Variable Weight within scorecard
Capital Employed 33%
Turnover 17%
Turnover by Stock 17%
Return on Assets 12%
Sales by Employee 5%
Change in Net Worth 3%
Mortgage Age 13%

13
Not for profit scorecard
Variable Weight within scorecard
Capital Employed 41%
Current Ratio 4%
Total Assets 27%
Equity Gearing 10%
Total Net Assets 15%
Mortgage Age 3%

14
Annex B: Analysis of Score Changes from D&B to PPF-specific model
Scorecard Total
Number of
Employers
Number of
Employers
seeing an
improvement
in score
Number of
Employers
seeing a
deterioration
in score
Characteristics of employers
seeing an improvement in
their score
Characteristics of employers
seeing a deterioration in their
score
Individual Full Account 350 147 197
Scores poorly on the BS items under D&B except
for capital employed, which is the only BS item used by Experian under this scorecard (i.e. capital employed >50m)) and,
Scores well on P&L items under Experian including
Creditor Days Sales (i.e. <10 days)and,
Scores well on non-financials under Experian
(i.e. mortgage age >20 years).
Scores poorly on P&L items under Experian
Scores poorly on non-financials under Experian (i.e. mortgage age <6 years).
Non-For-Profit 3364 1553 778
A minority of employers improving on this scorecard as a large proportion of NFP are placed in band 1 under D&B.
Those improving would typically score poorly on non-financials under D&B and,
Score well under Experian on Capital Employed (i.e. >250K), the main
balance-sheet item.
Will be scored 100 by D&B and,
Scores badly under Experian for Capital Employed (i.e. <100K).
15
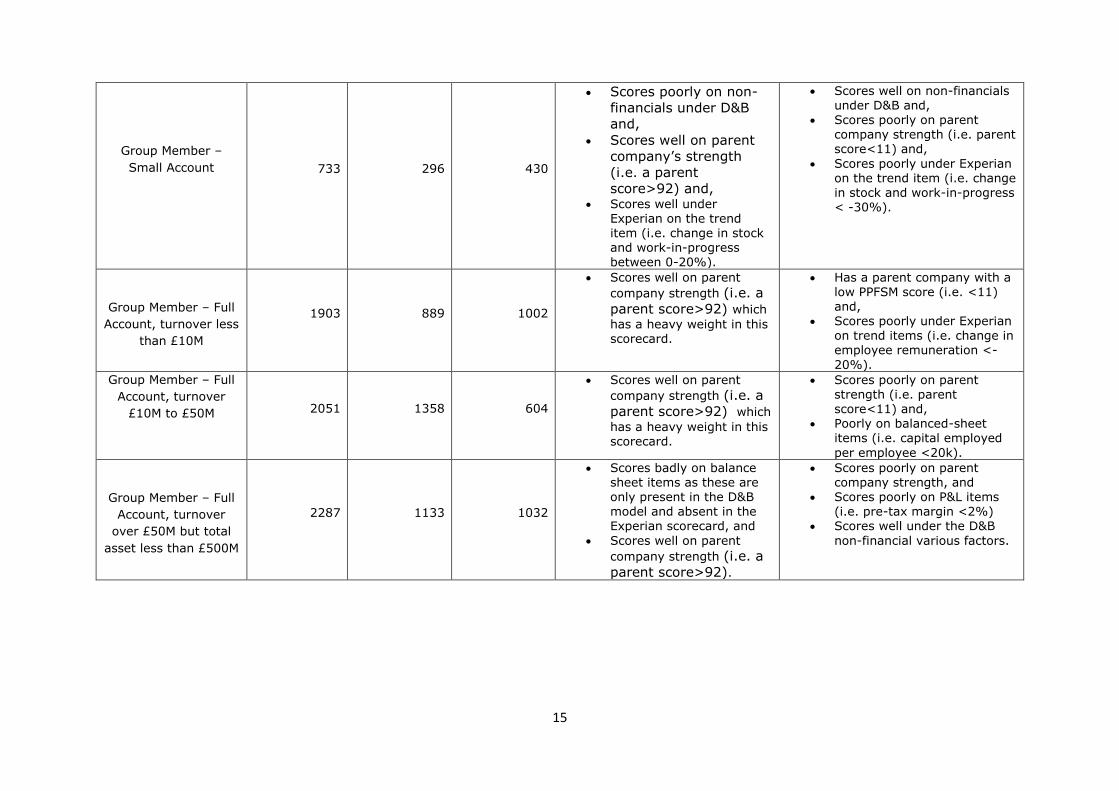
Group Member –
Small Account 733 296 430
Scores poorly on non-
financials under D&B
and,
Scores well on parent
company’s strength
(i.e. a parent
score>92) and, Scores well under
Experian on the trend item (i.e. change in stock and work-in-progress
between 0-20%).
Scores well on non-financials under D&B and,
Scores poorly on parent company strength (i.e. parent score<11) and,
Scores poorly under Experian on the trend item (i.e. change in stock and work-in-progress < -30%).
Group Member – Full
Account, turnover less
than £10M
1903 889 1002
Scores well on parent
company strength (i.e. a
parent score>92) which
has a heavy weight in this scorecard.
Has a parent company with a low PPFSM score (i.e. <11) and,
Scores poorly under Experian on trend items (i.e. change in employee remuneration <-
20%).
Group Member – Full
Account, turnover
£10M to £50M 2051 1358 604
Scores well on parent
company strength (i.e. a
parent score>92) which
has a heavy weight in this
scorecard.
Scores poorly on parent strength (i.e. parent score<11) and,
Poorly on balanced-sheet items (i.e. capital employed
per employee <20k).
Group Member – Full
Account, turnover
over £50M but total
asset less than £500M
2287 1133 1032
Scores badly on balance sheet items as these are only present in the D&B model and absent in the Experian scorecard, and
Scores well on parent
company strength (i.e. a
parent score>92).
Scores poorly on parent company strength, and
Scores poorly on P&L items (i.e. pre-tax margin <2%)
Scores well under the D&B
non-financial various factors.

16
Consolidated Account
or turnover over £50M
and total asset over
£500M
2764 1261 1041
Scores poorly on non-financial (various factors under D&B), and
Scores well on capital employed (i.e. capital
employed >£150k) as this has the largest weight under Experian but little in the case of D&B.
Scores badly on balance sheet items (i.e. capital employed < £0) as this has the largest weight under Experian, and
Scores poorly on P&L items (i.e. turnover <£2.5m),
Scores well on the non-financial various factors under D&B.
Individual Small
Account
618 166 448
By default, companies
filing small accounts will
score poorly on P&L items under D&B while P&L items are not included in the Experian scorecard and,
Companies that have a
strong liquidity as measured by the acid testi (i.e. acid test >1.5) will benefit as this scorecard places a large weight on this ratio,
Score well on payment performance data under Experian (i.e. number of days beyond term <7 days).
Score badly on balanced-
sheet items under Experian
by having a low acid test (i.e. acid test<0.5) and,
Badly on payment performance data under Experian (i.e. number of days beyond term >22 days).

17
Annex C: Impact Analysis
1. Executive Summary
1.1 With the move to the PPF Specific Model (“PPFSM”), there is a large redistribution of levy across our universe, c£200 million in aggregate. This is being primarily driven by many employers seeing their relative ranking
change under the PPFSM relative to the D&B methodology. Employers who retain or improve their relative ranking may see a material reduction in bills
whereas employers whose ranking drops may see an increase in their levy bill.
1.2 The recalibration of rates and bands will also have an impact and by design fewer employers will now sit in the top band.
1.3 As noted in section 2.3 this analysis is indicative, and results may change. In
summary, our analysis shows that:
The cost of the cap applied to the Risk-Based Levy is reduced and so there
is a fall in the scheme based levy (which benefits all schemes) of c£20 million.
Around 50 per cent more schemes see a reduction rather than an increase
– but, since we are collecting the same amount, those with increases see bigger changes.
There is an overall trend of employers being “downgraded” in terms of their band (which could be seen as previously paying too little), resulting in a
large change in levy - in aggregate c£200m of levy movement.
The proposed levy rates reduces this to an extent, so for example if the present levy rates were used with Experian scores the aggregated levy
movement would increase to c£240m.
A large number of schemes see big changes in their levy bill.
For those who remain in band 1 the overall levy falls in almost all cases – because the levy rate is marginally lower as is the scheme based levy.
1.4 From our sample of around 6,100 there are c2,500 schemes with very low
levies (less than £10,000). Omitting these from the analysis, there are c2,100 schemes which see a reduction to their levy (34% of all schemes). Of
these: around 1,500 (24% of schemes) have a decrease of less than
£50,000
around 300 (5% of schemes) have a decrease of more than £50,000 but less than £100,000
around 300 (5% of schemes) have a decrease of greater than £100,000.
1.5 Similarly, among those seeing an increase around 1,500 (24%) schemes. Of these:

18
around 900 (15% of schemes) have an increase of less than £50,000 around 200 (3% of schemes) have an increase of between £50,000
and £100,000 around 200 (3% of schemes) have an increase of between £100,000
and £200,000 around 200 (3% of schemes) have an increase of more than
£200,000.
1.6 The c2,100 who see a reduction are fairly evenly distributed across D&B levy
bands 2 to 7 but with significantly many coming from those that were in D&B band 1 (and remain there). The c1,500 seeing an increase are reasonably evenly distributed across levy bands 2 to 5 but with a high proportion that
have fallen from D&B levy band 1. This migration from band 1 represents to an extent the fact that so many schemes are given a score of 99 or 100 by
D&B. 1.7 In addition to the base case a number of sensitivities have been developed

19
2. Introduction and Methodology
2.1 In order to assess the impact of the changes we have reworked the 2014/15 levy estimate of £695 million allowing for the new scores, levy rates and
bands. In order to isolate the impact of moving to the PPF-specific model (PPFSM), the Levy Scaling Factor (LSF) has been recalculated so that the same levy amount is targeted. We have kept all other factors unchanged
with the exception of the Scheme-Based Levy Multiplier, which has been reset to cover the cost of capping bills in line with our stated policy.
2.2 So that the impact of the move to Experian can be understood in isolation,
the analysis considers only the new insolvency scores, levy rates and bands.
None of the other proposed triennium changes have been included. Further, the analysis excludes the impact of the Credit Rating Override, which is being
proposed as an option for consultation.
2.3 The analysis should be viewed as indicative. As Experian are still gathering
data and scoring more employers, the final levy rates and bands will not be finalised until much later in the year. The analysis should however help
Employers to understand how things are likely to move and the factors that will impact their levy bill. The following are the main factors that could cause
a change:
Experian are continually improving their coverage of our universe
and in particular the not-for-profit sector. For a handful of material schemes impacted we have assumed a neutral impact in terms of
levy bands.
The Board is currently reviewing our target levy collections for the
next triennium. Any change in approach will feed through to the final LSF.
Some companies are part of a non-UK group and as such have non-
UK parent. At the time of the analysis not all foreign parents were
scored and some subsidiaries of non-UK groups were still scored based on the score of the parent at the UK level.
To enable a meaningful comparison, the calculations have been carried out using scores as at 31 March 2013. Actual levy bills will use scores up to 31
March 2015.
2.5 For the purposes of this analysis, multi-employer schemes are allocated to a band by a reverse calculation, deriving a band from the final risk-based levy for that scheme. The scheme is then allocated to the nearest band.

20
3. Shift in the distribution of Levy
3.1 With the move to the PPFSM, a significant redistribution of levy across the bands is expected. There are a number of key factors driving this:
There are considerable changes to employer insolvency scores
provided by Experian compared with D&B.
The approach to banding has seen a more even distribution of
schemes across ten bands than currently. In particular more differentiation at the top means that we are able to have less concentration in band 1 compared to the existing approach. As a
result, many schemes have moved down at least one band.
The progression of levy rates from one band to the next differs under the two approaches. The choice of levy rates in the top bands has been designed to help reduce the impact of schemes
falling out of the top band.
3.2 The expected redistribution of the levy across the bands is illustrated in the chart below:
Chart C.1 Breakdown of levy by band
0%
10%
20%
30%
40%
50%
60%
70%
80%
90%
100%
D&B levy by D&B
band
Experian levy by
Experian band
1 2 3 4 5 6 7 8 9 10

21
4. Results: global
4.1 The levy scaling factor has changed from 0.73 under the D&B approach to 0.74 under the PPFSM.
4.2 The number of schemes that are capped has reduced from around 350 to
330. The aggregate impact of the cap has fallen by approximately £20 million
and as a result the Scheme-Based Levy Multiplier has significantly reduced from 0.0056% to 0.0033% of liabilities.
4.3 In order to provide a meaningful comparison for each band, we need to
consider the combination of the levy scaling factor (LSF) and the levy rates,
as shown in the following table:
Table C.2 Breakdown of levy by band Band D&B Levy Rate Experian Levy
Rate
D&B Levy Rate x
D&B LSF (0.73)
Experian Levy Rate x
Experian LSF (0.74)
1 0.18% 0.17% 0.13% 0.12%
2 0.28% 0.23% 0.20% 0.17%
3 0.44% 0.30% 0.32% 0.22%
4 0.69% 0.40% 0.50% 0.29%
5 1.10% 0.53% 0.80% 0.39%
6 1.60% 0.75% 1.17% 0.55%
7 2.01% 1.10% 1.47% 0.81%
8 2.60% 1.61% 1.90% 1.18%
9 3.06% 2.39% 2.23% 1.76%
10 4.00% 3.83% 2.92% 2.83%
4.4 From table C.2 we expect that schemes which stay in the same band see a
reduced levy because the combined levy rate and levy scaling factor has decreased.
4.5 As one would expect, schemes moving from band 1 to band 2 see increases
in levy in aggregate. The table shows that the increase incurred by schemes
moving from band 1 to band 2 is relatively smaller under the proposed new levy rates (i.e. moving from an aggregate 0.12% to 0.17%) than currently
(moving from 0.13% to 0.20%).
22
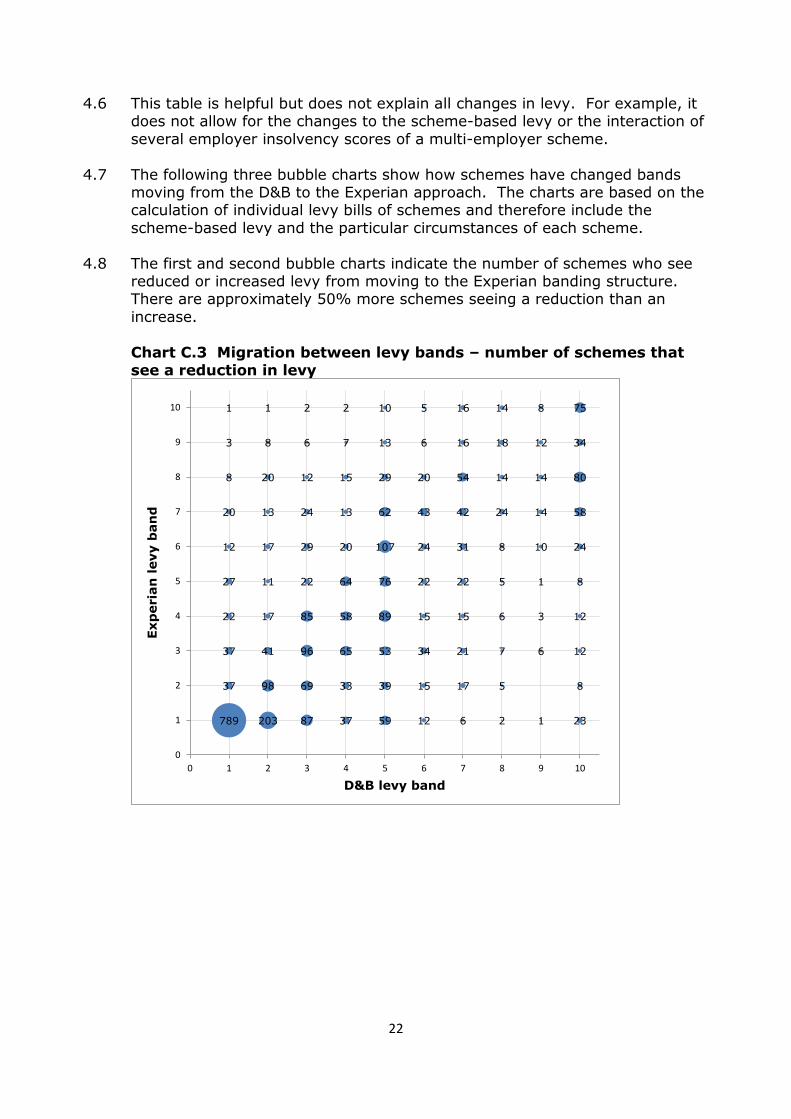
4.6 This table is helpful but does not explain all changes in levy. For example, it does not allow for the changes to the scheme-based levy or the interaction of
several employer insolvency scores of a multi-employer scheme.
4.7 The following three bubble charts show how schemes have changed bands moving from the D&B to the Experian approach. The charts are based on the calculation of individual levy bills of schemes and therefore include the
scheme-based levy and the particular circumstances of each scheme.
4.8 The first and second bubble charts indicate the number of schemes who see reduced or increased levy from moving to the Experian banding structure. There are approximately 50% more schemes seeing a reduction than an
increase.
Chart C.3 Migration between levy bands – number of schemes that see a reduction in levy
789 203 87 37 59 12 6 2 1 23
37 98 69 33 39 15 17 5 8
37 41 96 65 53 34 21 7 6 12
22 17 85 58 89 15 15 6 3 12
27 11 22 64 76 22 22 5 1 8
12 17 29 20 107 24 31 8 10 24
20 13 24 13 62 43 42 24 14 58
8 20 12 15 29 20 54 14 14 80
3 8 6 7 13 6 16 18 12 34
1 1 2 2 10 5 16 14 8 75
0
1
2
3
4
5
6
7
8
9
10
0 1 2 3 4 5 6 7 8 9 10
Exp
eria
n l
evy b
an
d
D&B levy band

23
Chart C.4 Migration between levy bands – number of schemes that see an increase in levy
4.9 From the first bubble chart we see a concentration of schemes with a reduced levy remaining in band 1. In addition, there is a wide distribution of
those with reduced levy, where the scheme has moved up or down bands. This highlights that many schemes gain despite moving to a worse band.
These schemes all pay a low or nil risk-based levy and therefore benefit from the reduction in the scheme-based levy. Currently around 1,000 schemes pay a nil risk-based levy.
4.10 The second bubble chart shows that there are a large number of schemes
that see a significant movement to a worse band, reflecting the fact that our model now classifies them as a worse risk. As one would expect, a worsening in bands does lead to an increase in levy.
4.11 The third bubble chart below sums the change in levy within each band
movement. Most of the results are unsurprising in that a large change in band is reflected by the large reduction or increase in aggregate levy.
4.12 The change in aggregate levies for schemes remaining in the same band, i.e. the diagonal of bubbles from bottom left to top right, is relatively small.
Again highlighting that most of the levy movements are driven by changes to the relative ranking of employers.
10
186 1
222 104
146 85 3
126 76 52
122 82 83 48
111 104 60 59 53
77 62 58 48 83 28
28 26 19 30 54 19 18
23 16 22 10 34 13 25 4 3
0
1
2
3
4
5
6
7
8
9
10
0 1 2 3 4 5 6 7 8 9 10
Exp
eria
n l
evy b
an
d
D&B levy band
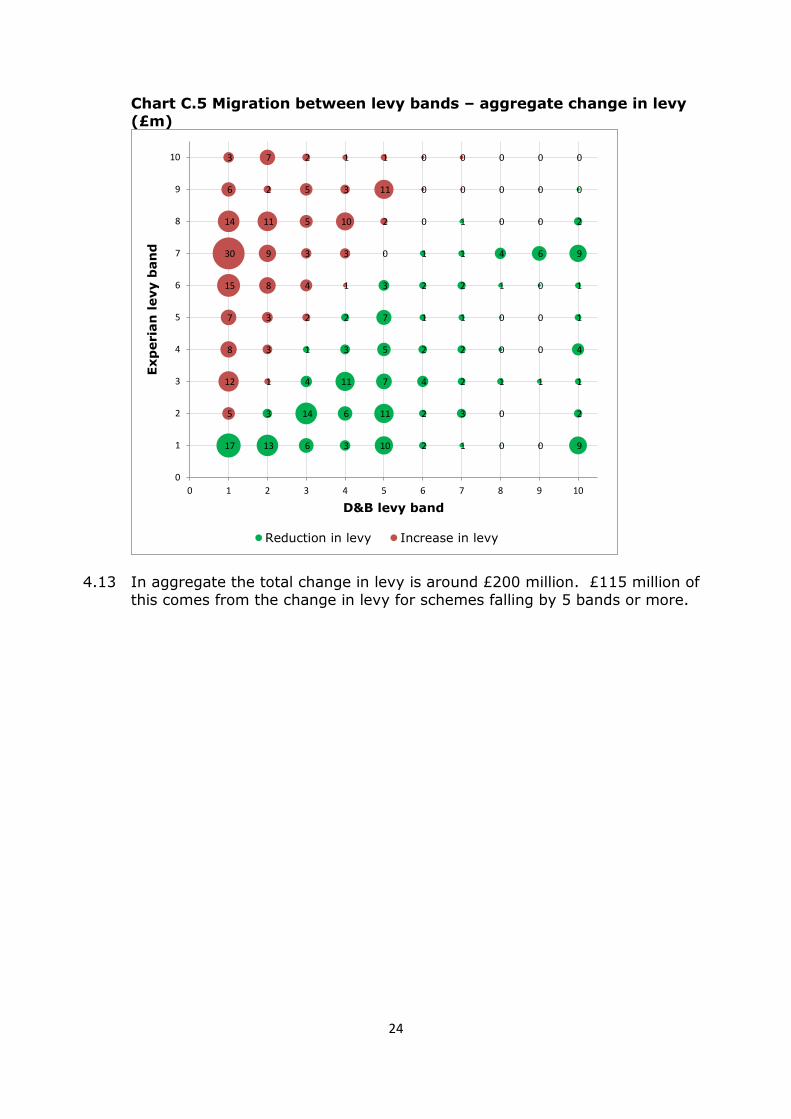
24
Chart C.5 Migration between levy bands – aggregate change in levy (£m)
4.13 In aggregate the total change in levy is around £200 million. £115 million of
this comes from the change in levy for schemes falling by 5 bands or more.
17 13 6 3 10 2 1 0 0 9
3 14 6 11 2 3 0 2
4 11 7 4 2 1 1 1
1 3 5 2 2 0 0 4
2 7 1 1 0 0 1
3 2 2 1 0 1
1 1 4 6 9
0 1 0 0 2
0 0 0
0
5
12 1
8 3
7 3 2
15 8 4 1
30 9 3 3 0
14 11 5 10 2
6 2 5 3 11 0 0
3 7 2 1 1 0 0 0 0
0
1
2
3
4
5
6
7
8
9
10
0 1 2 3 4 5 6 7 8 9 10
Exp
eria
n l
evy b
an
d
D&B levy band
Reduction in levy Increase in levy

25
5. Results: Individual Impacts
5.1 As discussed earlier, a significant redistribution of levy is expected as a result of the move to Experian, with all bills seeing some change.
5.2 From our sample of around 6,100 there are c2,500 schemes with very low
levies (less than £10,000). Omitting these from the analysis, there are
c2,100 schemes which see a reduction to their levy (34% of all schemes). Of these:
around 1,500 (24% of schemes) have a decrease of less than £50,000
around 300 (5% of schemes) have a decrease of more than £50,000
but less than £100,000 around 300 (5% of schemes) have a decrease of greater than
£100,000.
5.3 Similarly, among those seeing an increase around 1,500 (24%) schemes. Of
these: around 900 (15% of schemes) have an increase of less than £50,000
around 200 (3% of schemes) have an increase of between £50,000 and £100,000
around 200 (3% of schemes) have an increase of between £100,000 and £200,000
around 200 (3% of schemes) have an increase of more than
£200,000.
5.4 As we have more with reductions than increases, those who see their bill rise increase by proportionally more on average than for those for whom bills fall.
5.5 For the circa 2,100 with a reduction the average levy decrease is 40%. Of these
around 900 (14% of schemes) have a decrease of less than 25% around 600 (10% of schemes) have a decrease of more than 25% but
less than 50%
for around 600 (10% of schemes) levy is more than halved.
5.6 The biggest reductions in percentage terms are seven schemes that see their bill divided by 20. These are all cases that have moved from band 10 to band 1.
5.7 Similarly, for the 1,500 seeing increases, the average increase is 150%. Of
these around 300 (5% of schemes) have an increase of less than 25% around 600 (9% of schemes) have an increase of between 25% and
100% for around 600 (10% of schemes) levy more than doubles and for
approximately half of these the levy more than trebles.
5.8 As one might expect the 5 with the biggest increases in percentage terms are
those falling out of band 1 who have a high level of underfunding. For these schemes levy is increased between 13 and 20 times.
26
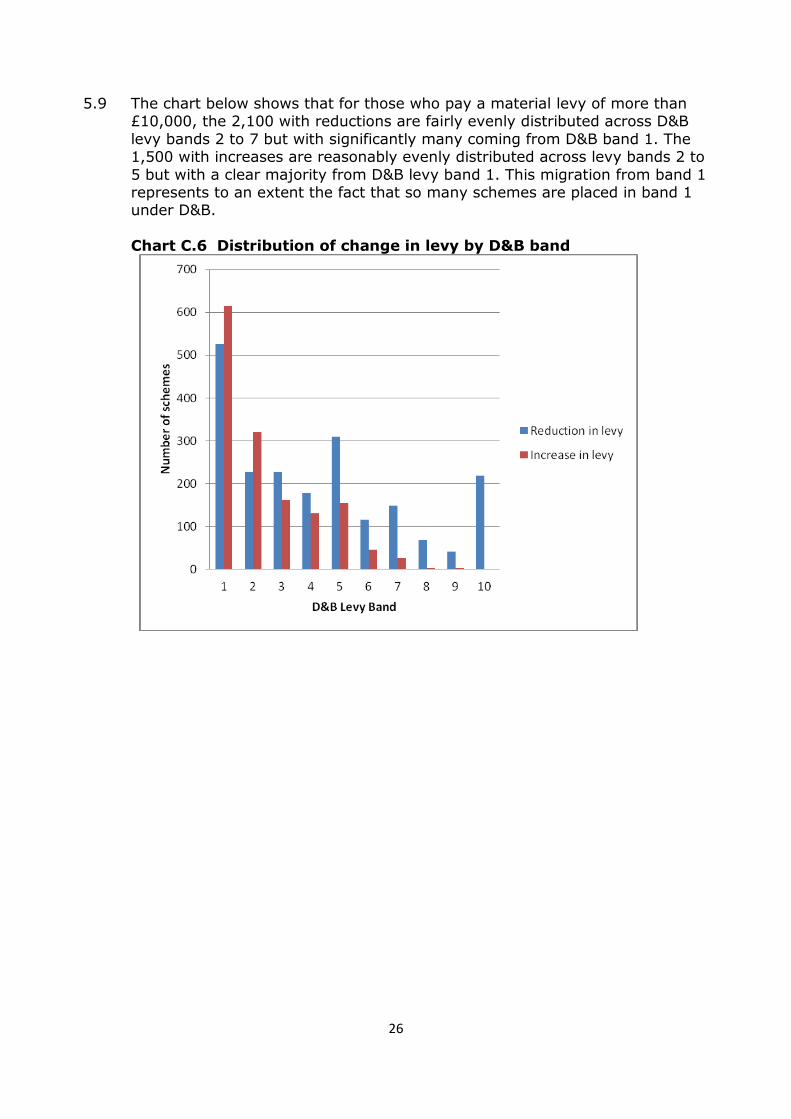
5.9 The chart below shows that for those who pay a material levy of more than £10,000, the 2,100 with reductions are fairly evenly distributed across D&B
levy bands 2 to 7 but with significantly many coming from D&B band 1. The 1,500 with increases are reasonably evenly distributed across levy bands 2 to
5 but with a clear majority from D&B levy band 1. This migration from band 1 represents to an extent the fact that so many schemes are placed in band 1 under D&B.
Chart C.6 Distribution of change in levy by D&B band

27
6. Results: Concentration risk
6.1 A feature of our universe is that a large proportion of our levy comes from a small proportion of our schemes. The chart below shows there is a slight
reduction in concentration following the move to Experian.
Chart C.7 Concentration of levy: percentage of levy collected from
largest schemes
0%
20%
40%
60%
80%
100%
0% 10% 20% 30% 40% 50% 60% 70%
Percen
tge o
f to
tal le
vy b
ill co
llecte
d
Percentage of schemes included (largest levy counted first)
D&B Experian
28
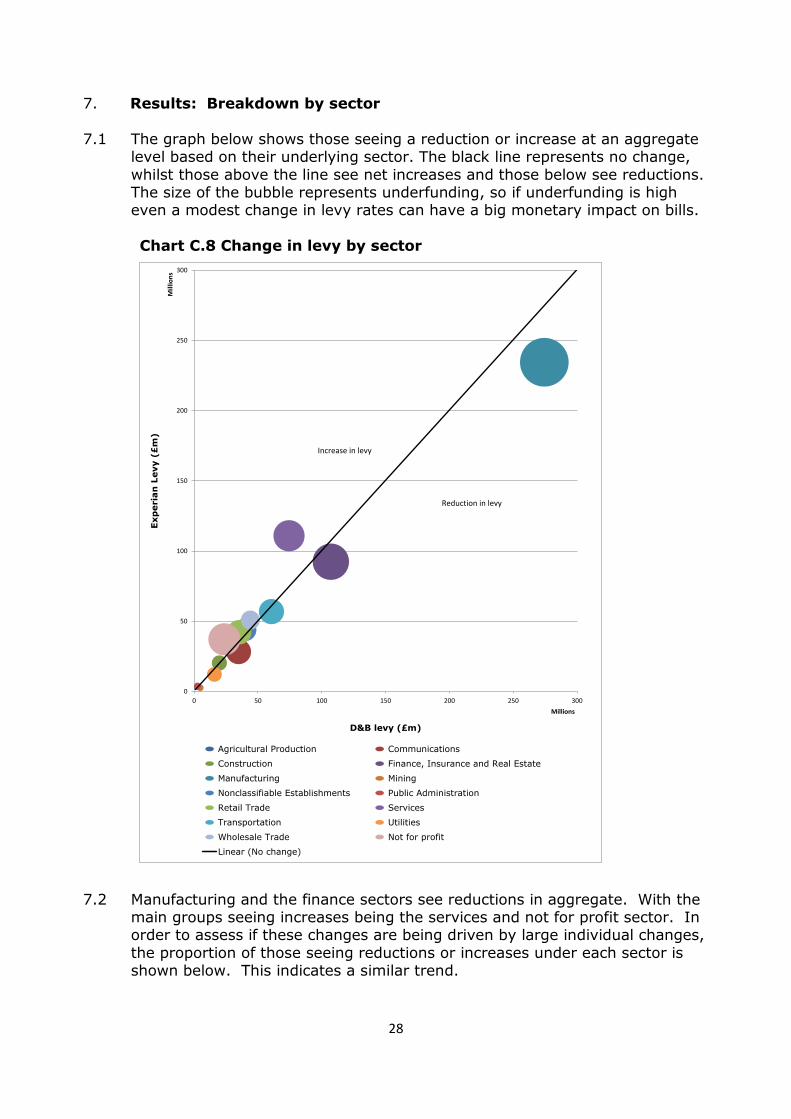
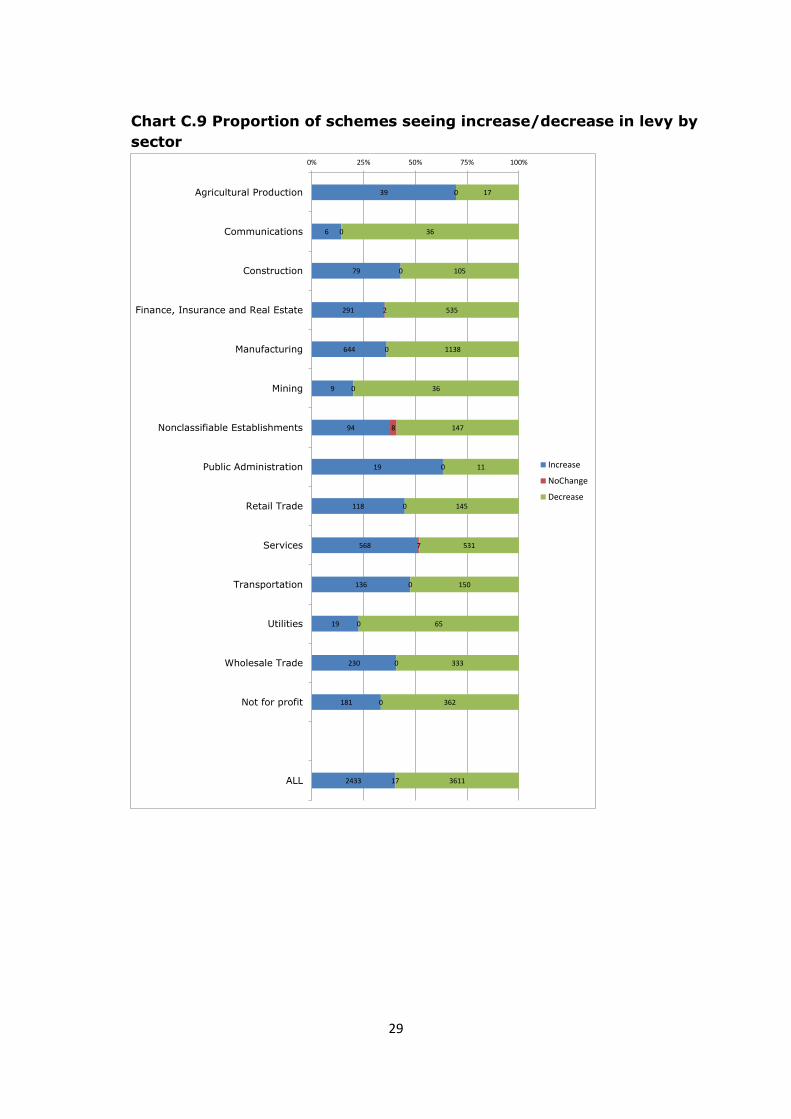
7. Results: Breakdown by sector
7.1 The graph below shows those seeing a reduction or increase at an aggregate level based on their underlying sector. The black line represents no change,
whilst those above the line see net increases and those below see reductions. The size of the bubble represents underfunding, so if underfunding is high even a modest change in levy rates can have a big monetary impact on bills.
Chart C.8 Change in levy by sector
7.2 Manufacturing and the finance sectors see reductions in aggregate. With the
main groups seeing increases being the services and not for profit sector. In order to assess if these changes are being driven by large individual changes,
the proportion of those seeing reductions or increases under each sector is shown below. This indicates a similar trend.
0
50
100
150
200
250
300
0 50 100 150 200 250 300
Exp
eria
n L
evy (
£m
)
Mill
ion
s
D&B levy (£m)
Millions
Agricultural Production Communications
Construction Finance, Insurance and Real Estate
Manufacturing Mining
Nonclassifiable Establishments Public Administration
Retail Trade Services
Transportation Utilities
Wholesale Trade Not for profit
Linear (No change)
Increase in levy
Reduction in levy
29
Chart C.9 Proportion of schemes seeing increase/decrease in levy by
sector
39
6
79
291
644
9
94
19
118
568
136
19
230
181
2433
0
0
0
2
0
0
8
0
0
7
0
0
0
0
17
17
36
105
535
1138
36
147
11
145
531
150
65
333
362
3611
0% 25% 50% 75% 100%
Agricultural Production
Communications
Construction
Finance, Insurance and Real Estate
Manufacturing
Mining
Nonclassifiable Establishments
Public Administration
Retail Trade
Services
Transportation
Utilities
Wholesale Trade
Not for profit
ALL
Increase
NoChange
Decrease
30
8. Transitional Protection
8.1 As discussed in chapter 7 of the main consultation document, we are consulting on whether to provide Transitional Protection for the first year that
we use Experian scores. 8.2 Our proposed approach would be to impose a limit on the increase of the
Insolvency Risk element of the Risk-Based Levy, where the limit reflected the relative impact of Experian compared with the current approach. For example
if we restricted increases to 200% then a single-employer scheme currently in band 1 that would have an Insolvency Risk of 0.18% would have its Insolvency Risk restricted to 0.54% under Experian (assuming there was no
movement in scores under the PPFSM between 2014/15 and 2015/16).
8.3 The protection would apply at a scheme level rather than employer level.
8.4 We have analysed what impact such Transitional Protection would have. We
have found that:
Imposing a limit on increase in insolvency probabilities to 200% to the Insolvency Risk measured relative to D&B would lead to a reduction in
levy collection of around £100m. If we sought to recoup this by increasing the Scheme-Based Levy, this
would cause the Scheme-Based element of the levy to increase close
to the maximum permitted by legislation (20% of the total levy). Thus our introducing Transitional Protection would see a material
increase in levy for those schemes for which the Scheme-Based Levy represented a large proportion of their total.
Around 1200 schemes would see a levy reduction, though around half
of these are schemes that pay less than £10,000 in levy. Some schemes would save material sums of money under such
Transitional Protection (20 schemes would save over £1m and one would save around £7m)
31
9. Sensitivity of results
9.1 As discussed, a significant proportion of the levy movement is being driven by employers seeing a significant re-ranking relative to other employers under
the model. This means that whatever levy design is used, a significant redistribution of levy can be expected. Under the proposed approach, schemes retaining their ranking are rewarded at the expense of those that
see their position deteriorate.
9.2 In order to highlight this point, the results have been calculated using three alternative bases for levy rates. The levy bands have been left unchanged
Scenario 1 – global adjustment to LSF to allow for a £50 million
reduction in levy collection resulting from improved scores
Scenario 2 – D&B levy rates applying
Scenario 3 – A broad band one; for bands one to three the same levy
rate of 0.22%. The levy rate applying to these bands has been
calculated as the average rate applying (weighted by proportion of
employers).
9.3 The table below shows the total levy changing hands under these scenarios
compared with the main results, illustrating that the chosen banding helps to
minimise the overall impacts.
Table C.10 Levy changing hands under different sensitivities
Scenario LSF Levy change (£M)
Base 0.74 200
Adjustment to LSF
to allow for a £50m reduction in levy
0.79 230
D&B rates 0.50 240
Constant rate band 1-3
0.72 200
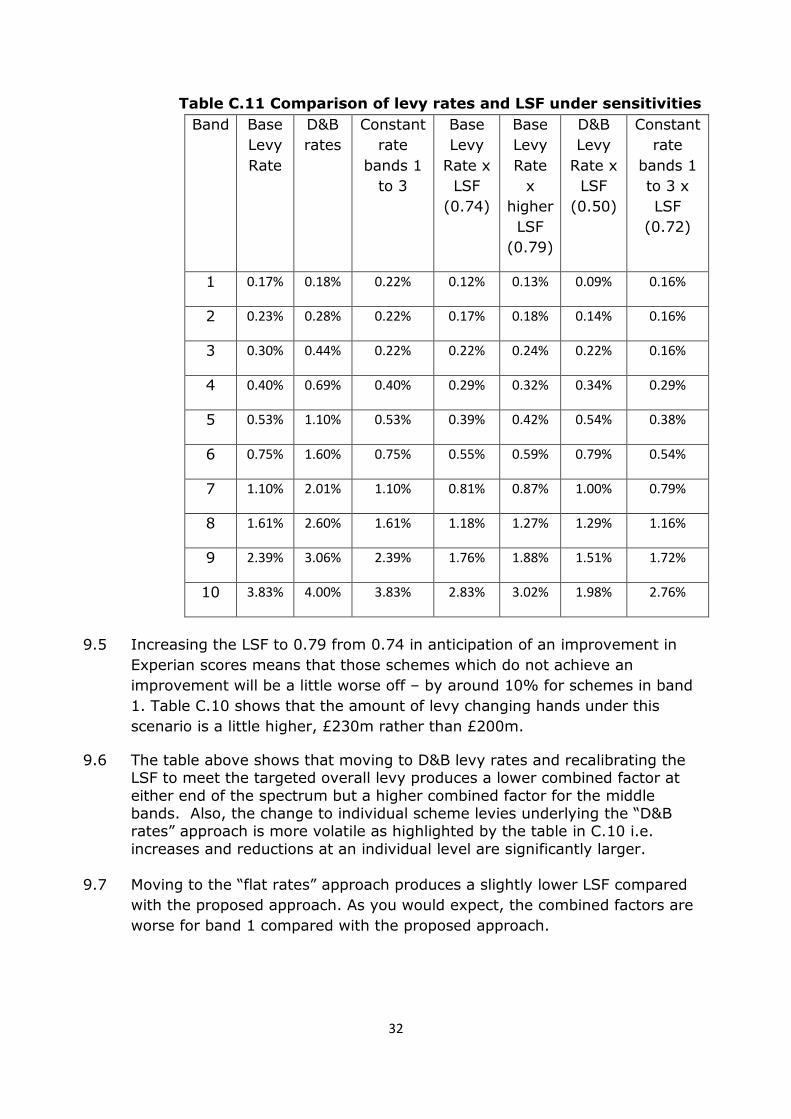
9.4 In order that a comparison across bands can be made, the tables below
combine the levy scaling factor (LSF) and the levy rates:
32
Table C.11 Comparison of levy rates and LSF under sensitivities
Band Base
Levy
Rate
D&B
rates
Constant
rate
bands 1
to 3
Base
Levy
Rate x
LSF
(0.74)
Base
Levy
Rate
x
higher
LSF
(0.79)
D&B
Levy
Rate x
LSF
(0.50)
Constant
rate
bands 1
to 3 x
LSF
(0.72)
1 0.17% 0.18% 0.22% 0.12% 0.13% 0.09% 0.16%
2 0.23% 0.28% 0.22% 0.17% 0.18% 0.14% 0.16%
3 0.30% 0.44% 0.22% 0.22% 0.24% 0.22% 0.16%
4 0.40% 0.69% 0.40% 0.29% 0.32% 0.34% 0.29%
5 0.53% 1.10% 0.53% 0.39% 0.42% 0.54% 0.38%
6 0.75% 1.60% 0.75% 0.55% 0.59% 0.79% 0.54%
7 1.10% 2.01% 1.10% 0.81% 0.87% 1.00% 0.79%
8 1.61% 2.60% 1.61% 1.18% 1.27% 1.29% 1.16%
9 2.39% 3.06% 2.39% 1.76% 1.88% 1.51% 1.72%
10 3.83% 4.00% 3.83% 2.83% 3.02% 1.98% 2.76%
9.5 Increasing the LSF to 0.79 from 0.74 in anticipation of an improvement in
Experian scores means that those schemes which do not achieve an
improvement will be a little worse off – by around 10% for schemes in band
1. Table C.10 shows that the amount of levy changing hands under this
scenario is a little higher, £230m rather than £200m.
9.6 The table above shows that moving to D&B levy rates and recalibrating the LSF to meet the targeted overall levy produces a lower combined factor at
either end of the spectrum but a higher combined factor for the middle bands. Also, the change to individual scheme levies underlying the “D&B rates” approach is more volatile as highlighted by the table in C.10 i.e.
increases and reductions at an individual level are significantly larger.
9.7 Moving to the “flat rates” approach produces a slightly lower LSF compared
with the proposed approach. As you would expect, the combined factors are
worse for band 1 compared with the proposed approach.
33
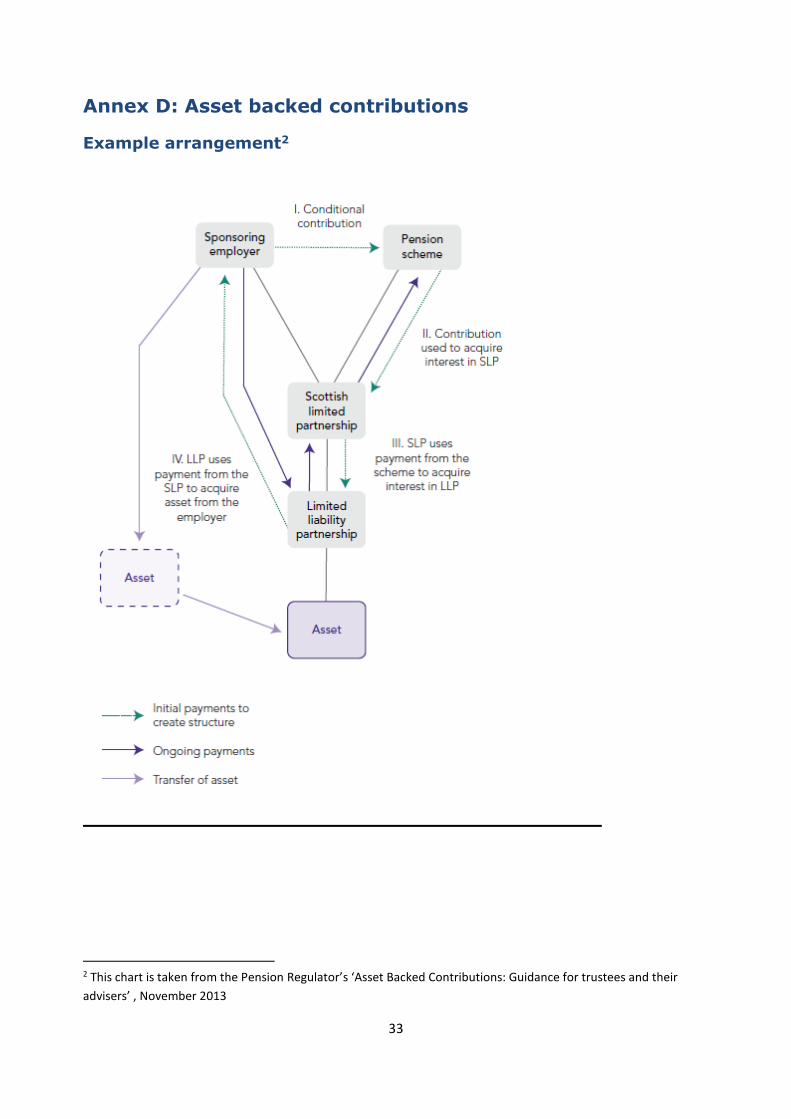
Annex D: Asset backed contributions
Example arrangement2
2 This chart is taken from the Pension Regulator’s ‘Asset Backed Contributions: Guidance for trustees and their
advisers’ , November 2013
34
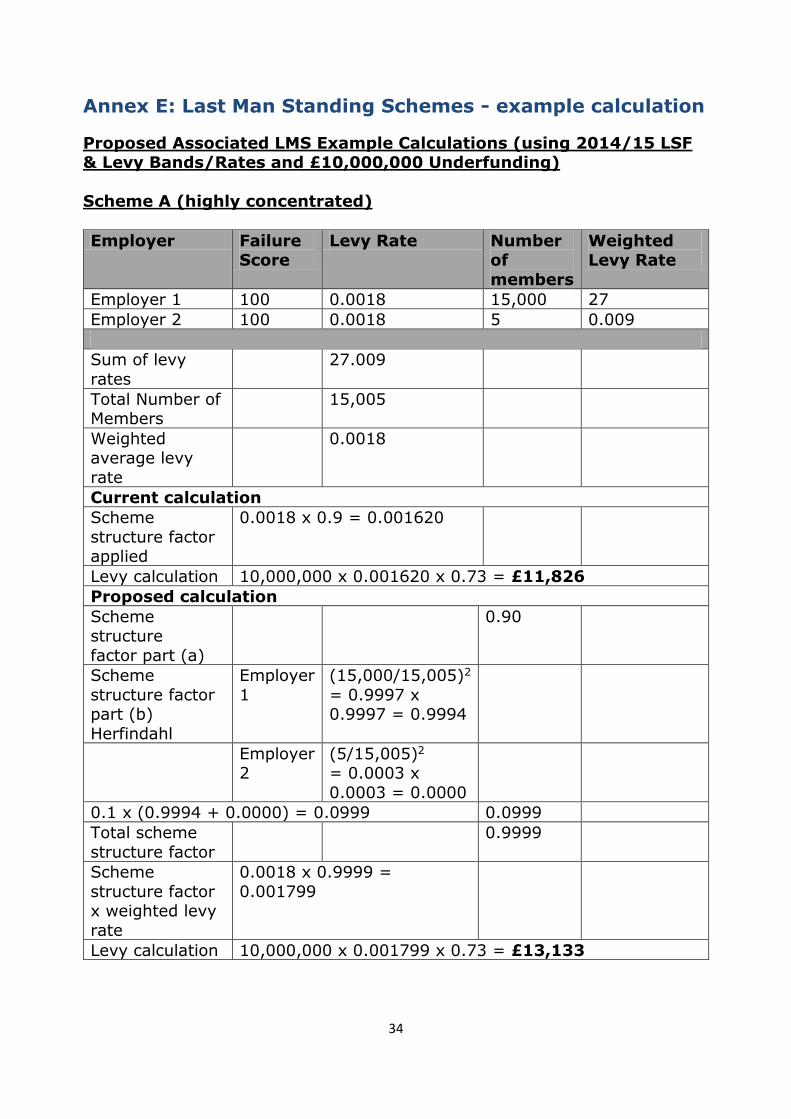
Annex E: Last Man Standing Schemes - example calculation
Proposed Associated LMS Example Calculations (using 2014/15 LSF & Levy Bands/Rates and £10,000,000 Underfunding)
Scheme A (highly concentrated)
Employer Failure Score
Levy Rate Number of
members
Weighted Levy Rate
Employer 1 100 0.0018 15,000 27
Employer 2 100 0.0018 5 0.009
Sum of levy
rates
27.009
Total Number of Members
15,005
Weighted average levy
rate
0.0018
Current calculation
Scheme
structure factor applied
0.0018 x 0.9 = 0.001620
Levy calculation 10,000,000 x 0.001620 x 0.73 = £11,826
Proposed calculation
Scheme structure
factor part (a)
0.90
Scheme
structure factor part (b)
Herfindahl
Employer
1
(15,000/15,005)2
= 0.9997 x 0.9997 = 0.9994
Employer 2
(5/15,005)2
= 0.0003 x
0.0003 = 0.0000
0.1 x (0.9994 + 0.0000) = 0.0999 0.0999
Total scheme
structure factor
0.9999
Scheme
structure factor x weighted levy
rate
0.0018 x 0.9999 =
0.001799
Levy calculation 10,000,000 x 0.001799 x 0.73 = £13,133

35
Scheme B (more dispersed)
Employer Failure
Score
Levy Rate Number
of members
Weighted
Levy Rate
Employer 1 100 0.0018 4,000 7.2
Employer 2 100 0.0018 3,000 5.4
Employer 3 100 0.0018 3,000 5.4
Employer 4 100 0.0018 2,000 3.6
Employer 5 100 0.0018 2,000 3.6
Employer 6 100 0.0018 1,005 1.809
Sum of levy rates 27.009
Total Number of Members
15,005
Weighted average levy rate
0.0018
Current calculation
Scheme structure factor applied
0.0018 x 0.9 = 0.001620
Levy calculation 10,000,000 x 0.001620 x 0.73 = £11,826
Proposed calculation
Scheme structure
factor part (a)
0.90
Scheme structure factor part (b)
Herfindahl
Employer 1
(4,000/15,005)2 = 0.2666 x
0.2666 = 0.0711
Employer 2
(3,000/15,005)2 = 0.1999 x
0.1999 = 0.0400
Employer 3
(3,000/15,005)2 = 0.1999 x
0.1999 = 0.0400
Employer
4
(2,000/15,005)2
= 0.1333 x
0.1333 = 0.0178
Employer
5
(2,000/15,005)2
= 0.1333 x 0.1333 = 0.0178
Employer
6
(1,005/15,005)2
= 0.0670 x 0.0670 = 0.0045
0.1 x (0.0711+ 0.0400 + 0.0400 + 0.0178 + 0.0178 + 0.0045) = 0.0191
0.0191

36
Total scheme
structure factor
0.9191
Scheme structure
factor x weighted levy
rate
0.0018 x 0.9191 =
0.001654
Levy calculation 10,000,000 x 0.001654 x 0.73 = £12,074
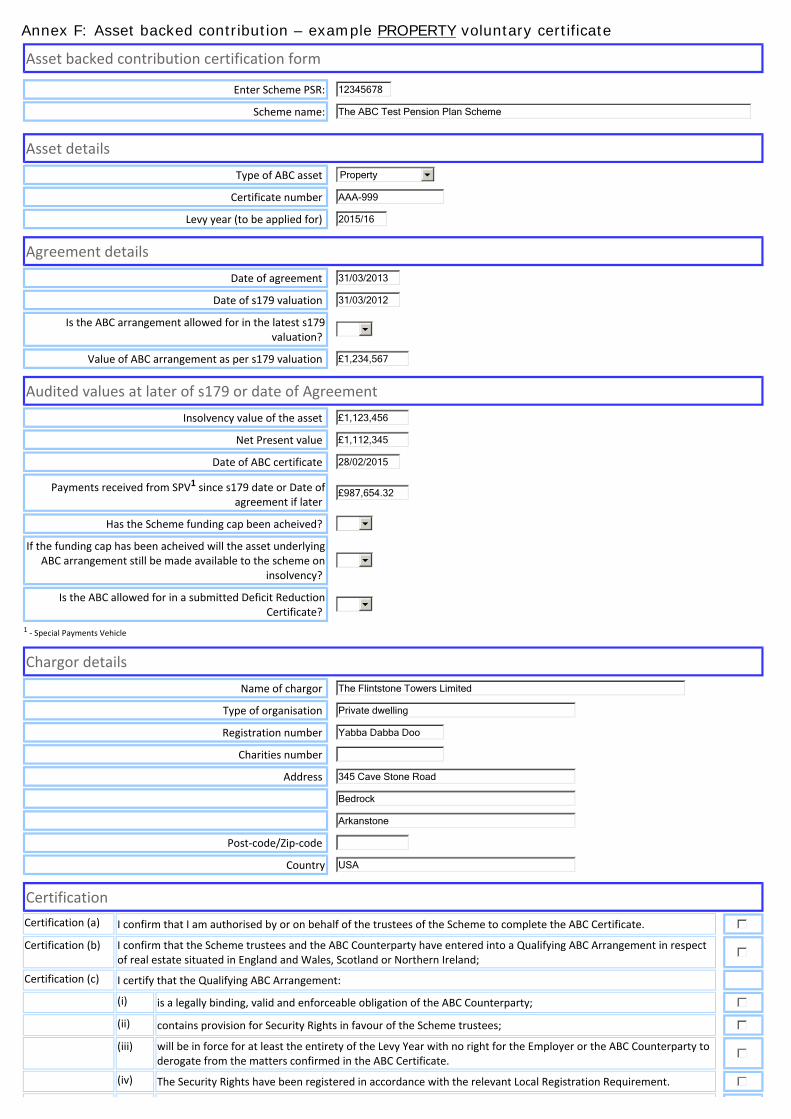
Annex F: Asset backed contribution – example PROPERTY voluntary certificate
Asset backed contribution certification form
Enter Scheme PSR: 12345678
Scheme name: The ABC Test Pension Plan Scheme
Asset details
Type of ABC asset Property
Certificate number AAA-999
Levy year (to be applied for) 2015/16
Agreement details
Date of agreement 31/03/2013
Date of s179 valuation 31/03/2012
Is the ABC arrangement allowed for in the latest s179 valuation?
Value of ABC arrangement as per s179 valuation £1,234,567
Audited values at later of s179 or date of Agreement
Insolvency value of the asset £1,123,456
Net Present value £1,112,345
Date of ABC certificate 28/02/2015
Payments received from SPV1 since s179 date or Date of agreement if later
£987,654.32
Has the Scheme funding cap been acheived?
If the funding cap has been acheived will the asset underlying ABC arrangement still be made available to the scheme on
insolvency?
Is the ABC allowed for in a submitted Deficit Reduction Certificate?
1 ‐ Special Payments Vehicle
Chargor details
Name of chargor The Flintstone Towers Limited
Type of organisation Private dwelling
Registration number Yabba Dabba Doo
Charities number
Address 345 Cave Stone Road
Bedrock
Arkanstone
Post‐code/Zip‐code
Country USA
Certification
Certification (a) I confirm that I am authorised by or on behalf of the trustees of the Scheme to complete the ABC Certificate.
Certification (b) I confirm that the Scheme trustees and the ABC Counterparty have entered into a Qualifying ABC Arrangement in respect of real estate situated in England and Wales, Scotland or Northern Ireland;
Certification (c) I certify that the Qualifying ABC Arrangement:
(i) is a legally binding, valid and enforceable obligation of the ABC Counterparty;
(ii) contains provision for Security Rights in favour of the Scheme trustees;
(iii) will be in force for at least the entirety of the Levy Year with no right for the Employer or the ABC Counterparty to derogate from the matters confirmed in the ABC Certificate.
(iv) The Security Rights have been registered in accordance with the relevant Local Registration Requirement.

(v) The Qualifying ABC Arrangement:
(A) is a legally binding, valid and enforceable obligation of the ABC Counterparty; and
(B) requires the ABC Counterparty to make income payments to the Scheme trustees, the amount and period of which corresponds with the calculation of the Net Present Value.
(vi) The income payments which are payable to the Scheme trustees under the Qualifying ABC Arrangement are derived only from ABC Asset(s) which are real estate situated in England, Wales, Scotland or Northern Ireland.
(vii) The ABC Asset is owned outright by the ABC Counterparty and is not subject to any prior or pari passu security or other interest which would defeat or preclude an attempt by the Scheme trustees to exercise their rights on the insolvency of the Employer or otherwise under the ABC Arrangement;
(viii) The Qualifying ABC Arrangement or another legally binding, valid and enforceable agreement between the Scheme trustees and the ABC Counterparty contains provisions giving the Scheme trustees rights in respect of the ABC Asset equivalent to those contained in the Qualifying ABC Arrangement if the Qualifying ABC Arrangement is found to be void or illegal;
Certification (d) The declarations made pursuant to sub‐paragraphs (c)(i) to (c)(viii) above are given on the basis of a legal opinion received from an appropriately qualified person and are made subject only to the assumptions and qualifications specified in that opinion;
Certification (e) I confirm that the trustees have obtained a valuation of the property that is the ABC Asset, as at the date specified above, the valuation has been prepared by a chartered surveyor who is a member of RICS and has appropriate indemnity cover in place, the valuation has been prepared in accordance with paragraph 7(3)(b) of the Appendix and the valuation includes allowance for any encumbrances recorded in the certificate of title referred to in (f) below;
Certification (f) I confirm that the Scheme trustees and/or the ABC Counterparty have obtained a certificate of title from an appropriately qualified person and dated not more than 7 days prior to the effective date of the Qualifying ABC Arrangement which confirms that the ABC Counterparty has good and marketable title to the property that is the ABC Asset and records any material encumbrances to that property. Having made appropriate enquiries the Certifier is satisfied that, as at the date of the ABC Certificate, there are no matters affecting the title to the property which were not disclosed in the certificate of title referred to above, or that to the extent there are any such matters, they have been allowed for in the valuation of the property referred to above;
Certification (g) I confirm that insurance on terms equivalent to those required by the Contingent Asset Appendix in respect of a Type B(ii) Contingent Asset is in place and all premiums have been paid; and
Certification (h) I confirm that I have notified the Board of any attempt that has been made to enforce the rights in favour of the Scheme trustees pursuant to the ABC Arrangement to acquire, call for or exercise step‐in rights or other similar rights in respect of the ABC Asset in the event of the insolvency of the Employer.
Certification (i) I confirm that the information contained within the certificate is complete and accurate, and the trustees of the scheme/section undertake to notify the Board promptly if the terms of the Qualifying ABC Arrangement or the ABC Arrangement are amended in any respect, the Qualifying ABC Arrangement or the ABC Arrangement is terminated or any of the information in the certificate otherwise ceases to be true and correct on or before 31 March 2016.
Certification (j) I am aware that it is a criminal offence under section 195 of the Act for any person knowingly or recklessly to provide false or misleading information to the Board in circumstances in which the person providing the information intends or could reasonably be expected to know, that it would be used by the Board for the purposes of exercising its functions.