consumer demand trends and issues in quality and safety · 2 factors affecting demand for fresh...
TRANSCRIPT
1
Consumer Demand Trends and Issues in Quality and SafetyConsumer Demand Trends and Issues in Quality and Safety
DR. ROBERTA COOKDept. of Ag and Resource Economics
University of California, Davisfor
UCD Postharvest Technology Short Course
June 19, 2015
Fresh Produce Consumption Trends
Cook, Roberta "U.S. Fresh Produce Industry: Consumer Issues in Quality and Safety" Postharvest Technology of Horticultural Crops Short Course 2015 (c) Postharvest Technology Center, UC Regents

2
Factors affecting demand for fresh produce
• Commodity price, consumer income, prices of substitutes and complements, population growth rates, ethnicity, culture
• Quality: appearance, flavor, color, shape and size; more breeder emphasis on flavor
• Info on produce selection, ripening, recipes• Convenience in prep, usage and consumption;
packaging role• Shelf-life, postharvest technology
Factors affecting demand for fresh produce
• Consistent availability, year-round supply• Retail has now gone beyond store, online,
mobile, and tablets. Consumers are becoming channel and device-agnostic, making the provision of seamless shopping experiences across all channels and touch points imperative.
• Growing role of social media• How, where and by whom products were grown
Cook, Roberta "U.S. Fresh Produce Industry: Consumer Issues in Quality and Safety" Postharvest Technology of Horticultural Crops Short Course 2015 (c) Postharvest Technology Center, UC Regents

3
Top 10 Fruit Sales and Pricing in Key US Food Retailers, 2014 vs. 2013
Product
Weekly $ Sales per
Store
PercentChange
vs. 2013
Weekly Vol. per Store
PercentChange
vs. 2013
AvgRetail Price
PercentChange
vs. 2013
Berries $4,019 4.7 1,342 3.0 $2.99 1.7Apples $3,070 -0.1 1,953 2.0 $1.57 -2.0Citrus $2,797 4.8 2,212 -2.6 $1.26 7.6Grapes $2,774 3.1 1,228 -3.6 $2.26 6.9Bananas $2,721 -1.2 4,762 -0.9 $0.57 -0.3Melons $1,216 3.7 2,187 7.8 $0.56 -3.9Avocados $1,197 11.8 1,071 2.7 $1.12 8.9Stone Fruits $987 2.4 515 -9.7 $1.91 13.3Cherries $623 -3.4 198 9.1 $3.15 -11.5Specialty Fruits $528 -2.7 491 -9.6 $1.08 7.7Source: FreshFacts® on Retail, Whole and Fresh Cut Produce Trends: 2014, United Fresh Produce Association and Nielsen, March 2015.
Top 10 Vegetable Sales and Pricing in Key US Food Retailers, 2014 vs. 2013
Product
Weekly $ Sales per
Store
PercentChange
vs. 2013
Weekly Vol. per Store
PercentChange
vs. 2013
AvgRetail Price
PercentChange
vs. 2013
Packaged Salad $3,553 7.8 1,301 5.0 $2.73 2.6Tomatoes $2,590 1.8 1,165 -0.1 $2.22 1.9Potatoes $2,561 1.9 3,712 -2.8 $0.69 4.9Cooking Vegs $1,806 3.5 1,097 3.4 $1.65 0.1Onions $1,564 0.1 1,578 -0.3 $0.99 0.4Peppers $1,412 4.5 640 2.4 $2.21 2.0Lettuce $1,279 -3.6 714 -1.0 $1.79 -2.6Carrots $906 -0.8 536 -1.7 $1.69 1.0Mushrooms $842 1.6 345 -0.6 $2.44 2.2Cucumbers $744 4.3 750 2.1 $0.99 2.2Source: FreshFacts® on Retail, Whole and Fresh Cut Produce Trends: 2014, United Fresh Produce Association and Nielsen, March 2015.
Cook, Roberta "U.S. Fresh Produce Industry: Consumer Issues in Quality and Safety" Postharvest Technology of Horticultural Crops Short Course 2015 (c) Postharvest Technology Center, UC Regents
4
3.2
12.07.8
10.9
17.3 17.2
0.5
9.7
5.0
10.712.5
17.2
Weekly $ sales/store
Weekly quantity sold/store Organic Fruit
Organic Veg
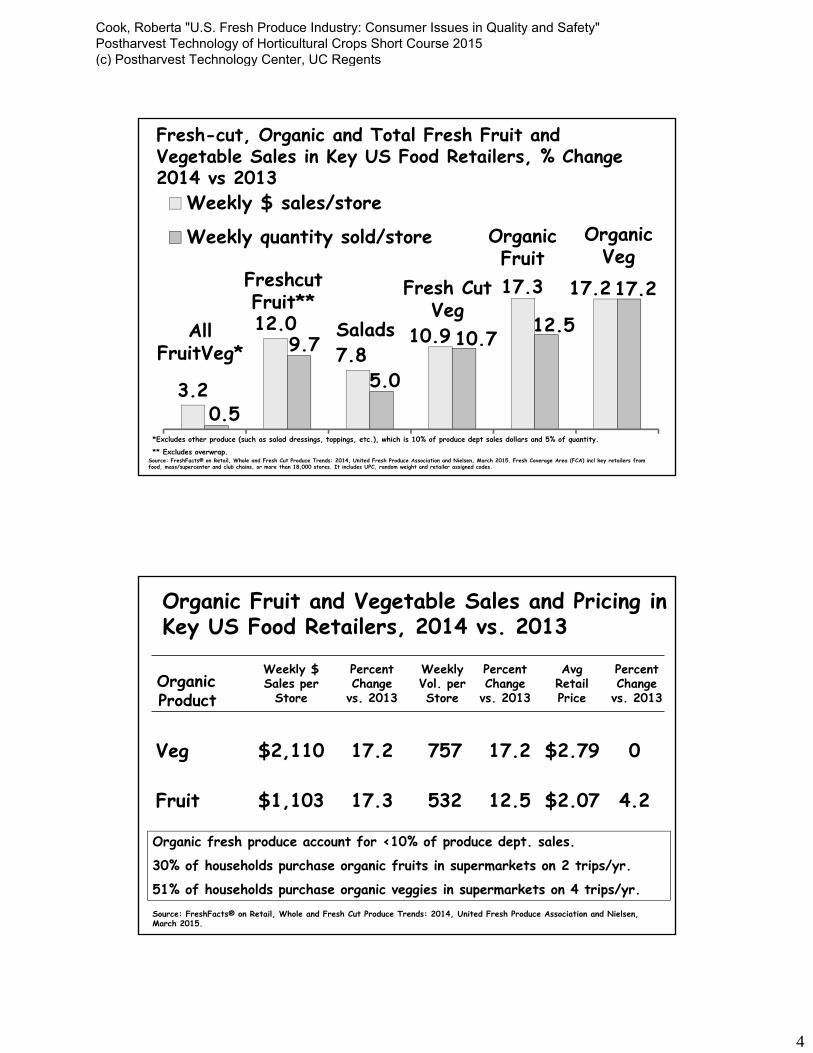
Fresh-cut, Organic and Total Fresh Fruit and Vegetable Sales in Key US Food Retailers, % Change 2014 vs 2013
All FruitVeg*
Freshcut Fruit**
Salads
Fresh Cut Veg
*Excludes other produce (such as salad dressings, toppings, etc.), which is 10% of produce dept sales dollars and 5% of quantity.
** Excludes overwrap.Source: FreshFacts® on Retail, Whole and Fresh Cut Produce Trends: 2014, United Fresh Produce Association and Nielsen, March 2015. Fresh Coverage Area (FCA) incl key retailers from food, mass/supercenter and club chains, or more than 18,000 stores. It includes UPC, random weight and retailer assigned codes.
Organic Fruit and Vegetable Sales and Pricing in Key US Food Retailers, 2014 vs. 2013
Veg $2,110 17.2 757 17.2 $2.79 0
Fruit $1,103 17.3 532 12.5 $2.07 4.2
Organic Product
Weekly $ Sales per
Store
PercentChange
vs. 2013
Weekly Vol. per Store
PercentChange
vs. 2013
AvgRetail Price
PercentChange
vs. 2013
Source: FreshFacts® on Retail, Whole and Fresh Cut Produce Trends: 2014, United Fresh Produce Association and Nielsen, March 2015.
Organic fresh produce account for <10% of produce dept. sales.
30% of households purchase organic fruits in supermarkets on 2 trips/yr.
51% of households purchase organic veggies in supermarkets on 4 trips/yr.
Cook, Roberta "U.S. Fresh Produce Industry: Consumer Issues in Quality and Safety" Postharvest Technology of Horticultural Crops Short Course 2015 (c) Postharvest Technology Center, UC Regents

5
Consumer Behavior
• Higher income and socially conscious foodies are driving demand; their preferences lean to organic, convenience (fresh-cut), flavor, local.
• For mainstream consumers, positive attitudes about wellness benefits of fresh produce not translating into purchases. Improved flavor might help.
• Perception that produce costs more and may be wasted. Better shelf-life might help.
• 46.5 million people on food stamps (SNAP) in FY2014 (vs 17.3 in 2000) for cost of $73.9B.
• Economic growth will stimulate demand.• Produce consumption is positively correlated with
income.
Distribution of U.S. Households by Income Level, Share of Total Fresh Produce Expenditures/Income Level & Ave. Fresh Produce Expenditures/Income Level, 2012
Source: Calculations byRoberta Cook from the FoodInstitute’s Demographics of Consumer Food Spending, 2014.
$478 14%
$254 8%
$409 17%
$339 13%
$ = Average fresh produce expenditures per income group
% = Percent of total fresh produce expenditures contributed by each income group
$819 31%<$15,000
15%
$15,000-$29,999
18%
$30,000-$49,999
20%
$50,000-$69,999
14%
$70,000-$99,999
14%
$100,000+19%
Share of Households
$594 18%
Cook, Roberta "U.S. Fresh Produce Industry: Consumer Issues in Quality and Safety" Postharvest Technology of Horticultural Crops Short Course 2015 (c) Postharvest Technology Center, UC Regents
6
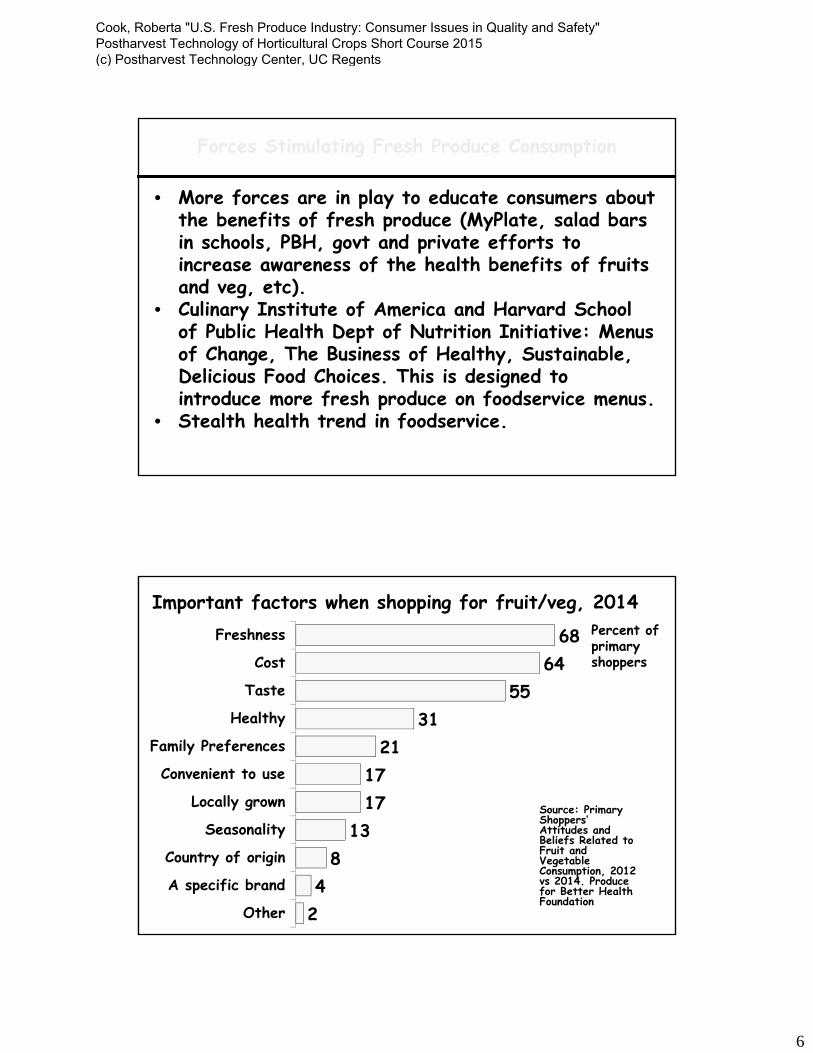
Forces Stimulating Fresh Produce Consumption
• More forces are in play to educate consumers about the benefits of fresh produce (MyPlate, salad bars in schools, PBH, govt and private efforts to increase awareness of the health benefits of fruits and veg, etc).
• Culinary Institute of America and Harvard School of Public Health Dept of Nutrition Initiative: Menus of Change, The Business of Healthy, Sustainable, Delicious Food Choices. This is designed to introduce more fresh produce on foodservice menus.
• Stealth health trend in foodservice.
Important factors when shopping for fruit/veg, 2014
Source: Primary Shoppers’ Attitudes and Beliefs Related to Fruit and Vegetable Consumption, 2012 vs 2014. Produce for Better Health Foundation
6864
5531
211717
138
42
Freshness
Cost
Taste
Healthy
Family Preferences
Convenient to use
Locally grown
Seasonality
Country of origin
A specific brand
Other
Percent of primary shoppers
Cook, Roberta "U.S. Fresh Produce Industry: Consumer Issues in Quality and Safety" Postharvest Technology of Horticultural Crops Short Course 2015 (c) Postharvest Technology Center, UC Regents
7
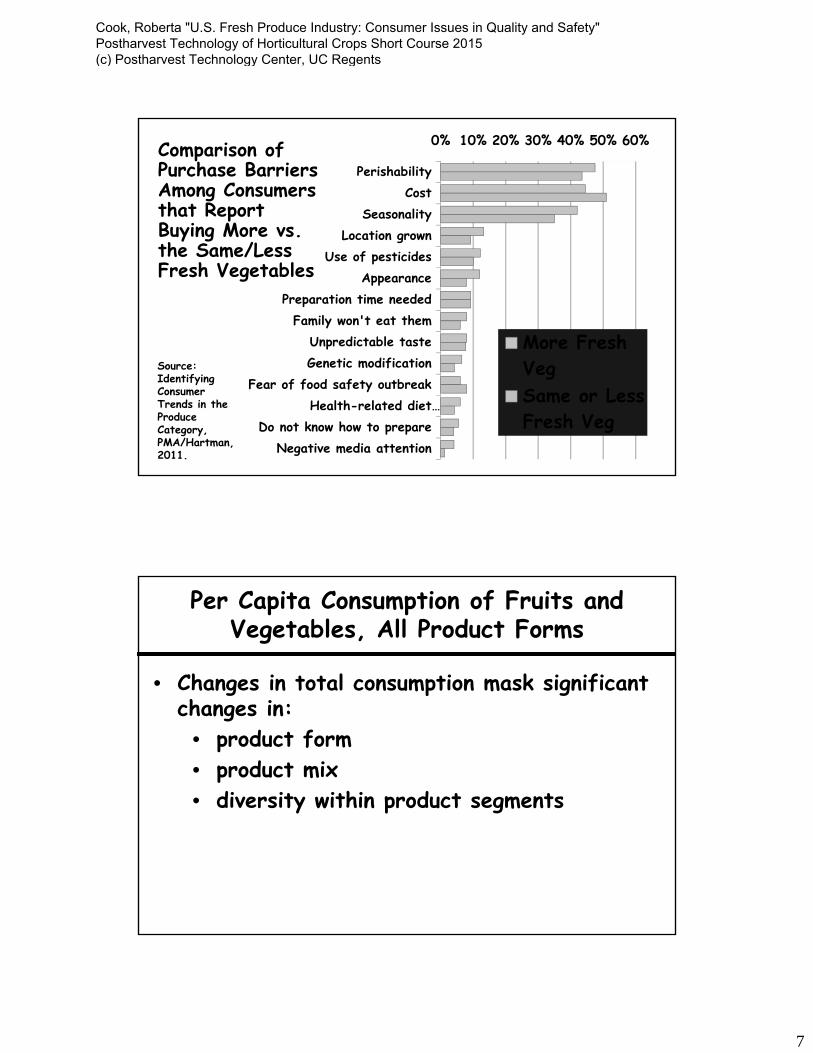
Source: Identifying Consumer Trends in the Produce Category, PMA/Hartman, 2011.
0% 10% 20% 30% 40% 50% 60%
PerishabilityCost
SeasonalityLocation grown
Use of pesticidesAppearance
Preparation time neededFamily won't eat them
Unpredictable tasteGenetic modification
Fear of food safety outbreakHealth-related diet…
Do not know how to prepareNegative media attention
More FreshVegSame or LessFresh Veg
Comparison of Purchase Barriers Among Consumers that Report Buying More vs. the Same/Less Fresh Vegetables
Per Capita Consumption of Fruits and Vegetables, All Product Forms
• Changes in total consumption mask significant changes in:
• product form• product mix• diversity within product segments
Cook, Roberta "U.S. Fresh Produce Industry: Consumer Issues in Quality and Safety" Postharvest Technology of Horticultural Crops Short Course 2015 (c) Postharvest Technology Center, UC Regents

8
0
50
100
150
200
250
300
350
400
45019
76
1979
1982
1985
1988
1991
1994
1997
2000
2003
2006
2009
2012
Processed Veg,Excl. Potatoes
ProcessedPotatoes
Fresh Potatoes
Fresh Veg, ExclMelon and Potato
Fresh includes fresh-cut and bulk.
Processed includes frozen, dried and canned.
Fresh includes fresh-cut and bulk.
Processed includes frozen, dried and canned.7734
Sources: USDA/ERS, Vegetables and Melons Situation and Outlook Yearbook, May 30, 2014 through 2007; and for 2008-2014 USDA/ERS, Vegetables and Pulses Yearbook Tables, posted online March 20, 2015. Figures compiled by Dr. Roberta Cook, UC Davis, fresh and processed sweet potato share of total sweet potatoes is estimated; processed vegetables includes lentils and dry peas, and excludes dry beans.
U.S. Per Capita Vegetable Utilization/Consumption,Excluding Melons, 1976-2014P, (all channels, foodservice and retail, includes freshcut), pounds
Poun
ds p
er c
apita 379
343
148
119
US Per Capita Consumption of Select Fresh Vegetables, 1985-2014P (includes fresh-cut and bulk, all marketing channels - foodservice and retail)
Pounds per capitaP=Preliminary
Source: USDA/ERS, Vegetables and Pulses Yearbook March 2015.
0
5
10
15
Carrots Bell pepper Broccoli Sweet corn Cucumber
Cook, Roberta "U.S. Fresh Produce Industry: Consumer Issues in Quality and Safety" Postharvest Technology of Horticultural Crops Short Course 2015 (c) Postharvest Technology Center, UC Regents

9
Head Lettuce
Romaine
Leaf
05
101520253035
7.03.7
Lbs.
Per
Cap
ita
US Per Capita Utilization/Consumption of Lettuce, by Type, 1985-2014P (includes fresh-cut and bulk, foodservice and retail)
All-24.7
14.0
Source: USDA/ERS, Vegetables and Pulses Yearbook March 20, 2015 and unpublished ERS data for leaf and romaine.
Pounds per capita
P=PreliminarySource: USDA/ERS, Vegetables and Pulses Yearbook Tables, posted online March 20, 2015, http://www.ers.usda.gov/data-products/vegetables-and-pulses-data/yearbook-tables.aspx.
0
5
10
15
20
25
US Per Capita Utilization/Consumption of FreshTomatoes (1985-2014P)
Cook, Roberta "U.S. Fresh Produce Industry: Consumer Issues in Quality and Safety" Postharvest Technology of Horticultural Crops Short Course 2015 (c) Postharvest Technology Center, UC Regents

10
Y.E.L.O. Youth, Energy, Life, Om…™
Specialty and Greenhouse Tomatoes
Specialty and Greenhouse Tomatoes
Cook, Roberta "U.S. Fresh Produce Industry: Consumer Issues in Quality and Safety" Postharvest Technology of Horticultural Crops Short Course 2015 (c) Postharvest Technology Center, UC Regents

11
Quantity Dollars
Meal Prep29%
TOV 23%
Snacking 20%Roma
30%
Field round 14%
HH round 13% TOV
26%
Snacking 31%
Roma 17%
Field round 13%
HH round 13%
US Fresh Tomato Category Sales in Key Retailers: Shares in Quantity and Dollars, by Key Tomato Type, 2014
Source: Nielsen Perishables Group FreshFacts®, Historical 2010-2014. Fresh Coverage Area (FCA) incl key retailers from food, mass/supercenter and club chains, or more than 18,000 stores. It includes UPC, random weight and retailer assigned codes.
Fresh Noncitrus, Incl Melon
Fresh Citrus
Process Citrus
Process Noncitrus
0
50
100
150
200
250
300
350
1976
1977
1978
1979
1980
1981
1982
1983
1984
1985
1986
1987
1988
1989
1990
1991
1992
1993
1994
1995
1996
1997
1998
1999
2000
2001
2002
2003
2004
2005
2006
2007
2008
2009
2010
2011
2012
2013
(frozen, dried and canned)
US Per Capita Total Fruit Disappearance/Consumption, Including Melons, Pounds 1976-2013, (all channels, foodservice and retail)
Poun
ds p
er c
apita
293101
55
24112
282
7329
102
78
Source: Fruit and Tree Nuts Yearbook, ERS/USDA, October 31, 2014.
Fresh includes fresh-cut and commodity.
Cook, Roberta "U.S. Fresh Produce Industry: Consumer Issues in Quality and Safety" Postharvest Technology of Horticultural Crops Short Course 2015 (c) Postharvest Technology Center, UC Regents

12
U.S. Per Capita Consumption of Selected Fresh Fruit 1985-2013 (all have positive health messages, and all but kiwis have generic promotion*)
Pounds per capita
*Kiwis slashed generic promotion in the late 90’s and were unable to sustain growth and capitalize on a positive health message.Source: Fruit and Tree Nuts
Yearbook, ERS/USDA, October 31, 2014
0
2
4
6
8
10
Blueberries Strawberries Kiwifruit Avocados
US Per Capita Consumption/Utilization of Selected Fresh Fruit 1985-2013, (all channels, foodservice and retail)
pounds per capita
05
101520253035
Orange Grape Banana AppleSource: Fruit and Tree Nuts Yearbook, ERS/USDA, 10-31-14
Cook, Roberta "U.S. Fresh Produce Industry: Consumer Issues in Quality and Safety" Postharvest Technology of Horticultural Crops Short Course 2015 (c) Postharvest Technology Center, UC Regents

13
US Per Capita Disappearance/Consumption of Melons, 1985-2013 (watermelons have generic promotion)
Pounds per capita
05
101520253035
Watermelon Cantaloupe Honeydew Others
Source: Fruit and Tree Nuts Yearbook, ERS/USDA, 10-31-14
US Per Capita Consumption/Disappearance of Selected Fresh Fruit 1985-2013
pounds per capita
Source: Fruit and Tree Nuts Yearbook, ERS/USDA, 10-31-14
0
2
4
6
8
Mango Papaya Pear Pineapple Peach/Nect.
Cook, Roberta "U.S. Fresh Produce Industry: Consumer Issues in Quality and Safety" Postharvest Technology of Horticultural Crops Short Course 2015 (c) Postharvest Technology Center, UC Regents

14
LIFESTYLEAffluent Modest
Cosmopolitan Suburban Comfortable Struggling Working Plain RuralBehavior / Stage Centers Spreads Country Urban Cores Towns Living Total % Volume
Very High 150+
Start-up Families 143 219 101 29 41 11 108 9.30%HHs with young children only <6
Small Scale Families 130 205 90 26 37 9 97 8.90%Small HHs with older children 6+
Younger Bustling Families 120 199 82 27 36 8 86 5.90%Large HHs with children (6+), HOH <40
Older Bustling Families 147 223 106 33 46 10 127 13.90%Larger HHs with children (6+), HOH 40+
Young Transitionals 147 207 100 33 41 12 90 9.60%Any size HHs, no children, <35
Independent Singles 143 203 100 30 41 11 93 11.60%1 person HHs, no children, 35-64
Senior Singles 131 196 91 31 42 10 82 7.40%1 person HHs, no children, 65+
Established Couples 139 204 96 29 39 9 102 11.20%2+ person HHs, no children, 35-54
Empty Nest Couples 139 210 99 28 39 8 112 11.50%2+ person HHs, no children, 55-64
Senior Couples 132 202 91 28 38 8 97 10.80%2+ person HHs, no children, 65+
Total 139 208 96 30 40 9 100Percent Volume 20.80% 49.60% 17.20% 3.10% 8.00% 1.20%
High 120-150
Why Retailers Love Berry Consumers? They Spend Money
Source: Perishables Group FreshFacts® Powered by Nielsen.
Low 1-50
Plant Varieties and Flavor
Cook, Roberta "U.S. Fresh Produce Industry: Consumer Issues in Quality and Safety" Postharvest Technology of Horticultural Crops Short Course 2015 (c) Postharvest Technology Center, UC Regents

15
Plant Varieties and Flavor
Plant Varieties and Flavor
Cook, Roberta "U.S. Fresh Produce Industry: Consumer Issues in Quality and Safety" Postharvest Technology of Horticultural Crops Short Course 2015 (c) Postharvest Technology Center, UC Regents

16
Demographic Trends and Generational Differences in Attitudes
Changing Structure of the Modern Family
Source: Census Bureau, America’s Families and Living Arrangements: 2012, 2013. CDC National Center for Health Statistics, Changing Patterns of Nonmarital Childbearing in the U.S. 2009.
1970 2012
Married-couple households are on the decline
81% 66%
Married-couple households with children are on the decline
40% 20%
Households and families are becoming smaller
3.1 persons
2.6 persons
Cook, Roberta "U.S. Fresh Produce Industry: Consumer Issues in Quality and Safety" Postharvest Technology of Horticultural Crops Short Course 2015 (c) Postharvest Technology Center, UC Regents

17
Projected US Population
Source: www.census.gov
310.233 million 373.504 million
Black13% Asian
7% Other2%
Non-Hisp. Whites57%
Hispanic23%
Black13% Asian
5%Other2%
Non-Hisp.
Whites66%
Hispanic16%
2010 2030
Fine Dining Chefs
Creation
Casual Theme Interpretation
Family DiningInterpretation
QSRInterpretation
Non-CommercialInterpretation
Incorporated into Consumer Meal Mix
Foodservice contributes to the evolution of food trendsand ethnicity leads the way, Authentic and Fusion,
benefiting fresh produce
Argentine
Brazilian Churrascaria
Peruvian
Oaxacan Szechwan
VietnameseThai
Taiwanese
Cambodian
Indonesian
Cook, Roberta "U.S. Fresh Produce Industry: Consumer Issues in Quality and Safety" Postharvest Technology of Horticultural Crops Short Course 2015 (c) Postharvest Technology Center, UC Regents

18
Average Annual Household Fresh Produce $Expenditures in Food Stores, by Ethnicity, 2012
Source: The Food Institute, Demographics of Consumer Food Spending, 2014.
261 270
409
164
307226 234
386
148
259
All White andOther
Asian Black Hispanic
Fresh Fruit Fresh Vegetables
Source: The Food Institute, Demographics of Consumer Food Spending, 2014.
7%
16%
17%
20%
18%
12% 10%
4%
15%
19%
23%
18%
12%
8%
$290
$445
$540 $577
$492 $502
$388
$0
$100
$200
$300
$400
$500
$600
$700
0%
5%
10%
15%
20%
25%
30%
Share ofHousehold byAge Group
Percent FreshProduceExpend by Age
FreshExpendituresby Age, $
Distribution of U.S. Households by Age Group and Fresh Produce $Expenditures in Food Stores, 2012
Cook, Roberta "U.S. Fresh Produce Industry: Consumer Issues in Quality and Safety" Postharvest Technology of Horticultural Crops Short Course 2015 (c) Postharvest Technology Center, UC Regents

19
Five Growing Categories in Millennial Spending
Category
Percent Spending More*
Percent Spending Less*
Fresh fruits and vegetables 37 8
Organic food 25 9
Natural products 23 10
Environ. friendly home cleaning items 20 10
Fresh meat 19 10Source: Food Institute Report, September 15, 2014
* Spending plan over the next 12 months
Question: How important is each factor in deciding what to buy?
22
21
22
22
17
19
Millennials
Gen X
Boomers
Millennials
Gen X
Boomers
Percent in 2011
Social Justice and
Well‐being
Environmental Concerns
34%
26%
25%
36%
26%
29%
Percent in 2014
Source: Outlook on the Millennial Consumer 2014, a presentation for PMA from the Hartman Group
Cook, Roberta "U.S. Fresh Produce Industry: Consumer Issues in Quality and Safety" Postharvest Technology of Horticultural Crops Short Course 2015 (c) Postharvest Technology Center, UC Regents

20
Millennials shop a variety of retailers to meet their in‐the‐moment needs
Source: Outlook on the Millennial Consumer 2014, a presentation for PMA from the Hartman Group
No. of Retailers Shopped for Groceries in the Past 90 Days
Most Millennials spread their shopping across many channels and retailers
• Lack of planning results in more trips
• Higher use of all channels than older cohorts
Especially true for specialty channels –46% of Millennials vs. 32% of Boomers
Millennials Gen X Boomers
9.0 7.1 6.3
Myth Busting: Millennials don’t just shop at cool and unconventional retailers. While they love these stores, many shop at more mainstream retailers most of the time and reserve specialty channels for special occasions.
Question: What packaging information do you read or consider when deciding what to purchase?
“I buy mostly organic, but my parents aren’t into it. My dad thinks organic is a big scam.” – Katerina, 28
Boomers Millennials
Certifications 23% 25%
Organic Ingred’s 16% 23%
Company / Product Narrative
11% 19%
Source: Outlook on the Millennial Consumer 2014, a presentation for PMA from the Hartman Group
Cook, Roberta "U.S. Fresh Produce Industry: Consumer Issues in Quality and Safety" Postharvest Technology of Horticultural Crops Short Course 2015 (c) Postharvest Technology Center, UC Regents

21
Question: When preparing meals at home, which BEST describes how the task is approached?
31
19
18
15
13
4
43
14
12
10
17
5
44
8
6
12
24
7
Meals prep’d with variety of ingredients (fresh, frozen, pkgd)
Use fresh prep’d food from local grocery or restaurant
Meals prep’d mostly with fresh ingred’s bought same day
Relies on frozen meals heated in microwaveor oven
Mostly prepare meals with all fresh ingred’s / from scratch
Rely on pantry canned, pkgd, frozen (no fresh)
Millennial Gen X Boomer (%)
Convenience is key
• Millennials plan less and tend to use prepared options at home
• Fewer cook from scratch and more rely on frozen meals
Millennials are spontaneous
• They are more likely to buy fresh ingredients the day they cook them
Source: Outlook on the Millennial Consumer 2014, a presentation for PMA from the Hartman Group
Question: Which considerations are important when deciding whether you want to connect with a specific product or brand?
59
40
30
27
11
64
40
27
12
18
65
39
27
6
25
Products have best prices
Company values similar tomine
Environmentally consciouscompany
Company has hip / coolpersonality
Have no interest inconnecting with a product
/ brand
Millennial
Gen X
Boomer
(%)
Source: Outlook on the Millennial Consumer 2014, a presentation for PMA from the Hartman Group
Cook, Roberta "U.S. Fresh Produce Industry: Consumer Issues in Quality and Safety" Postharvest Technology of Horticultural Crops Short Course 2015 (c) Postharvest Technology Center, UC Regents

22
Question: How important is each factor in deciding what food you eat?
Source: Outlook on the Millennial Consumer 2014, a presentation for PMA from the Hartman Group
52
44
41
41
39
36
51
39
37
29
33
32
45
36
29
19
31
26
made with naturalingredients
no GMOs
no allergens
made with organic ingred.
grown locally
manufactured locally
Millennials
Gen X
Boomers
Percent of
86%
75%
61%
56%
39%
39%
31%
30%
24%
Freshness
Support local economy
Taste
Like knowing source/how produced
Nutritional value
Price
Enviro impact of long distance…
Appearance
Long term personal health effects
Reasons for Buying Locally Grown at Retail, 2014
Source: FMI U.S. Grocery Shopper Trends 2014
Cook, Roberta "U.S. Fresh Produce Industry: Consumer Issues in Quality and Safety" Postharvest Technology of Horticultural Crops Short Course 2015 (c) Postharvest Technology Center, UC Regents
23
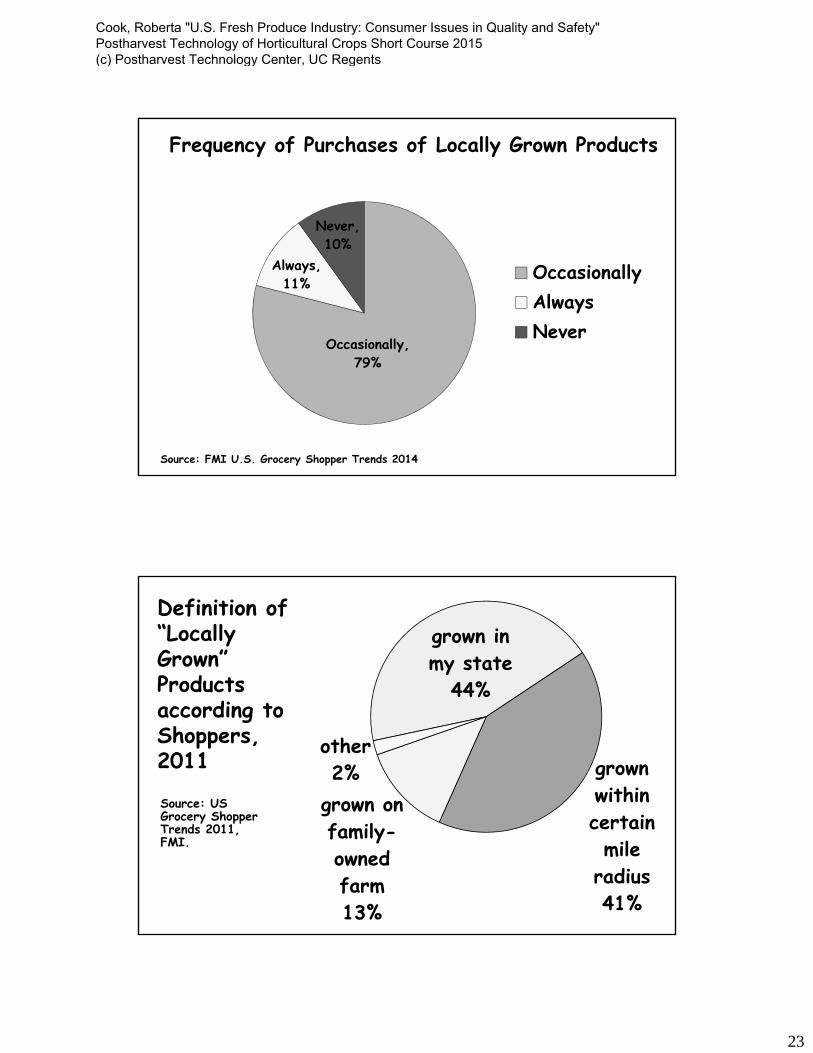
Frequency of Purchases of Locally Grown Products
Source: FMI U.S. Grocery Shopper Trends 2014
Occasionally, 79%
Always, 11%
Never, 10%
OccasionallyAlwaysNever
Definition of “Locally Grown” Products according to Shoppers, 2011
Source: US Grocery Shopper Trends 2011, FMI.
grown in my state
44%
grown within certain mile
radius41%
grown on family-owned farm13%
other2%
Cook, Roberta "U.S. Fresh Produce Industry: Consumer Issues in Quality and Safety" Postharvest Technology of Horticultural Crops Short Course 2015 (c) Postharvest Technology Center, UC Regents
24
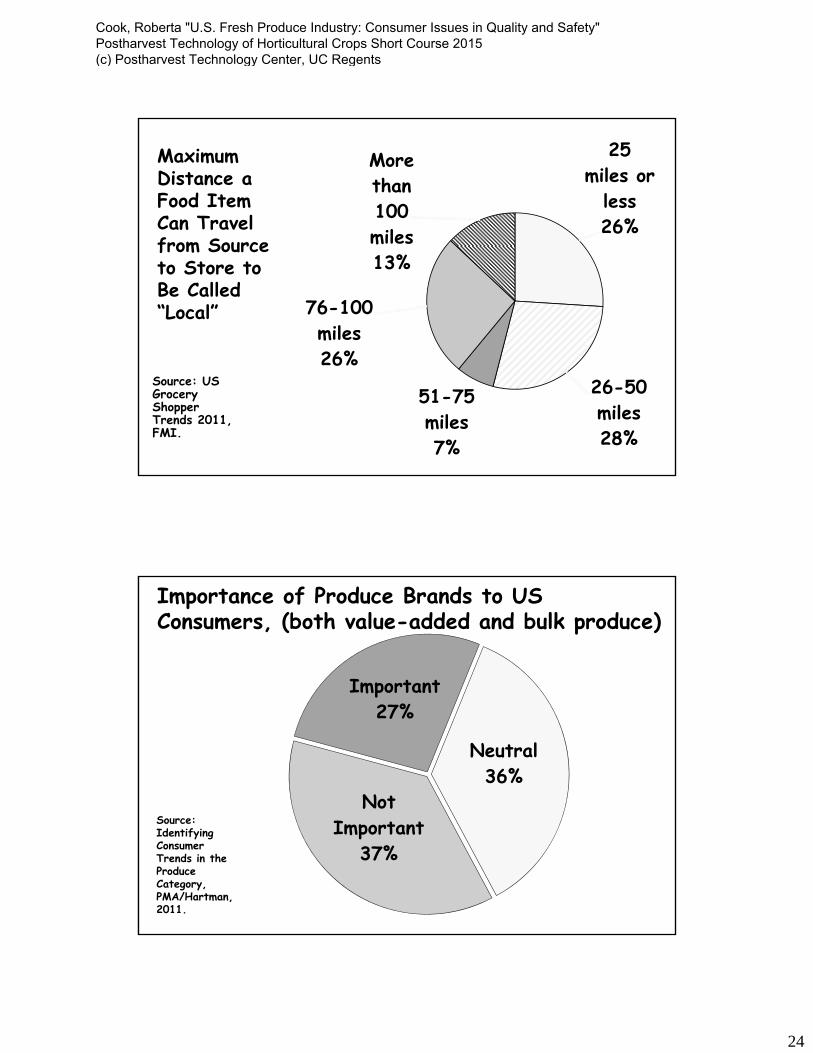
Maximum Distance a Food Item Can Travel from Source to Store to Be Called “Local”
Source: US Grocery Shopper Trends 2011, FMI.
25 miles or
less26%
26-50 miles28%
51-75 miles7%
76-100 miles26%
More than 100 miles13%
Importance of Produce Brands to US Consumers, (both value-added and bulk produce)
Important27%
Neutral36%
Not Important
37%
Source: Identifying Consumer Trends in the Produce Category, PMA/Hartman, 2011.
Cook, Roberta "U.S. Fresh Produce Industry: Consumer Issues in Quality and Safety" Postharvest Technology of Horticultural Crops Short Course 2015 (c) Postharvest Technology Center, UC Regents

25
Factors Most Associated with Produce Brands,comparing attitudes of consumers who say brand is important with those that don’t
Source: Identifying Consumer Trends in the Produce Category, PMA/Hartman, 2011.
77%
34%
60%
50%
43%
13%
13%
45%
50%
26%
25%
20%
9%
4%
Quality
Higher price
Better tasting
Value
Higher level of food safety
Less expensive
Community
Brand IsImportant
Brand Is NotImportant
Food Safety Attitudes
Cook, Roberta "U.S. Fresh Produce Industry: Consumer Issues in Quality and Safety" Postharvest Technology of Horticultural Crops Short Course 2015 (c) Postharvest Technology Center, UC Regents

26
How confident are you that the food in your supermarket is safe?
Source: FMI US Grocery Shopper Trends, various years
84%66%
89%83%
'97 '99 '02 '04 '06 '08 '10 12 14
Completely or mostly confident
Source: US Grocery Shopper Trends 2011, FMI, 1,026 shoppers
Specific Areas of the Store and Supply Chain: “I trust the products sold there are safe”
Strongly Somewhat Somewhat StronglyAgree Agree Disagree Disagree
Fresh produce 58% 38% 3% 1%Over-counter meds. 58% 34% 2% 1%Grocery stores 54% 39% 5% 1%Fresh meat, poultry
& fish 53% 41% 3% 1%Prepared meals 41% 45% 6% 7%Pet food 37% 24% 4% 2%
Cook, Roberta "U.S. Fresh Produce Industry: Consumer Issues in Quality and Safety" Postharvest Technology of Horticultural Crops Short Course 2015 (c) Postharvest Technology Center, UC Regents

27
Which food-related items constitute a serious health risk (according to US shoppers)?
Declining since 1992
Source: US Grocery Shopper Trends 2011, FMI.
US Consumer Confidence in the Safety of Fresh Produce by Source, 2010
0%
10%
20%
30%
40%
50%
60%
70%
80%
90%
100%
Farmers' Market Supermarket Mass Retailer
Not confident at all
Mostly not confident
Neutral
Mostly confident
Very confident
Source: The Hartman Group and PMA, Identifying Consumer Trends in the Produce Category, 2010.
Cook, Roberta "U.S. Fresh Produce Industry: Consumer Issues in Quality and Safety" Postharvest Technology of Horticultural Crops Short Course 2015 (c) Postharvest Technology Center, UC Regents
28
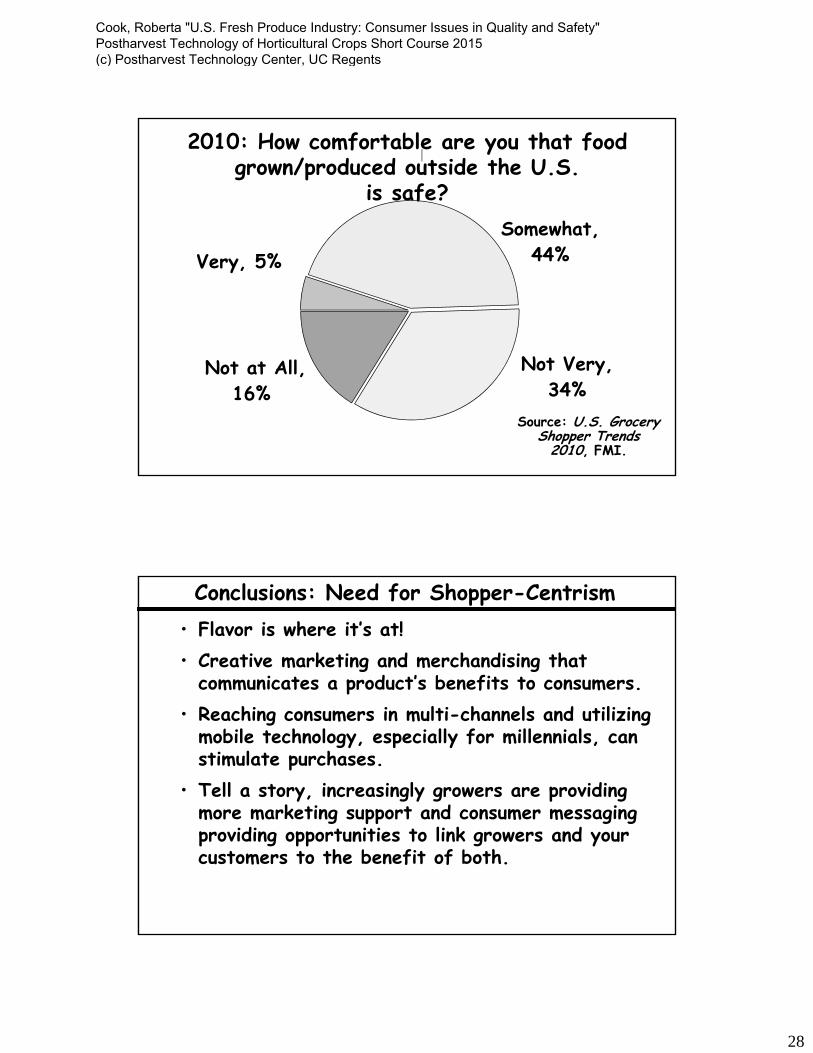
Very, 5%Somewhat,
44%
Not Very, 34%
Not at All, 16%
2010: How comfortable are you that food grown/produced outside the U.S.
is safe?
Source: U.S. Grocery Shopper Trends
2010, FMI.
• Flavor is where it’s at!• Creative marketing and merchandising that
communicates a product’s benefits to consumers.• Reaching consumers in multi-channels and utilizing
mobile technology, especially for millennials, can stimulate purchases.
• Tell a story, increasingly growers are providing more marketing support and consumer messaging providing opportunities to link growers and your customers to the benefit of both.
Conclusions: Need for Shopper-Centrism
Cook, Roberta "U.S. Fresh Produce Industry: Consumer Issues in Quality and Safety" Postharvest Technology of Horticultural Crops Short Course 2015 (c) Postharvest Technology Center, UC Regents

29
• Unmet potential for fresh produce demand expansion in foodservice channels, potentially convenience stores, dollar stores, pharmacies, and online.
• Consumption gains in some items are at the expense of others, we need to understand more about the role of substitutes and complements.
• Firms need to better understand diverse consumer segments and their needs at the individual produce item level.
• Consumer research is exploding due to the internet.• Social media is making it much more cost-effective
and feasible to conduct micro marketing.
Conclusions
• Continuing reduction in the unemployment rate and economic growth will stimulate fresh produce demand.
• Changing public policy, industry-govt. partnerships, trade association and firm-level efforts may gain traction and change consumer behavior – not just attitudes; time will tell.
• To be healthy it must be safe, the fresh produce industry must not relinquish this positioning!
• Consumer expectations are growing for industry accountability, making traceability, sustainability, social responsibility and food safety standards ever more important.
Conclusions
Cook, Roberta "U.S. Fresh Produce Industry: Consumer Issues in Quality and Safety" Postharvest Technology of Horticultural Crops Short Course 2015 (c) Postharvest Technology Center, UC Regents