consumer education and reverse logistics in the base … and sales of innovative durable goods to...
TRANSCRIPT
Consumer Education and Reverse Logisticsin the Base of the Pyramid
Andre P. CalmonTechnology and Operations Management, INSEAD, Fontainebleau, France, [email protected]
Diana Jue-RajasinghEssmart, Bangalore, India and Ross School of Business, University of Michigan, USA, [email protected]
Gonzalo RomeroRotman School of Management, University of Toronto, Toronto, Canada, [email protected]
Jackie StensonEssmart, Bangalore, India, [email protected]
We introduce the value-access paradox that occurs in many developing countries: consumers that would most
benefit from existing life-improving products are those that can least find and afford them. We model the
operations of a social enterprise in a developing market that tackles this paradox by distributing durable
life-improving technologies. Its goal is to profitably increase their adoption by selling through local retailers.
The retailers sell to consumers with uncertain product valuation who suffer financial distress. The distrib-
utor considers two strategies: (i) improved consumer education and (ii) a higher salvage value for returned
products. We prove that (ii) is always beneficial for the distributor, while (i) may be detrimental. Moreover,
this effect is weakened (strengthened) if the consumers’ financial distress is high (low), and the distributor
highly values product adoptions. Furthermore, in contrast to developed markets, a more expensive product
with higher salvage value can lead to a Pareto-improvement in supply-chain performance.
Key words : Social entrepreneurship, developing countries, bottom of the pyramid, reverse logistics.
History : 2nd draft - January 2018.
1. Introduction
This paper models and analyzes various operations strategy challenges and trade-offs related to the
distribution and sales of innovative durable goods to consumers at the Base of the Pyramid (BOP)1.
Many consumers in the BOP lack access to innovative durable products and technologies that can
significantly improve their quality of life (Shukla and Bairiganjan (2011)). The durable products
that these consumers do have access to are often of low quality or too expensive. Furthermore,
consumers might not have enough information or after-sales support about the few innovative
products that they can purchase.
1 The “Bottom of the Pyramid” (also known as the “Base of the Pyramid”) has been relabeled and redefined bymultiple authors. Despite the semantics, the shared concept of the global poor as a market for new technologiesremains constant.
1
Calmon, Jue-Rajasingh, Romero, Stenson: Consumer Education and Reverse Logistics in the Base of the Pyramid2 Working Paper - February 2017
These issues occur due to structural characteristics faced by consumers in the BOP which make
it a very challenging environment for distributors and retailers to profit. In particular, consumers
in the BOP face what we denote the value-access paradox: BOP consumers who would most
benefit from existing life-improving products are those that can least afford these products and have
the most trouble finding them. This paradox may exist in developed countries, but not to the degree
that it exists in the BOP.
Within this context, the main objective of this paper is to model features of the BOP that con-
tribute to the access-value paradox and analyze how they impact prices, product selection by the
distributor, the value of consumer education, and the value of customer service in innovative durable
goods supply chains that target BOP consumers. Our analysis highlights the differences in the
equilibrium behavior of a supply chain selling innovative durable goods to the BOP compared to
a developed market. Furthermore, since many organizations in the BOP are social enterprises2,
we analyze how the performance of this supply chain changes when there is a distributor whose
objective function is a mix between financial profit and a social objective (in our case, the social
objective is product adoptions).
1.1. Challenges faced by BOP consumers
We present a brief discussion of BOP related challenges that generate the value-access paradox
and that we incorporate in our model.
If you need a new life-improving product, you probably can’t find it: Many BOP
consumers live in poor, hard to reach areas. Although most of these consumers have access to
informal markets and small retailers, these retailers have little incentive to carry expensive or
innovative durable goods since their stores are physically small (as much as 96 percent of retail
outlets are less than 500 sq ft in area (Kumar (2007)), their shelf-space is limited, they have
liquidity constraints, and their owners are more concerned with routine operations than long-range
planning (Madaan (2009)). Furthermore, innovative durable goods are “push products” that require
active marketing and forecasting unknown demand, which are activities that few small retailers
engage in. Manufacturers and distributors that attempt to reach these consumers directly face high
distribution and marketing costs associated to entering a new market. Because of this, many BOP
consumers seldom find the products and technologies that could benefit them.
2 For the purposes of this research, social enterprises are organizations that use market-based methods to addresssocial issues (Miller et al. (2012)).
Calmon, Jue-Rajasingh, Romero, Stenson: Consumer Education and Reverse Logistics in the Base of the PyramidWorking Paper - February 2017 3
If you can find a product, you probably can’t afford it: Many of the technologies that
would benefit consumers in the BOP exist and are well established: induction cooktops, water
purifiers, generators, and solar lamps. However, these technologies are usually not offered at a
price point that BOP consumers can afford. In order to purchase these products, consumers may
have to resort to loans which many times are offered at high interest rates (Palit (2013)). This
issue is one of the main contributors to the value-access paradox and poses a challenge to product
designers that create products targeted at the BOP. On the one hand, the access-value paradox
might lead to the creation of products that are both cheap, difficult to maintain, and have little
value for the BOP, as the case of PlayPump in Mozambique (see Costello (2010)). On the other
hand, the paradox might also lead to situations where products that generate a lot of value to
BOP consumers also generate value to non-BOP consumers, creating incentives for retailers to set
prices high and skim the market, excluding BOP consumers.
If you have access to a product, you might not understand its value: Some innovative
durable goods have benefits that are less immediately understood by customers. For example,
smoke-reducing, fuel-efficient clean cooking stoves address the 4.3 million annual deaths that are
linked to households cooking over coal, wood and biomass stoves (World Health Organization
(2016)). However, affected populations are not aware of the negative impacts of using inefficient
stoves or the availability of clean cooking solutions. Potential consumers are unwilling to pay for
unfamiliar products that may not meet their needs. Moreover, even after a customer purchases a
clean cooking stove, she needs to integrate it into her routine cooking behavior to make sure that
the benefits are attained (Global Alliance for Clean Cookstoves (2016)).
If you have a problem with the product, it is nearly impossible to get after-sales ser-
vice: Even though many innovative durable goods exist, not all of these products are high-quality.
For example there have been multiple reported incidents of fake or low-quality solar lanterns,
batteries, and panels being sold in low-income markets, which have undermined the market for
high-quality goods (Proctor (2013)). Organizations like MIT’s Comprehensive Initiative on Tech-
nology Evaluation have attempted to address this problem by “providing authoritative, scientific
information on the price and technical performance of existing portable solar lanterns” (Brine
et al. (2015)), but it is unlikely that information like this is accessed by BOP customers. Even
if a customer decides to purchase a quality product, fixing it when it breaks is difficult because
few technology suppliers provide adequate after-sales service in remote areas (Wijayatunga and
Attalage (2005)).

Calmon, Jue-Rajasingh, Romero, Stenson: Consumer Education and Reverse Logistics in the Base of the Pyramid4 Working Paper - February 2017
1.2. Challenges faced by BOP distributors: the case of Essmart
The motivation for our research, and the main case study for this paper, comes from Essmart,
a social enterprise that distributes new life-improving technologies3 in India. Essmart developed
a novel distribution model that uses small local “mom-and-pop” retail shops not only as points
of sale but also as warranty providers and collectors of returned products. This business model
leverages the fact that, in India, 85% of the annual retail spending occurs through unorganized
retail that includes more than 12 million small local retailers (Kohli and Bhagwati (2011)).
Essmart’s strategy has 3 main components: (i) distribute, (ii) demonstrate and (iii) guarantee. To
distribute products, Essmart partners with local retail shops and offers expedited product delivery
to these retailers. Specifically, they give retailers a catalogue listing all its products and a few
sample items. When the retailer has a sale opportunity, Essmart delivers the product within a few
days. This “deliver-to-order” strategy effectively removes the inventory risk from the retailer. This
is important since the cost of many of the products sold by Essmart is equivalent to 2-3 weeks
of the average salary in rural India. To demonstrate products, Essmart representatives educate
consumers and the retailer at local shops. These demonstrations are significantly less labor-intensive
than marketing activities like door-to-door campaigns but have a more limited reach. To guarantee
the quality of their products, Essmart offers consumers the opportunity to return products and
facilitates the servicing of faulty products that have a manufacturers’ warranty.
To achieve all three components of its strategy, Essmart has invested in facilities and employee
training that allows them to service manufacturer warranties and have a significantly higher salvage
value for consumer returns (e.g., by using refurbished items in their demonstrations). This last
aspect is particularly novel for life-improving technologies being sold to the BOP. Given Essmart’s
distribution strategy, this paper compares the effectiveness of providing better consumer education
(demonstrate), versus improving its reverse logistics channel to obtain a higher salvage value for
consumer returns (guarantee).
When designing their operations strategy, social enterprises in BOP markets might look at two
other kinds of organizations for best practices: (i) companies in more developed markets that
operate in a different economic and institutional environment; and (ii) non-profit organizations
that distribute life-improving technologies in the BOP for free or at a highly subsidized price. In
order to highlight the similarities and differences between social enterprises and these two other
kinds of organizations, we will compare the equilibrium behaviors of their supply chains.
3 Examples of life-improving technologies are clean cooking stoves, solar lamps, water purifiers, and motorcycle hel-mets.
Calmon, Jue-Rajasingh, Romero, Stenson: Consumer Education and Reverse Logistics in the Base of the PyramidWorking Paper - February 2017 5
1.3. Main contributions
We model and analyze the operations strategy of a distributor in a supply chain that sells innova-
tive durable goods in a BOP setting, and we contrast this setup with a supply chain in a developed
market. The distributor must induce (small) retailers to carry a new product, and he seeks prof-
itability and product adoptions. Retailers, in turn, sell to consumers that have an uncertain product
valuation. A subset of the consumers, referred to as BOP consumers, face financial distress.
Within this context, we consider that the distributor has two levers to maximize its objective
and tackle the value-access paradox: (i) improve consumer education, and (ii) improve the prod-
uct’s salvage value4, which supports better after-sales service to consumers. We propose a stylized
discrete valuation model that captures the characteristics of this BOP supply chain and allows us
to analyze the value of, and trade-offs between, the levers available to the distributor. We model
after-sales service as a refund offered by the distributor to consumers, and consumer education as
the fraction of consumers that have learned their own valuation for the product. Hence, higher
refunds increase the willingness to pay of uninformed consumers, or consumers not reached through
education activities.
This model offers insight into the behavior of this BOP supply chain, allows us to contrast a
BOP market and a developed market, and is analytically tractable. In particular, this stylized
model captures the mechanism through which increasing a product’s salvage value can tackle the
value-access paradox and describes how increasing the consumer education level may fail to do
so. Our insights are robust towards modeling assumptions and hold in a more complex continuous
valuation model discussed in Appendix X. Our main results are:
• A higher salvage value can only benefit the distributor, while more consumer
education might be detrimental to the distributor. This result holds for supply chains
in both BOP and developed markets. Consistent with the literature, e.g. Shulman et al.
(2009), we show that consumer education and after-sales service are strategic substitutes.5 In
the extreme, if the salvage value is high enough, more consumer education might hurt the
distributor’s objective. This occurs because the cost associated to uninformed consumers that
buy and return the product is reduced when the salvage value is high, allowing for it to be
outweighed by the value derived from uninformed consumers that buy and keep the product.
• In BOP markets, the distributor’s value for product adoptions makes improving
consumer education less likely to be detrimental. The opposite result holds in
4 In practice, there are many ways to improve a product’s salvage value: create an after-market for used products orparts, redesign the product to facilitate repair and re-manufacturing, develop a closed-loop supply chain for the reuseof spare parts, etc.
5 Specifically, the marginal benefit of increasing the salvage value of a returned product decreases with an increase inconsumer education level (and vice-versa). See Bulow et al. (1985) for a definition of strategic substitutes.
Calmon, Jue-Rajasingh, Romero, Stenson: Consumer Education and Reverse Logistics in the Base of the Pyramid6 Working Paper - February 2017
developed markets. Specifically, the impact on product adoptions from increasing the
product salvage value is smaller in BOP markets than in developed markets. This limited
impact is driven by the fraction of uninformed consumers at the BOP under financial distress,
since their willingness to pay for a product that they lack information about is very low.
Thus, product adoptions from uninformed BOP consumers can only be attained by improving
consumer education, making the latter more likely to be beneficial when product adoptions
are highly valued. In contrast, consumers in a developed market face significantly less financial
distress. As a result, increasing the product’s salvage value impacts product adoptions from
all uninformed consumers. Thus, the more product adoptions are valued leads to improving
consumer education being more likely to be detrimental. This contribution also highlights
a key difference between for-profit and non-profit operations in the BOP. Non-
profit operations value exclusively product adoptions, with little concern for profits. Thus, in
this non-profit set-up, investment in consumer education can increase product adoptions by
encouraging the retailer to target both BOP and non-BOP consumers.
• In BOP markets, increasing the product’s salvage value can only decrease the
equilibrium price to consumers and increase product adoptions. This result does
not hold in developed markets. Informed BOP consumers have a lower willingness to
pay for the good due to financial distress (even thought they value it highly). A priori, if
the fraction of informed BOP consumers is small, it may be optimal for the retailer to price
BOP consumers out. We show that increasing the product’s salvage value always incentivizes
the distributor to give a refund such that uninformed non-BOP consumers are pooled with
informed BOP consumers, resulting in a lower price and more adoptions. This is not necessarily
true in a developed market, where a higher salvage value might encourage the distributor
and retailer to skim the market by targeting only consumers that have a high willingness to
pay. In contrast to increasing the product’s salvage value, increasing the consumer
education level can result in higher prices and less product adoptions in both BOP
and developed markets. To summarize, this result suggests that increasing the product’s
salvage value, essentially by improving the reverse logistics in their distribution, is an effective
strategy to address the value-access paradox in BOP markets.
• In BOP markets, more expensive products with better salvage values can Pareto-
dominate low-cost products with small salvage values in terms of supply-chain
performance. Namely, the former can simultaneously lead to lower prices to consumers,
more product adoptions, more retailer profits, and better distributor’s objective value than
the latter. Specifically, a more expensive product that supports a higher customer service level
encourages the retailer and the distributor to target BOP consumers, who have the lowest

Calmon, Jue-Rajasingh, Romero, Stenson: Consumer Education and Reverse Logistics in the Base of the PyramidWorking Paper - February 2017 7
ability to pay. This is not necessarily true in a developed market, where a higher salvage value
might encourage the distributor and retailer to only target consumers with high willingness
to pay.
1.4. Background and Motivation
Since the early 2000s, there has been an increasing interest in new, innovative technologies for
low-income users in emerging markets around the world. Newly developed products like affordable
solar lanterns, non-electric water purifiers, and smoke-reducing cooking stoves have the potential
to address the unmet needs of millions of people (IEA (2015) and Purvis (2015)). Strong interest in
these technologies is demonstrated by the growth of academic programs in which students design
products for international development, and global initiatives like the Global Alliance for Clean
Cookstoves, which plans to distribute 100 million clean and efficient stoves by 2020.
The idea of designing technologies for use at the BOP is not new. After World War II, some
economists began considering a new form of technology to create non-agricultural jobs in rural areas
of newly independent countries, as discussed by Schumacher (1970). Today, the idea of “design
for the other 90%” is a growing movement that has inspired life-improving technologies like non-
electric baby infant warmers, bicycle-powered mobile phone chargers, and drip irrigation systems
for small-plot farmers (Smith (2007)).
There are hundreds of life-improving technologies that meet the critical needs of populations
around the world (for a sample see Essmart (2018)). However, there is a very distinctive prob-
lem with these life-improving technologies for development. No matter how well-designed or well-
intentioned they may be, there is no guarantee that they will reach the people for whom they are
made (for a discussion, see Polak (2008) and Polak (2010)).
The challenges in profitably scaling the distribution of life-improving technologies in the BOP is
the main motivation for this paper. These challenges include low consumer education and aware-
ness, affordability, lack of availability, and lack of confidence in the performance of these products
(see Brine et al. (2015) for the case of solar lanterns). Furthermore, although nonprofit organi-
zations, government programs, large multinational companies, and small social enterprises have
attempted to move these technologies out of the lab and into the land, no strategy has been
completely successful (Jue (2012)). In particular, nonprofit organizations that have traditionally
distributed technologies on a project-by-project basis are limited in funding and scale. Additionally,
inappropriate design and lack of long-term maintenance and proper incentives have led to failures,
such as Play Pumps in Mozambique (Costello (2010)). Another well-utilized dissemination strategy
consists of increasing consumer awareness and access through massive door-to-door campaigns that
combine education and subsidized direct sales to consumers (for an example, see Vidal (2013)).

Calmon, Jue-Rajasingh, Romero, Stenson: Consumer Education and Reverse Logistics in the Base of the Pyramid8 Working Paper - February 2017
However, managing the operations of these massive campaigns is expensive and labor-intensive,
and scaling these operations is, in many cases, difficult.
The rest of the paper is structured as follows. In Section 2 we present a brief literature review. In
Section 3 we introduce our model. Section 4 is dedicated to analyzing the challenges of distributing
innovative durable goods in a BOP market, while in Section 5 we analyze the case of a developed
market for benchmarking purposes. Finally, in Section 6 we discuss our conclusions.
2. Literature Review
This paper draws from the literature on social entrepreneurship, reverse logistics, and the intersec-
tion of marketing and operations management. We position our paper with respect to this literature
below, and also present an overview of previous research on these topics.
2.1. Social Entrepreneurship and Development
Our model is applied to the context of social entrepreneurship, which is a form of entrepreneurship
that combines social and economic value creation, differentiating itself not only from traditional
entrepreneurship but also from charities and philanthropy (Miller et al. (2012)). Mair and Marti
(2006) describe social entrepreneurship as “a process involving the innovative use and combination
of resources to pursue opportunities to catalyze social change and/or address social needs.” Other
researchers highlight social entrepreneurs’ extensive search of different types of funding sources
(Austin et al. (2006)), the cross-sector partnerships of commercial businesses that foray into the
realm of creating social value based on common interests with nonprofit organizations (Sagawa and
Segal (2000)), and the identification of an opportunity at forging a new, stable equilibrium from a
previously unjust equilibrium (Martin and Osberg (2007)).
Through our model, we can address the particular problems confronted by social enterprises
that derive from the contexts in which they are implemented. Social entrepreneurship emerges in
contexts where goods and services are not being adequately provided by public agencies or private
markets (Dees (1994)), where market and government failures are perceived (McMullen (2011)),
and where there are institutional voids (Austin et al. (2006)). These markets have been described
as “challenging” (Mair and Marti (2006)), and consumers have been described as “underserved,
neglected, or highly disadvantaged” (Martin and Osberg (2007)).
Historically, traditional entrepreneurs have underestimated the financial returns of serving low-
income markets. They lacked awareness of consumer wants and needs, as well as the obstacles
that prevent their fulfillment (Webb et al. (2010)). Very often, entrepreneurs have assumed that
poor consumers would not or could not repay loans (Yunus (2007)), and would not pay for brand
name consumer products that are popular in wealthier areas (Prahalad (2006)). However, relatively
simple innovations like extending credit to groups as microfinance and selling single-serving-sized
Calmon, Jue-Rajasingh, Romero, Stenson: Consumer Education and Reverse Logistics in the Base of the PyramidWorking Paper - February 2017 9
goods have proven that there is indeed a market in low-income markets. The model that we present
is also an innovative strategy that further enables social enterprises to reach their markets with
new, durable, life-improving products.
Operations management problems in developing countries that target BOP suppliers and con-
sumers has been an area of increasing interest in the supply chain management community. Sodhi
and Tang (2016) present an overview of this literature, together with business cases and a discussion
of research opportunities. Also, Sodhi and Tang (2017) challenge the supply chain community to
develop models and frameworks for supply chains that seek to have social impact and be financially
sustainable. Our model is one answer to this challenge, since we consider a distributor that values
not only profits, but also the dissemination of life-improving products, leading to new insights.
2.2. Reverse Logistics and Marketing
One of the main features of our model, and of Essmart’s operations strategy, is the possibility for
consumers to return products. Thus, we build upon the literature on operations of reverse logistics
systems that support warranties and customer returns. An overview of this literature is presented in
Guide and Van Wassenhove (2009). In particular, Su (2009) proposes a model where consumers face
valuation uncertainty and realize their valuation only after purchase. Su (2009) proposes variations
on well known supply contracts (e.g. buy-back contracts) such that they coordinate the supply
chain even when taking into account consumer returns. In contrast, we incorporate information
control to the consumer, while we ignore aggregate demand uncertainty and the related inventory
management component of the problem. More recently, Atasu et al. (2008) study the impact of re-
manufacturing and refurbished products on firm profitability and market share, Calmon and Graves
(2016) investigate managing reverse logistics systems when prices and demand are uncertain, and
Pince et al. (2016) study the relationship between pricing and re-manufacturing decisions.
Shulman et al. (2009) consider an analytical model with risk neutral consumers and two hor-
izontally differentiated products. They identify conditions under which it is optimal to provide
product fit information to consumers. However, they consider a binary decision of providing either
full information or no information. They do identify information provision and reverse logistics as
strategic substitutes, as we do. In contrast, we consider a richer information control model, and
additionally identify increasing the products’ salvage value, through better reverse logistics, as a
main driver of product adoptions.
Taylor and Xiao (2016) compare the options of distributing socially-desirable products through
non-commercial and commercial channels, where the latter include a for-profit intermediary, in a
model that incorporates consumer awareness. They study the optimal subsidy by an international
donor, and show that the subsidy level can be higher or lower in the commercial channel, depending

Calmon, Jue-Rajasingh, Romero, Stenson: Consumer Education and Reverse Logistics in the Base of the Pyramid10 Working Paper - February 2017
Variable Type Meaning Obs.
T Set Set that contains consumer types. T = 0, l, h
T Random Variable Type of a randomly chosen consumer Common knowledge to all players
α Exogenous parameter BOP consumers’ financial distress Common knowledge to all players
βt Probability Prob. of a random consumer being of type t P(T = t) = βt
vt Exogenous parameter Product valuation of a consumer of type t∈ T . See Sec. 3.1 for the relationship with α.
p Decision variable Product price set by the retailer
c Decision variable Price set by the distributor to the retailer
r Decision variable Refund price set by the distributor
S Random Variable Indicates if a consumer received marketing signal. S ∈ {0,1}θ Probability Prob. that a consumer receives the marketing signal. P(S = 1) = θ
U t Function Utility function of consumer of type t t∈ TΠD Function Distributor’s profit
ΠR Function Retailer’s profit
Table 1 Summary of notation used in the paper.
on the level of consumer awareness. Our model is different in several aspects, including the absence
of subsidies, and the presence of consumer returns. The common insight from their paper and ours
is that a decision maker with a social motive can be hurt by improving the information provided
to consumers, due to the presence of a for-profit intermediary in the supply chain.
More generally, our paper contributes to the new OM research direction on socially and envi-
ronmentally responsible value chain innovations, see Lee and Tang (2017) for a recent motivation
and literature review.Position
our paper
in more
detail with
respect to
the exam-
ples in Lee
and Tang
(2017)
Position
our paper
in more
detail with
respect to
the exam-
ples in Lee
and Tang
(2017)
3. Model
We consider a game-theoretic model with a three-echelon supply chain. The three echelons are:
the distributor, the retailer, and the consumers. In this section, we describe each of these players
and define the sequence of events in the game we study. Additionally, we make assumptions on the
model parameters that capture the challenging environment that is faced by organizations when
trying to serve consumers at the BOP. A summary of our notation is given in Table 1.
We focus on the case where there is a discrete number of consumer types and valuations. This
discrete set-up captures all our main managerial insights and is tractable enough to be solved
analytically. In order to test the robustness of our results, we present a continuous version the
model in Appendix X and we study it through numerical simulations.
3.1. Consumers
We assume that the market has a constant number of consumers, each with an individual valuation
for the new product. To simplify the notation, we normalize the total demand to 1, and we work
on a per-unit accounting basis. All results carry to any fixed pool of consumers.
Calmon, Jue-Rajasingh, Romero, Stenson: Consumer Education and Reverse Logistics in the Base of the PyramidWorking Paper - February 2017 11
We capture the financial distress encountered by many BOP consumers by assuming that they
face a higher purchasing cost of durable products than non-BOP consumers. Simply put, we assume
that if a durable good is offered for a price p, the “purchasing cost” of this product for BOP
consumers will be (1 +α) · p for some parameter α≥ 0 that represents the financial distress faced
by BOP consumers. One possible interpretation for α is that BOP consumers might have to take a
loan to purchase the product, or that they face a significant opportunity cost for the money spent
on this durable good (for example, buying a solar lamp instead of more fertilizer for their farm).
We assume that the market is composed of three types of consumers, described by the set
T = {0, l, h}. The distribution of types among the population is common knowledge and is given
by the random variable T , where
P(T = h) = βh, P(T = l) = βl, P(T = 0) = β0 = 1−βh−βl.
Consumer types differ in their valuations for the product and potentially on their access-value
trade-off. Specifically, the valuation of a consumer of type i is given by vi, and we assume, without
loss of generality, that 0 = v0 < vl < vh. The access-value trade-off described in the introduction
is captured by assuming that, for innovative durable goods designed for the BOP, the product
valuations and the purchasing costs are positively correlated. Specifically, we assume that for the
new life-improving technologies considered in this paper, BOP consumers have the highest valuation
vh and also face a higher purchasing cost (1 +α)p. On the other hand, non-BOP consumers have
moderate or low valuations {vl,0} and face a regular purchasing cost p. Since we focus on new
products, we assume that uninformed consumers do not know this correlation, while the distributor
and the retailer are aware of it.
The retailer sells each product for a price p, and the distributor offers a refund r for consumers
that decide to return the product after purchasing it. We assume that a consumer returns a product
if, after purchasing and using it, she finds that her valuation is less than the refund r. More
generally, we can think of r as a measure of the after-sales service provided to the consumers.
The latter operates as a real option and guarantees a minimum level of satisfaction obtained from
purchasing the product.
Prior to her purchasing decision, the consumer might receive a marketing signal from the distrib-
utor (the signal is representative of a marketing, or educational, campaign). The random variable
S ∈ {0,1} captures whether a consumer received this signal (S = 1) or not (S = 0). Thus, P(S =
1) = θ measures the consumer education level in the market. The consumer education level θ will
be an exogenous parameter in the supply chain game we will analyze in Section 4. However, some
of the main results in Section 4.3 will be devoted to performing comparative statics on the value of
Calmon, Jue-Rajasingh, Romero, Stenson: Consumer Education and Reverse Logistics in the Base of the Pyramid12 Working Paper - February 2017
θ, and in particular understanding the value of increasing the consumer education level for firms
distributing new life-improving technologies in BOP markets.
For simplicity we assume that the marketing signal carries perfect information about the product.
Namely, if S = 1 then the consumer learns her true valuation, while if S = 0 the consumer receives
no further information and she estimates her valuation based on the distribution of types in the
population and the refund, i.e. her willingness to pay is ET [max(vT , r)]. We emphasize that this
model captures consumers that take into account the option of returning the product when making
their purchasing decisions. Simulation results presented in Appendix X suggest that the main
insights in this paper continue to hold in a continuous version of the model where the marketing
signal is assumed to be noisy.
To summarize the model setup at the consumer echelon, for a given price p, refund r, and signal
s, let us denote the utility function of a consumer of type t ∈ T by U t(p, r, s). Then, consumers
buy the product if their utility is non-negative, where
Uh(p, r, s) =
{vh− (1 +α)p, if s= 1,
ET [max(vT , r)]− (1 +α)p, if s= 0,
U l(p, r, s) =
{vl− p, if s= 1,
ET [max(vT , r)]− p, if s= 0,
and
U 0(p, r, s) =
{−p, if s= 1,
ET [max(vT , r)]− p, if s= 0.
Note that, assuming 0 ≤ r ≤ p ≤ vh, ET [max(vT , r)] = βhvh + βlmax{vl, r} + β0r. The consumer
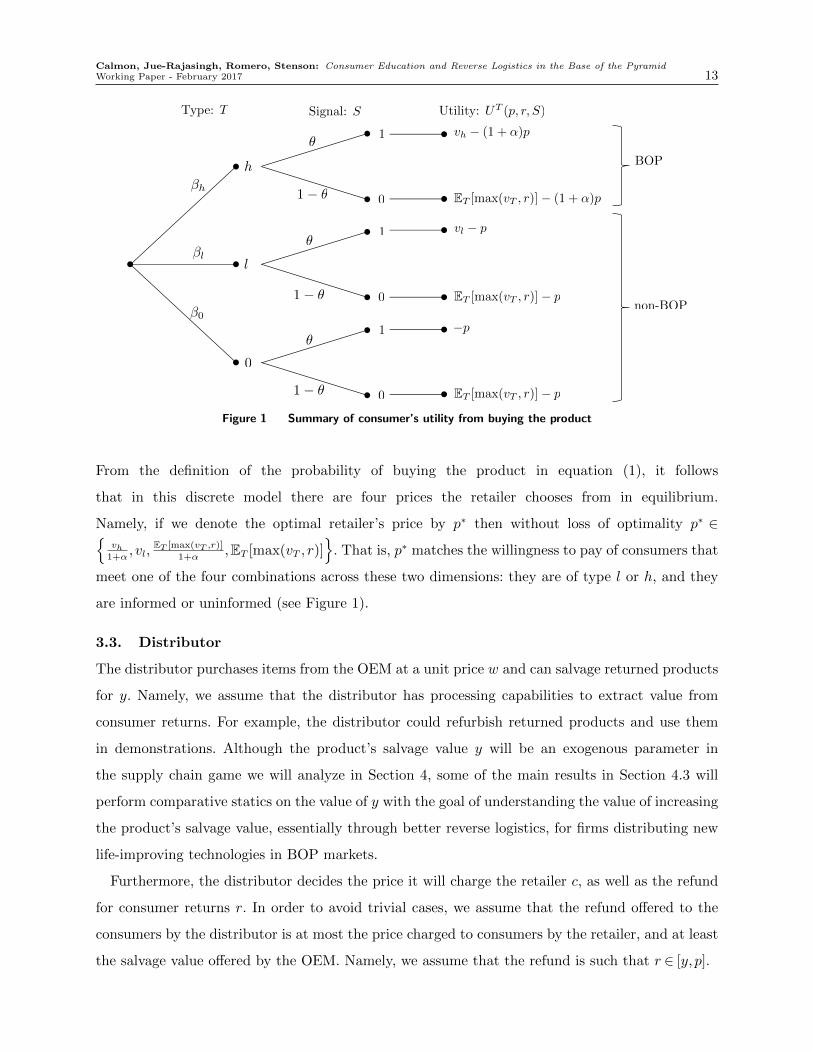
model is depicted schematically in Figure 1.
Then, given a price p and a refund r such that 0 ≤ r ≤ p ≤ vh, the consumer behavior can be
fully described by the following events and their probabilities.
P(B(p, r)|θ) :=P(UT (p, r,S)≥ 0|θ) (Probability of buying the product) (1)
P(R(p, r)|θ) :=P(UT (p, r,S)≥ 0, vT < r|θ) (Probability of returning the product) (2)
P(A(p, r)|θ) :=P(UT (p, r,S)≥ 0, vT ≥ r|θ) (Probability of adopting the product) (3)
3.2. Retailer
The retailer buys the product from the distributor at a cost c and sells it to the consumers at a
price p. We assume that all sales are deliver-to-order. Whenever a sale occurs, the item is delivered
to the retailer by the distributor, and then the consumer collects the product. This assumption is
representative of Essmart’s operations in India, which motivated this paper.
Hence, the retailer’s profit function is
ΠR(p) = (p− c) ·P(B(p, r)|θ).
Calmon, Jue-Rajasingh, Romero, Stenson: Consumer Education and Reverse Logistics in the Base of the PyramidWorking Paper - February 2017 13
l
h
0
�h
�l
�0
✓
✓
✓
1 � ✓
1 � ✓
1 � ✓
vh � (1 + ↵)p
vl � p
�p
0
1
ET [max(vT , r)] � (1 + ↵)p
ET [max(vT , r)] � p
ET [max(vT , r)] � p
BOP
non-BOP
Utility: UT (p, r, S)Signal: SType: T
0
1
0
1
Figure 1 Summary of consumer’s utility from buying the product
From the definition of the probability of buying the product in equation (1), it follows
that in this discrete model there are four prices the retailer chooses from in equilibrium.
Namely, if we denote the optimal retailer’s price by p∗ then without loss of optimality p∗ ∈{vh
1+α, vl,
ET [max(vT ,r)]
1+α,ET [max(vT , r)]
}. That is, p∗ matches the willingness to pay of consumers that
meet one of the four combinations across these two dimensions: they are of type l or h, and they
are informed or uninformed (see Figure 1).
3.3. Distributor
The distributor purchases items from the OEM at a unit price w and can salvage returned products
for y. Namely, we assume that the distributor has processing capabilities to extract value from
consumer returns. For example, the distributor could refurbish returned products and use them
in demonstrations. Although the product’s salvage value y will be an exogenous parameter in
the supply chain game we will analyze in Section 4, some of the main results in Section 4.3 will
perform comparative statics on the value of y with the goal of understanding the value of increasing
the product’s salvage value, essentially through better reverse logistics, for firms distributing new
life-improving technologies in BOP markets.
Furthermore, the distributor decides the price it will charge the retailer c, as well as the refund
for consumer returns r. In order to avoid trivial cases, we assume that the refund offered to the
consumers by the distributor is at most the price charged to consumers by the retailer, and at least
the salvage value offered by the OEM. Namely, we assume that the refund is such that r ∈ [y, p].
Calmon, Jue-Rajasingh, Romero, Stenson: Consumer Education and Reverse Logistics in the Base of the Pyramid14 Working Paper - February 2017
Finally, we assume that the distributor values product adoptions. This is in part due to the
distributor’s mission as a social enterprise. More generally, we model the fact that many companies
value their market share, even when improving it may potentially reduce its short term profits.
The distributor’s problem can be written as
maxc,r
ΠD(c, r) = (c−w)Pr(B(p∗, r)|θ)− (r− y)Pr(R(p∗, r)|θ) + γPr(A(p∗, r)|θ)
s.t. p∗ ∈ arg maxp{(p− c)Pr(B(p, r)|θ)} (IC)
(p∗− c)Pr(B(p∗, r)|θ)≥ 0 (IR)
r ∈ [y, p∗].
where the first two terms in the objective function corresponds to the distributor’s profit, and
γ ≥ 0 models the relative value for the distributor of product adoptions with respect to its short
term profits. The first constraint corresponds to the retailer’s incentive compatibility. Namely,
that the retailer chooses the price to consumers in order to maximize his own profits. The second
constraint corresponds to the retailer’s individual rationality. Namely, that the retailer should
make a non-negative profit from carrying the product. Note that we have normalized the retailer’s
outside option to have zero value. Considering a positive value for the retailer’s outside option only
strengthen the main insights presented in Section 4.
3.4. Sequence of Events
We assume that the distributor is a Stackelberg leader. That is, given the consumer education level
θ and the salvage value y, the dynamics of our modeling framework are as follows:
1. Given θ and y, the OEM wholesale cost w, the distribution of types, and the BOP purchasing
cost parameter α, the distributor chooses c and r anticipating the reaction from the retailer
and consumers;
2. The retailer chooses p after observing θ, c, and r, with knowledge of the distribution of types
and α, and starts selling the product if maxpΠR(p)≥ 0;
3. Each consumer observes p, r, and their individual signal s. Potentially based on the distri-
bution of types, but without knowledge of the connection between types and valuations, a
consumer of type t∈ T purchases the product if U t(p, r, s)≥ 0;
4. If a purchase occurs, the product is delivered to the retailer and is picked by the consumer at
the store;
5. If the consumer did not receive the marketing signal (s= 0) and made a purchase, then she
learns her true valuation v from using the product, and returns it if her valuation is smaller
than the refund, obtaining a refund r;
6. The distributor salvages the returns for a salvage value y per unit.
Calmon, Jue-Rajasingh, Romero, Stenson: Consumer Education and Reverse Logistics in the Base of the PyramidWorking Paper - February 2017 15
vh
1 + ↵
vl
vl
vh
ET [vT ]
ET [vT ] w
(1) (2)
Price
UtilityInformed BOP consumers
Non-informed non-BOP consumers
Assumptions
Informed non-BOP consumerswith valuation vl
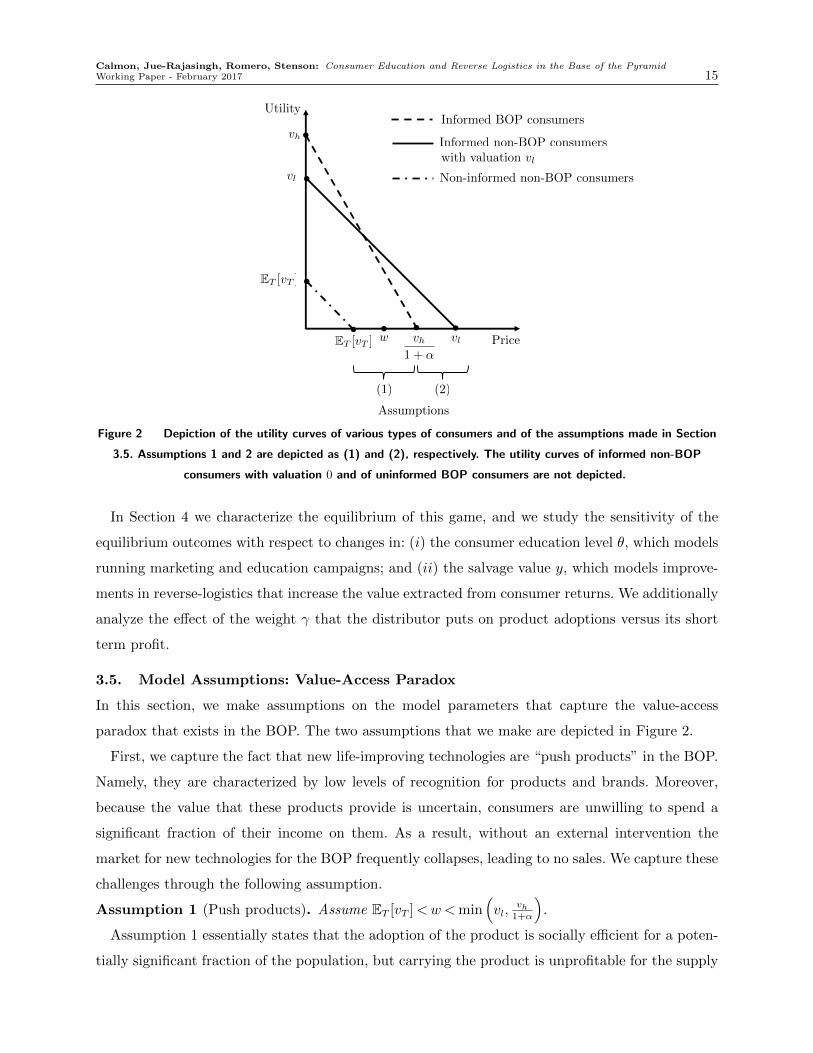
Figure 2 Depiction of the utility curves of various types of consumers and of the assumptions made in Section
3.5. Assumptions 1 and 2 are depicted as (1) and (2), respectively. The utility curves of informed non-BOP
consumers with valuation 0 and of uninformed BOP consumers are not depicted.
In Section 4 we characterize the equilibrium of this game, and we study the sensitivity of the
equilibrium outcomes with respect to changes in: (i) the consumer education level θ, which models
running marketing and education campaigns; and (ii) the salvage value y, which models improve-
ments in reverse-logistics that increase the value extracted from consumer returns. We additionally
analyze the effect of the weight γ that the distributor puts on product adoptions versus its short
term profit.
3.5. Model Assumptions: Value-Access Paradox
In this section, we make assumptions on the model parameters that capture the value-access
paradox that exists in the BOP. The two assumptions that we make are depicted in Figure 2.
First, we capture the fact that new life-improving technologies are “push products” in the BOP.
Namely, they are characterized by low levels of recognition for products and brands. Moreover,
because the value that these products provide is uncertain, consumers are unwilling to spend a
significant fraction of their income on them. As a result, without an external intervention the
market for new technologies for the BOP frequently collapses, leading to no sales. We capture these
challenges through the following assumption.
Assumption 1 (Push products). Assume ET [vT ]<w<min(vl,
vh1+α
).
Assumption 1 essentially states that the adoption of the product is socially efficient for a poten-
tially significant fraction of the population, but carrying the product is unprofitable for the supply
Calmon, Jue-Rajasingh, Romero, Stenson: Consumer Education and Reverse Logistics in the Base of the Pyramid16 Working Paper - February 2017
chain if consumers are uninformed and are offered no refunds. Specifically, the first inequality in
Assumption 1 imposes that the product’s wholesale cost w is larger than the willingness to pay
of uninformed consumers when no refunds are offered. The second inequality states that the will-
ingness to pay of a fraction θ(βl + βh) of the consumers is larger than its wholesale cost, so it is
possible to profitably improve the social welfare by distributing the product to them.
Additionally, new life-improving technologies for the BOP are characterized by the following
conundrum: the consumers that would benefit the most from them can afford them the least. This
occurs since many consumers in the BOP have tight budget constraints and suffer financial distress.
We capture this element of the value-access paradox through the following assumption.
Assumption 2 (Financial distress). Assume α> vh−vlvl
, i.e. vh1+α
< vl.
Assumption 2 states that the additional purchasing cost faced by BOP consumers, due to budget
constraints and a high opportunity cost for money, is large enough such that the order of the
willingness to pay and the value derived from the product are reversed. Namely, Assumption 2
states vh1+α
< vl, while simultaneously having vl < vh. In other words, the willingness to pay of the
consumers that derive the highest value from purchasing the product is smaller than the one from
consumers with moderate valuations. In Section 5 we relax Assumption 2 to explore the results
provided by the model in a setup that better matches markets in developed countries.
3.6. Model Discussion and Limitations
We do not explicitly model the cost of marketing and consumer education, nor of reverse-logistics.
The reason for this is that these costs depend on the realities of each specific firm. For example,
Essmart’s marketing and consumer education costs are a convex increasing function of its marketing
effort, since many of their customers are located in isolated regions. On the other hand, firms that
rely on mass communication strategies for their marketing campaigns could experience economies
of scale on their marketing efforts. Salvage values also depend on contracts with suppliers, ease of
recycling and refurbishment, and are product specific.
We do not model the inventory management problem faced by the distributor. In reality, since
Essmart delivers their products to order, they have to carry inventory. Although Essmart benefits
from inventory risk pooling across multiple retailers in multiple villages, they still face inventory
costs and risks. We leave this aspect of the problem as a potential extension of our model.
4. BOP Market Analysis
In this section, we characterize the equilibrium behavior of the consumers, the retailer, and the
distributor in a BOP market. We show that in order to profitably serve the BOP the distributor
has potentially four non-dominated strategies, driven by the combination of the retailer’s target
market and the distributor’s refund policy, see Table 2.
Calmon, Jue-Rajasingh, Romero, Stenson: Consumer Education and Reverse Logistics in the Base of the PyramidWorking Paper - February 2017 17
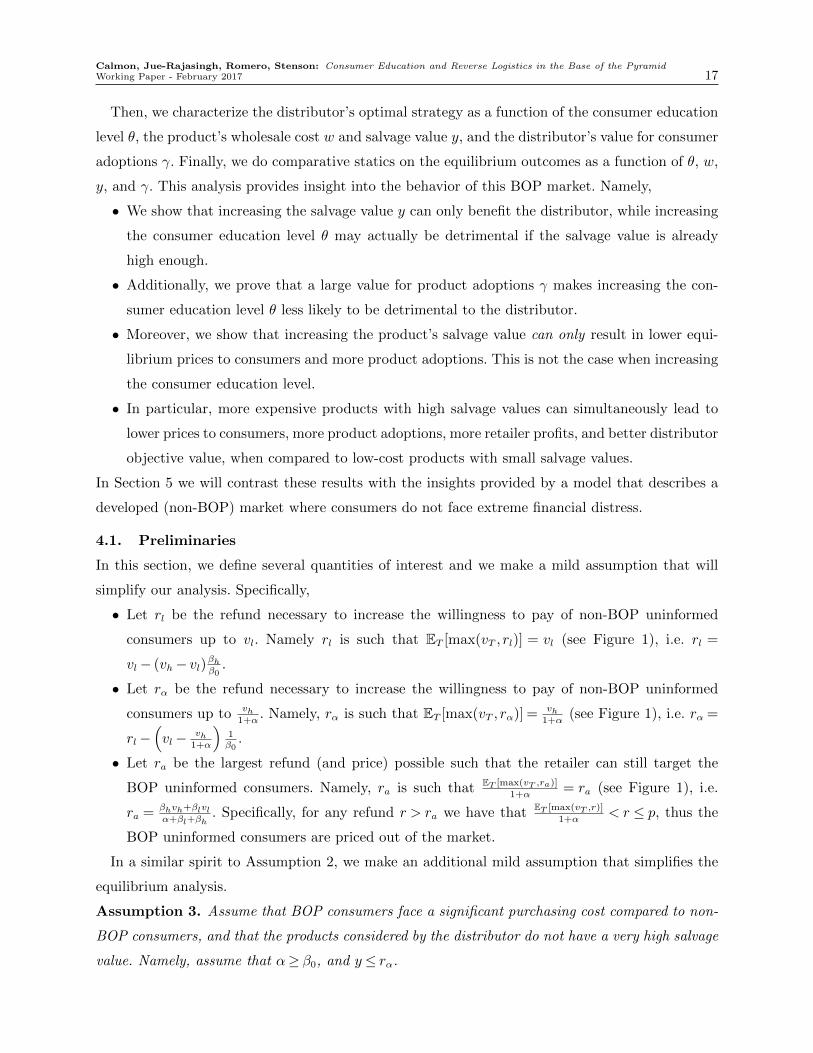
Then, we characterize the distributor’s optimal strategy as a function of the consumer education
level θ, the product’s wholesale cost w and salvage value y, and the distributor’s value for consumer
adoptions γ. Finally, we do comparative statics on the equilibrium outcomes as a function of θ, w,
y, and γ. This analysis provides insight into the behavior of this BOP market. Namely,
• We show that increasing the salvage value y can only benefit the distributor, while increasing
the consumer education level θ may actually be detrimental if the salvage value is already
high enough.
• Additionally, we prove that a large value for product adoptions γ makes increasing the con-
sumer education level θ less likely to be detrimental to the distributor.
• Moreover, we show that increasing the product’s salvage value can only result in lower equi-
librium prices to consumers and more product adoptions. This is not the case when increasing
the consumer education level.
• In particular, more expensive products with high salvage values can simultaneously lead to
lower prices to consumers, more product adoptions, more retailer profits, and better distributor
objective value, when compared to low-cost products with small salvage values.
In Section 5 we will contrast these results with the insights provided by a model that describes a
developed (non-BOP) market where consumers do not face extreme financial distress.
4.1. Preliminaries
In this section, we define several quantities of interest and we make a mild assumption that will
simplify our analysis. Specifically,
• Let rl be the refund necessary to increase the willingness to pay of non-BOP uninformed
consumers up to vl. Namely rl is such that ET [max(vT , rl)] = vl (see Figure 1), i.e. rl =
vl− (vh− vl)βhβ0.
• Let rα be the refund necessary to increase the willingness to pay of non-BOP uninformed
consumers up to vh1+α
. Namely, rα is such that ET [max(vT , rα)] = vh1+α
(see Figure 1), i.e. rα =
rl−(vl− vh
1+α
)1β0
.
• Let ra be the largest refund (and price) possible such that the retailer can still target the
BOP uninformed consumers. Namely, ra is such that ET [max(vT ,ra)]
1+α= ra (see Figure 1), i.e.
ra = βhvh+βlvlα+βl+βh
. Specifically, for any refund r > ra we have that ET [max(vT ,r)]
1+α< r ≤ p, thus the
BOP uninformed consumers are priced out of the market.
In a similar spirit to Assumption 2, we make an additional mild assumption that simplifies the
equilibrium analysis.
Assumption 3. Assume that BOP consumers face a significant purchasing cost compared to non-
BOP consumers, and that the products considered by the distributor do not have a very high salvage
value. Namely, assume that α≥ β0, and y≤ rα.
Calmon, Jue-Rajasingh, Romero, Stenson: Consumer Education and Reverse Logistics in the Base of the Pyramid18 Working Paper - February 2017
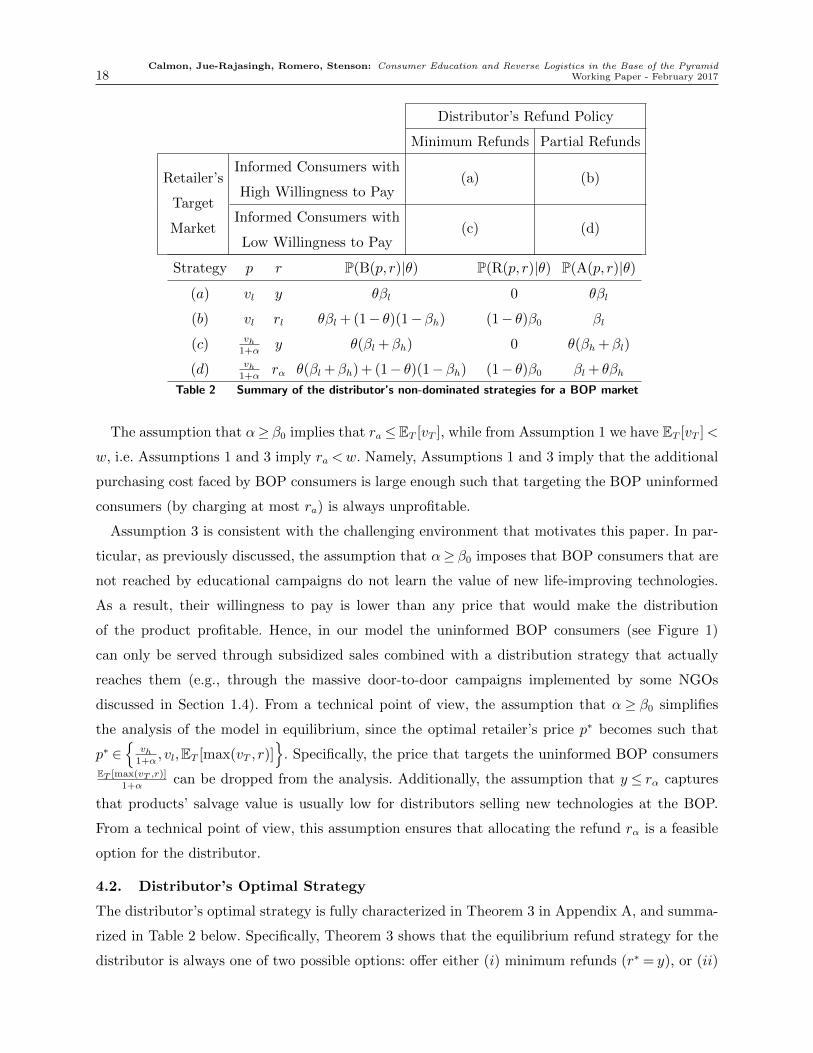
Distributor’s Refund Policy
Minimum Refunds Partial Refunds
Retailer’s
Target
Market
Informed Consumers with
High Willingness to Pay(a) (b)
Informed Consumers with
Low Willingness to Pay(c) (d)
Strategy p r P(B(p, r)|θ) P(R(p, r)|θ) P(A(p, r)|θ)(a) vl y θβl 0 θβl
(b) vl rl θβl + (1− θ)(1−βh) (1− θ)β0 βl
(c) vh1+α
y θ(βl +βh) 0 θ(βh +βl)
(d) vh1+α
rα θ(βl +βh) + (1− θ)(1−βh) (1− θ)β0 βl + θβhTable 2 Summary of the distributor’s non-dominated strategies for a BOP market
The assumption that α≥ β0 implies that ra ≤ET [vT ], while from Assumption 1 we have ET [vT ]<
w, i.e. Assumptions 1 and 3 imply ra <w. Namely, Assumptions 1 and 3 imply that the additional
purchasing cost faced by BOP consumers is large enough such that targeting the BOP uninformed
consumers (by charging at most ra) is always unprofitable.
Assumption 3 is consistent with the challenging environment that motivates this paper. In par-
ticular, as previously discussed, the assumption that α≥ β0 imposes that BOP consumers that are
not reached by educational campaigns do not learn the value of new life-improving technologies.
As a result, their willingness to pay is lower than any price that would make the distribution
of the product profitable. Hence, in our model the uninformed BOP consumers (see Figure 1)
can only be served through subsidized sales combined with a distribution strategy that actually
reaches them (e.g., through the massive door-to-door campaigns implemented by some NGOs
discussed in Section 1.4). From a technical point of view, the assumption that α ≥ β0 simplifies
the analysis of the model in equilibrium, since the optimal retailer’s price p∗ becomes such that
p∗ ∈{
vh1+α
, vl,ET [max(vT , r)]}
. Specifically, the price that targets the uninformed BOP consumersET [max(vT ,r)]
1+αcan be dropped from the analysis. Additionally, the assumption that y ≤ rα captures
that products’ salvage value is usually low for distributors selling new technologies at the BOP.
From a technical point of view, this assumption ensures that allocating the refund rα is a feasible
option for the distributor.
4.2. Distributor’s Optimal Strategy
The distributor’s optimal strategy is fully characterized in Theorem 3 in Appendix A, and summa-
rized in Table 2 below. Specifically, Theorem 3 shows that the equilibrium refund strategy for the
distributor is always one of two possible options: offer either (i) minimum refunds (r∗ = y), or (ii)
Calmon, Jue-Rajasingh, Romero, Stenson: Consumer Education and Reverse Logistics in the Base of the PyramidWorking Paper - February 2017 19
(optimal) partial refunds (r∗ ∈ {rl, rα}). The definitions of the partial refund candidates given in
Section 4.1 imply that it is optimal for the distributor to pool the willingness to pay of uninformed
non-BOP consumers (see Figure 1) with one of the classes of informed consumers (i.e. either vh1+α
or vl). As a result, the retailer has only two possible target markets: (i) target informed consumers
with high willingness to pay vl, or (ii) target informed consumers with low willingness to pay vh1+α
.
The combination of the distributor’s refund policy and the retailer’s target market leads to the
four non-dominated strategies summarized in Table 2. In particular, from Theorem 3 is possible
to compare the distributor’s non-dominated strategies along the dimensions of Table 2.
• By comparing the rows in Table 2 we note that strategies (a) and (b) lead to no profits for the
retailer, while in strategies (c) and (d) the retailer gets a positive profit. Specifically, strategies
(a) and (b) induce the retailer to charge the high price p= vl, hence the distributor can extract
all the retailer’s profit by setting c= vl as well. In contrast, strategies (c) and (d) induce the
retailer to charge the low price vh1+α
, hence the distributor leaves positive profits to the retailer
in order to prevent him from deviating and charging the high price vl instead.
• By comparing the columns in Table 2 we note that offering partial refunds leads to strategies
(b) and (d) inducing more product adoptions than strategies (a) and (c), respectively. These
additional purchases come from uninformed non-BOP consumers. A portion of these unin-
formed consumers buy the product and return it (since they have no value for the product)
incurring an additional cost to the distributor.
4.3. Comparative Statics in a BOP Market
This section provides our main analytical results, which allow us to do comparative statics on the
equilibrium outcomes as a function the consumer education level θ, the product’s wholesale cost
w and salvage value y, and the distributor’s value for consumer adoptions γ. All the proofs are
provided in Appendix A.
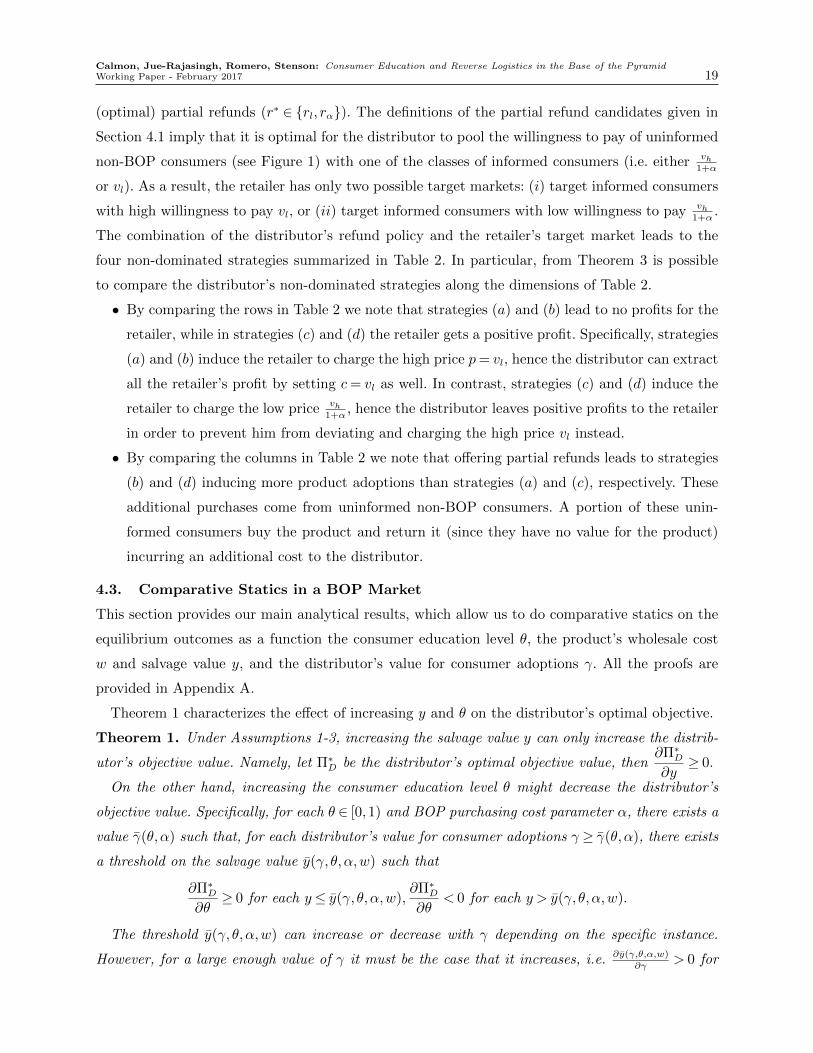
Theorem 1 characterizes the effect of increasing y and θ on the distributor’s optimal objective.
Theorem 1. Under Assumptions 1-3, increasing the salvage value y can only increase the distrib-
utor’s objective value. Namely, let Π∗D be the distributor’s optimal objective value, then
∂Π∗D
∂y≥ 0.
On the other hand, increasing the consumer education level θ might decrease the distributor’s
objective value. Specifically, for each θ ∈ [0,1) and BOP purchasing cost parameter α, there exists a
value γ(θ,α) such that, for each distributor’s value for consumer adoptions γ ≥ γ(θ,α), there exists
a threshold on the salvage value y(γ, θ,α,w) such that
∂Π∗D
∂θ≥ 0 for each y≤ y(γ, θ,α,w),
∂Π∗D
∂θ< 0 for each y > y(γ, θ,α,w).
The threshold y(γ, θ,α,w) can increase or decrease with γ depending on the specific instance.
However, for a large enough value of γ it must be the case that it increases, i.e. ∂y(γ,θ,α,w)
∂γ> 0 for

Calmon, Jue-Rajasingh, Romero, Stenson: Consumer Education and Reverse Logistics in the Base of the Pyramid20 Working Paper - February 2017
0.02
0.04
0.06
0.0 0.1 0.2 0.3 0.4
y
Π∗ D
θ
0.1
0.3
0.5
0.7
0.9
(a) γ = 0
0.025
0.050
0.075
0.0 0.1 0.2 0.3 0.4
y
Π∗ D
θ
0.1
0.3
0.5
0.7
0.9
(b) γ = 0.05Figure 3 Distributor’s profits for different salvage values y and consumer education level θ.
We assume vh = 1, vl = 0.83, w= 0.65, α= 0.3, β0 = βl = 0.3, and βh = 0.4.
large γ, making increasing the consumer education level more likely to improve the distributor’s
optimal objective value.
Theorem 1 shows that increasing the salvage value y can only improve the distributor’s optimal
objective value. In contrast, if the salvage value is already high enough, then increasing the con-
sumer education level θ may actually result in decreasing the distributor’s optimal objective value.
This is illustrated in Figure 5a. Moreover, Theorem 1 additionally shows that if the distributor’s
value for product adoptions γ is large enough, then the latter feature is not present, i.e. increasing
the consumer education level θ is guaranteed to improve the distributor’s optimal objective value.
This is is illustrated in Figure 5b. Intuitively, for a larger γ strategy (d) will be preferred since
it leads to the highest level of product adoptions among the non-dominated distributor’s strate-
gies. Moreover, the product adoptions induced by implementing strategy (d) are increasing in the
consumer education level θ (see Table 2). Therefore, having a large value for γ naturally leads to
increasing θ being beneficial for the distributor’s optimal objective value.
Theorem 1 also highlights the difference in operations strategy between for-profit and non-
profit organizations in the BOP. A non-profit distributor likely has a large value of γ and, in
equilibrium, stands to have a positive benefit from increasing consumer information. Conversely, a
profit maximizing enterprise at the BOP faces, in equilibrium, diminishing returns from consumer
education investments. This observation serves as a cautionary tale, and for-profit enterprises in
the BOP should not always assume that non-profit best practices directly apply to their operations
strategy.added thisadded this
Lemma 1 below characterizes the distributor’s optimal strategy for any pair of product’s whole-
sale cost and salvage value (w,y). Namely, Lemma 1 defines the distributor’s strategy map in a
BOP market, as illustrated in Figure 4.
Lemma 1. Under Assumptions 1-3, let W :=[ET [vT ], vh
1+α
], Y := [0, rα].
Calmon, Jue-Rajasingh, Romero, Stenson: Consumer Education and Reverse Logistics in the Base of the PyramidWorking Paper - February 2017 21
1
2
0.0
0.1
0.2
0.3
0.4
0.60 0.65 0.70 0.75 0.80
w
y
Strategy
a
b
c
d
(a) α= 0.3
0.0
0.1
0.2
0.3
0.4
0.60 0.65 0.70 0.75 0.80
w
y
Strategy
a
b
c
d
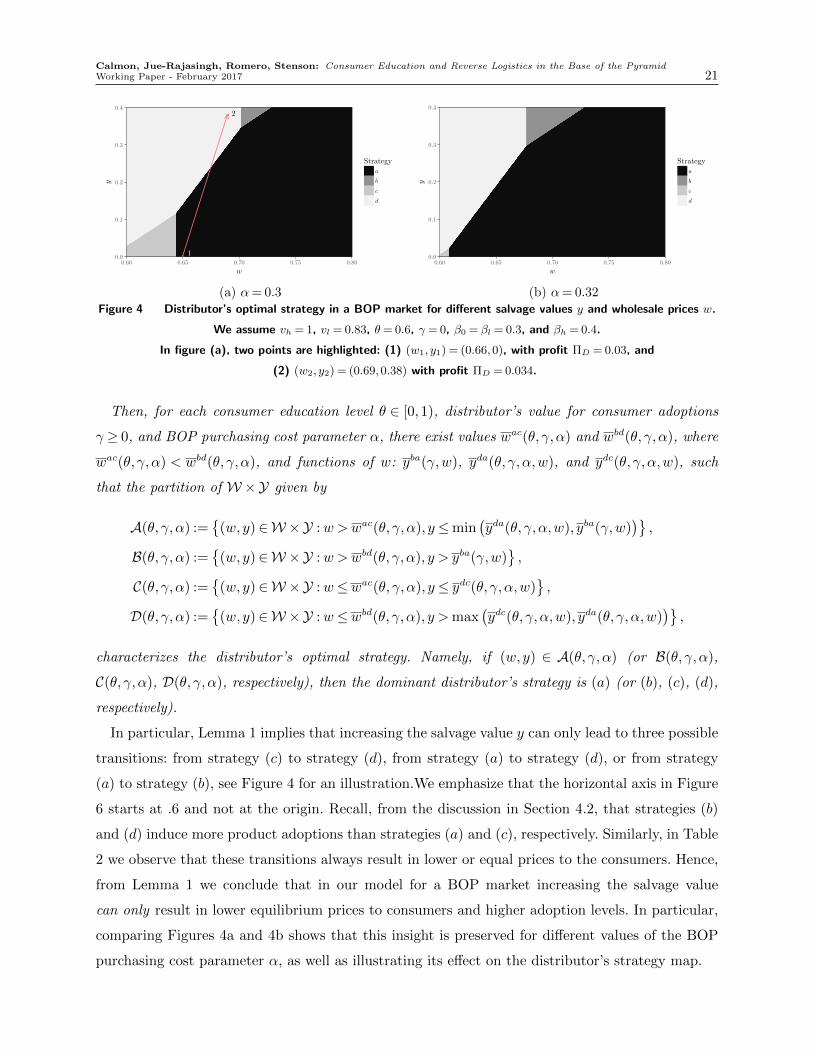
(b) α= 0.32Figure 4 Distributor’s optimal strategy in a BOP market for different salvage values y and wholesale prices w.
We assume vh = 1, vl = 0.83, θ= 0.6, γ = 0, β0 = βl = 0.3, and βh = 0.4.
In figure (a), two points are highlighted: (1) (w1, y1) = (0.66,0), with profit ΠD = 0.03, and
(2) (w2, y2) = (0.69,0.38) with profit ΠD = 0.034.
Then, for each consumer education level θ ∈ [0,1), distributor’s value for consumer adoptions
γ ≥ 0, and BOP purchasing cost parameter α, there exist values wac(θ, γ,α) and wbd(θ, γ,α), where
wac(θ, γ,α) < wbd(θ, γ,α), and functions of w: yba(γ,w), yda(θ, γ,α,w), and ydc(θ, γ,α,w), such
that the partition of W×Y given by
A(θ, γ,α) :={
(w,y)∈W ×Y :w>wac(θ, γ,α), y≤min(yda(θ, γ,α,w), yba(γ,w)
)},
B(θ, γ,α) :={
(w,y)∈W ×Y :w>wbd(θ, γ,α), y > yba(γ,w)},
C(θ, γ,α) :={
(w,y)∈W ×Y :w≤wac(θ, γ,α), y≤ ydc(θ, γ,α,w)},
D(θ, γ,α) :={
(w,y)∈W ×Y :w≤wbd(θ, γ,α), y >max(ydc(θ, γ,α,w), yda(θ, γ,α,w)
)},
characterizes the distributor’s optimal strategy. Namely, if (w,y) ∈ A(θ, γ,α) (or B(θ, γ,α),
C(θ, γ,α), D(θ, γ,α), respectively), then the dominant distributor’s strategy is (a) (or (b), (c), (d),
respectively).
In particular, Lemma 1 implies that increasing the salvage value y can only lead to three possible
transitions: from strategy (c) to strategy (d), from strategy (a) to strategy (d), or from strategy
(a) to strategy (b), see Figure 4 for an illustration.We emphasize that the horizontal axis in Figure
6 starts at .6 and not at the origin. Recall, from the discussion in Section 4.2, that strategies (b)
and (d) induce more product adoptions than strategies (a) and (c), respectively. Similarly, in Table
2 we observe that these transitions always result in lower or equal prices to the consumers. Hence,
from Lemma 1 we conclude that in our model for a BOP market increasing the salvage value
can only result in lower equilibrium prices to consumers and higher adoption levels. In particular,
comparing Figures 4a and 4b shows that this insight is preserved for different values of the BOP
purchasing cost parameter α, as well as illustrating its effect on the distributor’s strategy map.
Calmon, Jue-Rajasingh, Romero, Stenson: Consumer Education and Reverse Logistics in the Base of the Pyramid22 Working Paper - February 2017
In contrast, increasing the consumer education level θ can lead to transitions from strategy (d)
to strategy (b) when the salvage value is already high, i.e. to higher prices to the consumer and
lower adoptions. In fact, as illustrated by Figure 7b in Appendix C, this is the case for the instance
considered in Figures 3 and 4.
Additionally, Lemma 1 implies Corollary 1 in Appendix A. Corollary 1 shows that selecting a
low-cost product with a low enough salvage value ((w1, y1) in Corollary 1) leads the distributor
to implement strategy (a), i.e. target high willingness to pay consumers with no refunds, result-
ing in a high price, low product adoptions, and no profits for the retailer. Interestingly, a more
expensive product with high enough service level ((w2, y2) in Corollary 1) leads the distributor to
implement strategy (d), i.e. target low willingness to pay consumers with partial refunds, resulting
in a lower price, higher product adoptions, and positive retailer profits (see Table 2). Moreover,
these improvements can be attained while simultaneously obtaining a better distributor’s objective
value. An example of values (w1, y1) and (w2, y2) is illustrated by the arrow depicted in Figure 4a.
In other words, Corollary 1 provides an interesting insight on product selection to increase the
impact of new life-improving technologies in BOP markets. Specifically, more expensive products
with better salvage values can Pareto-dominate low-cost products with small salvage values. Namely,
the former can simultaneously lead to lower prices to consumers, more product adoptions, more
retailer profits, and better distributor objective value than the latter.
To summarize, the results in this section suggest that selecting products with higher salvage
value, or investing in improving the salvage value of existing products, is an alternative strategy
to improving consumer education when aiming to increase product adoptions at the BOP. This
insight can be valuable to international donors looking for ways to intervene BOP markets with
the objective of increasing the adoption levels of life-improving technologies.
5. Benchmark: Analysis of a Developed Market
In this section, we study the insights provided by our model in distributing a push-product in a
developed market. This is not the main motivation of our paper, thus it is intended mostly as a
benchmark to compare the results we obtained for a BOP market in Section 4.
Accordingly, the structure of this section follows the one in Section 4. Namely, we first discuss the
assumptions that represent a developed market in our model and we characterize the equilibrium
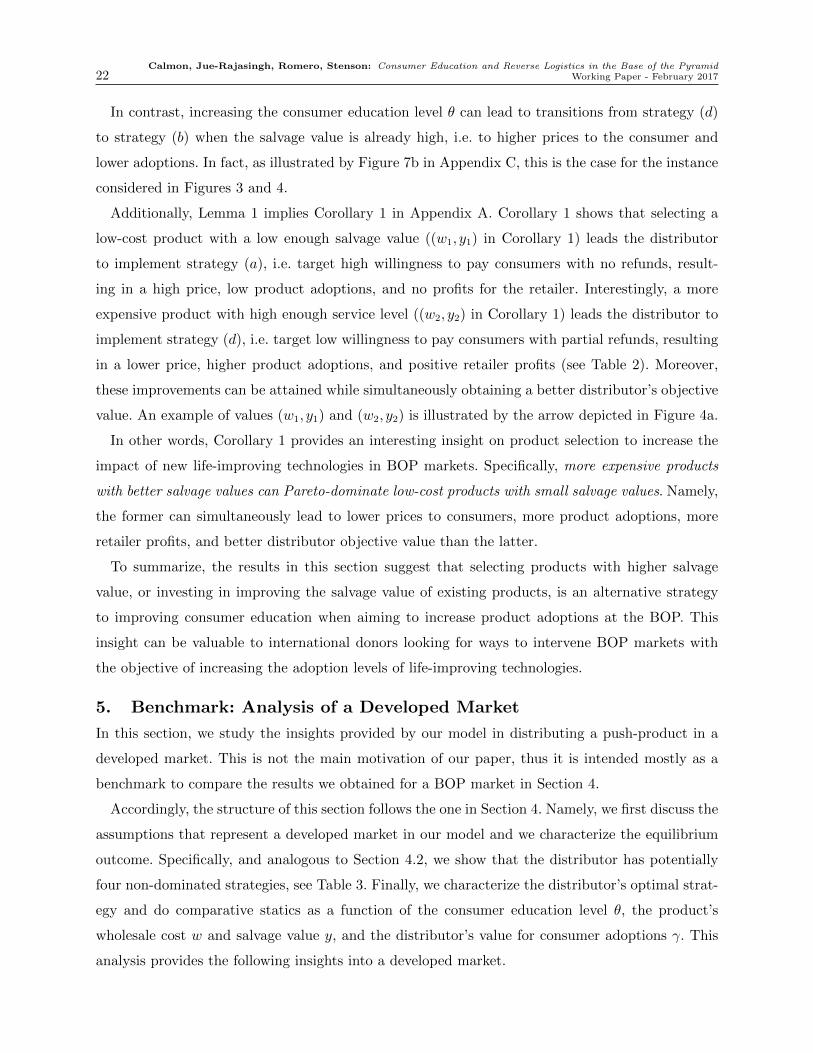
outcome. Specifically, and analogous to Section 4.2, we show that the distributor has potentially
four non-dominated strategies, see Table 3. Finally, we characterize the distributor’s optimal strat-
egy and do comparative statics as a function of the consumer education level θ, the product’s
wholesale cost w and salvage value y, and the distributor’s value for consumer adoptions γ. This
analysis provides the following insights into a developed market.
Calmon, Jue-Rajasingh, Romero, Stenson: Consumer Education and Reverse Logistics in the Base of the PyramidWorking Paper - February 2017 23
Distributor’s Refund Policy
Minimum Refunds Partial/Full Refunds
Retailer’s
Target
Market
Informed Consumers with
High Willingness to Pay(a) (b)
Informed Consumers with
Low Willingness to Pay(c) (d)
Strategy p r P(B(p, r)|θ) P(R(p, r)|θ) P(A(p, r)|θ)(a) vh y θβh 0 θβh
(b) vh vh θβh + (1− θ) (1− θ)(1−βh) βh
(c) vl y θ(βl +βh) 0 θ(βh +βl)
(d) vl rl θ(βl +βh) + (1− θ) (1− θ)β0 βl +βhTable 3 Summary of the distributor’s non-dominated strategies for a developed market
• Analogous to a BOP market, we show that in a developed market increasing the salvage
value y can only benefit the distributor, while increasing the consumer education level θ may
actually be detrimental if the salvage value is already high enough.
• However, in contrast to a BOP market, we show that in a developed market a larger distrib-
utor’s value for product adoptions γ makes increasing the consumer education level θ more
likely to be detrimental to the distributor.
• Finally, in contrast to a BOP market, we show that in a developed market increasing the
salvage value may result in higher equilibrium prices to consumers and less product adoptions.
This is also the case when increasing the consumer education level.
5.1. Preliminaries and Distributor’s Optimal Strategy
We assume that consumers in a developed market do not face extreme financial distress. Hence,
we set α= 0 (i.e., the purchasing cost is simply equal to the price). In other words, we assume that
there are no BOP consumers in developed markets. Note that this violates Assumptions 2 and 3;
therefore, we drop these assumptions. The justification of the value for product adoptions γ in a
developed market is not necessarily related to a social mission of the distributor, but rather to the
distributor valuing increasing its market share in addition to its short term profits.
The distributor’s optimal strategy in a developed market is characterized in Theorem 4 in
Appendix B. Note that it has a similar structure to the distributor’s optimal strategy in BOP
markets from Theorem 3, with some notable differences that we discuss next.
First, an immediate consequence of having α= 0 is that the high and low willingness to pay in
a developed market are vh and vl, respectively. In particular, the willingness to pay and product
valuation of informed consumers have the same order in a developed market, whereas we assumed

Calmon, Jue-Rajasingh, Romero, Stenson: Consumer Education and Reverse Logistics in the Base of the Pyramid24 Working Paper - February 2017
they were in reverse order in BOP markets in Section 4 (see Assumption 2). This feature can be
observed by comparing the prices charged by the retailer in a BOP market with the ones charged
in a developed market (see Tables 2 and 3).
Second, an important qualitative difference is that in our model for developed markets, unin-
formed consumers have a unique willingness to pay ET [max(vT , r)], whereas in Section 4 the will-
ingness to pay of uninformed customers was lower for BOP consumers compared to non-BOP
consumers. In fact, in Section 4 we assumed that refunds could only profitably impact uninformed
non-BOP consumers (see Figure 1). This feature can be observed by comparing strategies (b) and
(d) across Tables 2 and 3, and noticing that refunds in a developed market drive an additional
demand given by a fraction (1−θ) of the consumers, while in a BOP market we assumed that they
only impact a fraction (1− θ)(1−βh) of the consumers. Intuitively, this should make refunds more
attractive for the distributor in a developed market compared to a BOP market, since the fraction
of consumers that she can impact with them is larger.
Finally, in developed markets it is still optimal for the distributor to pool the willingness to pay of
uninformed consumers with one of the classes of informed consumers. This implies offering refunds
such that the willingness to pay of uninformed consumers matches either vl or vh. However, in order
to match the high valuation vh, the retailer must offer full refunds as opposed to partial refunds
(i.e., set r= vh when p= vh; see strategy (b) in Table 3). This is a minor qualitative difference that
does not impact our main insights.
5.2. Comparative Statics in a Developed Market
We now present the main results in this section. All the proofs are provided in the Appendix B.
Theorem 2 characterizes the effect of increasing the product’s salvage value y and the consumer
education level θ on the distributor’s optimal objective.
Theorem 2. Under Assumption 1 and assuming y ≤ rl, increasing the salvage value never
decreases the distributor’s objective value. Namely, let Π∗D be the distributor’s optimal objective
value, then∂Π∗
D
∂y≥ 0.
Moreover, increasing the consumer education level might decrease the distributor’s objective value.
Namely, for each θ ∈ [0,1) there exists a value γ(θ) such that, for each distributor’s value for
consumer adoptions γ ≥ γ(θ), there exists a threshold on the salvage value y(γ, θ,w) such that
∂Π∗D
∂θ≥ 0 for each y≤ y(γ, θ,w),
∂Π∗D
∂θ< 0 for each y > y(γ, θ,w).
Moreover, the threshold y(γ, θ,w) decreases with γ. Namely, ∂y(γ,θ,w)
∂γ≤ 0 for each γ ≥ γ(θ).
Theorem 2 shows that, analogous to BOP markets, increasing the salvage value y can only
improve the distributor’s optimal objective value. On the other hand, increasing the consumer
Calmon, Jue-Rajasingh, Romero, Stenson: Consumer Education and Reverse Logistics in the Base of the PyramidWorking Paper - February 2017 25
0.04
0.08
0.12
0.16
0.0 0.2 0.4 0.6 0.8
y
Π∗ D
θ
0.1
0.3
0.5
0.7
0.9
(a) γ = 0.1
0.05
0.10
0.15
0.20
0.0 0.2 0.4 0.6 0.8
y
Π∗ D
θ
0.1
0.3
0.5
0.7
0.9
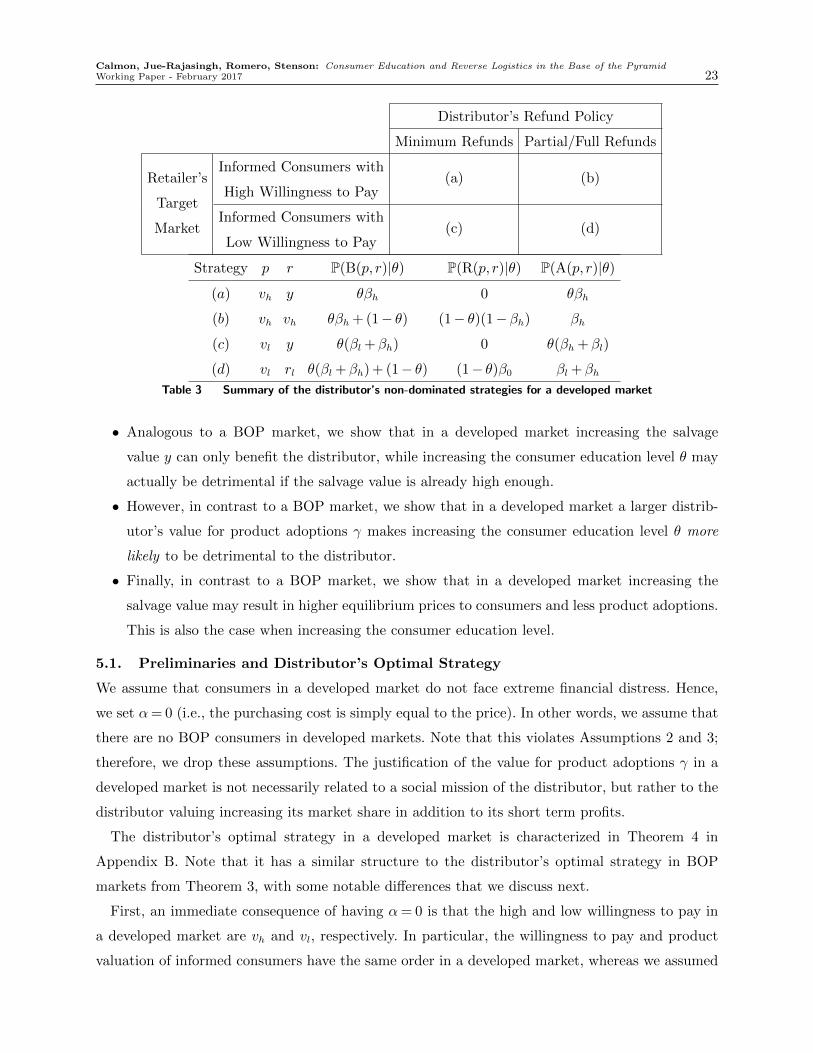
(b) γ = 0.2Figure 5 Distributor’s profits for different salvage values y and consumer education level θ.
We assume vh = 1, vl = 0.9, w= 0.8, β0 = βh = 0.35, and βl = 0.3.
education level θ may actually reduce the optimal distributor’s objective value if the salvage value
is already high enough. However, in contrast to BOP markets, Theorem 2 also shows that a larger
distributor’s value for product adoptions γ makes increasing the consumer education level more
likely to be detrimental to the distributor in a developed market. Namely, the set of values of
consumer education level and product’s salvage value (θ, y) such that increasing θ is beneficial to
the distributor becomes smaller as we increase the value for product adoptions γ. Thus, the more
the distributor values increasing its market share over its short-term profits, the more likely it is
that improving the consumer education level in the market will be detrimental. This insight is
illustrated by comparing Figures 5a and 5b.
This also serves as a cautionary tale for social enterprises in the BOP that look at their coun-
terparts in the developed world for operations strategy best practices. The fact that, in the BOP,
consumers face financial distress directly impacts the relative value of different operational strate-
gies and the equilibrium performance of supply chains. Hence, not all best practices in developed
markets translate directly to the BOP added this,
needs to be
improved.
added this,
needs to be
improved.
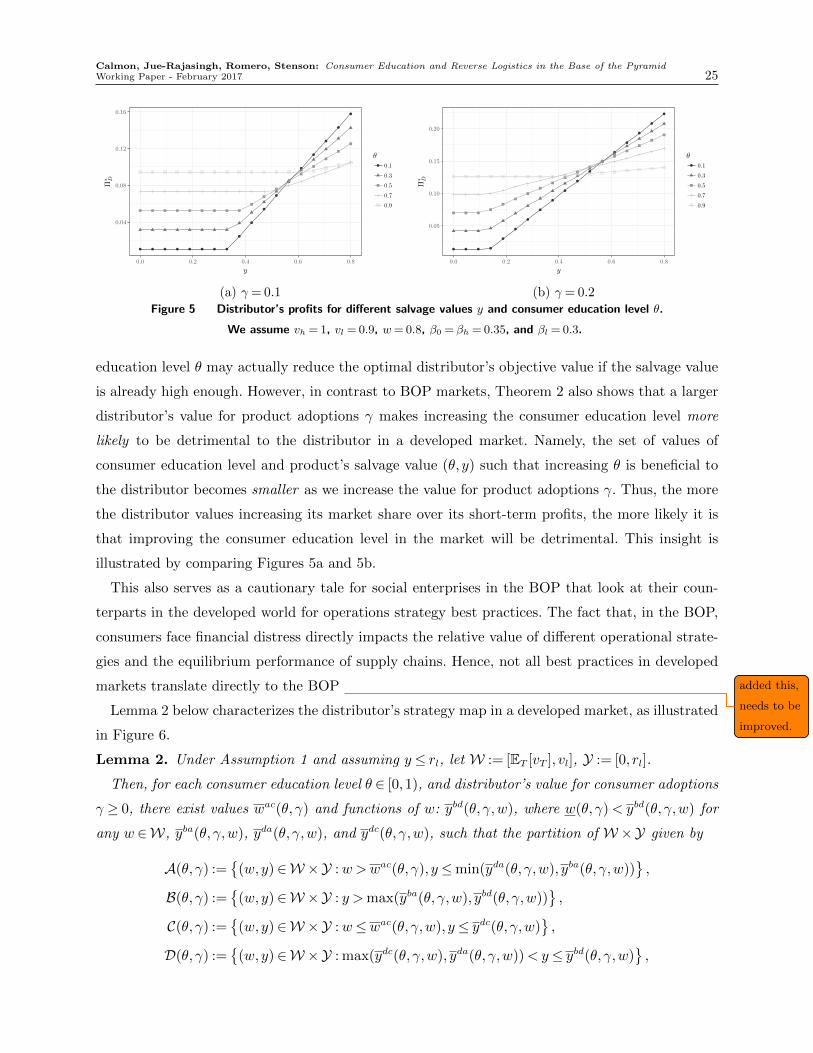
Lemma 2 below characterizes the distributor’s strategy map in a developed market, as illustrated
in Figure 6.
Lemma 2. Under Assumption 1 and assuming y≤ rl, let W := [ET [vT ], vl], Y := [0, rl].
Then, for each consumer education level θ ∈ [0,1), and distributor’s value for consumer adoptions
γ ≥ 0, there exist values wac(θ, γ) and functions of w: ybd(θ, γ,w), where w(θ, γ)< ybd(θ, γ,w) for
any w ∈W, yba(θ, γ,w), yda(θ, γ,w), and ydc(θ, γ,w), such that the partition of W×Y given by
A(θ, γ) :={
(w,y)∈W ×Y :w>wac(θ, γ), y≤min(yda(θ, γ,w), yba(θ, γ,w))},
B(θ, γ) :={
(w,y)∈W ×Y : y >max(yba(θ, γ,w), ybd(θ, γ,w))},
C(θ, γ) :={
(w,y)∈W ×Y :w≤wac(θ, γ,w), y≤ ydc(θ, γ,w)},
D(θ, γ) :={
(w,y)∈W ×Y : max(ydc(θ, γ,w), yda(θ, γ,w))< y≤ ybd(θ, γ,w)},
Calmon, Jue-Rajasingh, Romero, Stenson: Consumer Education and Reverse Logistics in the Base of the Pyramid26 Working Paper - February 2017
0.0
0.2
0.4
0.6
0.700 0.725 0.750 0.775 0.800
w
y
Strategy
a
b
d
Figure 6 Distributor’s optimal strategy in a developed market for different salvage values y and wholesale
prices w. We assume vh = 1, vl = 0.9, w= 0.8, γ = 0.1, β0 = βh = 0.35, and βl = 0.3.
characterizes the distributor’s optimal strategy. Namely, if (w,y) ∈ A(θ, γ) (or B(θ, γ), C(θ, γ),
D(θ, γ), respectively), then the dominant distributor’s strategy is (a) (or (b), (c), (d), respectively).
In contrast to Lemma 1 for BOP markets, Lemma 2 implies that increasing the salvage value y
can lead to transitioning from strategy (d) to strategy (b) in developed markets. This is illustrated
in Figure 6. Recall, from Table 3, that this transition leads to a higher price to the consumer and less
product adoptions. Namely, although Theorem 2 shows that increasing the salvage value can only
benefit the distributor, Lemma 2 emphasizes that this optimal objective value improvement can be
at the expense of the consumers and the retailer. In other words, in developed markets, increasing
the salvage value may not lead to a Pareto-improvement in the supply chain performance. We
emphasize that the horizontal axis in Figure 6 starts at .7 and not at the origin. Moreover, strategy
(c) is not included in Figure 6, this is the case since this strategy is optimal for the distributor only
when the consumer valuations vh and vl are very close to each other.
A similar observation can be made about increasing the consumer education level θ. Namely,
increasing θ can also lead to transitions from strategy (d) to strategy (b) when the salvage value is
already high, i.e. to higher prices to the consumer and lower adoptions. Recall that, as discussed
in Section 4.3, this was also true in BOP markets.
6. Conclusions
We propose a model that allows us to compare the challenges faced by distributors of innovate
durable goods in supply chains that serve the BOP with the challenges faced by their developed
market counterparts. Through this model, we show that increasing the salvage value of these
products through better reverse logistics can only benefit the distributor. In contrast, adding more
consumer education may actually be detrimental if the product’s salvage value is already high
Calmon, Jue-Rajasingh, Romero, Stenson: Consumer Education and Reverse Logistics in the Base of the PyramidWorking Paper - February 2017 27
enough. This effect is weakened (strengthened) in BOP (developed) markets if the distributor
highly values product adoptions compared to its short term profits.
Moreover, in BOP markets, more expensive products with high enough salvage value Pareto-
dominate low-cost products with a small salvage value in terms of supply-chain performance.
Specifically, the former lead to better distributor’s objective value, higher retailer’s profit, more
product adoptions, and higher consumer surplus. In contrast, this is not the case in developed
markets, where the retailer and consumers may be worse-off when the distributor improves its
reverse logistics to increase the salvage value of its products.
This insight is important for social enterprises that are trying to distribute life-improving prod-
ucts in developing countries. From the authors’ experience, there is little thought given to the
importance of reverse logistics and and its relationship with a product’s salvage value. Most invest-
ments, especially in small social enterprise start-ups, are directed towards marketing and education.
Our analysis suggests that this is not necessarily the best strategy. Moreover, investing in reverse
logistics is an effective strategy when the goal is to increase the number of product adoptions.
Identifying and developing effective reverse logistics and marketing strategies for social enter-
prises in the real-world can have a profound impact in the way new technologies are disseminated
in these challenging environments. Furthermore, we believe that social enterprises that are trying
to scale and be financially sustainable in the developing world can be a rich source of interest-
ing Operations Management research questions. Many of these companies are attempting to align
profit, technology, and positive social and environmental impact. The expansion, analysis, and
optimization of their operations can be a valuable source of new operational models.
References
Atasu A, Sarvary M, Van Wassenhove LN (2008) Remanufacturing as a marketing strategy. Management
science 54(10):1731–1746.
Austin J, Stevenson H, Wei-Skillern J (2006) Social and commercial entrepreneurship: same, different, or
both? Entrepreneurship theory and practice 30(1):1–22.
Bertsekas DP, Tsitsiklis JN (2002) Introduction to probability, volume 1 (Athena Scientific Belmont, MA).
Bezanson J, Karpinski S, Shah VB, Edelman A (2012) Julia: A fast dynamic language for technical comput-
ing. arXiv preprint arXiv:1209.5145 .
Brine D, Frey D, Goentzel J, Graves S, Green J, Montgomery B, Sanyal B, de Weck O (2015) Experimen-
tation in product evaluation: The case of solar lanterns in uganda, africa. Comprehensive Initiative on
Technology Evaluation (CITE) .
Bulow JI, Geanakoplos JD, Klemperer PD (1985) Multimarket oligopoly: Strategic substitutes and comple-
ments. Journal of Political economy 93(3):488–511.
Calmon, Jue-Rajasingh, Romero, Stenson: Consumer Education and Reverse Logistics in the Base of the Pyramid28 Working Paper - February 2017
Calmon AP, Graves SC (2016) Inventory Management in a Consumer Electronics Closed-Loop Supply Chain.
SSRN Scholarly Paper ID 2622405, Social Science Research Network, Rochester, NY, URL https:
//papers.ssrn.com/abstract=2622405.
Costello A (2010) Troubled Water. URL http://www.pbs.org/frontlineworld/stories/
southernafrica904/video_index.html.
Dees JG (1994) Social enterprise: Private initiatives for the common good (Harvard Business School).
Essmart (2018) Life improving technologies catalogue URL http://www.essmart-global.com/.
Global Alliance for Clean Cookstoves (2016) Demand creation. URL http://cleancookstoves.org/
market-development/demand-creation/.
Guide VDR, Van Wassenhove LN (2009) OR FORUM:The Evolution of Closed-Loop Supply Chain Research.
Operations Research 57(1):10–18, ISSN 0030-364X, 1526-5463.
IEA (2015) 2015 world energy outlook. International Energy Agency .
Jue DM (2012) From the lab to the land : social impact technology dissemination in rural southern India.
Thesis, Massachusetts Institute of Technology.
Kohli R, Bhagwati J (2011) Organized retailing in india: Issues and outlook. Columbia Business School
Research Paper (12/25).
Kumar S (2007) Connective technologies in the supply chain (CRC Press).
Lee HL, Tang CS (2017) Socially and environmentally responsible value chain innovations: New operations
management research opportunities. Management Science .
Madaan K (2009) Fundamentals of retailing (Tata McGraw-Hill Education).
Mair J, Marti I (2006) Social entrepreneurship research: A source of explanation, prediction, and delight.
Journal of world business 41(1):36–44.
Martin RL, Osberg S (2007) Social entrepreneurship: The case for definition. Stanford social innovation
review 5(2):28–39.
McMullen JS (2011) Delineating the domain of development entrepreneurship: a market-based approach to
facilitating inclusive economic growth. Entrepreneurship Theory and Practice 35(1):185–193.
Miller TL, Grimes MG, McMullen JS, Vogus TJ (2012) Venturing for others with heart and head: How
compassion encourages social entrepreneurship. Academy of management review 37(4):616–640.
Palit D (2013) Solar energy programs for rural electrification: Experiences and lessons from south asia.
Energy for Sustainable Development 17(3):270–279.
Pince C, Ferguson M, Toktay B (2016) Extracting Maximum Value from Consumer Returns: Allocating
Between Remarketing and Refurbishing for Warranty Claims. Manufacturing & Service Operations
Management ISSN 1523-4614.
Calmon, Jue-Rajasingh, Romero, Stenson: Consumer Education and Reverse Logistics in the Base of the PyramidWorking Paper - February 2017 29
Polak P (2008) Out of poverty (Berrett-Cochler Publishers Inc).
Polak P (2010) Death of appropriate technology ii : How to design for the market. URL http://www.
paulpolak.com/design-for-the-market/.
Prahalad CK (2006) The Fortune at the Bottom of the Pyramid (Pearson Prentice Hall), ISBN 978-0-13-
187729-0.
Proctor K (2013) Solar energy: African economies’ secret weapon. URL http://fortune.com/2013/06/25/
solar-energy-african-economies-secret-weapon/.
Purvis K (2015) Access to clean water and sanitation around the world – mapped. The Guardian .
Sagawa S, Segal E (2000) Common interest, common good: Creating value through business and social sector
partnerships. California Management Review 42(2):105–122.
Schumacher EF (1970) Small is beautiful: A study of economics as if people mattered (Blond & Briggs).
Shukla S, Bairiganjan S (2011) The base of pyramid distribution challenge. Centre for Development Finance,
Chennai .
Shulman JD, Coughlan AT, Savaskan RC (2009) Optimal restocking fees and information provision in an
integrated demand-supply model of product returns. Manufacturing & Service Operations Management
11(4):577–594.
Smith CE (2007) Design for the Other 90% (New York: Smithsonian, Cooper-Hewitt, National Design
Museum. Assouline Publishing).
Sodhi MS, Tang CS (2016) Supply chain opportunities at the bottom of the pyramid. Decision 43(2):125–134.
Sodhi MS, Tang CS (2017) Social responsibility in supply chains. Sustainable Supply Chains, 465–483
(Springer International Publishing).
Su X (2009) Consumer returns policies and supply chain performance. Manufacturing & Service Operations
Management 11(4):595–612.
Taylor T, Xiao W (2016) Donor product-subsidies to increase consumption: Implications of consumer aware-
ness and profit-maximizing intermediaries .
Vidal J (2013) India’s villagers reap visible benefits from solar electricity scheme. The Guardian .
Webb JW, Kistruck GM, Ireland RD, Ketchen Jr DJ (2010) The entrepreneurship process in base of the pyra-
mid markets: The case of multinational enterprise/nongovernment organization alliances. Entrepreneur-
ship Theory and Practice 34(3):555–581.
Wijayatunga PD, Attalage RA (2005) Socio-economic impact of solar home systems in rural sri lanka: a
case-study. Energy for Sustainable Development 9(2):5–9.
World Health Organization (2016) Burning opportunity: clean household energy for health, sustainable
development, and well-being of women and children. Technical report, World Health Organization.
Calmon, Jue-Rajasingh, Romero, Stenson: Consumer Education and Reverse Logistics in the Base of the Pyramid30 Working Paper - February 2017
Yunus M (2007) Creating a World Without Poverty: Social Business and the Future of Capitalism (Public
Affairs), reprint edition edition.
Appendix A: Appendix for Section 4
In this section we re-state and prove the results discussed in Section 4.
Theorem 3. Under Assumptions 1-3, and for any consumer education level θ ∈ [0,1), the distributor’s
optimal objective is
Π∗D = max{
ΠaD,Π
bD,Π
cD,Π
dD
}. (4)
Where each component in the max corresponds to a different non-dominated strategy. Specifically, strategies
(a), (b), (c), and (d) are characterized by:
(a) Target product adoptions from informed consumers with high willingness to pay, with minimum refunds.
In this case, pa = vl, ra = y, ca = vl, Πa
R = 0, ΠaD = (vl−w+ γ)θβl.
(b) Target product adoptions from consumers with low valuation, with partial refunds. In this case, pb = vl,
rb = rl, cb = vl, Πb
R = 0, ΠbD = (vl−w+ γ)βl + (1− θ)((vh− vl)βh− (w− y)β0).
(c) Target product adoptions from informed consumers with high and low willingness to pay, with minimum
refunds. In this case, pc = vh1+α
, rc = y, cc = vh1+α− βl
βh
(vl− vh
1+α
), Πc
R =(vl− vh
1+α
)θβl
(1 + βl
βh
), Πc
D =(vh
1+α−w+ γ
)θ(βh +βl)−
(vl− vh
1+α
)θβl
(1 + βl
βh
).
(d) Target product adoptions from consumers with low valuation and informed consumers with high val-
uation, with partial refunds. In this case, pd = vh1+α
, rd = rα, cd = vh1+α−(vl− vh
1+α
)θβl
θβh+(1−θ)(1−βh),
ΠdR =
(vl− vh
1+α
)θβl
(1 + θβl
θβh+(1−θ)(1−βh)
),
ΠdD =
(vh
1 +α−w+ γ
)(βl + θβh)−
(vl−
vh1 +α
)θβl
(1 +
θβlθβh + (1− θ)(1−βh)
)+ (1− θ)
((vh− vl)βh− (w− y)β0 +
(vl−
vh1 +α
)(βh +βl)
).
Proof. From Assumptions 1 and 3 it follows that the optimal retailer’s price p∗ is such that p∗ ∈{vh
1+α, vl,ET [max(vT , r)]
}. Moreover, from Assumption 2 we have vh
1+α< vl.
Let
ΠR (vl, r, c) = (vl− c) (θβl + (1− θ)(1−βh)1{r≥rl}) ,
ΠR
(vh
1 +α, r, c
)=
(vh
1 +α− c)
(θ(βl +βh) + (1− θ)(1−βh)1{r≥rα}) ,
ΠR (ET [max(vT , r)], r, c) = (ET [max(vT , r)]− c) (θ (βh1{r≤rα}+βl1{r≤rl}) + (1− θ)(1−βh)) .
Assume first that the distributor is interested in inducing the retailer to charge the highest possible price
p∗ = vl. In this case, the distributor’s problem can be written as
maxc,r
(c−w+ γ) (θβl + (1− θ)(1−βh)1{r≥rl})− (r− y+ γ)(1− θ) (β01{r≤vl})1{r≥rl}
s.t. ΠR (vl, r, c)≥max
(ΠR
(vh
1 +α, r, c
),ΠR (ET [max(vT , r)], r, c)
)(IC)
ΠR (vl, r, c)≥ 0 (IR)
r ∈ [y, vl].
Calmon, Jue-Rajasingh, Romero, Stenson: Consumer Education and Reverse Logistics in the Base of the PyramidWorking Paper - February 2017 31
The objective is strictly increasing in c, with an upper bound c≤ vl given by the (IR) constraint. Hence,
c∗ = vl. Additionally, the objective is linear decreasing in r with an increasing step at rl, therefore r∗ ∈ {y, rl}.These correspond to strategies (a) and (b) in the Theorem, respectively. The feasibility of strategy (b) is
guaranteed by Assumption 3.
Now assume that the distributor is interested in inducing the retailer to charge the price p∗ = vh1+α
. In this
case, the distributor’s problem can be written as
maxc,r
(c−w+ γ) (θ(βl +βh) + (1− θ)(1−βh)1{r≥rα})− (r− y+ γ)(1− θ) (β01{r≤vl})1{r≥rα}
s.t. ΠR
(vh
1 +α, r, c
)≥max (ΠR (vl, r, c) ,ΠR (ET [max(vT , r)], r, c)) (IC)
ΠR
(vh
1 +α, r, c
)≥ 0 (IR)
r ∈[y,
vh1 +α
].
The objective is linear decreasing in r with an increasing step at rα, therefore r∗ ∈ {y, rα}. The feasibility
of r∗ ∈ {y, rα} is easy to check. Therefore, the objective is strictly increasing in c, with an upper bound
c≤ vh1+α−(vl− vh
1+α
)θβl
θβh+(1−θ)(1−βh)1{r≥rα}given by the (IC) constraint. These correspond to strategies (c)
and (d) in the Theorem, respectively. The feasibility of strategy (d) is guaranteed by Assumption 3.
Finally, assume that the distributor is interested in inducing the retailer to charge the price p∗ =
ET [max(vT , r)]. In this case, the distributor’s problem can be written as
maxc,r
(c−w+ γ) (θ (βh1{r≤rα}+βl1{r≤rl}) + (1− θ)(1−βh))− (r− y+ γ)(1− θ) (β01{r≤vl})
s.t. ΠR (ET [max(vT , r)], r, c)≥max
(ΠR (vl, r, c) ,ΠR
(vh
1 +α, r, c
))(IC)
ΠR (ET [max(vT , r)], r, c)≥ 0 (IR)
r ∈ [y,ET [max(vT , r)]].
The objective is linear decreasing in r with an increasing step at rα and rl, therefore r∗ ∈ {y, rα, rl}. The
feasibility of r∗ ∈ {y, rα, rl} is easy to check. This leads to one of the four cases analyzed before. �
Theorem 1. Under Assumptions 1-3, increasing the salvage value y can only increase the distributor’s
objective value. Namely, let Π∗D be the distributor’s optimal objective value, then∂Π∗D∂y≥ 0.
On the other hand, increasing the consumer education level θ might decrease the distributor’s objective
value. Specifically, for each θ ∈ [0,1) and BOP purchasing cost parameter α, there exists a value γ(θ,α) such
that, for each distributor’s value for consumer adoptions γ ≥ γ(θ,α), there exists a threshold on the salvage
value y(γ, θ,α,w) such that
∂Π∗D∂θ≥ 0 for each y≤ y(γ, θ,α,w),
∂Π∗D∂θ
< 0 for each y > y(γ, θ,α,w).
The threshold y(γ, θ,α,w) can increase or decrease with γ depending on the specific instance. However,
for a large enough value of γ it must be the case that it increases, i.e. ∂y(γ,θ,α,w)
∂γ> 0 for large γ, making
increasing the consumer education level more likely to improve the distributor’s optimal objective value.

Calmon, Jue-Rajasingh, Romero, Stenson: Consumer Education and Reverse Logistics in the Base of the Pyramid32 Working Paper - February 2017
Proof. From Theorem 3 we have
Π∗D = max{
ΠaD,Π
bD,Π
cD,Π
dD
},
where each of the four strategies is detailed in the statement of Theorem 3, while Table 2 summarizes them.
For the first statement in the theorem, note that∂ΠaD∂y
=∂ΠcD∂y
= 0. While∂ΠbD∂y
=∂ΠdD∂y
= (1−θ)β0 ≥ 0. Hence,∂Π∗D∂y≥ 0.
For the second and third statements in the theorem, consider any fixed information level θ ∈ [0,1). We will
define γ(θ,α) to be the smallest value for consumer adoptions such that the distributor chooses strategy (d)
when the salvage value attains its upper bound, i.e. when y= min{rα,w} (the first term in the upper bound
follows from Assumption 3). Additionally, we will define y(γ, θ,α,w) to be the smallest salvage value such
that the distributor chooses strategy (d) and increasing the information level reduces her objective value.
We consider the case when min{rα,w}= rα. The case where w≤ rα is analogous.
We start by defining γ(θ,α) by construction. Note that if y = rα, then strategy (d) dominates strategy
(c) since in this case ΠdD − Πc
D = (1 − θ)((
vh1+α−w
)(1−βh) + γβl
)+(vl− vh
1+α
)θβlβh
(1−θ)(1−βh)βlθβh+(1−θ)(1−βh)
≥ 0.
Additionally, let γdi(θ) be such that ΠdD = Πi
D when y= rα, for each i∈ {a, b}. Namely,
γda(θ,α) =
(vl−
vh1 +α
)θβl
(1− θ)βl + θβh
(2 +
θβlθβh + (1− θ)(1−βh)
)−(
vh1 +α
−w)
(1− θ)(1−βh) + θβh(1− θ)βl + θβh
,
and
γdb(θ,α) =
(vl−
vh1 +α
)βlβh
(2 +
θβlθβh + (1− θ)(1−βh)
− (1− θ)βhθβl
)−(
vh1 +α
−w).
Let
γ(θ,α) = max{γda(θ,α), γdb(θ,α)}. (5)
Note that by construction Π∗D = ΠdD when y= rα and γ = γ(θ,α). Moreover, Π∗D = Πd
D when y= rα for each
γ ≥ γ(θ,α), since∂ΠdD∂γ
= βl + θβh ≥maxi∈{a,b,c}
{∂ΠiD∂γ
}. Specifically, recall that
∂ΠaD∂γ
= θβl,∂ΠbD∂γ
= βl, and∂ΠcD∂γ
= θ(βh +βl).
We now define y(γ, θ,α) by construction. First, note that from∂ΠdD∂y
=∂ΠbD∂y
it follows that strategy (d)
dominates strategy (b) for each γ ≥ γ(θ) and any salvage value, i.e. ΠdD ≥ Πb
D for each γ ≥ γ(θ,α) and
y ∈ [0, rα]. On the other hand, for each γ ≥ γ(θ,α) strategies (a) and (c) dominate strategy (d) for small
enough salvage value. In fact, let ydi(γ, θ,α,w) be such that ΠdD = Πi
D for each i∈ {a, b}. Namely,
yda(γ, θ,α,w) =rα + γ−(
vh1 +α
−w+ γ
)θβh + (1− θ)(1−βh)
(1− θ)β0
+
(vl−
vh1 +α
)θβl
(1− θ)β0
(2 +
θβlθβh + (1− θ)(1−βh)
),
and
ydc(γ, θ,α,w) = rα + γ−(
vh1 +α
−w+ γ
)1−βhβ0
−(vl−
vh1 +α
)1−βhβ0
θβlθβh + (1− θ)(1−βh)
βlβh.
Note that by construction Π∗D = ΠdD for any γ ≥ γ(θ,α) and y≥max{yda(γ, θ,α,w), ydc(γ, θ,α,w)}. Moreover,
∂yda(γ,θ,α,w)
∂γ=− θβh+(1−θ)βl
(1−θ)β0< 0, and ∂ydc(γ,θ,α,w)
∂γ=− βl
β0< 0.
Finally, note that increasing the information level θ is always beneficial for the distributor when fol-
lowing strategies (a) and (c). Specifically,∂ΠaD∂θ
= (vl −w+ γ)βl > 0, and∂ΠcD∂θ
=(
vh1+α−w+ γ
)(βh + βl)−
Calmon, Jue-Rajasingh, Romero, Stenson: Consumer Education and Reverse Logistics in the Base of the PyramidWorking Paper - February 2017 33(vl− vh
1+α
)βl
(1 + βl
βh
)≥ 0. The latter inequality holds in equilibrium since otherwise the distributor would
derive a negative utility from implementing strategy (c), and she would default to an equilibrium with no
sales instead.
In contrast, increasing the information level θ can lead to a lower distributor’s utility when following
strategy (d) in instances where the salvage value is large enough. Specifically,∂ΠdD∂θ≥ 0 if and only if y ≤
yd(γ, θ,α), where
yd(γ, θ,α,w) =rα + γ+
(vh
1 +α−w+ γ
)βh−β0
β0
−(vl−
vh1 +α
)βlβ0
(1 +
θβlθβh + (1− θ)(1−βh)
(1 +
1−βhθβh + (1− θ)(1−βh)
)).
Note that ∂yd(γ,θ,α,w)
∂γ= βh
β0≥ 0.
To conclude, let
y(γ, θ,α,w) = max{yda(γ, θ,α,w), ydc(γ, θ,α,w), yd(γ, θ,α,w)}. (6)
Note that by construction∂Π∗D∂θ≥ 0 for each y≤ y(γ, θ,α,w),
∂Π∗E∂θ
=∂ΠdD∂θ
< 0 for each y > y(γ, θ,α,w).
Moreover, ∂y(γ,θ,α)
∂γ< 0 if the maximum in equation (6) is attained by yda(γ, θ,α) or ydc(γ, θ,α), and
∂y(γ,θ,α)
∂γ> 0 if the maximum in equation (6) is attained by yd(γ, θ,α). Therefore, for a large enough value of
γ we have y(γ, θ,α) = yd(γ, θ,α), making increasing θ more likely to be beneficial. �
Lemma 1. Under Assumptions 1-3, let W :=[ET [vT ], vh
1+α
], Y := [0, rα].
Then, for each consumer education level θ ∈ [0,1), distributor’s value for consumer adoptions γ ≥ 0,
and BOP purchasing cost parameter α, there exist values wac(θ, γ,α) and wbd(θ, γ,α), where wac(θ, γ,α)<
wbd(θ, γ,α), and functions of w: yba(γ,w), yda(θ, γ,α,w), and ydc(θ, γ,α,w), such that the partition ofW×Ygiven by
A(θ, γ,α) :={
(w,y)∈W ×Y :w>wac(θ, γ,α), y≤min(yda(θ, γ,α,w), yba(γ,w)
)},
B(θ, γ,α) :={
(w,y)∈W ×Y :w>wbd(θ, γ,α), y > yba(γ,w)},
C(θ, γ,α) :={
(w,y)∈W ×Y :w≤wac(θ, γ,α), y≤ ydc(θ, γ,α,w)},
D(θ, γ,α) :={
(w,y)∈W ×Y :w≤wbd(θ, γ,α), y >max(ydc(θ, γ,α,w), yda(θ, γ,α,w)
)},
characterizes the distributor’s optimal strategy. Namely, if (w,y) ∈ A(θ, γ,α) (or B(θ, γ,α), C(θ, γ,α),
D(θ, γ,α), respectively), then the dominant distributor’s strategy is (a) (or (b), (c), (d), respectively).
Proof. The result follows by simply comparing the expressions for ΠiD, i ∈ {a, b, c, d}, as provided in
Theorem 1. Specifically, note that ΠaD ≥Πc
D if and only if w≥wac(θ, γ,α), where
wac(θ, γ,α) =vh
1 +α+ γ−
(vl−
vh1 +α
)βlβh
(2 +
βlβh
).
Similarly, ΠbD ≥Πd
D if and only if w≥wbd(θ, γ,α), where
wbd(θ, γ,α) =vh
1 +α+ γ−
(vl−
vh1 +α
)(βlβh
(2 +
θβlθβh + (1− θ)(1−βh)
)− 1− θ
θ
).
On the other hand, yda(γ, θ,α,w) and ydc(γ, θ,α,w) were defined in the proof of Theorem 1.
Finally, ΠbD ≥Πa
D if and only if y≥ yba(γ,w), where
yba(γ,w) = rl + γ− (vl−w+ γ)1−βhβ0
.
Considering all these conditions simultaneously leads to the statement in the lemma. �
Calmon, Jue-Rajasingh, Romero, Stenson: Consumer Education and Reverse Logistics in the Base of the Pyramid34 Working Paper - February 2017
Corollary 1. Under the same assumptions as in Lemma 1. For each consumer education level θ ∈ [0,1), dis-
tributor’s value for consumer adoptions γ ≥ 0, and purchasing cost parameter α, let wac(θ, γ,α), wbd(θ, γ,α),
and yda(θ, γ,α,w) be as defined in Lemma 1.
There exist a value wda(θ, γ,α) such that if we let Wda =[max(ET [vT ],wac(θ, γ,α)),min
(vh
1+α,wbd(θ, γ,α),wda(θ, γ,α)
)], then for each product with wholesale cost
w1 ∈ Wda and low service level y1 < yda(θ, γ,α,w1), there exist more expensive products with wholesale
cost w2 ∈ Wda, w2 ≥ w1, and better service level y2 ≥ yda(θ, γ,α,w2) + (w2 − w1) θβl(1−θ)β0
, such that
Π∗D(w2, y2) = ΠdD(w2, y2), Π∗D(w1, y1) = Πa
D(w1, y1) and Π∗D(w2, y2)≥Π∗D(w1, y1).
Proof. Lemma 1 implies that for any product with wholesale cost w ∈ [wac(θ, γ,α),wbd(θ, γ,α)] the
distributor’s optimal strategy is either (a) or (d).
Moreover, let wda(θ, γ,α) be such that yda(θ, γ,α,wda) = rα, i.e.
wda(θ, γ,α) =vh
1 +α+ γ−
(vl−
vh1 +α
)θβl
θβh + (1− θ)βl
(2 +
θβlθβh + (1− θ)(1−βh)
).
The presence of wda(θ, γ,α) in the definition Wda imposes that both strategies (a) and (d) are present in
the strategy map. Hence, a product (w1, y1) such that y1 < yda(θ, γ,α,w1) leads to Π∗D(w1, y1) = Πa
D(w1, y1),
while a product (w2, y2) such that y2 ≥ yda(θ, γ,α,w1) leads to Π∗D(w2, y2) = ΠdD(w1, y1).
To conclude, note that if w2 ≥w1 then Π∗D(w2, y2)≥Π∗D(w1, y1) if and only if y2 ≥ yda(θ, γ,α,w2) + (w2−w1) θβl
(1−θ)β0. �
Appendix B: Appendix for Section 5
In this section we re-state and prove the results discussed in Section 5.
Theorem 4. Under Assumption 1, and for any consumer education level θ ∈ [0,1), the distributor’s optimal
objective is
Π∗D = max{
ΠaD,Π
bD,Π
cD,Π
dD
}. (7)
Where each component in the max corresponds to a different non-dominated strategy. Specifically, strategies
(a), (b), (c), and (d) are characterized by:
(a) Target product adoptions from informed consumers with high valuation, with minimum refunds. In this
case, pa = vh, ra = y, ca = vh, ΠaR = 0, Πa
D = (vh−w+ γ)θβh.
(b) Target product adoptions from consumers with high valuation, with full refunds. In this case, pb = vh,
rb = vh, cb = vh, ΠbR = 0, Πb
D = (vh−w+ γ)βh− (w− y)(1− θ)(1−βh).
(c) Target product adoptions from informed consumers with high and low valuations, with minimum refunds.
In this case, pc = vl, rc = y, cc = vl− βh
βl(vh− vl), Πc
R = (vh− vl)θβh(1 + βhβl
), ΠcD = (vl−w+ γ)θ(βh +
βl)− (vh− vl)θβh(1 + βhβl
).
(d) Target product adoptions from consumers with high and low valuations and informed consumers with
high valuation, with partial refunds. In this case, pd = vl, rd = rl, c
d = vl − θβhθβl+(1−θ) (vh − vl), Πd
R =
(vh− vl)θβh(
1 + θβhθβl+(1−θ)
),
ΠdD = (vl−w+ γ)(βh +βl) + (1− θ)((vh− vl)βh− (w− y)β0)− (vh− vl)θβh
(1 +
θβhθβl + (1− θ)
).
Calmon, Jue-Rajasingh, Romero, Stenson: Consumer Education and Reverse Logistics in the Base of the PyramidWorking Paper - February 2017 35
The proof of Theorem 4 is essentially the same as the proof of Theorem 3, replacing the high willingness
to pay from vl to vh, and the low willingness to pay from vh1+α
to vl. We omit the details for the sake of
brevity.
Theorem 2. Under Assumption 1 and assuming y ≤ rl, increasing the salvage value never decreases the
distributor’s objective value. Namely, let Π∗D be the distributor’s optimal objective value, then∂Π∗D∂y≥ 0.
Moreover, increasing the consumer education level might decrease the distributor’s objective value. Namely,
for each θ ∈ [0,1) there exists a value γ(θ) such that, for each distributor’s value for consumer adoptions
γ ≥ γ(θ), there exists a threshold on the salvage value y(γ, θ,w) such that
∂Π∗D∂θ≥ 0 for each y≤ y(γ, θ,w),
∂Π∗D∂θ
< 0 for each y > y(γ, θ,w).
Moreover, the threshold y(γ, θ,w) decreases with γ. Namely, ∂y(γ,θ,w)
∂γ≤ 0 for each γ ≥ γ(θ).
Proof. The proof follows the same logic than the one of Theorem 1. Rather than replicating the whole
proof, we limit ourselves to update the appropriate expressions and highlight some important qualitative
differences.
For the first statement in the theorem, note that∂ΠaD∂y
=∂ΠcD∂y
= 0. While∂ΠbD∂y
= (1−θ)(1−βh)≥ (1−θ)β0 =∂ΠdD∂y≥ 0. Hence,
∂Π∗E∂y≥ 0.
For the second and third statements in the theorem, let
γda(θ) = (vh− vl)θβh
(1− θ)βh +βl
(2 +
θβhθβl + (1− θ)
)− (vl−w)
θβl + (1− θ)(1− θ)βh +βl
,
γdb(θ) = (vh− vl)βhβl
(1 + θ
(1 +
θβhθβl + (1− θ)
)− (1− θ)(1−βh)
β0
)− (vl−w)θ,
and
γ(θ) = max{γda(θ), γdb(θ)}. (8)
Similarly, let
yda(γ, θ,w) = rl + γ− (vl−w+ γ)βl + (1− θ)(1−βl)
(1− θ)β0
+ (vh− vl)θβh
(1− θ)β0
(2 +
θβhθβl + (1− θ)
),
ydc(γ, θ,w) = rl + γ− (vl−w+ γ)1
β0
− (vh− vl)θβhβl
βhθβl + 1− θ
1
β0
,
and
yd(θ,w) =w− (vh− vl)βhβ0
(2 +
θβhθβl + 1− θ +
θβh(θβl + 1− θ)2
).
Crucially, note that yd(θ,w) is independent of γ (the analogous expression in Theorem 1 was increasing in
γ). Moreover, ∂yda(γ,θ)
∂γ=−βl+(1−θ)βh
(1−θ)β0< 0, and ∂ydc(γ,θ)
∂γ=−βl+βh
β0< 0. To conclude, let
y(γ, θ,w) = max{yda(γ, θ,w), ydc(γ, θ,w), yd(θ,w)}. (9)
Note that by construction∂Π∗D∂θ≥ 0 for each y ≤ y(γ, θ,w),
∂Π∗E∂θ
=∂ΠdD∂θ
< 0 for each y > y(γ, θ,w). Moreover,
∂y(γ,θ)
∂γ≤ 0 for each γ ≥ γ(θ), where the inequality is strict if the maximum in equation (9) is attained by
yda(γ, θ) or ydc(γ, θ), making increasing θ more likely to be detrimental. This concludes the proof. �

Calmon, Jue-Rajasingh, Romero, Stenson: Consumer Education and Reverse Logistics in the Base of the Pyramid36 Working Paper - February 2017
Lemma 2. Under Assumption 1 and assuming y≤ rl, let W := [ET [vT ], vl], Y := [0, rl].
Then, for each consumer education level θ ∈ [0,1), and distributor’s value for consumer adoptions γ ≥ 0,
there exist values wac(θ, γ) and functions of w: ybd(θ, γ,w), where w(θ, γ) < ybd(θ, γ,w) for any w ∈ W,
yba(θ, γ,w), yda(θ, γ,w), and ydc(θ, γ,w), such that the partition of W×Y given by
A(θ, γ) :={
(w,y)∈W ×Y :w>wac(θ, γ), y≤min(yda(θ, γ,w), yba(θ, γ,w))},
B(θ, γ) :={
(w,y)∈W ×Y : y >max(yba(θ, γ,w), ybd(θ, γ,w))},
C(θ, γ) :={
(w,y)∈W ×Y :w≤wac(θ, γ,w), y≤ ydc(θ, γ,w)},
D(θ, γ) :={
(w,y)∈W ×Y : max(ydc(θ, γ,w), yda(θ, γ,w))< y≤ ybd(θ, γ,w)},
characterizes the distributor’s optimal strategy. Namely, if (w,y)∈A(θ, γ) (or B(θ, γ), C(θ, γ), D(θ, γ), respec-
tively), then the dominant distributor’s strategy is (a) (or (b), (c), (d), respectively).
Proof. The result follows by simply comparing the expressions for ΠiD, i ∈ {a, b, c, d}, as provided in
Theorem 4. Specifically, note that ΠaD ≥Πc
D if and only if w≥wac(θ, γ), where
wac(θ, γ) = vl + γ− (vh− vl)βhβl
(2 +
βhβl
).
Similarly, ΠbD ≥Πd
D if and only if y≥ ybd(θ, γ,w), where
ybd(θ, γ,w) =w+vl−w+ γ
1− θ − (vh− vl)θβh
(1− θ)βl
(2 +
θβhθβl + (1− θ)
).
On the other hand, yda(γ, θ,w) and ydc(γ, θ,w) were defined in the proof of Theorem 2.
Finally, ΠbD ≥Πa
D if and only if y≥ yba(γ,w), where
yba(γ,w) =w− (vh−w+ γ)βh
1−βh.
Considering all these conditions simultaneously leads to the statement in the lemma. �
Appendix C: Other Pictures
Figure 7 depicts the fact that increasing θ cannot decrease prices for the consumer and can, in effect,
encourage the retailer to skim the market.
0.25
0.50
0.75
0.5 0.6 0.7 0.8
w
θ
Strategy
a
c
d
(a) y= 0
0.25
0.50
0.75
0.5 0.6 0.7 0.8
w
θ
Strategy
a
b
d
(b) y= rαFigure 7 Distributor’s optimal strategy for different salvage values y and wholesale prices w. We assume
vh = 1, vl = 0.83, α= 0.3, γ = 0, β0 = βl = 0.3, and βh = 0.4.
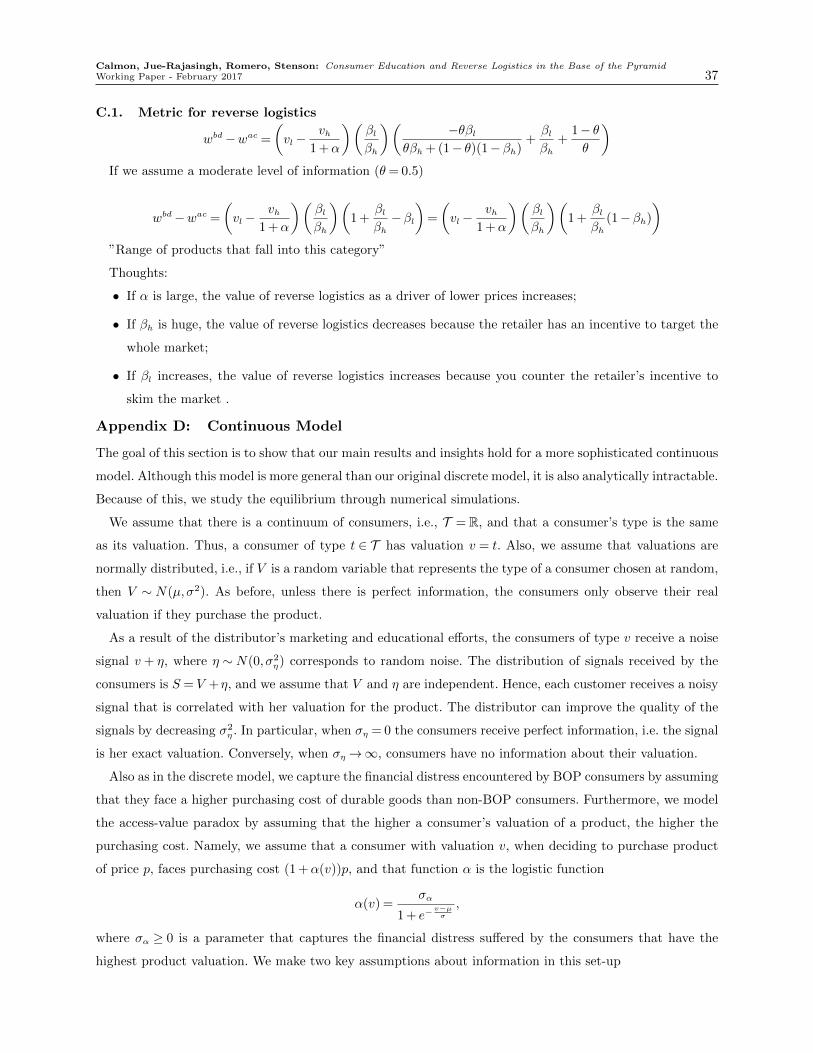
Calmon, Jue-Rajasingh, Romero, Stenson: Consumer Education and Reverse Logistics in the Base of the PyramidWorking Paper - February 2017 37
C.1. Metric for reverse logistics
wbd−wac =
(vl−
vh1 +α
)(βlβh
)( −θβlθβh + (1− θ)(1−βh)
+βlβh
+1− θθ
)If we assume a moderate level of information (θ= 0.5)
wbd−wac =
(vl−
vh1 +α
)(βlβh
)(1 +
βlβh−βl
)=
(vl−
vh1 +α
)(βlβh
)(1 +
βlβh
(1−βh)
)”Range of products that fall into this category”
Thoughts:
• If α is large, the value of reverse logistics as a driver of lower prices increases;
• If βh is huge, the value of reverse logistics decreases because the retailer has an incentive to target the
whole market;
• If βl increases, the value of reverse logistics increases because you counter the retailer’s incentive to
skim the market .
Appendix D: Continuous Model
The goal of this section is to show that our main results and insights hold for a more sophisticated continuous
model. Although this model is more general than our original discrete model, it is also analytically intractable.
Because of this, we study the equilibrium through numerical simulations.
We assume that there is a continuum of consumers, i.e., T = R, and that a consumer’s type is the same
as its valuation. Thus, a consumer of type t ∈ T has valuation v = t. Also, we assume that valuations are
normally distributed, i.e., if V is a random variable that represents the type of a consumer chosen at random,
then V ∼ N(µ,σ2). As before, unless there is perfect information, the consumers only observe their real
valuation if they purchase the product.
As a result of the distributor’s marketing and educational efforts, the consumers of type v receive a noise
signal v + η, where η ∼N(0, σ2η) corresponds to random noise. The distribution of signals received by the
consumers is S = V +η, and we assume that V and η are independent. Hence, each customer receives a noisy
signal that is correlated with her valuation for the product. The distributor can improve the quality of the
signals by decreasing σ2η . In particular, when ση = 0 the consumers receive perfect information, i.e. the signal
is her exact valuation. Conversely, when ση→∞, consumers have no information about their valuation.
Also as in the discrete model, we capture the financial distress encountered by BOP consumers by assuming
that they face a higher purchasing cost of durable goods than non-BOP consumers. Furthermore, we model
the access-value paradox by assuming that the higher a consumer’s valuation of a product, the higher the
purchasing cost. Namely, we assume that a consumer with valuation v, when deciding to purchase product
of price p, faces purchasing cost (1 +α(v))p, and that function α is the logistic function
α(v) =σα
1 + e−v−µσ
,
where σα ≥ 0 is a parameter that captures the financial distress suffered by the consumers that have the
highest product valuation. We make two key assumptions about information in this set-up
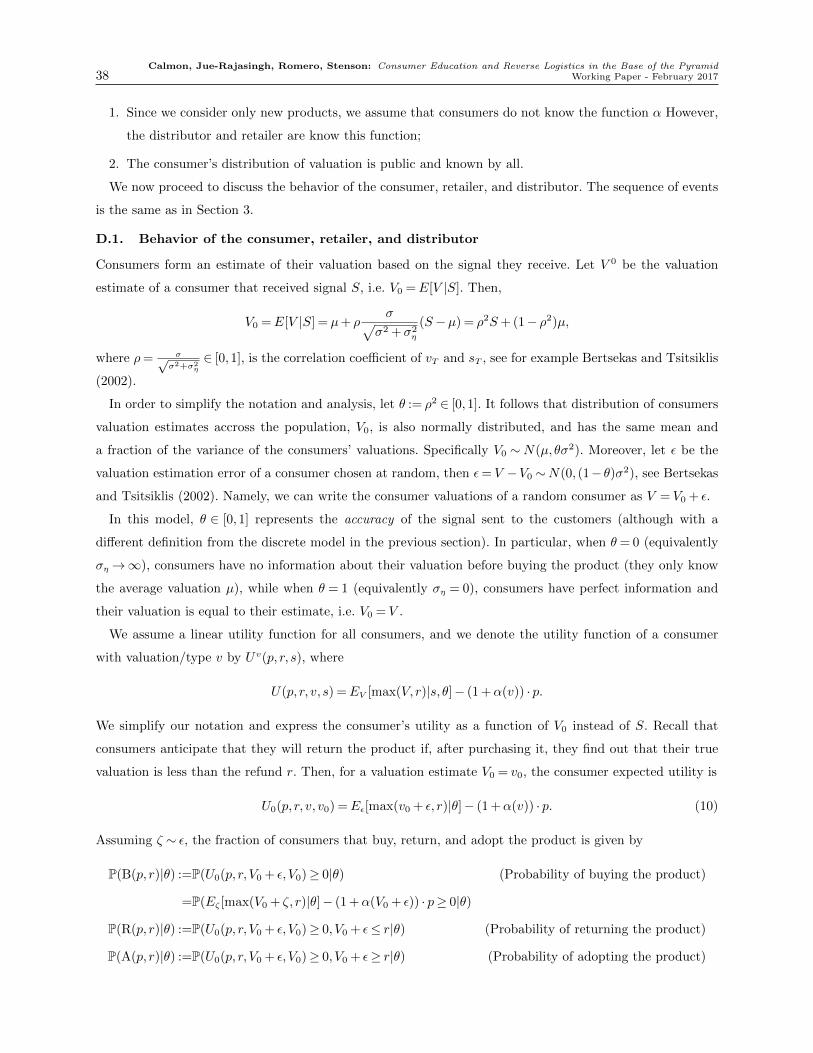
Calmon, Jue-Rajasingh, Romero, Stenson: Consumer Education and Reverse Logistics in the Base of the Pyramid38 Working Paper - February 2017
1. Since we consider only new products, we assume that consumers do not know the function α However,
the distributor and retailer are know this function;
2. The consumer’s distribution of valuation is public and known by all.
We now proceed to discuss the behavior of the consumer, retailer, and distributor. The sequence of events
is the same as in Section 3.
D.1. Behavior of the consumer, retailer, and distributor
Consumers form an estimate of their valuation based on the signal they receive. Let V 0 be the valuation
estimate of a consumer that received signal S, i.e. V0 =E[V |S]. Then,
V0 =E[V |S] = µ+ ρσ√
σ2 +σ2η
(S−µ) = ρ2S+ (1− ρ2)µ,
where ρ= σ√σ2+σ2
η
∈ [0,1], is the correlation coefficient of vT and sT , see for example Bertsekas and Tsitsiklis
(2002).
In order to simplify the notation and analysis, let θ := ρ2 ∈ [0,1]. It follows that distribution of consumers
valuation estimates accross the population, V0, is also normally distributed, and has the same mean and
a fraction of the variance of the consumers’ valuations. Specifically V0 ∼N(µ, θσ2). Moreover, let ε be the
valuation estimation error of a consumer chosen at random, then ε= V −V0 ∼N(0, (1− θ)σ2), see Bertsekas
and Tsitsiklis (2002). Namely, we can write the consumer valuations of a random consumer as V = V0 + ε.
In this model, θ ∈ [0,1] represents the accuracy of the signal sent to the customers (although with a
different definition from the discrete model in the previous section). In particular, when θ= 0 (equivalently
ση→∞), consumers have no information about their valuation before buying the product (they only know
the average valuation µ), while when θ = 1 (equivalently ση = 0), consumers have perfect information and
their valuation is equal to their estimate, i.e. V0 = V .
We assume a linear utility function for all consumers, and we denote the utility function of a consumer
with valuation/type v by Uv(p, r, s), where
U(p, r, v, s) =EV [max(V, r)|s, θ]− (1 +α(v)) · p.
We simplify our notation and express the consumer’s utility as a function of V0 instead of S. Recall that
consumers anticipate that they will return the product if, after purchasing it, they find out that their true
valuation is less than the refund r. Then, for a valuation estimate V0 = v0, the consumer expected utility is
U0(p, r, v, v0) =Eε[max(v0 + ε, r)|θ]− (1 +α(v)) · p. (10)
Assuming ζ ∼ ε, the fraction of consumers that buy, return, and adopt the product is given by
P(B(p, r)|θ) :=P(U0(p, r,V0 + ε, V0)≥ 0|θ) (Probability of buying the product)
=P(Eζ [max(V0 + ζ, r)|θ]− (1 +α(V0 + ε)) · p≥ 0|θ)
P(R(p, r)|θ) :=P(U0(p, r,V0 + ε, V0)≥ 0, V0 + ε≤ r|θ) (Probability of returning the product)
P(A(p, r)|θ) :=P(U0(p, r,V0 + ε, V0)≥ 0, V0 + ε≥ r|θ) (Probability of adopting the product)
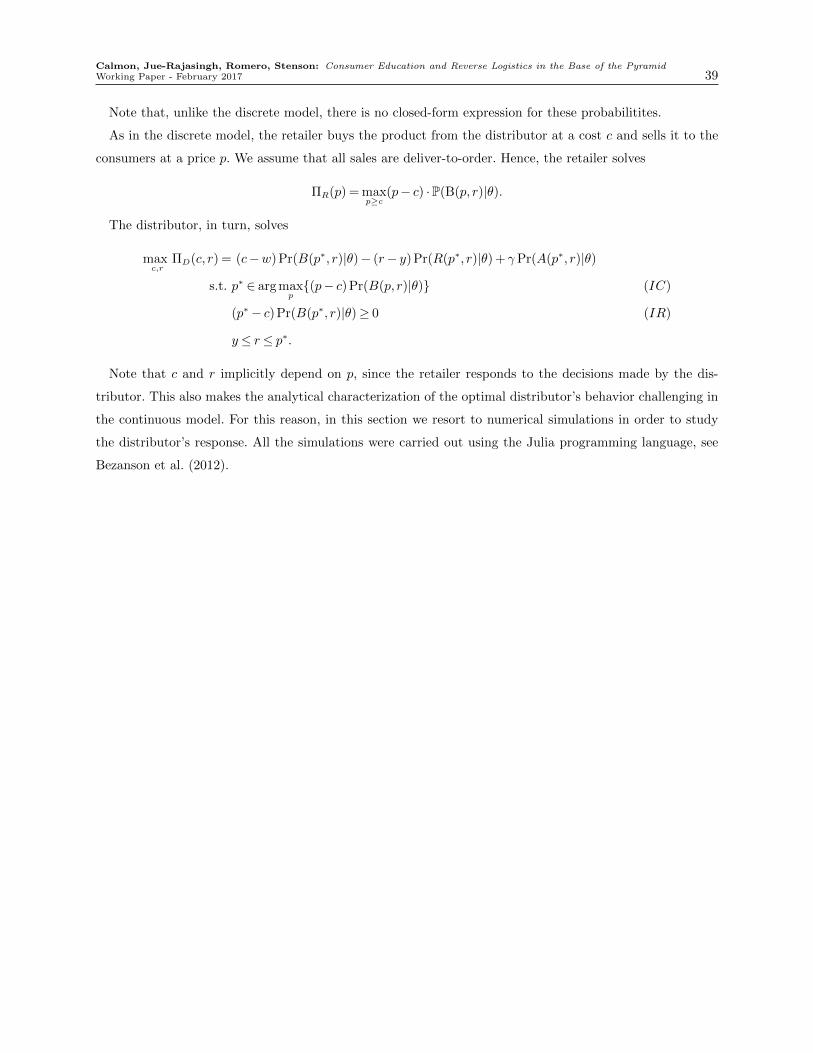
Calmon, Jue-Rajasingh, Romero, Stenson: Consumer Education and Reverse Logistics in the Base of the PyramidWorking Paper - February 2017 39
Note that, unlike the discrete model, there is no closed-form expression for these probabilitites.
As in the discrete model, the retailer buys the product from the distributor at a cost c and sells it to the
consumers at a price p. We assume that all sales are deliver-to-order. Hence, the retailer solves
ΠR(p) = maxp≥c
(p− c) ·P(B(p, r)|θ).
The distributor, in turn, solves
maxc,r
ΠD(c, r) = (c−w) Pr(B(p∗, r)|θ)− (r− y) Pr(R(p∗, r)|θ) + γPr(A(p∗, r)|θ)
s.t. p∗ ∈ arg maxp{(p− c) Pr(B(p, r)|θ)} (IC)
(p∗− c) Pr(B(p∗, r)|θ)≥ 0 (IR)
y≤ r≤ p∗.
Note that c and r implicitly depend on p, since the retailer responds to the decisions made by the dis-
tributor. This also makes the analytical characterization of the optimal distributor’s behavior challenging in
the continuous model. For this reason, in this section we resort to numerical simulations in order to study
the distributor’s response. All the simulations were carried out using the Julia programming language, see
Bezanson et al. (2012).