consumer-facing healthcare cost and quality tools
TRANSCRIPT
Consumer-Facing Healthcare Cost and Quality ToolsConsumer Reports Issue Brief
November 2016
Consumer Reports Issue Brief2
Consumer-Facing Healthcare Cost and Quality Tools
Photo illustration: C.J. Burton
Consumer Reports Issue Brief3
Consumer-Facing Healthcare Cost and Quality Tools
Project Summary
To help improve consumer access to comparative healthcare price information, Consumer Reports investigated the performance of online cost estimator tools and related resources that are featured on health insurance company web portals. As consumers bear a greater burden of healthcare costs, they are increasingly looking for information on ways they can control their out-of-pocket spending. Cost estimator tools allow consumers to look up medical services and procedures online, and compare prices charged by specific medical providers, including doctors, hospitals, and diagnostic testing facilities.
Many private health insurance companies—but not all—now offer websites with cost estimator tools and related resources that are developed specifically for their health plan members. These websites are usually password-protected and not generally available to non-members of the health plan. In addition to these proprietary health insurance company tools, over the last several years, a variety of national public price transparency tools, such as Amino, Guroo, Healthcare Bluebook, FAIR Health and others have also become available for anyone to use. Overall usage and awareness of cost-estimator tools is low, despite high consumer interest in healthcare costs.
Through this project, Consumer Reports investigated and rated the quality and usability of cost-estimator tools and related resources offered by New York health insurance plans, national plans, and stand-alone price transparency websites.
Our goals were to assess the strengths, weaknesses, and future potential of these websites/tools, make recommendations to improve their availability and capabilities, and raise consumer awareness about the benefits of using them. Consumer Reports reviewed a total of 24 websites and cost estimator tools, including 11 New York health plans, 6 national insurance plans, 5 national stand-alone websites, and 3 state price transparency sites. The ratings of these websites are not intended to be used to select a health plan.
CR used a combination of qualitative and quantitative methods to evaluate health plan websites and their associated cost estimator components, including a structured evaluation by trained reviewers and usability testing by consumers. We used a combination of qualitative and quantitative input from subject-matter/consumer stakeholders as well as consumer users to develop our scoring approach.
Health plans’ price comparison tools were given an overall score and categorical scores based on ease of use, functionality, content, and scope and reliability. Within each of those categories were more detailed measures. A separate rating was also prepared for the price estimate component only.
The results of CR’s analysis were published in a 4-page insert for New York state magazine subscribers, which accompanies a larger national article, “How to Survive a High-Deductible Health Plan,” in the January 2017 issue of Consumer Reports. The findings of the project and related consumer advice are also being made available online at www.ConsumerReports.org, and publicized through media outreach.
Findings in Brief
• Consumers continue to beunaware of health plan websitesand their cost estimator tools.Prior to our qualitative study(consumer interviews), only fiveof the 40 consumers (12.5%) hadpreviously used the cost estimatortools on their insurers’ site.
• Consumers are highly interestedin tools that provide informationon the cost and quality ofmedical treatments and services.75 percent, or 30 of 40 consumersin our interviews, said they wouldprobably or definitely recommendtheir specific health plan websiteto others.
Consumer Reports Issue Brief4
Consumer-Facing Healthcare Cost and Quality Tools
• Twelve New York health plansoffer cost estimator tools to theirhealth plan members. Theseplans reach approximately 50%of the fully insured market. Nineother major New York healthinsurance plans, who enroll atleast 3.3 million people, do notcurrently offer a cost-estimatortool.
• New York health plan websitesthat feature cost estimatorsvary widely in their usability,functionality, content, andscope. There was a large rangein CR’s overall scores for the 11New York insurance plan toolsanalyzed, from a low of 38 outof 100 (Independent Health) to ahigh of 84 (Cigna). Seven of the11 websites/tools received higheroverall scores (greater than 70).The average overall score was 69.
• Overall, the price estimatorportion of the websites (pricewithout quality or value) werehigh performing—nine of the11 tools that we evaluated hadscores higher than 80. Theaverage price estimator score was76. But the price estimate scorealone does not address otherkey content and functionalityattributes like the presence ofquality data, how quality and costare presented together, as well as
other important ease of use and functionality attributes.
• Some stand-alone nationalprice transparency websites alsoprovide useful information onprices and quality, especially forconsumers who have no accessto this information through theirown health plan. But many ofthe stand-alone tools lack keyfeatures that consumers desire.Even the highest-rated tools havelimited individual provider-levelquality data.
The Consumer Stake in Accurate, Actionable Healthcare Price Information
As consumers bear a greater burden of healthcare costs, they are increasingly looking for information on ways they can control their out-of-pocket spending.
Costs for consumers are increasing in the form of higher premiums, co-pays, coinsurance and deductibles, employers switching to high-deductible health plans, and higher prices of medical care in general. For example, for healthcare exchange plans, the average deductible for an individual covered
in an exchange silver plan was $3,065 in 2016.1 In addition, nearly a third of workers with employer-sponsored coverage were enrolled in a high-deductible health plan (HDHP) in 2016, up from 4 percent in 2006.2 Half of all workers are in plans with an individual deductible of $1,000 or more; 18 percent face an out-of-pocket maximum of $6,000 or more.3 Finally, the federal government estimates that out-of-pocket costs for consumers will increase by 5.5 percent per year each year, from 2020 to 2025.4
The Impact of High Costs
Researchers at the Urban Institute recently calculated that 10 percent of people with exchange coverage who have incomes between $23,500 and $58,500 will spend, on average, 20 percent of their income on premiums and out-of-pocket health costs.5 According to the Kaiser Family Foundation, 42% of consumers believe healthcare is the most unaffordable household expense.6 Likewise, a Consumer Reports’ national survey of people who regularly take prescription drugs found that respondents who reported a price increase in their drugs were more likely to
1 Kaiser Family Foundation,” Patient Cost-Sharing in Marketplace Plans, 2016,” available at: http://kff.org/health-costs/issue-brief/patient-cost-sharing-in-marketplace-plans-2016/
2 Kaiser Family Foundation, “2016 Employer Health Benefits Survey” September 14, 2016, available at: http://kff.org/report-section/ehbs-2016-summary-of-findings/
3 Op. cit. 2.4 Centers for Medicare and Medicaid Services, National Health Expenditures Fact Sheet, August 10, 2016, available at: https://www.cms.gov/Research-
Statistics-Data-and-Systems/Statistics-Trends-and-Reports/NationalHealthExpendData/Downloads/Proj2015.pdf5 Blumberg, L., Holahan, J. and Buettgens, M., How Much Do Marketplace and Other Nongroup Enrollees Spend on Health Care Relative to Their Incomes,”
The Urban Institute, November 2015, available at: http://www.urban.org/sites/default/files/alfresco/publication-pdfs/2000559-How-Much-Do-Marketplace-and-Other-Nongroup-Enrollees-Spend-on-Health-Care-Relative-to-Their-Incomes.pdf
6 DiJulio, B., Firth, J., and Brodie, M. Kaiser Health Tracking Poll, October 2015, Kaiser Family Foundation, available at: http://kff.org/health-costs/poll-finding/kaiser-health-tracking-poll-october-2015/
Consumer Reports Issue Brief5
Consumer-Facing Healthcare Cost and Quality Tools
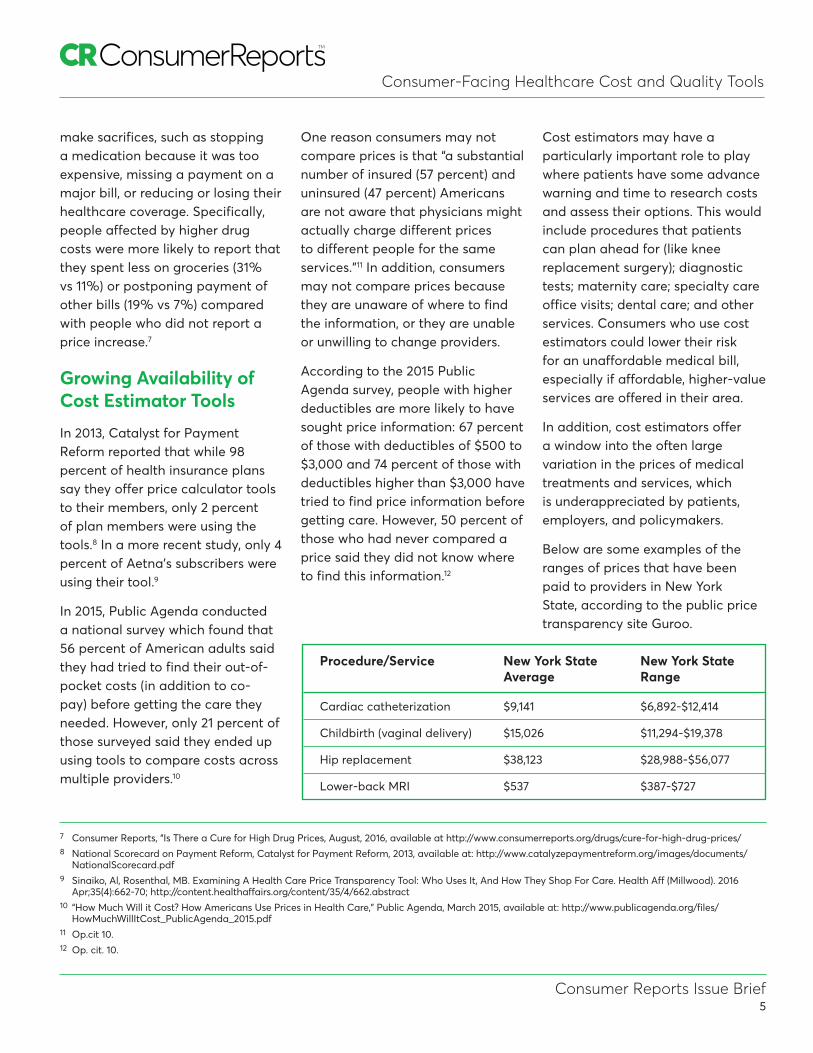
Procedure/Service New York State New York State Average Range
Cardiac catheterization $9,141 $6,892-$12,414
Childbirth (vaginal delivery) $15,026 $11,294-$19,378
Hip replacement $38,123 $28,988-$56,077
Lower-back MRI $537 $387-$727
make sacrifices, such as stopping a medication because it was too expensive, missing a payment on a major bill, or reducing or losing their healthcare coverage. Specifically, people affected by higher drug costs were more likely to report that they spent less on groceries (31% vs 11%) or postponing payment of other bills (19% vs 7%) compared with people who did not report a price increase.7
Growing Availability of Cost Estimator Tools
In 2013, Catalyst for Payment Reform reported that while 98 percent of health insurance plans say they offer price calculator tools to their members, only 2 percent of plan members were using the tools.8 In a more recent study, only 4 percent of Aetna’s subscribers were using their tool.9
In 2015, Public Agenda conducted a national survey which found that 56 percent of American adults said they had tried to find their out-of-pocket costs (in addition to co-pay) before getting the care they needed. However, only 21 percent of those surveyed said they ended up using tools to compare costs across multiple providers.10
One reason consumers may not compare prices is that “a substantial number of insured (57 percent) and uninsured (47 percent) Americans are not aware that physicians might actually charge different prices to different people for the same services.”11 In addition, consumers may not compare prices because they are unaware of where to find the information, or they are unable or unwilling to change providers.
According to the 2015 Public Agenda survey, people with higher deductibles are more likely to have sought price information: 67 percent of those with deductibles of $500 to $3,000 and 74 percent of those with deductibles higher than $3,000 have tried to find price information before getting care. However, 50 percent of those who had never compared a price said they did not know where to find this information.12
Cost estimators may have a particularly important role to play where patients have some advance warning and time to research costs and assess their options. This would include procedures that patients can plan ahead for (like knee replacement surgery); diagnostic tests; maternity care; specialty care office visits; dental care; and other services. Consumers who use cost estimators could lower their risk for an unaffordable medical bill, especially if affordable, higher-value services are offered in their area.
In addition, cost estimators offer a window into the often large variation in the prices of medical treatments and services, which is underappreciated by patients, employers, and policymakers.
Below are some examples of the ranges of prices that have been paid to providers in New York State, according to the public price transparency site Guroo.
7 Consumer Reports, “Is There a Cure for High Drug Prices, August, 2016, available at http://www.consumerreports.org/drugs/cure-for-high-drug-prices/8 National Scorecard on Payment Reform, Catalyst for Payment Reform, 2013, available at: http://www.catalyzepaymentreform.org/images/documents/
NationalScorecard.pdf9 Sinaiko, Al, Rosenthal, MB. Examining A Health Care Price Transparency Tool: Who Uses It, And How They Shop For Care. Health Aff (Millwood). 2016
Apr;35(4):662-70; http://content.healthaffairs.org/content/35/4/662.abstract10 “How Much Will it Cost? How Americans Use Prices in Health Care,” Public Agenda, March 2015, available at: http://www.publicagenda.org/files/
HowMuchWillItCost_PublicAgenda_2015.pdf11 Op.cit 10.12 Op. cit. 10.
Consumer Reports Issue Brief6
Consumer-Facing Healthcare Cost and Quality Tools
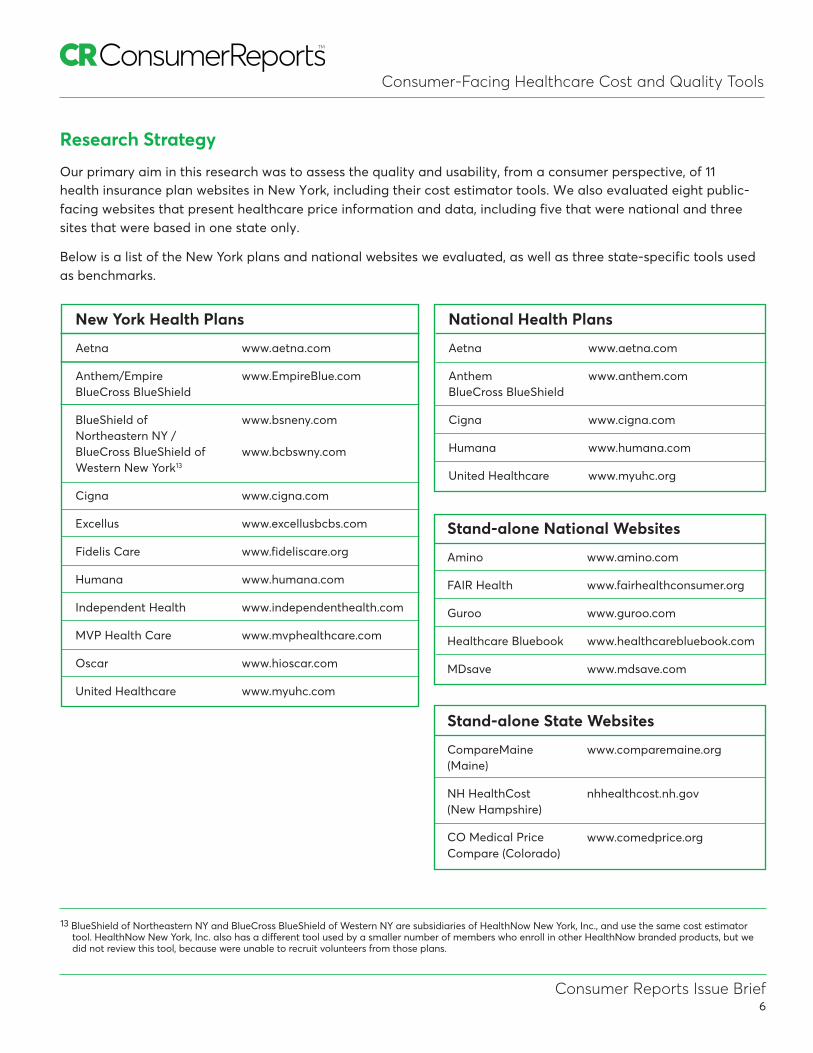
Stand-alone State Websites
CompareMaine www.comparemaine.org (Maine)
NH HealthCost nhhealthcost.nh.gov (New Hampshire)
www.comedprice.org CO Medical Price Compare (Colorado)
Stand-alone National Websites
Amino www.amino.com
FAIR Health www.fairhealthconsumer.org
Guroo www.guroo.com
Healthcare Bluebook www.healthcarebluebook.com
MDsave www.mdsave.com
National Health Plans
Aetna www.aetna.com
Anthem www.anthem.com BlueCross BlueShield
Cigna www.cigna.com
Humana www.humana.com
United Healthcare www.myuhc.org
New York Health Plans
Aetna www.aetna.com
Anthem/Empire www.EmpireBlue.com BlueCross BlueShield
BlueShield of www.bsneny.com Northeastern NY / BlueCross BlueShield of www.bcbswny.com Western New York13
Cigna www.cigna.com
Excellus www.excellusbcbs.com
Fidelis Care www.fideliscare.org
Humana www.humana.com
Independent Health www.independenthealth.com
MVP Health Care www.mvphealthcare.com
Oscar www.hioscar.com
United Healthcare www.myuhc.com
Research Strategy
Our primary aim in this research was to assess the quality and usability, from a consumer perspective, of 11 health insurance plan websites in New York, including their cost estimator tools. We also evaluated eight public-facing websites that present healthcare price information and data, including five that were national and three sites that were based in one state only.
Below is a list of the New York plans and national websites we evaluated, as well as three state-specific tools used as benchmarks.
13 BlueShield of Northeastern NY and BlueCross BlueShield of Western NY are subsidiaries of HealthNow New York, Inc., and use the same cost estimator tool. HealthNow New York, Inc. also has a different tool used by a smaller number of members who enroll in other HealthNow branded products, but we did not review this tool, because were unable to recruit volunteers from those plans.
Consumer Reports Issue Brief7
Consumer-Facing Healthcare Cost and Quality Tools
We used a combination of qualitative and quantitative methods to evaluate both the cost estimator tools as well as other resources provided on the health plan’s or stand-alone website.
We used four main criteria of performance and usability: ease of use; functionality; content; and scope and reliability. We used a combination of subject-matter/consumer stakeholder input, as well as user input (both qualitative and quantitative) to develop our scoring approach.
To determine which New York state health plans to include in the study, we reviewed data for plans with the largest market share (by number of enrollees) in the individual, small group, and large group markets, so that we could include the cost estimator tools used by health plans with combined market share of 80 percent in each market segment. Based on this analysis, we identified a total of 12 New York insurance plans to include in the study.14 Five of the plans are operated by companies with a national presence in the health insurance marketplace, while the other seven health plans operate in New York state or regionally. Taken together, these 12 plans make up about 50% of the New York fully-insured health insurance market.
We adapted criteria for assessing the websites and price comparison
tools from multiple sources including the Health Care Incentives Improvement Institute and Catalyst for Payment Reform’s prior research on state-based price transparency websites.15
Through our market share analysis, we also identified nine other major New York health insurance plans, who enroll at least 3.3 million people, that do not currently offer a cost-estimator tool to their health plan members. These included major New York health plans such as Oxford, EmblemHealth, and CDPHP. In the self-funded market, many private sector and union employees have access to cost-estimator tools provided by their health plan administrator, such as Aetna, Cigna or UnitedHealthcare. But we also found that New York State’s Empire Plan does not offer a cost estimator tool for its plan members, who include 1.2 million state and local government workers.
Qualitative Analysis: In the qualitative part of our analysis, we recruited 40 consumers through email and Facebook ads. We interviewed participants and viewed their experience through web conferencing software as they used their health plan's website. Trained reviewers watched the interviews and collected data for scoring. Prior to our study, only five of the 40 consumers (12.5%) had previously used the cost estimator tools on their insurers’ sites.
In addition, we asked participating consumers for their feedback on the insurance company websites and the price comparison tools overall, including their expectations and perceptions of the value of the tools; their overall sense of the usefulness of the information, the best features and aspects of the tools, and shortcomings of the tools.
The interviews were done between November 6, 2015 and May 2, 2016. Each interview lasted 75 to 90 minutes. All the interviewees had insurance and access to their insurer’s online tools. Participants received a $100 honorarium for their time.
Quantitative Analysis: In the quantitative part of our analysis, trained website reviewers used approximately 110 criteria to score the websites and tools, including:
• User-interface design
• User-friendly presentation ofprice, quality, and value
• Ease of comparison of providers
• Search functionality, includinginputs, filters, sorting, and searchoptions
• The type of price informationavailable (e.g. out-of-pocketestimates)
• How individually-tailored theprice estimate was (e.g. specificto the individual, the insurer,the patient’s plan, remainingdeductible)
14 Two of the New York health plans (BlueShield of Northeastern New York and BCBS of Western NY) are operated by the same company (HealthNow New York), and use the same website/cost estimator tool, so they appear together in the ratings chart, for a total of 11 rated plans.
15 http://catalyzepaymentreform.org/images/documents/2015_Report_PriceTransLaws_06.pdf
Consumer Reports Issue Brief8
Consumer-Facing Healthcare Cost and Quality Tools
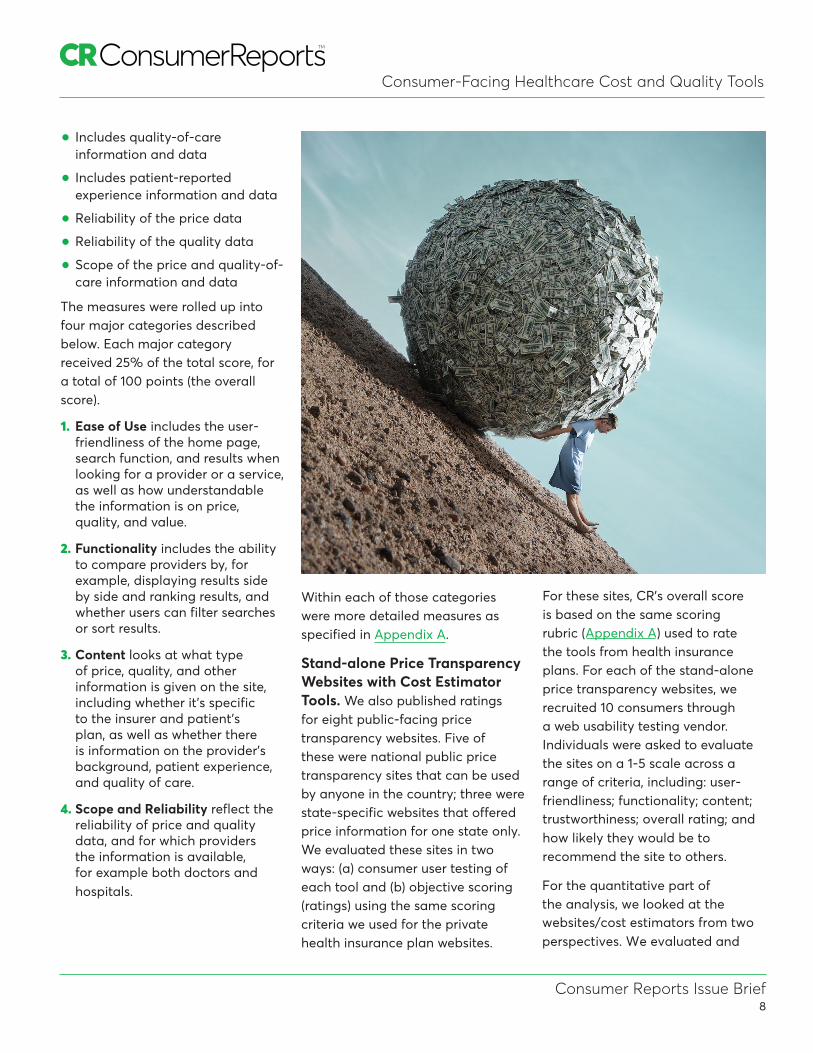
• Includes quality-of-careinformation and data
• Includes patient-reportedexperience information and data
• Reliability of the price data
• Reliability of the quality data
• Scope of the price and quality-of-care information and data
The measures were rolled up into four major categories described below. Each major category received 25% of the total score, for a total of 100 points (the overall score).
1. Ease of Use includes the user-friendliness of the home page,search function, and results whenlooking for a provider or a service,as well as how understandablethe information is on price,quality, and value.
2. Functionality includes the abilityto compare providers by, forexample, displaying results sideby side and ranking results, andwhether users can filter searchesor sort results.
3. Content looks at what typeof price, quality, and otherinformation is given on the site,including whether it’s specificto the insurer and patient’splan, as well as whether thereis information on the provider’sbackground, patient experience,and quality of care.
4. Scope and Reliability reflect the reliability of price and quality data, and for which providers the information is available, for example both doctors andhospitals.
Within each of those categories were more detailed measures as specified in Appendix A.
Stand-alone Price Transparency Websites with Cost Estimator Tools. We also published ratings for eight public-facing price transparency websites. Five of these were national public price transparency sites that can be used by anyone in the country; three were state-specific websites that offered price information for one state only. We evaluated these sites in two ways: (a) consumer user testing of each tool and (b) objective scoring (ratings) using the same scoring criteria we used for the private health insurance plan websites.
For these sites, CR’s overall score is based on the same scoring rubric (Appendix A) used to rate the tools from health insurance plans. For each of the stand-alone price transparency websites, we recruited 10 consumers through a web usability testing vendor. Individuals were asked to evaluate the sites on a 1-5 scale across a range of criteria, including: user-friendliness; functionality; content; trustworthiness; overall rating; and how likely they would be to recommend the site to others.
For the quantitative part of the analysis, we looked at the websites/cost estimators from two perspectives. We evaluated and
Consumer Reports Issue Brief9
Consumer-Facing Healthcare Cost and Quality Tools
rated 1) the overall health plan website, including the pricing component and its integration with other site elements such as quality information and 2) the pricing component only, and its key features and attributes in displaying price information only.
What we found
1. Qualitative InterviewResults – Consumer Perspectives and Insights
In our qualitative interviews with our consumer testers, participants reported very low use of cost estimator tools. Prior to participating in the interview and web-usability test, only five of the 40 consumers (12.5%) that we interviewed had previously used the cost estimator tools on their insurer’s site.
However, after participating in our study, 75 percent (30 of 40) said they would probably or definitely recommend the website to others. Many were pleasantly surprised and pleased when exposed to the information, and the ability to compare prices charged by specific providers for a medical test or procedure. But they also had preferences and ideas on how the sites could better serve their needs.
Overall, consumers viewed “user friendliness” as the most important factor to them in a plan website and with a price comparison tool. They also put a priority on benefit information; being able to search for in-network providers accepting
new patients; functionality that allowed them to compare providers side-by-side; and ordering medications online.
At the same time, they were frustrated with gaps they saw in the plans websites and when using the price comparison tools. Those included: lack of detailed searching ability; awkward design; unappealing aesthetics (font size, colors); difficulty navigating; inability to estimate the cost for specific procedures; lack of quality-of-care information; conflicting or inaccurate information; and lack of trust in the information.
Indeed, consumers identified trust as a key attribute. While our testers said they trusted the information on the health plan website in general, they were skeptical about the quality ratings and reviews. Plan members indicated they would be more likely to trust reviews if they
Usability
• Ease to use/find answers(easy to navigate, search, criticalinformation readily apparent)
• Clear and simple headings andcategories (without lots of clicks,re-directs, easy to go back Home)
• Visually appealing design (fontsize, colors, clean, uncluttered,well-organized)
• Secure and easy log-in(remembers member information)
Content
• Helpful/educational;resources (nurse line,doctors on call, chat,medical information, lifestylesuggestions, appointmentscheduling and tracking)
• Easy to understandlanguage (clear, simple, notechnical jargon)
• Accurate and up-to-dateinformation
• Something new (e.g. photosof doctors, videos, uniqueprovider information, perks)
were coming from an independent non-profit organization rather than the insurance website or a government site.
Our consumer testers were also frustrated that quality-of-care information was often presented on a different part of the health plan websites they reviewed. In our interviews with them, they concurred that it would preferable for the quality and price to be presented together.
Most of our consumer testers said their heightened awareness from participating in this research would change their future behavior.
Before volunteers used their health plans’ websites with our guidance, we asked them to describe what an “ideal” health plan price tool might look like. They offered the following usability and content characteristics:
Consumer Reports Issue Brief10
Consumer-Facing Healthcare Cost and Quality Tools
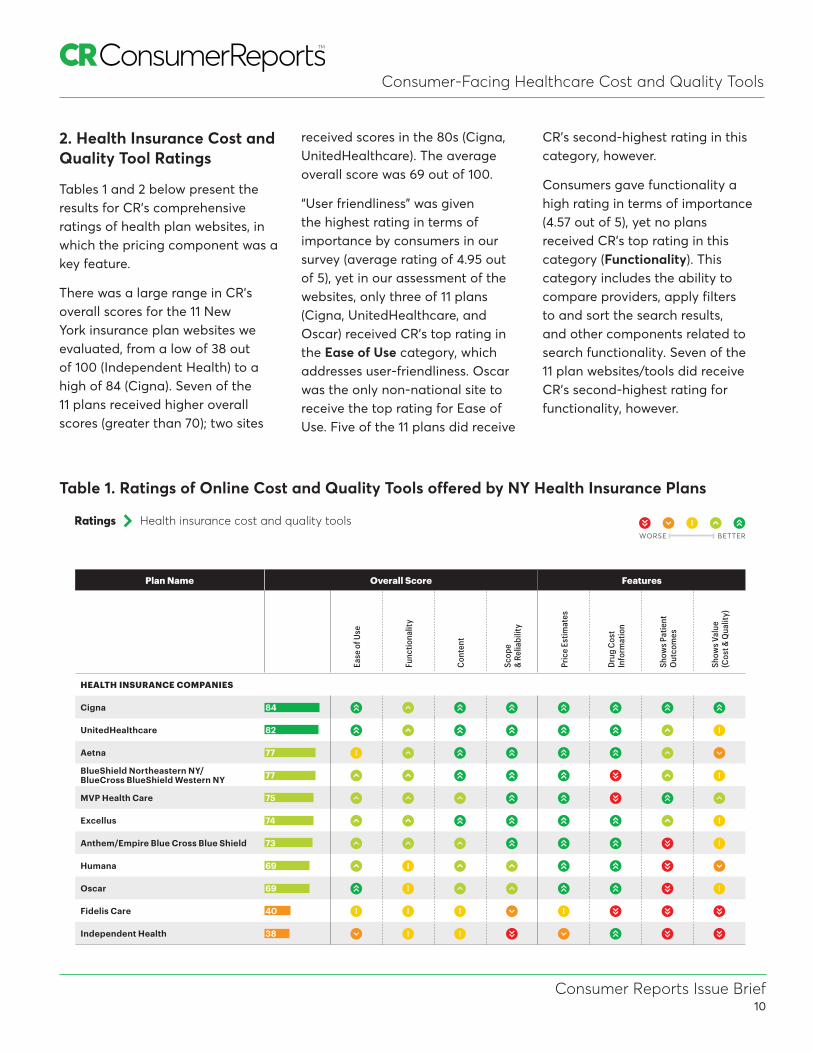
2. Health Insurance Cost andQuality Tool Ratings
Tables 1 and 2 below present the results for CR’s comprehensive ratings of health plan websites, in which the pricing component was a key feature.
There was a large range in CR’s overall scores for the 11 New York insurance plan websites we evaluated, from a low of 38 out of 100 (Independent Health) to a high of 84 (Cigna). Seven of the 11 plans received higher overall scores (greater than 70); two sites
received scores in the 80s (Cigna, UnitedHealthcare). The average overall score was 69 out of 100.
“User friendliness” was given the highest rating in terms of importance by consumers in our survey (average rating of 4.95 out of 5), yet in our assessment of the websites, only three of 11 plans (Cigna, UnitedHealthcare, and Oscar) received CR’s top rating in the Ease of Use category, which addresses user-friendliness. Oscar was the only non-national site to receive the top rating for Ease of Use. Five of the 11 plans did receive
CR’s second-highest rating in this category, however.
Consumers gave functionality a high rating in terms of importance (4.57 out of 5), yet no plans received CR’s top rating in this category (Functionality). This category includes the ability to compare providers, apply filters to and sort the search results, and other components related to search functionality. Seven of the 11 plan websites/tools did receive CR’s second-highest rating for functionality, however.
HOW WE TEST: Tools offered by insurance companiesThe Overall Score is based on four components. Ease of Use includes the user-friendliness of the home page, search function, and results when looking for a provider or a ser-vice, as well as how understandable the information is on price, quality, and value. Functionality is how easy it is to compare providers by, for example, displaying results side by side and ranking results, and whether users can filter searches or sort results. Content looks at what type of price, quality, and other
information is given on the site, in-cluding whether it’s specific to the insurer and patient’s plan, and how it’s displayed, as well as whether there is information on the provider’s background, patient experience, and quality of care. Scope andReliability reflect the reliability of price and quality data, including whether it shows costs for specific doctors and hospitals. In addition, we show whether tools have these features: Price Estimates, DrugCost Information, Patient
Outcomes (whether it indicates how well patients fared after treatment, such as complication rates), and Value (whether it presents information on cost and quality in a user-friendly way, and whether it identifies high-value providers).
Some insurers provide these tools only for people enrolled in preferred provider organizations, not health maintenance organizations.
Consumer Reports licenses its patient-experience data to Cigna but has no financial relationship with Cigna, and Cigna played no role in developing the ratings criteria.
HOW WE TEST: Tools offered by stand-alone websitesThe Overall Score is based on the same four factors used to rate the tools from health insurance companies. We also highlight thesefeatures: Out-of-Pocket Estimatesfor insured patients, Reliable Cost Estimates, Provider-SpecificPricing, and Quality Information for Hospitals. For more on how thesetools were rated, go to CR.org/how-we-rate-insurance-tools.
Ratings Health insurance cost and quality tools
Website Name Overall Score Features
Ease
of U
se
Func
tiona
lity
Cont
ent
Scop
e &
Relia
bilit
y
Out
-of-P
ocke
tEs
timat
es
Relia
ble
Cost
Es
timat
es
Prov
ider
-Spe
cific
Pric
ing
Qua
lity
Info
rmat
ion
for
Hosp
itals
STAND-ALONE WEBSITES
Amino 66 04 3 04 04 · · · ·Guroo 41 04 02 02 02 · ·MDsave 40 03 03 02 02 ·Healthcare Bluebook 37 03 02 02 02 ·FAIR Health* 28 03 01 02 01 ·
CR.ORG 19D
Plan Name Overall Score Features
Ease
of U
se
Func
tiona
lity
Cont
ent
Scop
e
& Re
liabi
lity
Pric
e Es
timat
es
Drug
Cos
t In
form
atio
n
Show
s Pat
ient
O
utco
mes
Show
s Val
ue
(Cos
t & Q
ualit
y)
HEALTH INSURANCE COMPANIES
Cigna 84 05 004 05 05 05 05 05 05UnitedHealthcare 82 05 004 05 05 05 05 004 03Aetna 77 03 004 05 05 05 05 004 002BlueShield Northeastern NY/BlueCross BlueShield Western NY 77 04 004 05 05 05 01 004 03MVP Health Care 75 04 004 004 05 05 01 05 004Excellus 74 004 004 05 05 05 05 004 03Anthem/Empire Blue Cross Blue Shield 73 04 04 004 05 05 05 01 03Humana 69 4 03 004 004 05 05 01 002Oscar 69 05 03 004 004 05 05 01 03Fidelis Care 40 03 03 03 002 03 01 01 01Independent Health 38 002 03 03 01 002 005 01 01
JANUARY 2017*FAIR Health plans to launch a cost-and-quality tool for New York later in 2017.
1 2 3 4 5WORSE BETTER
Table 1. Ratings of Online Cost and Quality Tools offered by NY Health Insurance Plans
Consumer Reports Issue Brief11
Consumer-Facing Healthcare Cost and Quality Tools
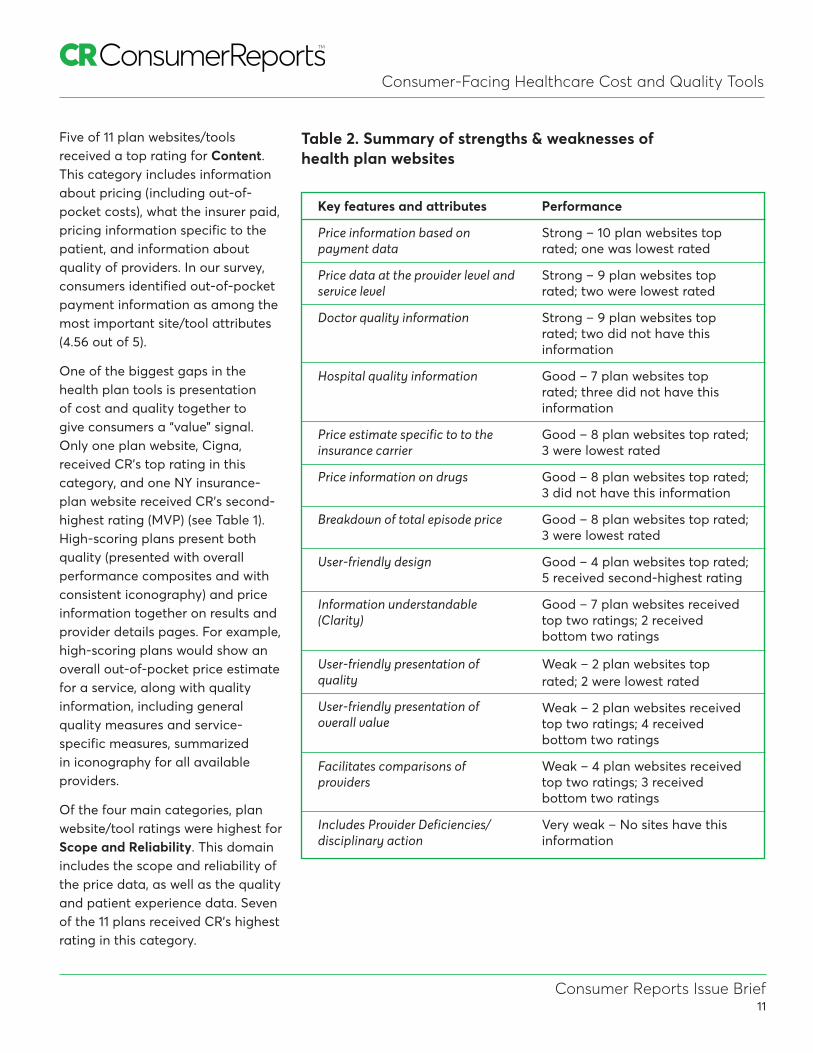
Table 2. Summary of strengths & weaknesses of health plan websites
Five of 11 plan websites/tools received a top rating for Content. This category includes information about pricing (including out-of-pocket costs), what the insurer paid, pricing information specific to the patient, and information about quality of providers. In our survey, consumers identified out-of-pocket payment information as among the most important site/tool attributes (4.56 out of 5).
One of the biggest gaps in the health plan tools is presentation of cost and quality together to give consumers a “value” signal. Only one plan website, Cigna, received CR’s top rating in this category, and one NY insurance-plan website received CR’s second-highest rating (MVP) (see Table 1). High-scoring plans present both quality (presented with overall performance composites and with consistent iconography) and price information together on results and provider details pages. For example, high-scoring plans would show an overall out-of-pocket price estimate for a service, along with quality information, including general quality measures and service-specific measures, summarized in iconography for all available providers.
Of the four main categories, plan website/tool ratings were highest for Scope and Reliability. This domain includes the scope and reliability of the price data, as well as the quality and patient experience data. Seven of the 11 plans received CR’s highest rating in this category.
Key features and attributes
Price information based on payment data
Price data at the provider level and service level
Doctor quality information
Hospital quality information
Price estimate specific to to the insurance carrier
Price information on drugs
Breakdown of total episode price
User-friendly design
Information understandable (Clarity)
User-friendly presentation of quality
User-friendly presentation of overall value
Facilitates comparisons of providers
Includes Provider Deficiencies/disciplinary action
Performance
Strong – 10 plan websites top rated; one was lowest rated
Strong – 9 plan websites top rated; two were lowest rated
Strong – 9 plan websites top rated; two did not have this information
Good – 7 plan websites top rated; three did not have this information
Good – 8 plan websites top rated; 3 were lowest rated
Good – 8 plan websites top rated; 3 did not have this information
Good – 8 plan websites top rated; 3 were lowest rated
Good – 4 plan websites top rated; 5 received second-highest rating
Good – 7 plan websites received top two ratings; 2 received bottom two ratings
Weak – 2 plan websites top rated; 2 were lowest rated
Weak – 2 plan websites received top two ratings; 4 received bottom two ratings
Weak – 4 plan websites received top two ratings; 3 received bottom two ratings
Very weak – No sites have this information
Consumer Reports Issue Brief12
Consumer-Facing Healthcare Cost and Quality Tools
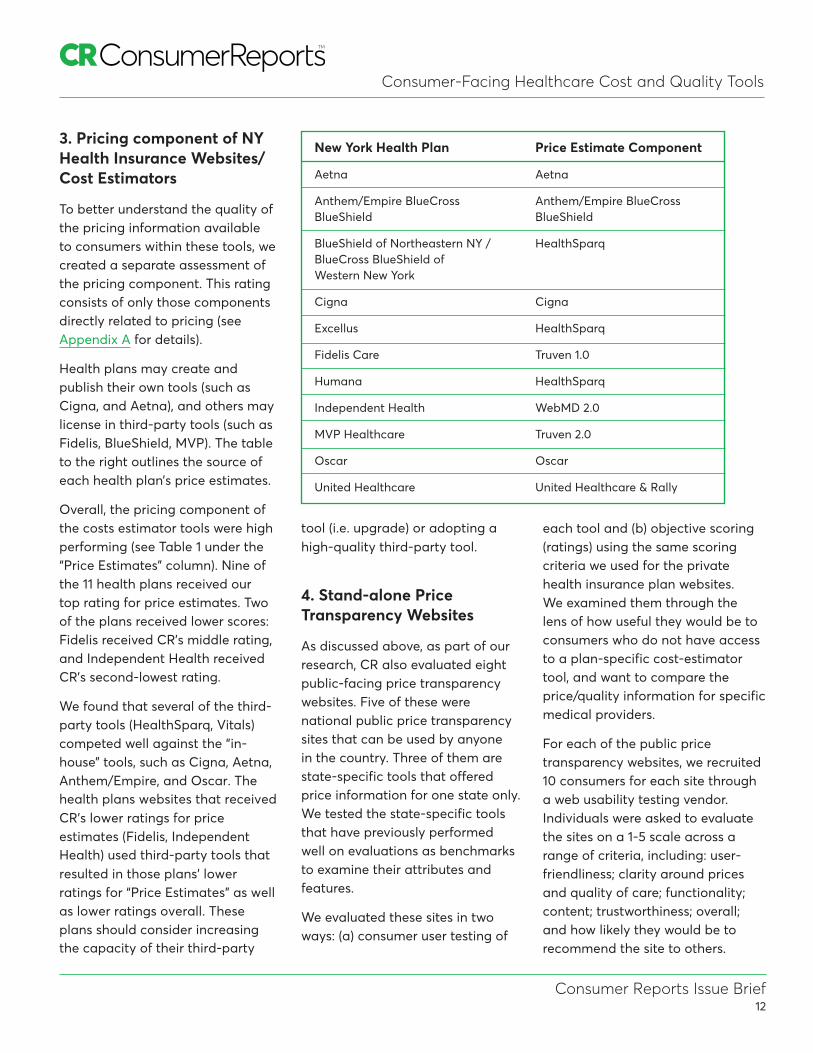
3. Pricing component of NYHealth Insurance Websites/Cost Estimators
To better understand the quality of the pricing information available to consumers within these tools, we created a separate assessment of the pricing component. This rating consists of only those components directly related to pricing (see Appendix A for details).
Health plans may create and publish their own tools (such as Cigna, and Aetna), and others may license in third-party tools (such as Fidelis, BlueShield, MVP). The table to the right outlines the source of each health plan’s price estimates.
Overall, the pricing component of the costs estimator tools were high performing (see Table 1 under the “Price Estimates” column). Nine of the 11 health plans received our top rating for price estimates. Two of the plans received lower scores: Fidelis received CR’s middle rating, and Independent Health received CR’s second-lowest rating.
We found that several of the third-party tools (HealthSparq, Vitals) competed well against the “in-house” tools, such as Cigna, Aetna, Anthem/Empire, and Oscar. The health plans websites that received CR’s lower ratings for price estimates (Fidelis, Independent Health) used third-party tools that resulted in those plans’ lower ratings for “Price Estimates” as well as lower ratings overall. These plans should consider increasing the capacity of their third-party
tool (i.e. upgrade) or adopting a high-quality third-party tool.
4. Stand-alone PriceTransparency Websites
As discussed above, as part of our research, CR also evaluated eight public-facing price transparency websites. Five of these were national public price transparency sites that can be used by anyone in the country. Three of them are state-specific tools that offered price information for one state only. We tested the state-specific tools that have previously performed well on evaluations as benchmarks to examine their attributes and features.
We evaluated these sites in two ways: (a) consumer user testing of
each tool and (b) objective scoring (ratings) using the same scoring criteria we used for the private health insurance plan websites. We examined them through the lens of how useful they would be to consumers who do not have access to a plan-specific cost-estimator tool, and want to compare the price/quality information for specific medical providers.
For each of the public price transparency websites, we recruited 10 consumers for each site through a web usability testing vendor. Individuals were asked to evaluate the sites on a 1-5 scale across a range of criteria, including: user-friendliness; clarity around prices and quality of care; functionality; content; trustworthiness; overall; and how likely they would be to recommend the site to others.
New York Health Plan Price Estimate Component
Aetna Aetna
Anthem/Empire BlueCross Anthem/Empire BlueCross BlueShield BlueShield
BlueShield of Northeastern NY / HealthSparq BlueCross BlueShield of Western New York
Cigna Cigna
Excellus HealthSparq
Fidelis Care Truven 1.0
Humana HealthSparq
Independent Health WebMD 2.0
MVP Healthcare Truven 2.0
Oscar Oscar
United Healthcare United Healthcare & Rally
Consumer Reports Issue Brief13
Consumer-Facing Healthcare Cost and Quality Tools
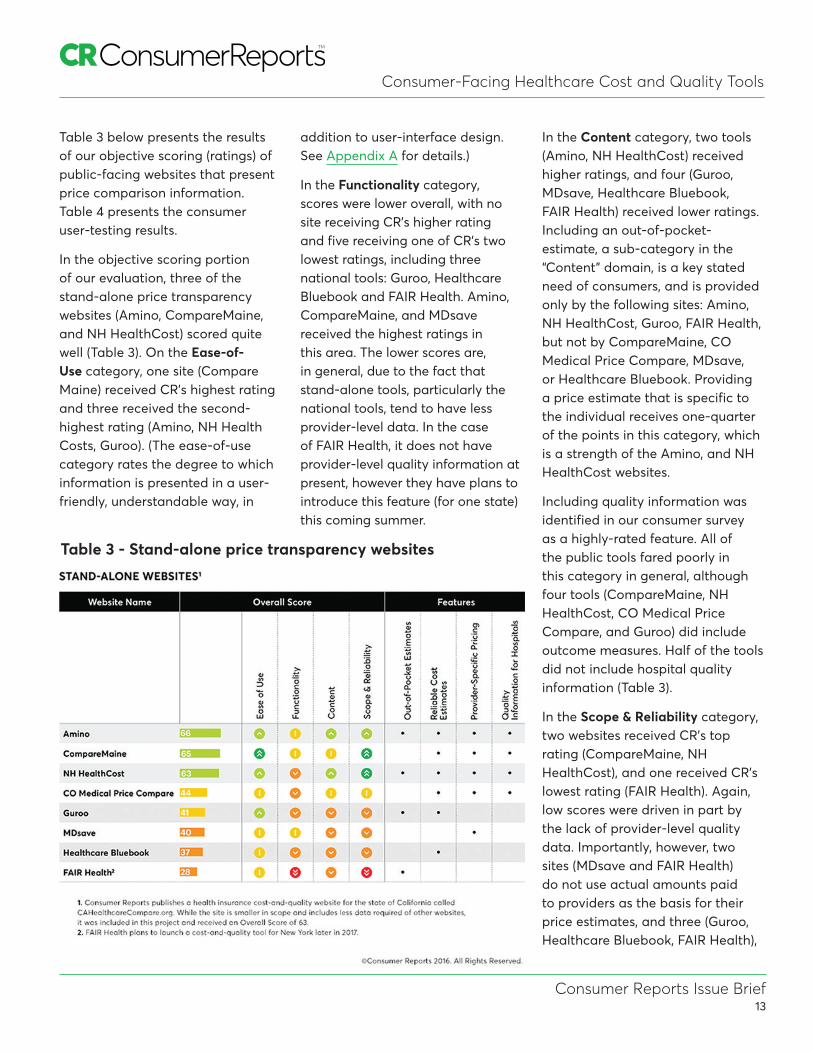
Table 3 below presents the results of our objective scoring (ratings) of public-facing websites that present price comparison information. Table 4 presents the consumer user-testing results.
In the objective scoring portion of our evaluation, three of the stand-alone price transparency websites (Amino, CompareMaine, and NH HealthCost) scored quite well (Table 3). On the Ease-of-Use category, one site (Compare Maine) received CR’s highest rating and three received the second-highest rating (Amino, NH Health Costs, Guroo). (The ease-of-use category rates the degree to which information is presented in a user-friendly, understandable way, in
addition to user-interface design. See Appendix A for details.)
In the Functionality category, scores were lower overall, with no site receiving CR’s higher rating and five receiving one of CR’s two lowest ratings, including three national tools: Guroo, Healthcare Bluebook and FAIR Health. Amino, CompareMaine, and MDsave received the highest ratings in this area. The lower scores are, in general, due to the fact that stand-alone tools, particularly the national tools, tend to have less provider-level data. In the case of FAIR Health, it does not have provider-level quality information at present, however they have plans to introduce this feature (for one state) this coming summer.
In the Content category, two tools (Amino, NH HealthCost) received higher ratings, and four (Guroo, MDsave, Healthcare Bluebook, FAIR Health) received lower ratings. Including an out-of-pocket-estimate, a sub-category in the “Content” domain, is a key stated need of consumers, and is provided only by the following sites: Amino, NH HealthCost, Guroo, FAIR Health, but not by CompareMaine, CO Medical Price Compare, MDsave, or Healthcare Bluebook. Providing a price estimate that is specific to the individual receives one-quarter of the points in this category, which is a strength of the Amino, and NH HealthCost websites.
Including quality information was identified in our consumer survey as a highly-rated feature. All of the public tools fared poorly in this category in general, although four tools (CompareMaine, NH HealthCost, CO Medical Price Compare, and Guroo) did include outcome measures. Half of the tools did not include hospital quality information (Table 3).
In the Scope & Reliability category, two websites received CR’s top rating (CompareMaine, NH HealthCost), and one received CR’s lowest rating (FAIR Health). Again, low scores were driven in part by the lack of provider-level quality data. Importantly, however, two sites (MDsave and FAIR Health) do not use actual amounts paid to providers as the basis for their price estimates, and three (Guroo, Healthcare Bluebook, FAIR Health),
Table 3 - Stand-alone price transparency websites
Consumer Reports Issue Brief14
Consumer-Facing Healthcare Cost and Quality Tools
do not provide provider-specific pricing. (See Table 3.) Finally, the three highest-scoring sites (Amino, CompareMaine, NH HealthCost) are the only public tools that can provide estimates that are specific to a user’s health insurance company.
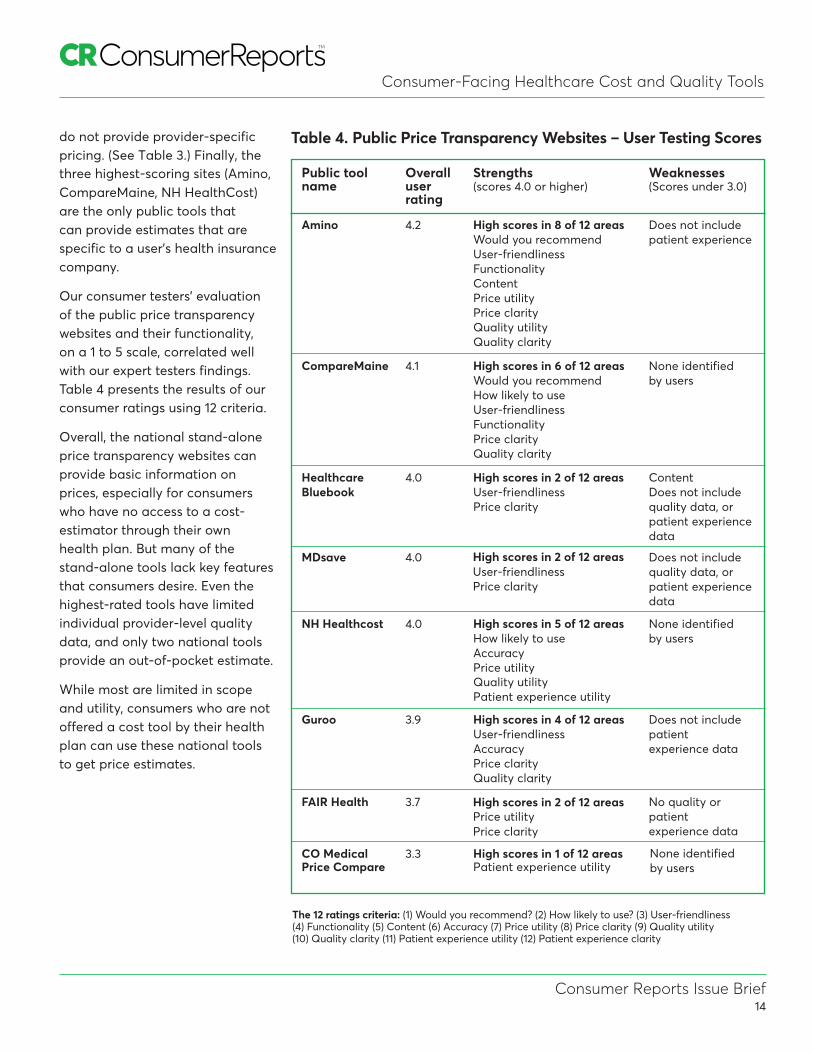
Our consumer testers’ evaluation of the public price transparency websites and their functionality, on a 1 to 5 scale, correlated well with our expert testers findings. Table 4 presents the results of our consumer ratings using 12 criteria.
Overall, the national stand-alone price transparency websites can provide basic information on prices, especially for consumers who have no access to a cost-estimator through their own health plan. But many of the stand-alone tools lack key features that consumers desire. Even the highest-rated tools have limited individual provider-level quality data, and only two national tools provide an out-of-pocket estimate.
While most are limited in scope and utility, consumers who are not offered a cost tool by their health plan can use these national tools to get price estimates.
Public tool Overall Strengths Weaknesses name user (scores 4.0 or higher) (Scores under 3.0)
rating
Amino 4.2 High scores in 8 of 12 areas Does not include Would you recommend patient experience User-friendliness Functionality Content Price utility Price clarity Quality utility Quality clarity
CompareMaine 4.1 High scores in 6 of 12 areas None identified Would you recommend by users How likely to use User-friendliness Functionality Price clarity Quality clarity
Healthcare 4.0 High scores in 2 of 12 areas Content Bluebook User-friendliness Does not include
Price clarity quality data, or patient experience data
MDsave 4.0 Does not include quality data, or patient experience
High scores in 2 of 12 areas User-friendliness Price clarity
data
NH Healthcost 4.0 None identified by users
High scores in 5 of 12 areas How likely to use AccuracyPrice utility Quality utilityPatient experience utility
Guroo 3.9 High scores in 4 of 12 areas Does not include User-friendliness patient Accuracy experience data Price clarity Quality clarity
FAIR Health 3.7 No quality or patient experience data
CO Medical 3.3 Price Compare
High scores in 1 of 12 areasPatient experience utility
Table 4. Public Price Transparency Websites – User Testing Scores
The 12 ratings criteria: (1) Would you recommend? (2) How likely to use? (3) User-friendliness (4) Functionality (5) Content (6) Accuracy (7) Price utility (8) Price clarity (9) Quality utility (10) Quality clarity (11) Patient experience utility (12) Patient experience clarity
None identified by users
High scores in 2 of 12 areas Price utilityPrice clarity
Consumer Reports Issue Brief15
Consumer-Facing Healthcare Cost and Quality Tools
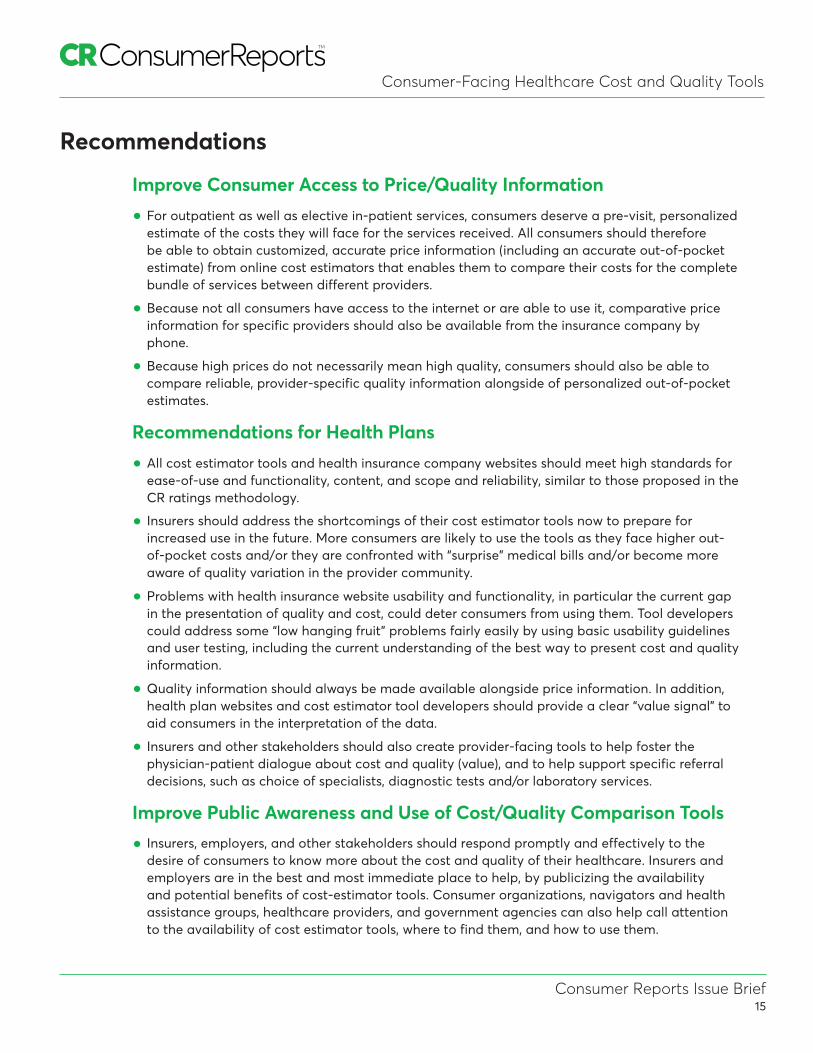
Recommendations
Improve Consumer Access to Price/Quality Information
• For outpatient as well as elective in-patient services, consumers deserve a pre-visit, personalizedestimate of the costs they will face for the services received. All consumers should thereforebe able to obtain customized, accurate price information (including an accurate out-of-pocketestimate) from online cost estimators that enables them to compare their costs for the completebundle of services between different providers.
• Because not all consumers have access to the internet or are able to use it, comparative priceinformation for specific providers should also be available from the insurance company byphone.
• Because high prices do not necessarily mean high quality, consumers should also be able tocompare reliable, provider-specific quality information alongside of personalized out-of-pocketestimates.
Recommendations for Health Plans
• All cost estimator tools and health insurance company websites should meet high standards forease-of-use and functionality, content, and scope and reliability, similar to those proposed in theCR ratings methodology.
• Insurers should address the shortcomings of their cost estimator tools now to prepare for increased use in the future. More consumers are likely to use the tools as they face higher out-of-pocket costs and/or they are confronted with “surprise” medical bills and/or become more aware of quality variation in the provider community.
• Problems with health insurance website usability and functionality, in particular the current gapin the presentation of quality and cost, could deter consumers from using them. Tool developerscould address some “low hanging fruit” problems fairly easily by using basic usability guidelinesand user testing, including the current understanding of the best way to present cost and qualityinformation.
• Quality information should always be made available alongside price information. In addition,health plan websites and cost estimator tool developers should provide a clear “value signal” toaid consumers in the interpretation of the data.
• Insurers and other stakeholders should also create provider-facing tools to help foster thephysician-patient dialogue about cost and quality (value), and to help support specific referraldecisions, such as choice of specialists, diagnostic tests and/or laboratory services.
Improve Public Awareness and Use of Cost/Quality Comparison Tools
• Insurers, employers, and other stakeholders should respond promptly and effectively to the desire of consumers to know more about the cost and quality of their healthcare. Insurers and employers are in the best and most immediate place to help, by publicizing the availability and potential benefits of cost-estimator tools. Consumer organizations, navigators and health assistance groups, healthcare providers, and government agencies can also help call attention to the availability of cost estimator tools, where to find them, and how to use them.
Consumer Reports Issue Brief16
Consumer-Facing Healthcare Cost and Quality Tools
16 Healthcare Cost Institute, “Spending on Shoppable Services in Healthcare,” March 2016. Available at: http://www.healthcostinstitute.org/issue-brief-shoppable-services
17 Consumers Union Healthcare Value Hub, “Rethinking Consumerism in Healthcare Benefit Design”, April, 2016, Available at: http://www.healthcarevaluehub.org/files/1114/6159/5792/Rethinking_Consumerism_Final.pdf
18 Op. cit. 17.
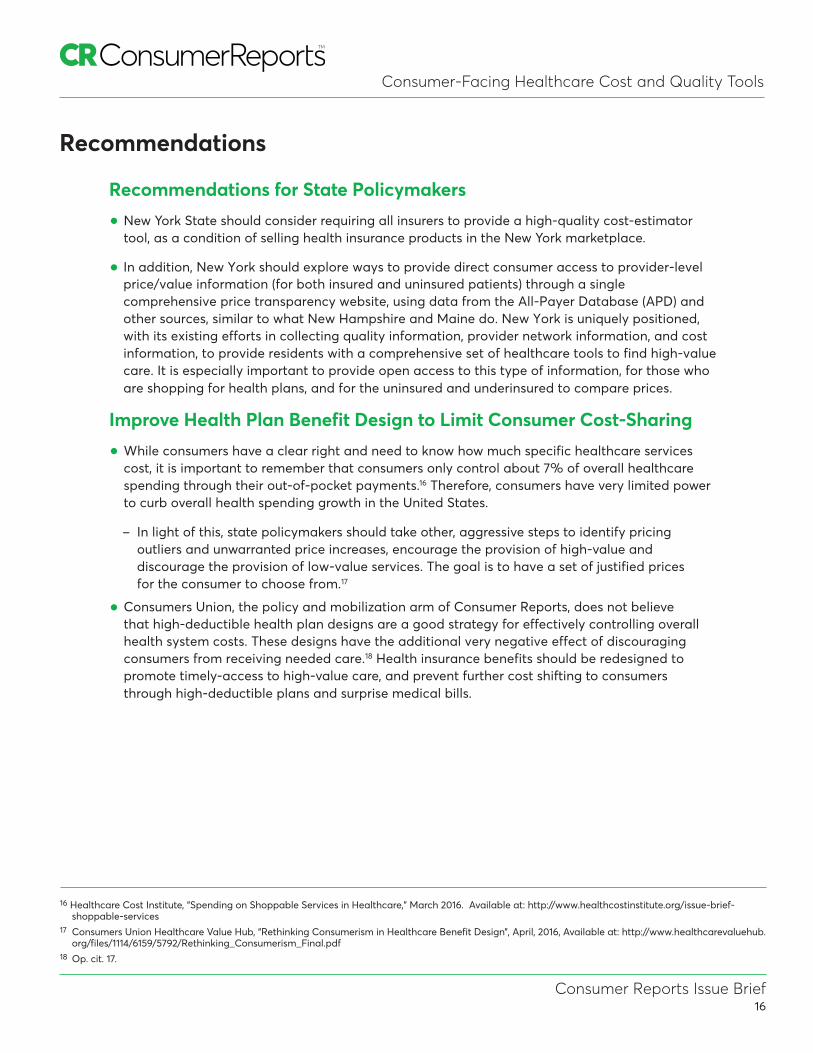
Recommendations
Recommendations for State Policymakers
• New York State should consider requiring all insurers to provide a high-quality cost-estimatortool, as a condition of selling health insurance products in the New York marketplace.
• In addition, New York should explore ways to provide direct consumer access to provider-level price/value information (for both insured and uninsured patients) through a single comprehensive price transparency website, using data from the All-Payer Database (APD) and other sources, similar to what New Hampshire and Maine do. New York is uniquely positioned, with its existing efforts in collecting quality information, provider network information, and cost information, to provide residents with a comprehensive set of healthcare tools to find high-value care. It is especially important to provide open access to this type of information, for those who are shopping for health plans, and for the uninsured and underinsured to compare prices.
Improve Health Plan Benefit Design to Limit Consumer Cost-Sharing
• While consumers have a clear right and need to know how much specific healthcare servicescost, it is important to remember that consumers only control about 7% of overall healthcarespending through their out-of-pocket payments.16 Therefore, consumers have very limited powerto curb overall health spending growth in the United States.
− In light of this, state policymakers should take other, aggressive steps to identify pricingoutliers and unwarranted price increases, encourage the provision of high-value and discourage the provision of low-value services. The goal is to have a set of justified prices for the consumer to choose from.17
• Consumers Union, the policy and mobilization arm of Consumer Reports, does not believethat high-deductible health plan designs are a good strategy for effectively controlling overallhealth system costs. These designs have the additional very negative effect of discouragingconsumers from receiving needed care.18 Health insurance benefits should be redesigned topromote timely-access to high-value care, and prevent further cost shifting to consumersthrough high-deductible plans and surprise medical bills.
Consumer Reports Issue Brief17
Consumer-Facing Healthcare Cost and Quality Tools
Consumer Advice: How to Use Your Health Insurer’s Cost Estimator Tool
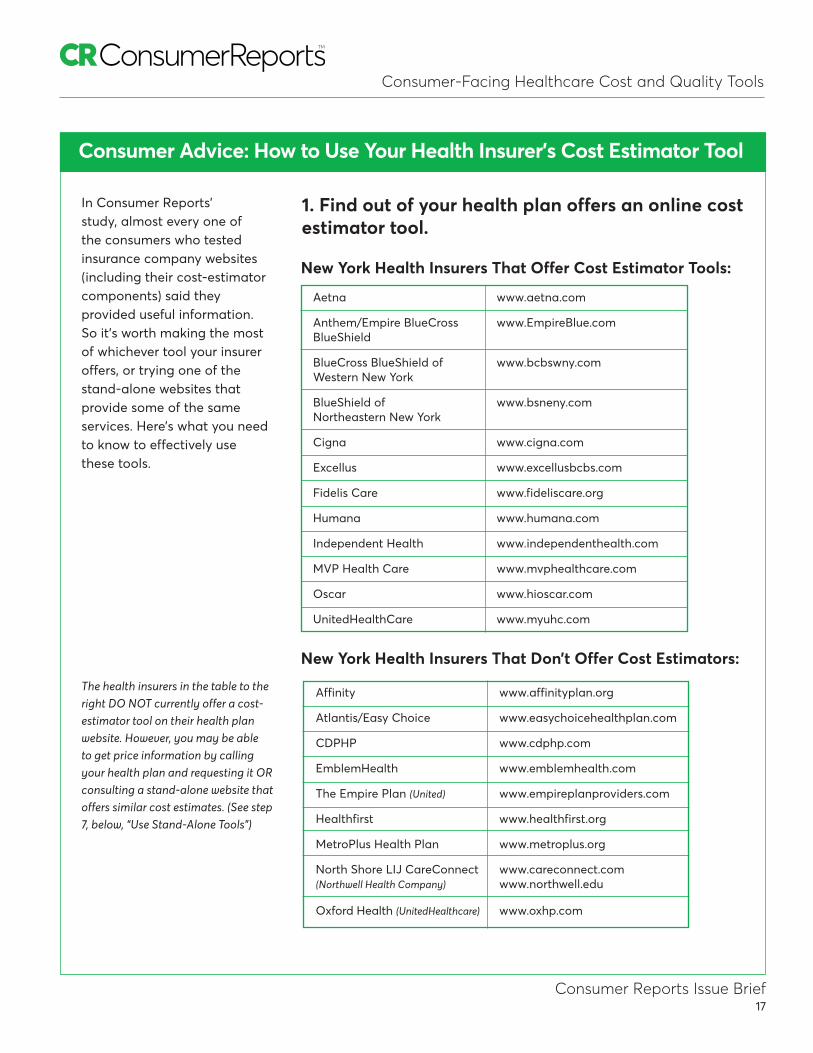
In Consumer Reports’ study, almost every one of the consumers who tested insurance company websites (including their cost-estimator components) said they provided useful information. So it’s worth making the most of whichever tool your insurer offers, or trying one of the stand-alone websites that provide some of the same services. Here’s what you need to know to effectively use these tools.
New York Health Insurers That Offer Cost Estimator Tools:
Aetna www.aetna.com
Anthem/Empire BlueCross www.EmpireBlue.com BlueShield
BlueCross BlueShield of www.bcbswny.com Western New York
BlueShield of www.bsneny.com Northeastern New York
Cigna www.cigna.com
Excellus www.excellusbcbs.com
Fidelis Care www.fideliscare.org
Humana www.humana.com
Independent Health www.independenthealth.com
MVP Health Care www.mvphealthcare.com
Oscar www.hioscar.com
UnitedHealthCare www.myuhc.com
1. Find out of your health plan offers an online costestimator tool.
New York Health Insurers That Don’t Offer Cost Estimators:
The health insurers in the table to the right DO NOT currently offer a cost-estimator tool on their health plan website. However, you may be able to get price information by calling your health plan and requesting it OR consulting a stand-alone website that offers similar cost estimates. (See step 7, below, “Use Stand-Alone Tools”)
Affinity www.affinityplan.org
Atlantis/Easy Choice www.easychoicehealthplan.com
CDPHP www.cdphp.com
EmblemHealth www.emblemhealth.com
The Empire Plan (United) www.empireplanproviders.com
Healthfirst www.healthfirst.org
MetroPlus Health Plan www.metroplus.org
North Shore LIJ CareConnect www.careconnect.com (Northwell Health Company) www.northwell.edu
Oxford Health (UnitedHealthcare) www.oxhp.com

Consumer Reports Issue Brief18
Consumer-Facing Healthcare Cost and Quality Tools
2. Set up a username and password.
Go to your health plan website, which includes the cost estimator tool. With almost all of the tools, signing in also gives you access to your claims history and price information based on how much of your deductible you’ve used up. Save your log-in info. Several plans didn’t recognize members from one visit to the next.
3. Get familiar with your plan’sbenefits and rules.
Sure, you may know your deductible, but do you know whether there’s a co-pay (a specific dollar amount) or coinsurance (a percentage of the bill) for a doctor visit, an imaging test, or a hospital stay? Does your plan cover some services, such as primary care visits, before you’ve met your deductible? Almost all of the plans we reviewed made it easy to find those details.
4. Use the tool to find providers – butverify the information.
Every tool included a list of participating doctors, hospitals, labs, and other providers. Some, such as UnitedHealthcare and Blue Cross Blue Shield, had better tools for narrowing your search. We couldn’t independently check the accuracy of the provider directories, but other research suggests they’re not always up-to-date. So once you’ve narrowed your choices, call your insurer and the providers to double-check that they’ll take your specific plan.
5. Comparison shop when you canplan ahead.
You can’t always shop around for healthcare. After all, you’re not going to compare prices in an ambulance after a heart attack. But you can and should shop around for many tests and treatments
Amino www.amino.com
Guroo www.guroo.com
MDsave www.mdsave.com
Healthcare Bluebook www.healthcarebluebook.com
FairHealth www.fairhealthconsumer.org
that are common and can vary widely in price, such as MRIs, lab tests, joint replacements, biopsies, hernia repair, or childbirth. All of the tools we evaluated allow those sorts of searches, though they don’t always list prices that are specific to the member’s personal plan. And note that the tools can sometimes be difficult to find on the websites. So look for the words “cost” and “quality” in the tool’s navigation.
6. Check for quality.
The best tools present information on the quality of care provided by doctors and hospitals, such as complication rates or patient satisfaction scores, along with cost. That helps you choose providers that offer the best overall value. Cigna, for instance, shows cost and quality side by side with a value sign to help identify high quality, low cost providers . Even if your insurer offers info on quality, check other sources, too, notably Consumer Reports’ hospital ratings (go to CR.org/hospital-ratings). And note that higher cost doesn’t always mean higher quality.
7. Use stand-alone tools.
If your health plan doesn’t provide price information, use public websites, such as Amino, Guroo, MDsave, Healthcare Bluebook or FAIR Health. You can still look up the range of prices and average prices by using one of the free public price tools we also evaluated. That can give you a sense of a fair price for the services you’re interested in, which you can then compare with prices quoted by your insurer, doctor, or other provider.
Consumer Reports Issue Brief19
Consumer-Facing Healthcare Cost and Quality Tools
Funding: Support for this work was provided in part by the New York State Health Foundation (NYSHealth). The mission of NYSHealth is to expand health insurance coverage, increase access to high-quality healthcare services, and improve public and community health. The views presented here are those of the authors and not necessarily those of the New York State Health Foundation or its directors, officers, and staff.
Disclosures: Consumer Reports licenses its patient-experience data to Cigna but has no financial relationship with Cigna, and Cigna played no role in developing the ratings criteria. Consumer Reports publishes a free website for consumers in California that has regional cost data and provider-level quality data (CAHealthcareCompare). CAHealthcare Compare was included in the study of public tools and it was mentioned in the accompanying publication to this method.
During the period this report was produced, Chuck Bell of Consumers Union served as a member of the Board of Directors for FAIR Health, one of the rated websites, as an individual representative for consumers. However, he was on a leave of absence from the Board during this period. He also did not participate in the development of CR’s ratings rubric for this report, or the expert site review and web usability testing process.
You can download this issue brief, and a copy of our NY subscriber insert featuring ratings of NY Health Plan cost and quality tool, at: www.CR.org/NY-health-cost-estimators
For more information about this project, contact:
ATTN: CR Health Ratings Center 101 Truman Avenue Yonkers, NY 10703 E-mail: [email protected]
@2016 Consumer Reports