consumer learning and hybrid vehicle adoption learning and hybrid vehicle adoption garth heutel...
TRANSCRIPT

Consumer Learning and Hybrid Vehicle Adoption Faculty Research Working Paper Series
Garth Heutel University of North Carolina at Greensboro
Erich Muehlegger Harvard Kennedy School
April 2010 RWP10-013
The views expressed in the HKS Faculty Research Working Paper Series are those of the author(s) and do not necessarily reflect those of the John F. Kennedy School of Government or of Harvard University. Faculty Research Working Papers have not undergone formal review and approval. Such papers are included in this series to elicit feedback and to encourage debate on important public policy challenges. Copyright belongs to the author(s). Papers may be downloaded for personal use only.
www.hks.harvard.edu

Consumer Learning and Hybrid Vehicle Adoption
Garth Heutel
Erich Muehlegger
April 2010
Abstract
We study the diffusion of hybrid vehicles among consumers. Using data on sales of 11 different models over seven years, we identify the effect of the penetration rate – total cumulative hybrid sales per capita – on new hybrid purchases. The penetration rate significantly affects new purchases, and the effect differs by hybrid model. In particular, we find a positive diffusion effect from the Toyota Prius and a negative diffusion effect from the Honda Insight, with elasticities of 0.23 to 0.85 for the Prius and –0.08 to –0.32 for the Insight. This finding is consistent with our model of model–specific learning along with anecdotal evidence that early Insight models were perceived to be of lower quality than Prius models. Higher Insight penetration rates gave a negative signal about hybrid quality and inhibited rather than promoted hybrid adoption. The findings are relevant for policy designed to promote new technologies. JEL Codes: Q55, O33, D83 Garth Heutel Department of Economics University of North Carolina at Greensboro PO Box 26165 Greensboro, NC 27402 [email protected] Erich Muehlegger Harvard Kennedy School 79 JFK Street, Mailbox 25 Cambridge, MA 02142 [email protected] We thank Polk and JD Power and Associates for data. In addition, we thank Jim Sallee and seminar participants at UNCG, Columbia, and the 2010 ASSA meetings for helpful comments and suggestions.

2
Hybrid electric vehicles are alternatives to conventional, internal combustion engine
automobiles that achieve higher fuel economy by combining a conventional engine with a
rechargeable battery. The increased fuel economy of hybrids is attractive because of concerns
about both climate change and energy security. Transportation accounts for almost one-half of
US carbon dioxide emissions, and almost one-half of all petroleum consumed in the US ends up
as motor gasoline. Hybrid cars are capturing an increasing share of the domestic automobile
market, rising from 0.4% of all retail sales in May 2004 to 3.6% in July 2009. As hybrids are a
small but growing component of the vehicle fleet, and may be a significant component of a
national strategy to deal with climate or energy security, it is important to know what influences
consumers' decisions to buy hybrids rather than conventional vehicles. Because hybrids are a
newer technology, issues arise that are similar to those involved with the diffusion of all new
technologies.
Few studies have examined the determinants of hybrid adoption. This paucity is partly
explained by the lack of significant data on this new technology.1
The purpose of this paper is to study the diffusion of hybrid cars among consumers, and
in particular to estimate the effects of learning on consumers' decisions to adopt hybrid cars. We
use data on new sales of 11 different hybrid models at the state-quarter level from 2000-2006 and
estimate a diffusion model, where the decision to purchase a hybrid is affected by economic
incentives, including the price of gasoline and tax incentives for hybrids, as well as the
cumulative penetration rate of hybrid vehicles in a particular state. We also present a model of
Gallagher and Muehlegger
(2008) examine the role that state and federal incentives, gas prices, and consumer preferences
have on hybrid adoption. All three had positive effects, but the magnitude was largest for gas
prices and consumer preferences. Kahn (2007) uses data from California and finds that
environmentalists, as proxied by a community's share of Green Party voters, are more likely to
drive hybrids. On the other hand, many other examples of technological diffusion have been
widely studied. For example, Andonova (2006) and Iimi (2005) study the diffusion of cellular
phones, and Goolsbee and Klenow (2002) study the diffusion of home computers. As that final
paper emphasizes, learning plays an important role in new technology diffusion.
1 The Consumer Expenditure Survey, for example, contains data on vehicle ownership, but it only first asked respondents the fuel type of the vehicle (gasoline, diesel, or hybrid) in 2005. The 2006 data set only contains 119 observations of hybrid vehicles, out of more than 56,000 automobile observations.
3
consumer choice between hybrids and conventional cars, where learning about the quality of
hybrids overall or a particular make or model of hybrid affects the agent's decision-making.
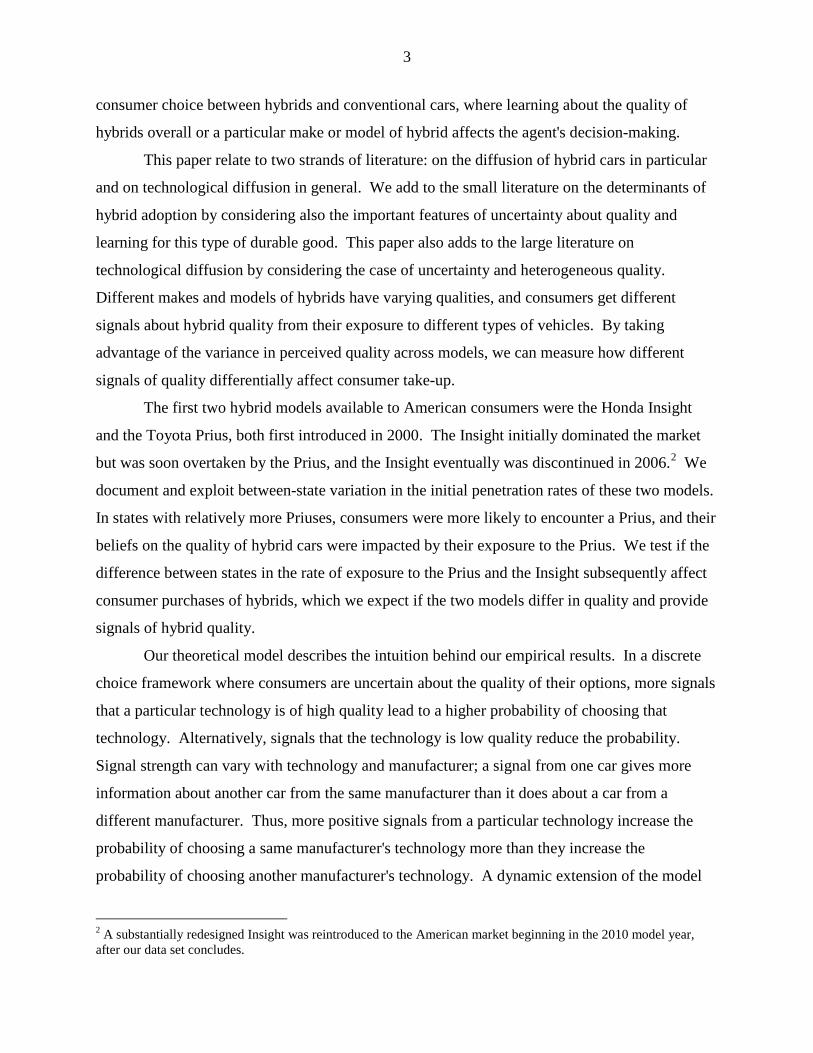
This paper relate to two strands of literature: on the diffusion of hybrid cars in particular
and on technological diffusion in general. We add to the small literature on the determinants of
hybrid adoption by considering also the important features of uncertainty about quality and
learning for this type of durable good. This paper also adds to the large literature on
technological diffusion by considering the case of uncertainty and heterogeneous quality.
Different makes and models of hybrids have varying qualities, and consumers get different
signals about hybrid quality from their exposure to different types of vehicles. By taking
advantage of the variance in perceived quality across models, we can measure how different
signals of quality differentially affect consumer take-up.
The first two hybrid models available to American consumers were the Honda Insight
and the Toyota Prius, both first introduced in 2000. The Insight initially dominated the market
but was soon overtaken by the Prius, and the Insight eventually was discontinued in 2006.2
Our theoretical model describes the intuition behind our empirical results. In a discrete
choice framework where consumers are uncertain about the quality of their options, more signals
that a particular technology is of high quality lead to a higher probability of choosing that
technology. Alternatively, signals that the technology is low quality reduce the probability.
Signal strength can vary with technology and manufacturer; a signal from one car gives more
information about another car from the same manufacturer than it does about a car from a
different manufacturer. Thus, more positive signals from a particular technology increase the
probability of choosing a same manufacturer's technology more than they increase the
probability of choosing another manufacturer's technology. A dynamic extension of the model
We
document and exploit between-state variation in the initial penetration rates of these two models.
In states with relatively more Priuses, consumers were more likely to encounter a Prius, and their
beliefs on the quality of hybrid cars were impacted by their exposure to the Prius. We test if the
difference between states in the rate of exposure to the Prius and the Insight subsequently affect
consumer purchases of hybrids, which we expect if the two models differ in quality and provide
signals of hybrid quality.
2 A substantially redesigned Insight was reintroduced to the American market beginning in the 2010 model year, after our data set concludes.

4
demonstrates how the signaling effect decays over time; eventually all consumers are sufficiently
knowledgeable about all technologies and no longer rely on the signals.
Empirically, we find significant diffusion effects for hybrid cars that differ by model. A
higher Prius penetration rate leads to more purchases of all models of hybrids, whereas a higher
Insight penetration rate leads to fewer purchases. We estimate that the elasticity of hybrid sales
with respect to the market penetration of the Prius in a state is 0.85, whereas the elasticity with
respect to the market penetration of the Insight is –0.32. Our explanation is that the Insight sends
a "bad" signal about hybrid quality and the Prius sends a "good" signal. This is consistent with
anecdotal evidence that the Insight was perceived to be of lower quality than the Prius. Articles
in the popular press and reviews from Consumer Reports buttress this claim.
We also find patterns consistent with consumers' inference of both model-quality and
technology-quality; Prius penetration has a large positive effect on Prius sales, but also has a
positive effect on all other hybrid sales as well. Insight penetration, on the other hand, has a
large negative effect on subsequent sales that seems to be largely specific to the Insight. The
discrete choice model that we develop with learning about differentiated technologies
demonstrates how signals from different hybrid models can have these differential effects.
The first section below summarizes the literature on hybrid cars and technological
diffusion. The second section presents our models of hybrid diffusion. In the third section we
describe our data set, and in the fourth section we present our results. The final section
concludes.
I. Previous Literature
Conventional automobiles are powered by an internal combustion engine (ICE) running
on gasoline or diesel fuel. Battery electric vehicles are powered by rechargeable battery packs,
but typically have less acceleration performance and limited mileage between charge-ups.
Though electric vehicles have zero emissions, the electricity generated to recharge the batteries is
usually produced by burning fossil fuels. Taking this into account, electric vehicles still produce
less carbon dioxide (CO2) emissions per mile. A hybrid electric vehicle combines the two types
of propulsion systems, where the ICE can be used to recharge the battery as well. Furthermore,
hybrids can capture some of the energy that is wasted in conventional cars, such as from braking,
and use that to recharge, improving their fuel economy even further. Hybrids lack the

5
disadvantage of battery-only electric vehicles of having limited mileage between lengthy
recharges. Some hybrids can also be made to "plug in," so that the battery can be recharged
either by the ICE or from the electricity from a wall socket. Plug-in hybrids, though, were not
commercially available during our sample period and thus are not represented in our data set.
Though hybrids have been produced for more than 100 years, at least since Ferdinand
Porsche designed the "Mixte" in 1901, they have not been widely commercially available until
the late 1990s, when the Toyota Prius and the Honda Insight were introduced. The 2010 model
year features 27 hybrid models. The Prius is the most popular model, surpassing one million
worldwide cumulative sales in May 2008, and is the most fuel efficient car sold in the US,
according to the EPA.
Because of the small market share and the recent introduction of hybrids, few economics
papers study these cars specifically. Gallagher and Muehlegger (2008) examine the effect of
federal, state and local incentives on consumer hybrid adoption. Using the same data set that we
describe here below, they estimate how much of the growth in hybrid adoption is due to these
incentives, how much is due to gasoline prices, and how much to preferences for the
environmental and energy security. Each of these factors has a significant effect, with
preferences and gasoline prices having the largest. Preferences are proxied for by per-capita
Sierra Club membership, quarterly deviation from average temperatures (to measure the salience
of climate change) and per capital military participation and war casualties (to measure salience
of anti-war sentiment).
Sallee (2008) also focuses on tax incentives for hybrid cars but estimates the incidence of
those incentives specifically for sales of the Toyota Prius. He finds that consumers captured a
majority of the subsidies, despite the fact that Toyota faced capacity constraints because of
excess demand for the Prius during his period of analysis. The offered explanation is that an
increase in retail price would have reduced future demand, and so dynamic considerations led to
Toyota declining to capture the subsidies. Kahn (2007) estimates the effect of preferences for
environmental quality on hybrid purchases. Using data from California and proxying for
environmentalism with a community's share of Green Party voters, he finds that
environmentalists are more likely to buy hybrids, as well as use public transit and consume less
gasoline. De Haan et. al. (2006) use Swiss data on buyers of the Prius to test for evidence of a
rebound effect from its purchase. While the most apparent rebound effect is probably the
6
decision to drive more miles in a car that is more fuel efficient, they do not test for this effect
(since they lack data on miles driven). Rather, they test for two other rebound effects. First,
hybrid buyers could have switched from already fuel-efficient cars to the Prius. Second, average
vehicle ownership could increase, if hybrid buyers are using the hybrid in addition to, rather than
instead of, another car. They find no evidence of either rebound effect from a survey of 367
Prius buyers. Lamberson (2009) fits data on aggregate US hybrid sales to two diffusion models:
the Bass model and the Gompertz model. The Gompertz model forecasts higher future growth
rates of the hybrid market and is more consistent with industry expectations.3
The diffusion of a new technology through the economy is an important question and one
especially relevant to climate policy. Not only hybrid cars, but low carbon technologies like
carbon capture and storage (CCS) are potentially essential ingredients to an effective policy
regime to combat climate change. Though the economics literature is sparse when it comes to
hybrid cars, it is fortunately rich with papers that study the diffusion of other technologies.
Geroski (2000) provides a survey of the literature on technological diffusion, and he focuses on
explanations of the dominant stylized fact: the usage of new technologies over time typically
follows an S-curve. Of particular interest in our paper is the effect of learning and externalities
on the diffusion of technologies. Manski (2000) reviews the literature on social interactions in
general, where the actions of some users may affect the actions or outcomes of other users.
Heidhues and Melissas (2006) provide a model of technology adoption with cohort and network
effects. Peer effects have also recently been studied in the choice of employee retirement plans
(Duflo and Saez 2002), health care plans (Sorensen 2006), and medical procedures in developing
countries (Kremer and Miguel 2007).
Goolsbee and Klenow (2002) look for learning and networking effects in the diffusion of
a consumer technology, home computers. Using cross-sectional data on 110,000 households in
1997, they find spillover effects from computer users: households are more likely to buy home
computers in areas where more of their neighbors own computers. This peer effect is larger for
heavy computer users and with use of the internet and email, consistent with network effects.
A focus of our empirical analysis is heterogeneity in the new technology. How do
different models of hybrid cars differentially affect diffusion among consumers? Models of the
3 Papers that study the diffusion of non-hybrid automobiles in a similar fashion include Lescaroux and Rech (2008), Medlock and Soligo (2002), and Greenman (1996).

7
diffusion of heterogeneous technologies extend back at least to Jensen (1983), who models a
firm's choice among two competing technologies, about which firms are uncertain. In Jensen's
model, adopting one technology gives the firm information about its quality, which the firm uses
to update its prior beliefs about that quality. Colombo and Mosconi (1995) and Stoneman and
Toivanen (1997) also model the adoption decision among a variety of technologies with
uncertain payoffs, although learning in these models comes exogenously from the time since
which they were introduced.4
Finally, the diffusion of energy efficient and low carbon technologies is a vitally
important question relevant to climate policy. McFarland and Herzog (2006) incorporate
technological change, specifically CCS, into an integrated assessment model of climate change.
They use bottom-up engineering estimates of cost functions for various abatement technologies
and simulate how different policies would affect diffusion of these technologies in the energy
industry. Rose and Joskow (1990) also study the diffusion of new technologies in the electricity
generation industry. They find that larger firms and investor owned utilities are more likely to
adopt new technologies than are smaller or publicly owned firms.
II. Model of Diffusion and Learning
We present a model of hybrid vehicle adoption that captures inferential learning.
Prospective hybrid vehicle buyers observe vehicles on the road and from their observations
update prior beliefs about hybrid quality. We first develop a static model in which the
comparative statics are easy to derive. We then generalize the model by allowing consumers to
dynamically optimize, to investigate diffusion over time. Our model incorporates both
"epidemic" learning effects from Griliches (1957) and choice among competing technologies as
in Jensen (1983). We focus on consumer decisions and disregard other issues, including
producer pricing decisions.
First consider a static discrete choice model. Consumers choose the vehicle with the
highest utility, where the utility to consumer i of purchasing vehicle Jj∈ is given by
ijjjij XU εηθ ++⋅= ˆ ,
4 Young (2009) models diffusion and learning with heterogeneity among consumers, not technologies.

8
where Xj is a vector of vehicle attributes, εij is a mean-zero IID error term with a Type I
extreme value distribution, and jη is the consumer's assessment of the quality of hybrid vehicle
j, normalizing the quality of non-hybrid vehicles to zero. The true quality of hybrid j,
unobservable to the consumer, is ηj.
Consumer i receives n unbiased, independent signals of vehicle quality, ωi1,…,ωin.
Each signal gives information on one model – if the kth signal is about model j then ωik = ηj +
ν, where ηj is the true quality of vehicle j and ν ~ N(0, σj2). These signals can be thought of as
observations of actual cars, and so the probability with which the signal provides information
about a particular model depends on the market share of the vehicle. If a model a's market share
is 5% then the probability with which each of the consumer's signals informs his knowledge
about model a is 5%. Consumer i's assessment of the quality of hybrid j, jη , is a function of
his set of interactions Ωi = ωi1,…,ωin, and it can be generated four different ways. First, if he
receives any signals about model j, then his unbiased estimate of ηj is based on only those
signals received about j: this estimate has a mean value of and a variance of .
Second, if all of the consumer's signals come from non-hybrid cars, then he gets no additional
information on hybrid quality, and his assessment remains at the prior value of jη = η0. Third,
he can get an imperfect signal of the quality of j by observing a hybrid vehicle other than
vehicle j. This signal is stronger if the other vehicle is from the same manufacturer as hybrid j
than if it is from a different manufacturer. If the consumer does not receive any signals about
hybrid j but receives at least one signal about hybrid k made by the same manufacturer as j,
then he forms his assessment of ηj based on those signals only along with his prior belief about
hybrid quality. Thus, the mean value of the consumer's belief is ,
where α is an exogenous weighting parameter. Fourth, if he receives signals only from hybrids
made by a different manufacturer than hybrid j, his assessment's mean value is
, where α > β to indicate that he weights these signals less than
signals from vehicles made by the same manufacturer.
The probability that consumer i purchases vehicle j, conditional on consumer i's
signals Ωi, is given by the standard multinomial logit expression:

9
Jj
kikk
ijjiikijij X
XkUU ηη
ηθηθ
ˆ...ˆ|Pr))(ˆexp(
))(ˆexp()|Pr(|Pr 1=
Ω+
Ω+=Ω∀>=Ω∑
.
The last equality holds because the signals Ωi determine all . Supposing that the
realization of the signals observed only by the individual, one may instead want to know the
probability that consumer i purchases vehicle j conditional only on the initial market shares of
the vehicles. Let s be a vector representing the initial market share distribution, and let be a
vector representing the individual's assessment of quality for all vehicles. Then
ηηηη
ˆ)|ˆ()ˆ|(Pr|Pr ∫= dfjj ss
The function f is the probability density function of the vector conditional on the vector of
market shares s. In general, this integral will not have a closed form solution and must instead be
simulated. We impose additional assumptions here to find an analytical solution (these
assumptions will be dropped in the dynamic model below). First, we suppose that σj2 = 0 for all
models j, so signals contain no noise. Then the must take discrete values, and we can
calculate their probability mass function. Second, assume that the number of signals n equals
one. Then, the number of possible signal combinations is just the number of models. Third,
assume that only four car models exist. Model a is a non-hybrid. Model b is a hybrid
manufactured by firm Y. Models c and d are hybrids manufactured by firm Z. Let the initial
shares of models be given by sa, sb, sc, and sd, which determine the probability of any set of
signals Ωi. Then the probability of purchasing hybrid model c, say, is given by
Prc = (Prc|ωi=ηa) · sa + (Prc|ωi=ηb) · sb + (Prc|ωi=ηc) · sc + (Prc|ωi=ηd) · sd.
We are interested in how this probability changes with the initial distribution of the models.
Since all of the shares must sum to one, we replace sa with 1 – sb – sc – sd. Thus, we consider a
marginal increase in sc accompanied by a marginal decrease in sa and the resulting effect on
hybrid purchase probabilities.
First consider the effect of this change in the initial distribution on the probability of
purchasing model c: (Prc|ω=ηc) – (Prc|ω=ηa). Evaluating and simplifying yields
))])1(exp())(exp(exp()))1(exp())(exp()[exp(exp(
))exp())(exp(exp(Pr
0
00
0
ηααηηθηββηηθη
ηηθ
−+−+−+−+
−=
ccd
ccb
cac
c
XX
XAds
d
.
10
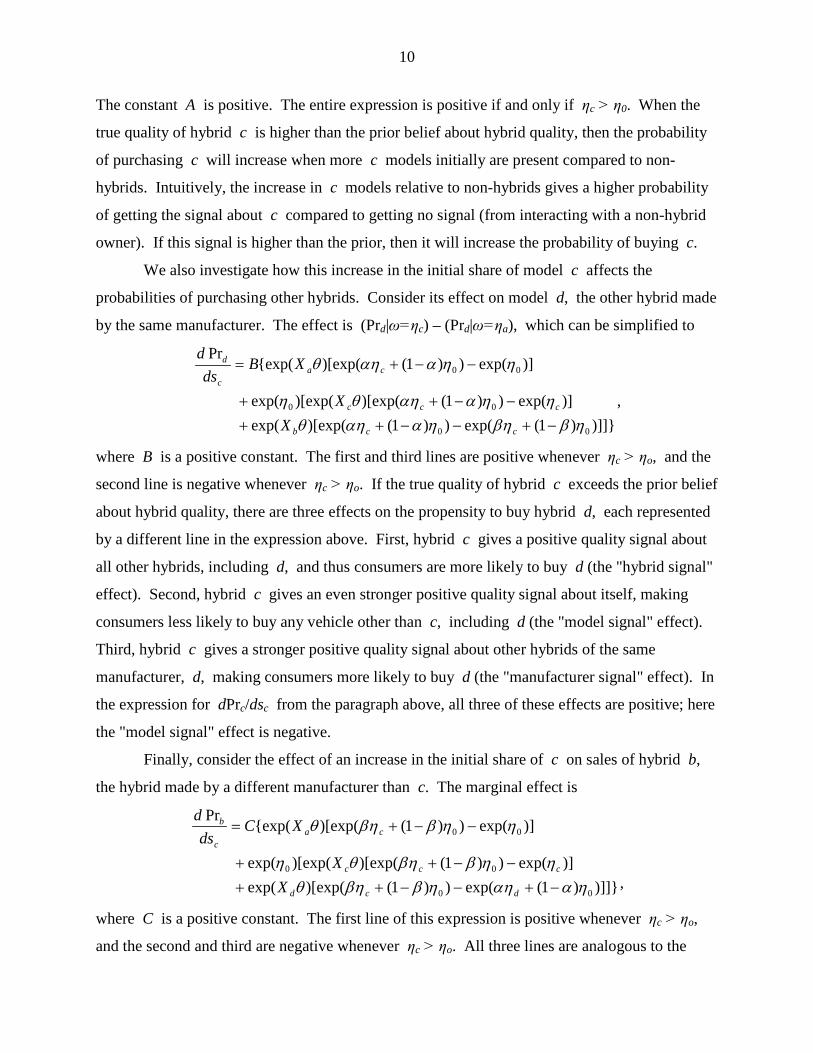
The constant A is positive. The entire expression is positive if and only if ηc > η0. When the
true quality of hybrid c is higher than the prior belief about hybrid quality, then the probability
of purchasing c will increase when more c models initially are present compared to non-
hybrids. Intuitively, the increase in c models relative to non-hybrids gives a higher probability
of getting the signal about c compared to getting no signal (from interacting with a non-hybrid
owner). If this signal is higher than the prior, then it will increase the probability of buying c.
We also investigate how this increase in the initial share of model c affects the
probabilities of purchasing other hybrids. Consider its effect on model d, the other hybrid made
by the same manufacturer. The effect is (Prd|ω=ηc) – (Prd|ω=ηa), which can be simplified to
)]])1(exp())1()[exp(exp()]exp())1()[exp()[exp(exp(
)]exp())1()[exp(exp(Pr
00
00
00
ηββηηααηθηηααηθη
ηηααηθ
−+−−++−−++
−−+=
ccb
ccc
cac
d
XX
XBds
d
,
where B is a positive constant. The first and third lines are positive whenever ηc > ηo, and the
second line is negative whenever ηc > ηo. If the true quality of hybrid c exceeds the prior belief
about hybrid quality, there are three effects on the propensity to buy hybrid d, each represented
by a different line in the expression above. First, hybrid c gives a positive quality signal about
all other hybrids, including d, and thus consumers are more likely to buy d (the "hybrid signal"
effect). Second, hybrid c gives an even stronger positive quality signal about itself, making
consumers less likely to buy any vehicle other than c, including d (the "model signal" effect).
Third, hybrid c gives a stronger positive quality signal about other hybrids of the same
manufacturer, d, making consumers more likely to buy d (the "manufacturer signal" effect). In
the expression for dPrc/dsc from the paragraph above, all three of these effects are positive; here
the "model signal" effect is negative.
Finally, consider the effect of an increase in the initial share of c on sales of hybrid b,
the hybrid made by a different manufacturer than c. The marginal effect is
)]])1(exp())1()[exp(exp()]exp())1()[exp()[exp(exp(
)]exp())1()[exp(exp(Pr
00
00
00
ηααηηββηθηηββηθη
ηηββηθ
−+−−++−−++
−−+=
dcd
ccc
cac
b
XX
XCds
d
,
where C is a positive constant. The first line of this expression is positive whenever ηc > ηo,
and the second and third are negative whenever ηc > ηo. All three lines are analogous to the
11
corresponding lines in the previous expression and the effects they represent. However, the sign
of the third term (the "manufacturer signal" effect) is reversed. Hybrid c gives a weaker signal
about hybrid b than it does about hybrid d, and thus the manufacturer signal effect makes
consumers less likely to buy hybrids from manufacturers other than the maker of c.
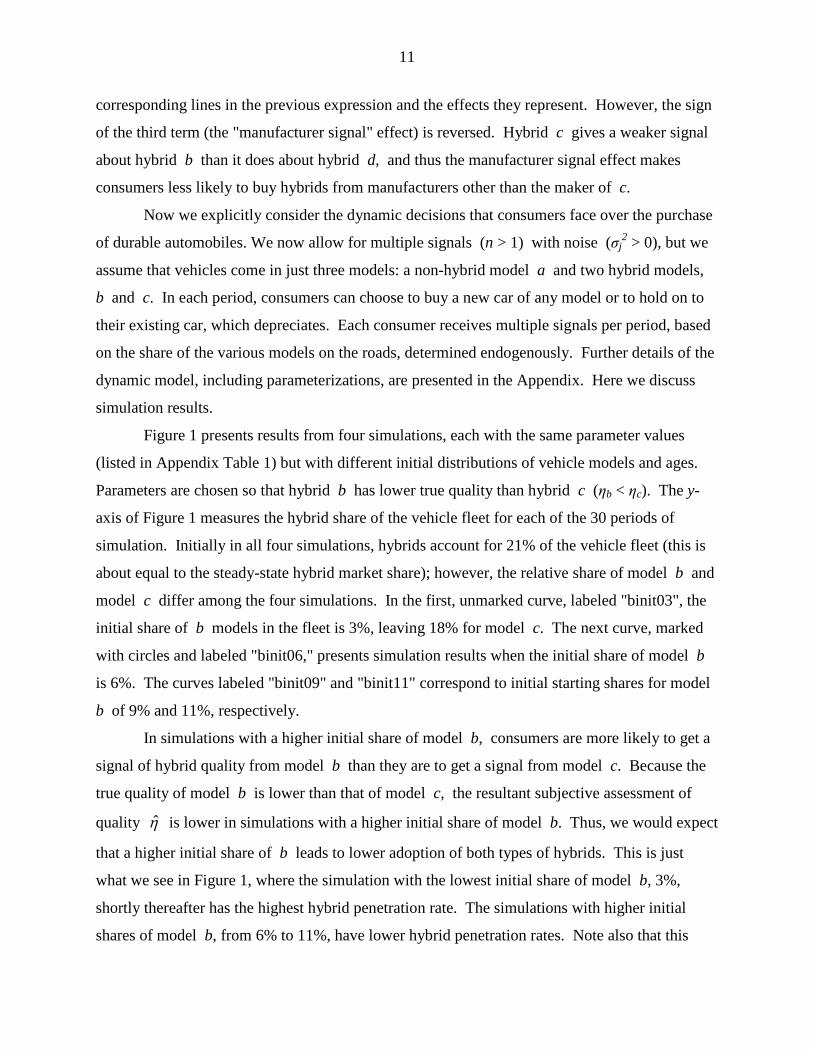
Now we explicitly consider the dynamic decisions that consumers face over the purchase
of durable automobiles. We now allow for multiple signals (n > 1) with noise (σj2 > 0), but we
assume that vehicles come in just three models: a non-hybrid model a and two hybrid models,
b and c. In each period, consumers can choose to buy a new car of any model or to hold on to
their existing car, which depreciates. Each consumer receives multiple signals per period, based
on the share of the various models on the roads, determined endogenously. Further details of the
dynamic model, including parameterizations, are presented in the Appendix. Here we discuss
simulation results.
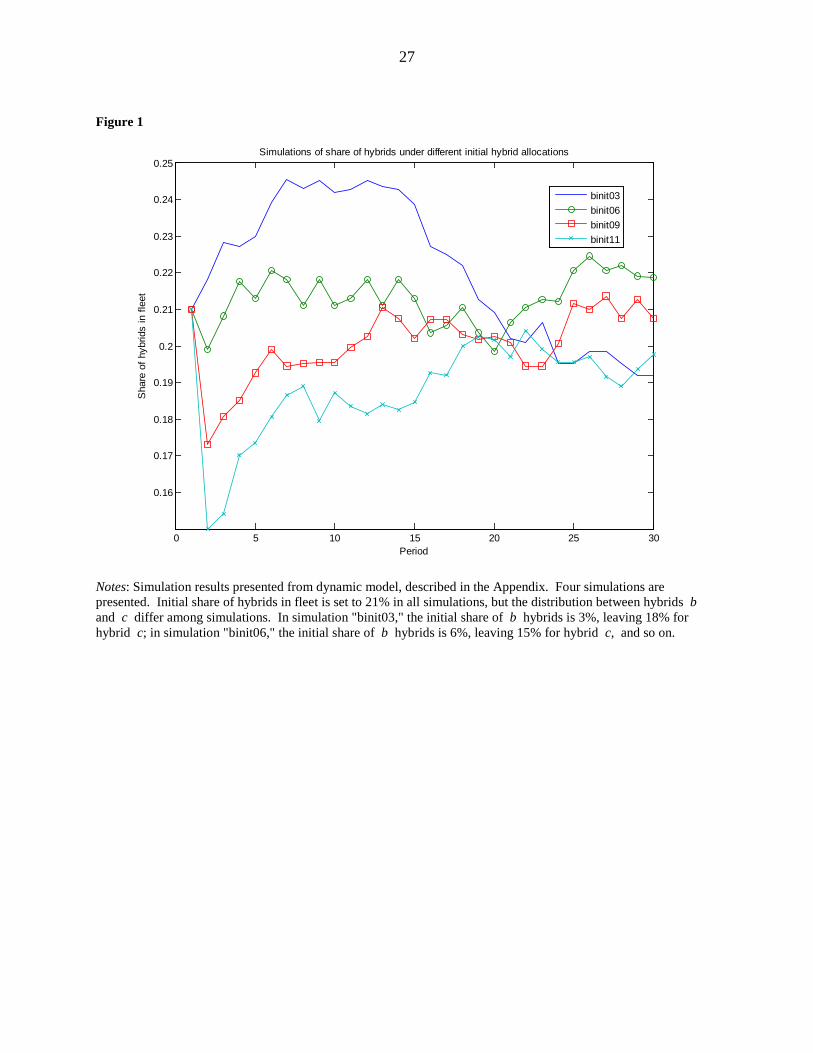
Figure 1 presents results from four simulations, each with the same parameter values
(listed in Appendix Table 1) but with different initial distributions of vehicle models and ages.
Parameters are chosen so that hybrid b has lower true quality than hybrid c (ηb < ηc). The y-
axis of Figure 1 measures the hybrid share of the vehicle fleet for each of the 30 periods of
simulation. Initially in all four simulations, hybrids account for 21% of the vehicle fleet (this is
about equal to the steady-state hybrid market share); however, the relative share of model b and
model c differ among the four simulations. In the first, unmarked curve, labeled "binit03", the
initial share of b models in the fleet is 3%, leaving 18% for model c. The next curve, marked
with circles and labeled "binit06," presents simulation results when the initial share of model b
is 6%. The curves labeled "binit09" and "binit11" correspond to initial starting shares for model
b of 9% and 11%, respectively.
In simulations with a higher initial share of model b, consumers are more likely to get a
signal of hybrid quality from model b than they are to get a signal from model c. Because the
true quality of model b is lower than that of model c, the resultant subjective assessment of
quality η is lower in simulations with a higher initial share of model b. Thus, we would expect
that a higher initial share of b leads to lower adoption of both types of hybrids. This is just
what we see in Figure 1, where the simulation with the lowest initial share of model b, 3%,
shortly thereafter has the highest hybrid penetration rate. The simulations with higher initial
shares of model b, from 6% to 11%, have lower hybrid penetration rates. Note also that this

12
effect is temporary; the hybrid shares converge around period 20 and subsequently bounce
around due to the randomness in the simulations. Eventually, the effect of the initial distribution
on consumers' assessments of hybrid quality vanishes, because after enough time has passed
most consumers have had the opportunity to accurately assess the quality of both hybrid
models.5
The models formalize some intuition about how heterogeneous quality among a new
technology is relevant to its diffusion. An available technology is adopted by consumers not just
when they are exposed to it, but when they are convinced that it will increase their utility. Being
exposed to different models of hybrids with varying qualities will lead to different outcomes for
future adoption; e.g., being exposed to a low-quality hybrid will make you less likely to buy that
hybrid and may make you less likely to buy any hybrid. Furthermore, this spillover signaling
effect should be stronger for hybrids from the same manufacturer then for hybrids from different
manufacturers, if consumers believe that hybrid quality is positively correlated among models of
a single manufacturer. We will test these predictions using our data set of new hybrid sales.
III. Data and Empirical Strategy
We use the same data set as Gallagher and Muehlegger (2008), where a more detailed
description of the data is available. The data set was purchased from JD Power and Associates
and is based on proprietary data on consumer purchases of new vehicles. Purchases are
aggregated at the quarter-state level for each of eleven hybrid models. The time period ranges
from 2000 Q1 to 2006 Q4.
The data on hybrid car purchases are combined with a number of control variables.
State-quarter level demographic data from the Current Population Survey include per-capita
income, mean age, proportion female, and percent of residents with a high school diploma or a
bachelor's degree. We use League of Conservation Voters scores as a measure for a state’s
preferences for environmentalism – for each year, we calculate the average of the LCV scores of
a state’s Senate and House delegations. Quarterly tax-inclusive retail gasoline prices for each
state are determined using data from the Energy Information Administration and the Federal
Highway Administration. Data on the generosity of state tax incentives for hybrid adoption were
5 The irrelevance of the initial distribution on the long-run outcomes rests on the model's assumptions, including no firm exit. If low sales early on, influenced by the initial distribution, lead to some manufacturers leaving the market, then all simulations may not converge in the long run.
13
collected. These incentives vary substantially across both state and time, and a value for tax
incentives at the state-quarter level has been calculated and is used as a control. In addition, the
type of the incentive differs substantially across states – approximately one third of the states
offering an incentive choose to waive sales taxes, while the remaining two-thirds allow
consumers a state tax credit.
While Gallagher and Muehlegger (2008) focus on how tax incentives, gasoline prices,
and ideological preferences affect consumer adoption of hybrids, we are interested in how
learning caused by exposure to hybrids affects their diffusion. Thus, in addition to the control
variables described above, we also want to identify the causal impact of the penetration of a
hybrid model in a particular state at the start of period t on hybrid purchases during period t.
For each model-state-quarter, we calculate the cumulative total sales of that model from all
previous periods.6
Figure 2 shows the diffusion of the two hybrid models that we focus on, the Honda
Insight and Toyota Prius, for the entire country, along with total hybrid penetration. It also
presents, measured on the right-hand axis, cumulative Prius market share of the entire hybrid
vehicle segment. The growth in hybrid penetration is approximately exponential. In early years,
the market was dominated primarily by the Insight and the Prius. While the Prius has continued
to grow, the penetration of Insight sales flattened (the Honda Insight was discontinued in 2006).
Consequently, the market share of the Prius rose quickly to approximately 60 percent. As more
models were introduced, the market share of the Prius first stabilized and then fell. Different
models clearly had qualitatively different patterns of diffusion. Similarly, it may be the case that
the penetration rates of different models had different effects on consumer adoption of hybrids.
These values of cumulative total sales are divided by the state population in a
quarter to create the variable for hybrid model penetration.
To estimate the learning effects, we employ a fixed effects panel regression at the state-
quarter level. The dependent variable is the log of per capita sales of hybrids in that state that
quarter. This is regressed on the state-level demographic variables, gasoline prices, and state-
model-level tax incentives. The right-hand-side variables of interest are the cumulative
penetration rates of Priuses and Insights. The base specification is thus
Log(SalesPerCapitait) = αi + βXit + λPLog(PriusPenetrationit)
6 Note that we need not worry about hybrid sales from before the start of our data set, since none of the models were introduced to the US market before 2000 Q1. The only exception to this is the Honda Insight, which was introduced in December 1999, so we are only missing that one month's worth of sales.
14
+ λILog(InsightPenetrationit) + ηt + εit,
where i indexes state and t indexes quarter. State fixed effects are denoted by αi; time fixed
effects by ηt; and εit represents an error term. Demographic and policy controls are included in
Xit, and the coefficients of interest are λP and λI, the effect of Prius and Insight penetration. If
consumers revise their priors on hybrid vehicle quality upwards when observing Priuses and
downwards when observing Insights, we expect λP to be greater than zero and λI to be less than
zero.
Our goal is to examine how the stock of Priuses and Insights in a state at the start of a
quarter affects new hybrid purchases in that quarter. An OLS regression of new sales on Prius
and Insight penetration rates plus controls is likely biased. Even after controlling for observable
characteristics, some states may have unobservable features that lead them to be more likely to
prefer hybrids both in the past and in the current quarter, thus upwardly biasing the estimated
coefficient. If these unobservable features are correlated with relative preferences for the Insight
or Prius, we may attribute differences in consumer willingness to adopt hybrid vehicles to the
Prius or Insight. Our first strategy against this bias is to include state fixed effects. To the extent
that any unobservable feature at the state level is constant over time, this fixed effect will
eliminate this bias.7
An alternative strategy to counter this bias is through instrumental variables. For the
exclusion restriction to hold, the set of instruments must be correlated with cumulative Prius and
Insight penetration rates but not consumer willingness to adopt hybrid vehicles. Our choice of
instruments is registrations of new Honda and Toyota vehicles in 1999, before hybrid vehicle
introduction.
8
7 We later also allow for a state-specific linear time trend.
Pre-hybrid vehicle registrations are partially determined by the strength of
dealership networks and underlying consumer preferences for Honda or Toyota – but importantly
are unlikely to be correlated with future consumer willingness to adopt hybrid vehicle
technology. We interact time fixed effects with per capita Honda registrations in 1999 and per
capita Toyota registrations in 1999 to flexibly capture the relationship between pre-hybrid brand
preferences and subsequent Prius and Insight adoption; that is, the per capita registrations in
1999 are allowed to have a different effect on cumulative penetration rates in each quarter.
8 These data are obtained from Polk.

15
The IV assumptions with the state fixed effects can be interpreted in terms of demeaned
variables. The relevance assumption is that the (demeaned) instruments are significantly
correlated with the (demeaned) endogenous variables. In this case, that amounts to the 1999
Honda and Toyota registrations interacted with time dummies being significantly correlated with
the state-demeaned cumulative penetration rates of Priuses and Insights. The relevance
assumption is testable, and it is supported empirically. The exclusion assumption is that the
demeaned instruments are uncorrelated with the demeaned dependent variable except through
their effect on the demeaned endogenous regressors. In this case, that amounts to the 1999
Honda and Toyota registrations interacted with time dummies not directly influencing the state-
demeaned new hybrid sales per capita.
Under what scenario would the exclusion assumption be violated? Suppose there is a
demand shock for relatively fuel efficient cars in some state in 1999 (say a gasoline tax increase).
Toyota and Honda registrations in 1999 will go up, since these cars are relatively fuel efficient.
If this demand shock is persistent (say, the tax increase in permanent), then the demand for
hybrids cars in future periods will go up as well, since hybrids are relatively fuel efficient. Thus,
the instrument directly affects the dependent variable. We are confident that this violation of the
exclusion assumption is not realized. First, the particular mechanism for the fuel efficiency
demand shock is controlled for in our regressions; we have state-quarter level data on net-of-tax
gasoline prices. Second, our instruments capture the relative difference in demand between
Toyotas and Hondas. Both of these manufacturers' cars are relatively fuel efficient compared to
the average car on the road in the US. We do not expect that a fuel economy demand shock
would relatively favor one manufacturer over the other, a claim that we could not make if the
two manufacturers were, say, Honda and Ford. In other words, we do not attribute the difference
between Honda and Toyota registrations in 1999 to fuel demand shocks alone. Instead, we
attribute the difference to potentially unobservable factors that affect only relative demands for
cars of those two manufacturers, such as the strength of dealership networks and underlying
consumer brand preferences.
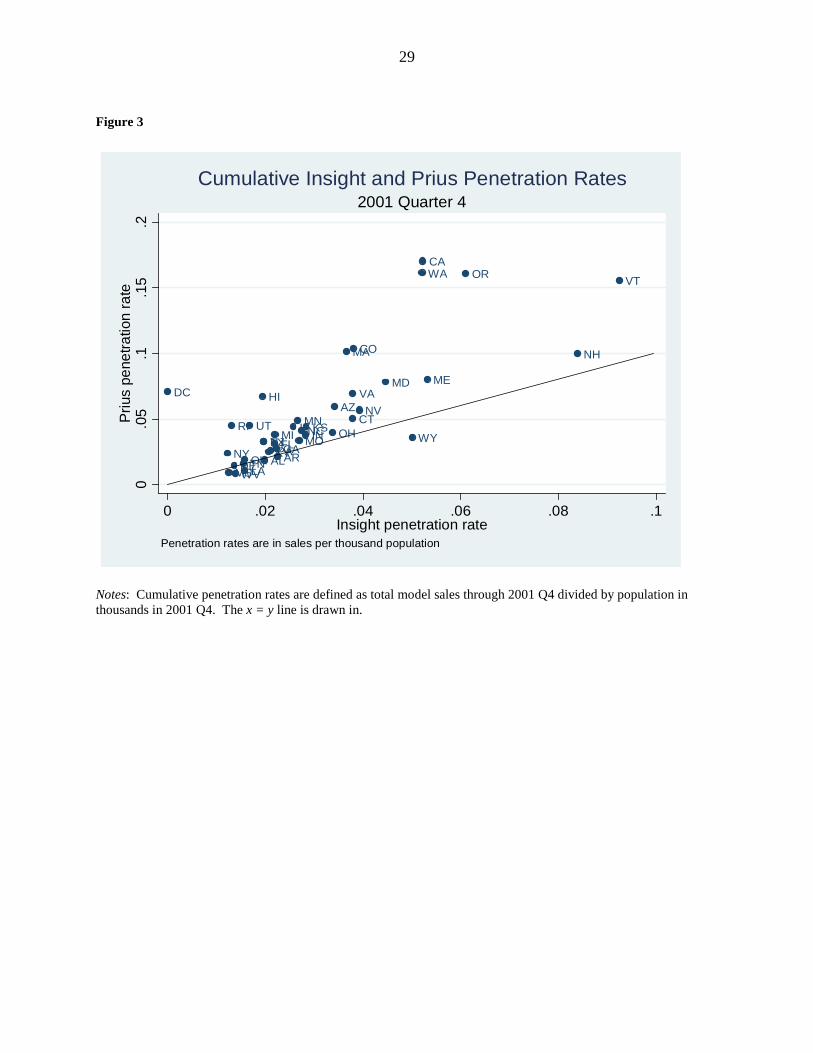
Our empirical strategy exploits variation in early penetration rates of the Insight and the
Prius across states. Figure 3 provides a scatter plot of cumulative Insight sales versus cumulative
Prius sales for the fourth quarter of 2001 (the last period for which these were the only two
models available). The values are in total cumulative sales per 1000 population. The scale is not

16
symmetric, so the 45 degree line is drawn. The plot shows that, although there is positive
correlation between states with high Prius sales and those with high Insight sales, there is also
substantial variation between states. California and the District of Columbia, for example, have
a relatively higher penetration rate of Priuses, while New Hampshire and Wyoming have a
relatively higher penetration rate of Insights. Figure 4 presents further evidence of variation in
early penetration rates of the Insight and the Prius. Figure 4 is a histogram of the number of
Insights as a percentage of total cumulative hybrid sales by state at of the end of 2001. The
Insight's hybrid market share ranged from 0% (in DC) to 59.2% (in Louisiana).
Table 1 presents summary statistics comparing “Insight-intensive” states (where the
Insight’s share of hybrid vehicle sales in 2001 Q4 was above the median of 39.9%) to “Prius-
intensive” states (with below-median Insight market shares). On average, Prius-intensive states
have higher tax-inclusive gasoline prices, offer more generous incentives, are slightly wealthier
and have representatives who vote more liberally on environmental issues. Furthermore,
cumulative hybrid vehicle adoption as of 2001 Q4 is slightly higher in these states – although
much of this difference arises from California, where over 6,000 hybrid vehicles were sold in
2000 and 2001. Excluding California, cumulative hybrid vehicle adoption in Prius-intensive
states averaged 450 vehicles. In all cases, though, the distributions overlap substantially – the
differences are not statistically significant.
IV. Results
We first test to see if initial Prius and Insight adoption is correlated with subsequent
hybrid vehicle purchases. The stylized model predicts that if the Prius was perceived to be of
high-quality compared to prior beliefs, then Prius sales should have a positive effect on
subsequent hybrid vehicle purchases. Similarly, if the Insight was perceived to be of low-quality
compared to the prior, Insight purchases should have a negative effect on subsequent hybrid
vehicle penetration.
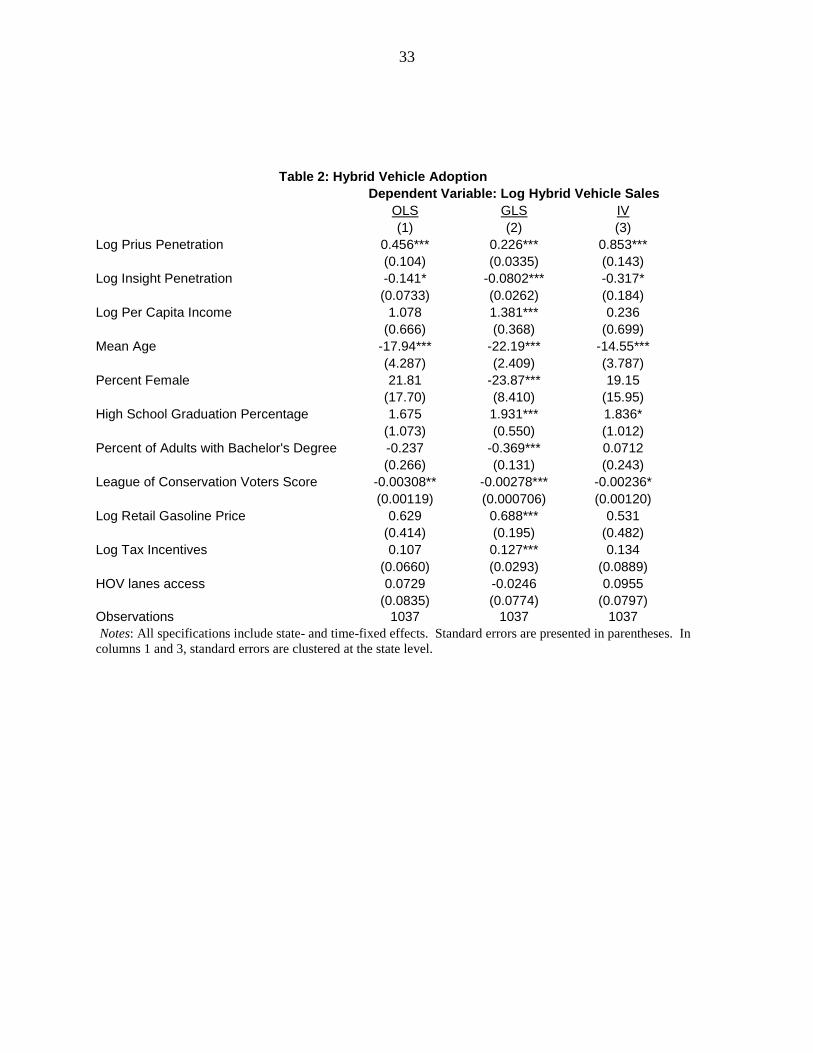
The base case regression results are presented in Table 2. We present three
specifications. The first column presents results from a basic OLS regression with state- and
time-fixed effects. However, even if the fixed-effects strategy overcomes our identification
concerns described above, we must still account for serial correlation in the error structure
because of the dynamic panel structure of the data. (Specification tests reject the null hypothesis

17
of no serial correlation.) Thus, in column 2 we employ a fixed effects generalized least squares
(GLS) regression to allow a general form of error structure.9
Table 2 demonstrates how different models can impart different signals about unknown
hybrid quality and thus lead to different diffusion rates. In all columns, the coefficient on the log
of the Prius penetration rate is significantly positive, with an estimated elasticity between 0.23
and 0.85. The coefficient on the log of the Insight penetration rate is negative in all columns,
ranging from –0.08 to –0.32, with statistical significance ranging from the 10% level to the 1%
level. Some of the demographic and incentive variables also impact hybrid vehicle sales. States
with higher income residents and with younger residents tend to have higher hybrid sales.
Higher hybrid sales are also associated with higher gasoline prices and higher values of tax
incentives for hybrid purchases, reinforcing results found in Gallagher and Muehlegger (2008).
Curiously, a higher score for a congressional delegation by the League of Conservation Voters,
indicating a more environmentally-friendly voting record, is associated with a lower propensity
to buy hybrids. The effect is small but significant.
Finally, column 3 present results
from the IV strategy described above. First-stage IV results are presented in Appendix Table 2.
In all specifications, all of the state-quarter level demographic data, gasoline prices and tax-
incentive data are included. In columns 1 and 3, standard errors are clustered at the state level,
while column 2's regression allows a more general error structure. All regressions include state-
and time-fixed effects.
The results from Table 2 are consistent with the theory presented above about
heterogeneous quality of a new technology as well as anecdotal evidence from model sales and
from stories in the media about the relative quality of these two models. The Prius appears to
have provided a positive signal – initial Prius sales are positively correlated with subsequent
hybrid vehicle adoption. In addition, we find some evidence that suggests the Insight provided a
negative signal of hybrid quality – we estimate that a ten percent increase in Insight sales are
negatively correlated with a three percent reduction in subsequent adoption. As mentioned
earlier, the Prius has become the top-selling hybrid model in the US, surpassing one million new
sales, while the Insight has been recently redesigned. Some have argued that the fact that the
Insight's hybrid technology did not perform as well, or that it only had two seats, made it less
popular. An early review of the 2001 models of both the Insight and the Prius provides further
9 Results are also robust to specifying an AR(1) error structure.
18
evidence (Consumer Reports 2000). The review claims that the Prius is the first hybrid that can
"seriously compete with conventional cars." It is called "a worthy contender and a legitimate
choice for everyday use." The Insight, on the other hand, was cited for "a lack of
accommodations, comfort, and drivability;" the ride is "barely tolerable." Also, the Insight's
design, compared to the more conventional Prius, may have doomed it (Patton 2007).10
Table 3 investigates the robustness of the results. All columns run IV regressions with
fixed effects. In column 1, we regress at the state-quarter-model level instead of the state-quarter
level; we do not aggregate all hybrid models together. This regression includes state-model
fixed effects and model-quarter fixed effects. Thus, as different models have different national
trends (e.g. Prius sales take off and Insight sales sink), these dummy interaction variables allow
for any such model-specific pattern. Furthermore, different states are allowed different
preferences for individual models, not just for hybrids overall, via the state-model fixed effect.
The resulting coefficients again support the positive signal arising from the Prius. The negative
coefficient on Insight penetration is smaller and not distinguishable from zero.
In column 2, we return to the state-quarter level, but we include a linear state-specific
time trend in addition to a state-fixed effect. Thus, not only do different states have different
preferences for hybrids, but these preferences are allowed to vary linearly over time at different
rates. We identify a diffusion effect off of the deviation from this state-level linear trend. We
again see a significant positive Prius effect, though of a smaller magnitude and at a lower level of
significance compared to the results without the time trend.11
We have chosen to include only Prius and Insight penetration levels on the right-hand-
side of the regression equations because they were the first two models introduced and
dominated the market for the first three years of the sample. Thus, we believe that any signaling
effect from seeing hybrids would come from these models. Nine other hybrid models are present
in our sample, and in theory we could put any combination of these models on the right hand
side. For almost all other models, though, their late introduction and small representation among
The Insight effect is negative and
of the same magnitude as the results without the time trend, but the standard error is large
enough to make it statistically indistinguishable from zero.
10 The perceived quality signal need not be perfectly correlated with the true quality. The Insight may have been superior to the Prius in some dimensions or overall; we make no claims about true quality. 11 The t-statistics are slightly lower for the Prius coefficient in the OLS and GLS regressions with linear time trendsm yielding p-values of around 0.15.

19
states mean that there is insufficient power in the regressions to identify any effect. The only
exception may be the Honda Civic hybrid. It was introduced in 2002 Q1, the third year of our
sample. By 2003 Q1, its market share of new sales was 49.9%. Column 3 thus replicates the
fixed effect IV regressions including the log of Civic penetration as an endogenous regressor.
The set of instruments is the same as in Table 2's regression. The coefficient on Civic
penetration is not significantly different from zero. The Prius coefficient is still significantly
positive, and the Insight coefficient is still negative, here with a somewhat higher significance
than in the rest of Table 3.12
Overall, the robustness checks in Table 3 provide more strong
evidence of the positive diffusion effect from Priuses, and more but weak evidence of a negative
diffusion effect from Insights.
Heterogeneous Effects by Manufacturer
We extend the regression strategy to estimate manufacturer-specific effects. If
consumers believe that the quality of Toyota hybrids are correlated due to perhaps similar
technology, a high quality signal from a Prius may provide a stronger signal of high quality for
other Toyota models than for models of other manufacturers. Similarly, a bad quality signal
from an Insight may have a stronger negative effect on other Honda models than on models of
other manufacturers.13
12 Some other specifications that include Civic penetration show a slightly negative and barely significant coefficient on Civic penetration. The coefficient on Prius penetration is always significantly positive, and the coefficient on Insight penetration is always significantly negative.
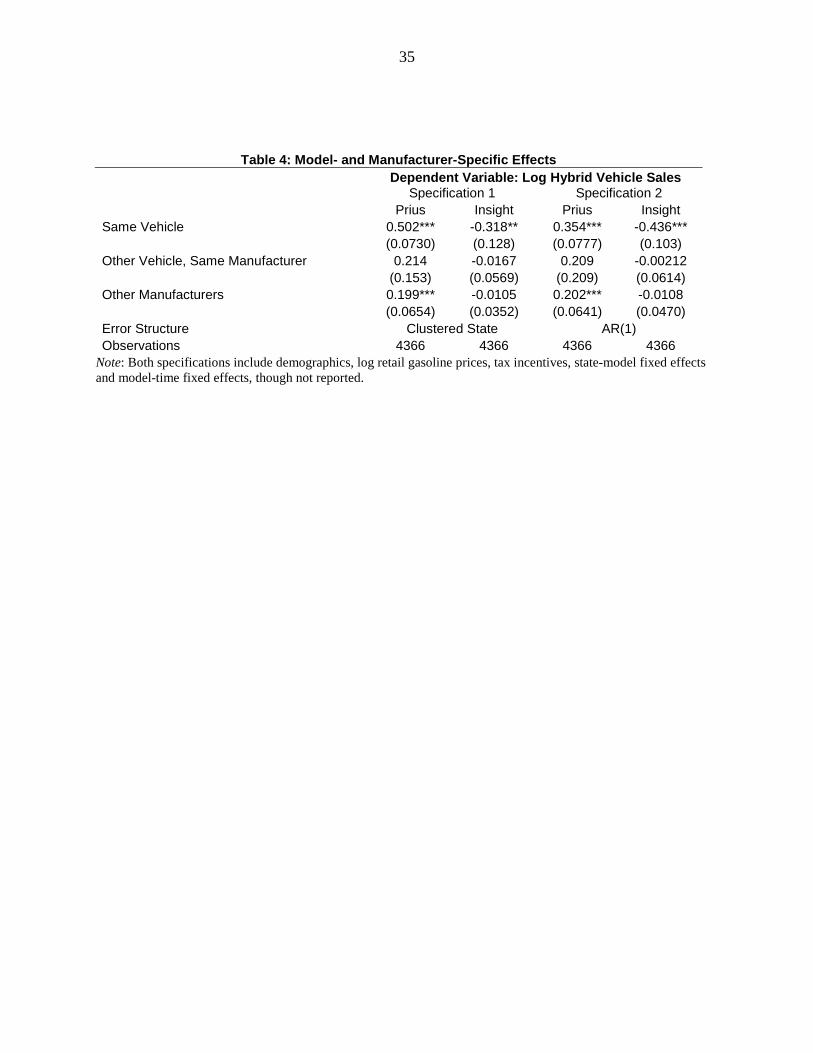
We test this prediction in Table 4. As in the previous regressions, the
dependent variable is the log of hybrid vehicle sales. The regressions are run at the state-quarter-
model level, as in column 1 of Table 3, to allow the impacts of Prius and Insight penetration rates
to vary by model and manufacturer. We allow these coefficients to be different for effects on the
same vehicle (i.e. the effect of Prius penetration rates on Prius sales and the effect of Insight
penetration rates on Insight sales), on other vehicles of the same manufacturer (e.g. the effect of
Prius penetration rates on Toyota Camry sales), and on vehicles by other manufacturers (e.g. the
effect of Prius penetration rates on Honda sales). The first two columns present coefficient
estimates from a single regression, with the Prius coefficients in the first column and the Insight
coefficients in the second column. These regressions are OLS with fixed effects; columns 3 and
4 repeat the regression allowing an AR(1) error term.
13 In the static model this occurs if α > β.
20
All of the coefficients show positive diffusion effects from the Prius and negative
diffusion effects from the Insight, as consistent with all previous results. However, the
magnitude and the significance of the results present some interesting patterns. The coefficient
with the greatest magnitude and highest level of significance is always the one from the same
vehicle. Prius penetration rates have a larger positive impact on Prius sales than on sales of any
other models, and Insight penetration rates have a larger negative impact on Insight sales than on
sales of any other models. For Insights, in fact, the "same vehicle" coefficient is the only
significant coefficient, suggesting that the Insight's negative signal is largely confined to other
Insights. For Priuses, the coefficients from other vehicles are consistent with the signaling model
where a stronger signal comes from a model by the same manufacturer than by a model from a
different manufacturer. However, while the point estimate of the coefficient on "other vehicle,
same manufacturer" is larger than that on "other manufacturers," only the latter is significantly
different from zero, and they are not significantly different from each other. For Insights, neither
of the second two coefficients is significantly different from zero. Thus, we can reject the null
hypothesis that signal strength does not vary by model. We cannot reject the null hypothesis that
signal strength does not vary by manufacturer. These results define manufacturer by marque,
treating marques owned by the same firm (e.g. Toyota and Lexus) as different manufacturers.
Treating different marques owned by the same firm as the same manufacturer yields qualitatively
similar results. Furthermore, strength of signal may differ not only by manufacturer but also by
other features of the car. For example, Toyota and Honda have fundamentally different hybrid
technologies. The technology used by Ford (and its marque Mercury) is nearly identical to that
used by Toyota (the two companies entered a patent-sharing accord in 2004). We replicate Table
4's, grouping models together by engine type instead of by manufacturer. We again reach
qualitatively the same results: significant "same vehicle" coefficients for both Priuses (positive)
and Insights (negative), and smaller and less significant "other vehicle, same engine type" and
"other engine type" coefficients for both models.
Persistence
Finally, we examine whether the effect of the initial mix of hybrid vehicles persists over
time. In traditional models of adoption, slow initial uptake retards consumer learning and
consequently slows subsequent adoption. By contrast, two aspects of our model suggest that the
21
effect of the initial mix of Priuses and Insights will decay over time. First, as hybrid vehicles
become more prevalent, consumers are more able to infer model-specific quality separately from
the mean quality of hybrid vehicles. For example, if a consumer only has experience with the
Insight, she may be unable to determine whether her impression of the Insight is specific to that
model or more generally indicative of overall hybrid quality. As more models become available,
the consumer receives signals about more vehicles and can better infer vehicle-specific
deviations from mean hybrid vehicle quality. Consequently, prospective buyers will be less
likely to misattribute a signal from a low-quality (or high-quality) vehicle to all hybrid models.
Second, our model explicitly allows consumers to respond dynamically to information.
Prospective hybrid buyers may choose to postpone purchases until a later date if they lack
sufficient information to evaluate the quality of a hybrid vehicle. Both of these effects imply that
in a state with a high initial mix of Insights relative to Priuses, we will see slow hybrid vehicle
adoption for a period of time. As more models are introduced and consumer information
improves, we expect that adoption accelerates in these states and may, after time, catch up to
states with a greater initial proportion of Priuses.
We compare hybrid vehicle adoption in states with initially high Prius market share
("Prius-intensive") and states with initially high Insight market share ("Insight-intensive"). To
investigate persistence, we interact time fixed effects with two measures of the initial hybrid
vehicle market share of Insights. The first measure is a simple dummy variable categorizing
states above and below the median Insight market share in the fourth quarter of 2001. We
choose 2001 Q4 since by this time both Priuses and Insights were differentially allocated across
states (see Figure 3) but no other models were yet introduced. The median hybrid market share
of Insights across states in 2001 Q4 is 0.40. Our second measure interacts the time fixed effects
with the Insight hybrid market share in the fourth quarter of 2001.
We regress the log of the cumulative hybrid sales per capita on cumulative, demeaned
values of our dependent variables, time fixed effects and time fixed effects interacted with these
measures of Insight-intensive states.
Log(CumulativeSalesPerCapitait) = α+ βCumulative(Xit) + ηt
+ λt*HighInsightPenetration(Q4-2001) + εit,
Table 5 presents our estimates. Specifications 1 and 2 interact time fixed effects with the
dummy variable for above-median Insight market share, while specifications 3 and 4 interact the

22
time fixed effects with value of Insight market share directly. In each case, we report the OLS
and IV estimates. We use the same set of instrumental variables as before – interactions between
time effects and Honda and Toyota registrations in 1999 – and the endogenous right-hand-side
variables are the interaction between time effects and the Insight penetration measures.
In all specifications, we find a pattern consistent with the theoretical prediction: slower
initial adoption in Insight-intenstive states. That said, the effect diminishes over time; per capita
hybrid vehicle sales in Insight-intenstive states accelerate in 2004–2005 (t = 17 to t = 24) and
begin to catch up to sales in Prius-intensive states. Figure 5 plots the coefficient values from
specifications (1) and (2). Both specifications show a similar pattern, although the effect is more
pronounced after instrumenting for Insight market share.14
We find a similar pattern when interacting time fixed effects directly with Insight market
share in 2001 Q4. We estimate that adoption in Insight-intensive states was slower than adoption
in Prius-intensive states through mid-2003. In mid-2003, a one standard deviation increase in the
market share of the Insight in 2001 Q4 is associated with a 35 percent lower hybrid vehicle
penetration rate. After that point, per capita sales in Insight-intensive states slightly outpaced
per-capita sales in Prius-intensive states. While the magnitude of the effect declines by the end
of 2006, it does not disappear – at the end of our sample, a one-standard deviation in the Insight
market share in 2001 Q4 is associated with 23 percent lower hybrid vehicle penetration rate.
After the introduction of the Prius,
the point estimates on Insight penetration become increasingly negative, consistent with slower
hybrid vehicle adoption in Insight-intensive states. The effect bottoms out in the final quarter of
2002 and the first quarter of 2003, where we estimate that cumulative hybrid vehicle adoption
was 1.2 log-points lower in Insight-intensive states compared to Prius-intensive states. Over
2004 through 2006, per capita hybrid vehicle sales in Insight-intensive states outpace hybrid
vehicles sales in Prius-intensive states. By the end of 2006, we estimate that cumulative hybrid
vehicle adoption was only 0.6 log-points lower in Insight-intensive states.
The empirical persistence patterns displayed in Figure 5 are consistent with the
predictions of the dynamic model, displayed in Figure 1. The simulation results in Figure 1
suggest that the effect of a higher than average share of a low quality signal hybrid diminishes
over time; by period 20 all of the simulations have converged. The results in Figure 5 also
14 In the first period of the IV regressions, cumulative sales are higher (but imprecisely estimated) in states with above-median Insight penetration since the Insight was introduced earlier than the Prius. We thus omit this period in Figure 5.

23
suggest that the negative effect of a high initial Insight penetration rate bottoms out after about
two years, though it does not completely dissipate even six years on.
V. Conclusion
Hybrid electric vehicles are capturing an increasing share of the domestic automobile
market, yet they are still a relatively new and uncertain technology compared to conventional
internal combustion engine automobiles. Consumers thus make their decisions about purchasing
hybrid cars or conventional cars under uncertainty about hybrid quality. To understand the
diffusion of this new technology among consumers, one must understand how signals of hybrid
quality from hybrids currently in the market affect consumer decisions. Furthermore, with a
heterogeneous assortment of hybrid models, it is important to differentiate signaling effects from
different models. We have presented a model showing how learning about the quality of a new
technology can affect consumers' decision and how these signals can have different effects
depending on the quality and the manufacturer of the observed model. Using data on state-level
sales of new hybrid models, we showed that the diffusion patterns of hybrids are consistent with
this learning model. Higher penetration rates of the Toyota Prius are associated with higher per-
capita sales of hybrid models; penetration rates of the Honda Insight have a negative effect on
sales of new hybrids. The negative diffusion effect from the Insight appears to be confined to the
Insight, while the positive effect from the Prius spills over to other hybrid models, though with a
smaller magnitude than its effect on Priuses. Consistent with our theoretical predictions, we find
that the effect of initial adoption decisions diminishes over time. Although we estimate that the
effect of the initial vehicle mix peaks after about one to two years and declines thereafter, the
effect persists until the end of our sample (six years), suggesting that policies promoting
technology adoption may have long-lasting effects.
Our identification strategy exploits variation in early penetration rates of the Prius and the
Insight across states. This variation is substantial, as evinced in Figures 3 and 4. We thus would
like to think of this analysis as a quasi-experiment, where different penetration rates are
randomly allocated to different states and we study the effects on subsequent hybrid purchases.
This variation is not random, though, and we employ instrumental variables to identify a causal
effect. We instrument for these initial allocations using the relative distribution of non-hybrid
Toyota and Honda models. States may have preferences for one manufacturer over another, or a

24
particular manufacturer may have a better distribution system in place in some places, leading to
higher penetration rates of hybrid models.
We have identified an effect from lagged penetration rates on adoption of new hybrid
cars that differs by model and manufacturer. We have also provided a theoretical model of
learning and technological uncertainty that is consistent with this empirical result. However, the
empirical result could be explained by other factors besides learning effects. For example,
network externalities may be present; higher hybrid penetration in a state may lead to more
mechanics able to service hybrids, which would lower their cost in that state and increase
adoption. Our empirical strategy cannot disentangle the learning explanation provided by our
model from competing explanations of the diffusion patterns that we see.15
Our findings are relevant to technology policy, especially policy intended to encourage
low-carbon technologies. Policies like tax incentives impact consumers' decisions to buy hybrid
cars (Gallagher and Muehlegger 2008). They presumably will have similar impacts on
consumers' decisions on even newer technologies, like plug-in hybrid cars, electric cars, or home
electrical smart meters.
A useful extension to
this paper would be to use additional data to attempt to separate these effects.
16
The standard justification of these incentives assumes the economy is
still at the convex portion of the S-curve, so pushing more of the new technology onto the market
increases the rate of diffusion. That argument disregards the heterogeneity of new technologies.
Subsidies for low-quality models of the new technology (or models that give low-quality signals)
may inhibit rather than encourage diffusion by lowering rather than increasing consumers'
assessments of technology quality. This effect may hold for consumer technologies as well as
technologies available to firms, including carbon capture and storage or renewable energy
sources for electric utilities.
15 Choi (1997) provides a theoretical model that includes both informational spillovers and network externalities. 16 The Energy Improvement and Extension Act, passed into law October 2008, provides tax credits for plug-in hybrid purchases up to $7,500.
25
References
Andonova, Veneta. "Mobile Phones, the Internet and the Institutional Environment." Telecommunications Policy, Vol. 30, No. 1 (February 2006), 29-45.
Choi, Jay. "Herd Behavior, the 'Penguin Effect,' and the Suppression of Informational Diffusion:
An Analysis of Informational Externalities and Payoff Interdependency." RAND Journal of Economics, Vol. 28, No. 3 (Autumn 1997), 407-425.
Consumer Reports. "Fuel Efficient Cars 12/00." December 2000. Available at
www.consumerreports.org. De Haan, Peter, Michael Mueller and Anja Peters. "Does the Hybrid Toyota Prius Lead to
Rebound Effects? Analysis of Size and Number of Cars Previously Owned by Swiss Prius Buyers." Ecological Economics, Vol. 58, No. 3 (June 2006), 592-605.
Duflo, Esther and Emmanuel Saez. "Participation and Investment Decisions in a Retirement
Plan: The Influence of Colleagues' Choices." Journal of Public Economics, Vol. 85, No. 1 (July 2002), 121-148.
Gallagher, Kelly and Erich Muehlegger. "Giving Green to Get Green? Incentives and
Consumer Adoption of Hybrid Vehicle Technology." Working Paper, Harvard Kennedy School (January 2008).
Geroski, P. A. "Models of Technology Diffusion." Research Policy, Vol. 29, No. 4-5 (April
2000), 603-625. Goolsbee, Austan and Peter Klenow. "Evidence on Learning and Network Externalities in the
Diffusion of Home Computers." Journal of Law and Economics, Vol. 45, No. 2, Part 1 (October 2002), 317-343.
Greenman, J.V. "The Car Park: Diffusion Models Revisited." Energy Economics, Vol. 18, No.
1-2, (April 1996), 107-128. Griliches, Zvi. "Hybrid Corn: An Exploration in the Economics of Technological Change."
Econometrica, Vol. 25, No. 4 (October 1957), 501-522. Heidhues, Paul and Nicolas Melissas. "Equilibria in a Dynamic Global Game: The Role of
Cohort Effects." Economic Theory, Vol. 28, No. 3 (August 2006), 531-557. Iimi, Atsushi. "Estimating Demand for Cellular Phone Services in Japan." Telecommunications
Policy, Vol. 29, No. 1 (February 2005), 3-23. Jensen, Richard. "Innovation Adoption and Diffusion when there are Competing Innovations."
Journal of Economic Theory, Vol. 29, No. 1, (February 1983), 161-171.

26
Kahn, Matthew. "Do Greens Drive Hummers of Hybrids? Environmental Ideology as a Determinant of Consumer Choice." Journal of Environmental Economics and Management, Vol. 54, No. 2 (September 2007), 129-145.
Kremer, Michael and Edward Miguel. "The Illusion of Sustainability." Quarterly Journal of
Economics, Vol. 122, No. 3 (August 2007), 1007-1065. Lamberson, P.J. "The Diffusion of Hybrid Electric Vehicles." Working Paper, University of
Michigan (2009). Lescaroux, Francois and Olivier Rech. "The Impact of Automobile Diffusion on the Income
Elasticity of Motor Fuel Demand." Energy Journal, Vol. 29, No. 1 (2008), 41-60. Manski, Charles. "Economic Analysis of Social Interactions." Journal of Economic
Perspectives, Vol. 14, No. 3 (Summer 2000), 115-136. McFarland, James and Howard Herzog. "Incorporating Carbon Capture and Storage
Technologies in Integrated Assessment Models." Energy Economics, Vol. 28, No. 5-6 (November 2006), 632-652.
Medlock, Kenneth and Ronald Soligo. "Car Ownership and Economic Development with
Forecasts to the Year 2015." Journal of Transport Economics and Policy, Vol. 36, No. 2 (May 2002), 163-188.
Patton, Phil. "Once Frumpy, Green Cars Start Showing Some Flash." New York Times, July 15,
2007 Rose, Nancy and Paul Joskow. "The Diffusion of New Technologies: Evidence from the
Electric Utility Industry." RAND Journal of Economics, Vol. 21, No. 3 (Autumn 1990), 354-373.
Sallee, James. "The Incidence of Tax Credits for Hybrid Vehicles." Working Paper, University
of Michigan (2008). Sorensen, Alan. "Social Learning and Health Plan Choice." RAND Journal of Economics, Vol.
37, No. 4 (Winter 2006), 929-945. Stoneman, Paul and Myung-Joong Kwon. "The Diffusion of Multiple Process Technologies."
Economic Journal, Vol. 104, No. 423 (March 1994), 420-431. Young, H. Peyton. "Innovation Diffusion in Heterogeneous Populations: Contagion, Social
Influence, and Social Learning." American Economic Review, Vol. 99, No. 4 (December 2009), 1899-1924.
27
Figure 1
0 5 10 15 20 25 30
0.16
0.17
0.18
0.19
0.2
0.21
0.22
0.23
0.24
0.25Simulations of share of hybrids under different initial hybrid allocations
Period
Sha
re o
f hyb
rids
in fl
eet
binit03binit06binit09binit11
Notes: Simulation results presented from dynamic model, described in the Appendix. Four simulations are presented. Initial share of hybrids in fleet is set to 21% in all simulations, but the distribution between hybrids b and c differ among simulations. In simulation "binit03," the initial share of b hybrids is 3%, leaving 18% for hybrid c; in simulation "binit06," the initial share of b hybrids is 6%, leaving 15% for hybrid c, and so on.

28
Figure 2
0.2
.4.6
.8M
arke
t Sha
re
020
0000
4000
0060
0000
Cum
ulat
ive
Sal
es
01jul2000 01jan2002 01jul2003 01jan2005 01jul2006Date
Cumulative Insight Sales Cumulative Prius SalesTotal Hybrid Sales Cumulative Prius Market Share
Diffusion of Prius, Insight and Other Hybrid Vehicles
Notes: Left-hand axis values are total cumulative sales of Insights, Priuses, and all hybrids in the United States, 2000 Q1 – 2006 Q4. The scale on the right-hand axis is the cumulative Prius sales as a fraction of cumulative hybrid sales.
29
Figure 3
AL
AZ
AR
CA
CO
CT
DE
DC
FLGA
HI
ILINKS
KYLA
MEMD
MA
MIMN
MS
MO
NV
NH
NJNY
NC OH
OK
OR
PA
RI
TN
TXUT
VT
VA
WA
WV
WY
0.0
5.1
.15
.2Pr
ius
pene
tratio
n ra
te
0 .02 .04 .06 .08 .1Insight penetration rate
Penetration rates are in sales per thousand population
2001 Quarter 4Cumulative Insight and Prius Penetration Rates
Notes: Cumulative penetration rates are defined as total model sales through 2001 Q4 divided by population in thousands in 2001 Q4. The x = y line is drawn in.

30
Figure 4
05
1015
Num
ber o
f Sta
tes
0 .2 .4 .6 .8 1InsightPercent
Through 2001, Quarter 4Cumulative Insight Market Share
Notes: Figure 4 is a histogram, where the x-axis bins represent cumulative Insight market share in a state through 2001 Q4, and the height is the number of states.

31
Figure 5
Note: This figure plots the estimated coefficients on the interaction terms between the time indicator and the indicator variable for Insight-intensive state, from the regressions presented in Table 5, columns 1 and 2. Insight-intensive states are defined by having an Insight market share greater than the median value (39.9%) in 2001 Q4. For presentation, the first period coefficient is omitted.

32
Notes: "Insight-intensive" states are those whose share of hybrid vehicle sales in 2001 Q4 is above the median share of 39.9%; "Prius-intensive" states are all others.
Table 1: Summary Statistics for "Insight-Intensive" and "Prius-Intensive" States, 2001 Q4 Insight-Intensive Prius-Intensive Variable Mean SD Mean SD Tax Inclusive Retail Gasoline Price (cpg) 114.27 8.10 122.94 11.51 State Hybrid Incentive ($000) 0.09 0.40 0.25 0.59 Per Capita Income ($000) 28.24 4.66 32.11 4.81 HS Graduation Rate 0.84 0.04 0.86 0.04 BA Attainment Rate 0.23 0.04 0.29 0.04 Population (millions) 5.30 4.18 7.56 8.36 Mean Age 36.45 1.20 35.82 1.59 Percent Female 0.51 0.01 0.51 0.01 Per Capita Vehicle Miles Travelled (000s miles/year) 11.07 2.09 9.58 1.89 Senate League of Conservation Voters Score 36.25 32.33 58.00 38.52 House League of Conservation Voters Score 34.55 22.23 62.05 27.53 New Honda Registrations (1999) 16613.45 16481.27 26935.62 37060.85 New Toyota Registrations (1999) 21748.45 22627.06 33759.52 50571.71 New Honda Regs Per Capita (1999) 2.85 1.02 3.30 0.95 New Toyota Regs Per Capita (1999) 3.89 1.29 4.17 1.43 Cumulative Hybrid Sales (as of Q4-2001) 247.55 217.56 707.57 1311.77 Cumul. Hybrid Sales Per Cap. (veh/000) 0.05 0.03 0.09 0.05
33
Table 2: Hybrid Vehicle Adoption Dependent Variable: Log Hybrid Vehicle Sales
OLS GLS IV (1) (2) (3) Log Prius Penetration 0.456*** 0.226*** 0.853*** (0.104) (0.0335) (0.143) Log Insight Penetration -0.141* -0.0802*** -0.317* (0.0733) (0.0262) (0.184) Log Per Capita Income 1.078 1.381*** 0.236 (0.666) (0.368) (0.699) Mean Age -17.94*** -22.19*** -14.55*** (4.287) (2.409) (3.787) Percent Female 21.81 -23.87*** 19.15 (17.70) (8.410) (15.95) High School Graduation Percentage 1.675 1.931*** 1.836* (1.073) (0.550) (1.012) Percent of Adults with Bachelor's Degree -0.237 -0.369*** 0.0712 (0.266) (0.131) (0.243) League of Conservation Voters Score -0.00308** -0.00278*** -0.00236* (0.00119) (0.000706) (0.00120) Log Retail Gasoline Price 0.629 0.688*** 0.531 (0.414) (0.195) (0.482) Log Tax Incentives 0.107 0.127*** 0.134 (0.0660) (0.0293) (0.0889) HOV lanes access 0.0729 -0.0246 0.0955 (0.0835) (0.0774) (0.0797) Observations 1037 1037 1037 Notes: All specifications include state- and time-fixed effects. Standard errors are presented in parentheses. In columns 1 and 3, standard errors are clustered at the state level.

34
Table 3: Robustness Checks
Dependent Variable: Log Hybrid Vehicle Sales
State-Quarter- Model Level
Linear Time Trends
Including Civic Penetration
(1) (2) (3) Log Prius Penetration 0.548*** 0.404** 0.839*** (0.165) (0.157) (0.153) Log Insight Penetration -0.0301 -0.317 -0.321* (0.135) (0.267) (0.188) Log Civic Penetration 0.0173 (0.0840) Log Per Capita Income 1.379*** 0.0821 0.258 (0.451) (0.609) (0.716) Mean Age -8.940** -26.77*** -14.95*** (3.606) (5.084) (4.125) Percent Female 1.283 -24.31 17.79 (13.51) (24.31) (17.87) High School Graduation Percentage 1.155 2.676** 1.848* (0.846) (1.264) (1.027) Percent of Adults with Bachelor's Degree 0.126 0.0356 0.0485 (0.230) (0.280) (0.268) League of Conservation Voters Score -0.00325*** -0.00283** -0.00238** (0.00117) (0.00138) (0.00115) Log Retail Gasoline Price 0.523 0.253 0.545 (0.331) (0.408) (0.466) Log Tax Incentives 0.0431 0.115 0.134 (0.0296) (0.0747) (0.0891) HOV lanes access -0.0742 0.0619 0.0921 (0.0675) (0.0857) (0.0820) Observations 4347 1024 1024
Notes: IV regression results are presented in all columns. State- and time-fixed effects are in all regressions except column 1, which includes state-model and time-model fixed effects. Standard errors are clustered at the state level and presented in parentheses.
35
Table 4: Model- and Manufacturer-Specific Effects Dependent Variable: Log Hybrid Vehicle Sales Specification 1 Specification 2 Prius Insight Prius Insight Same Vehicle 0.502*** -0.318** 0.354*** -0.436*** (0.0730) (0.128) (0.0777) (0.103) Other Vehicle, Same Manufacturer 0.214 -0.0167 0.209 -0.00212 (0.153) (0.0569) (0.209) (0.0614) Other Manufacturers 0.199*** -0.0105 0.202*** -0.0108 (0.0654) (0.0352) (0.0641) (0.0470) Error Structure Clustered State AR(1) Observations 4366 4366 4366 4366
Note: Both specifications include demographics, log retail gasoline prices, tax incentives, state-model fixed effects and model-time fixed effects, though not reported.

36
Table 5: Persistence Results
Time Trend *
Above-Median Insight Market Share Time Trend *
Percent Insight Market Share Variables OLS IV OLS IV Interaction Terms t=1 -0.421 2.678 -3.370** 3.782 (0.313) (3.116) (1.318) (6.837) t=2 -0.256 -0.412 -1.412 -1.655 (0.203) (0.889) (1.189) (2.357) t=3 -0.346* -1.002 -2.166* -3.244* (0.195) (0.803) (1.148) (1.887) t=4 -0.451** -0.751 -2.001* -2.281 (0.172) (0.776) (1.050) (1.980) t=5 -0.506*** -0.770 -2.275** -2.319 (0.168) (0.756) (0.986) (1.954) t=6 -0.506*** -0.754 -2.285** -2.309 (0.163) (0.718) (0.979) (1.855) t=7 -0.533*** -0.781 -2.414** -2.431 (0.163) (0.710) (0.920) (1.834) t=8 -0.548*** -0.847 -2.465** -2.681 (0.160) (0.702) (0.926) (1.788) t=9 -0.590*** -0.928 -2.686*** -2.913 (0.160) (0.689) (0.869) (1.749) t=10 -0.563*** -1.071 -2.518*** -3.351** (0.154) (0.677) (0.879) (1.603) t=11 -0.550*** -1.155* -2.530*** -3.641** (0.150) (0.671) (0.792) (1.510) t=12 -0.545*** -1.196* -2.610*** -3.796** (0.150) (0.677) (0.704) (1.496) t=13 -0.518*** -1.183* -2.535*** -3.751** (0.145) (0.647) (0.628) (1.416) t=14 -0.515*** -1.160* -2.543*** -3.731** (0.147) (0.651) (0.592) (1.460) t=15 -0.506*** -1.113* -2.518*** -3.646** (0.147) (0.633) (0.558) (1.439) t=16 -0.491*** -1.065* -2.418*** -3.560** (0.145) (0.631) (0.553) (1.452) t=17 -0.484*** -1.049 -2.442*** -3.488** (0.146) (0.626) (0.519) (1.472) t=18 -0.474*** -1.072 -2.390*** -3.582** (0.147) (0.646) (0.516) (1.530) t=19 -0.475*** -0.996 -2.411*** -3.397** (0.148) (0.640) (0.507) (1.561) t=20 -0.471*** -1.028 -2.406*** -3.510** (0.150) (0.665) (0.506) (1.609) t=21 -0.420*** -1.025 -2.181*** -3.476** (0.146) (0.674) (0.490) (1.641) t=22 -0.387** -1.025 -2.051*** -3.505** (0.144) (0.682) (0.467) (1.657) t=23 -0.347** -0.969 -1.892*** -3.356** (0.142) (0.677) (0.448) (1.650) t=24 -0.339** -0.956 -1.871*** -3.334* (0.143) (0.685) (0.448) (1.667) t=25 -0.311** -0.835 -1.675*** -2.982* (0.138) (0.663) (0.419) (1.666) t=26 -0.277** -0.754 -1.506*** -2.741* (0.135) (0.653) (0.404) (1.612) t=27 -0.242* -0.671 -1.331*** -2.490 (0.132) (0.637) (0.379) (1.550) t=28 -0.235* -0.678 -1.281*** -2.511 (0.134) (0.655) (0.387) (1.585) Observations 1135 1135 1135 1135 R-squared 0.965 0.965 0.967 0.967 Note: Dependent variable is the log of cumulative hybrid vehicle sales. All specifications include demeaned policy variables and time fixed effects. Above-median Insight market share states are those whose Insight market share in 2001 Q4 exceeds 39.9%. As instruments for the time–Insight market share interaction terms, we interact Honda registrations in 1999 and Toyota registrations in 1999 with time fixed effects. Standard errors are clustered by state.

37
Appendix: Dynamic Model
The utility that consumer i receives from a new vehicle j in period t is given by
Uijt = f(Xjθ +ηjt) + εijt,
where f is a utility function, Xj is a vector of observable qualities of vehicle j and ηj is the
unobservable quality of vehicle j.
In each period, consumer i receives n different unbiased, independent signals of vehicle
quality, ωi1,…,ωin. Information accumulates over time; we denote Ωit to be the set of n·t
vehicle-signals that a consumer has received from period 1 to period t.
Consumers beliefs about the unknown ηj formed from their set of observations at time t,
Ωit take the same form as in the static model. In addition to signals of vehicle quality, a
consumer can perfectly observe ηj through ownership. Let mit be the vehicle that consumer i
owns in period t, and let Mit = mit, mit-1, … mi1 be the set of all vehicles that she has owned
up through period t. In period t, consumer i has perfect information on any vehicle model in
Mit. Therefore, the consumer's subjective assessment of the unobservable quality of model b is
given by:
)( and )( if and and )( if
and )( if and if
if
)1()1(),(ˆ
0
0
0
itititit
itititit
ititit
itit
it
ncij
c
nbij
b
ititb
McMbcMcMb
McMbbMb
Mb
n
n
M
c
b
Ω∉Ω∉Ω∈∉Ω∉
∈Ω∉Ω∈∉
∈
−+−+=Ω
∑
∑
η
ηαωαηααη
ωη
η
The assessment of model c is defined symmetrically.
Given , , and , the consumer decides whether to purchase a new car at price p
(which includes the transaction costs of switching vehicles) or hold the vehicle that she owns at
the beginning of the period, in which case the vehicle suffers depreciation at a rate δ. We then
write the expected utility for consumer i in period t as
Uij =E [ f(Xjθ + η j – p)] + εij if purchasing a new vehicle
Uij =E [ f(δv·(Xjθ + η j ))] + εij if keeping old vehicle,
where v is the age of consumer i's vehicle at the beginning of the period. We assume that the
error term εij is mean zero, IID, and distributed with a Type-I extreme value distribution. The
consumer faces four discrete options: keep the old vehicle of purchase a new model of any of the
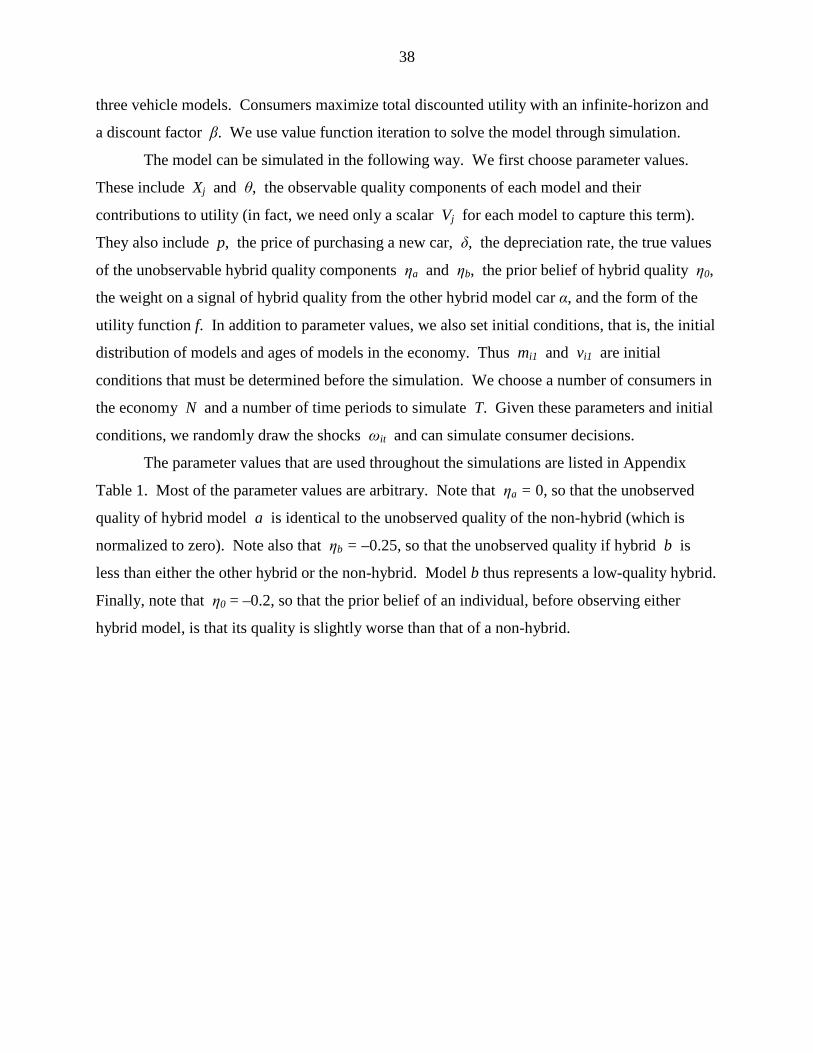
38
three vehicle models. Consumers maximize total discounted utility with an infinite-horizon and
a discount factor β. We use value function iteration to solve the model through simulation.
The model can be simulated in the following way. We first choose parameter values.
These include Xj and θ, the observable quality components of each model and their
contributions to utility (in fact, we need only a scalar Vj for each model to capture this term).
They also include p, the price of purchasing a new car, δ, the depreciation rate, the true values
of the unobservable hybrid quality components ηa and ηb, the prior belief of hybrid quality η0,
the weight on a signal of hybrid quality from the other hybrid model car α, and the form of the
utility function f. In addition to parameter values, we also set initial conditions, that is, the initial
distribution of models and ages of models in the economy. Thus mi1 and vi1 are initial
conditions that must be determined before the simulation. We choose a number of consumers in
the economy N and a number of time periods to simulate T. Given these parameters and initial
conditions, we randomly draw the shocks ωit and can simulate consumer decisions.
The parameter values that are used throughout the simulations are listed in Appendix
Table 1. Most of the parameter values are arbitrary. Note that ηa = 0, so that the unobserved
quality of hybrid model a is identical to the unobserved quality of the non-hybrid (which is
normalized to zero). Note also that ηb = –0.25, so that the unobserved quality if hybrid b is
less than either the other hybrid or the non-hybrid. Model b thus represents a low-quality hybrid.
Finally, note that η0 = –0.2, so that the prior belief of an individual, before observing either
hybrid model, is that its quality is slightly worse than that of a non-hybrid.
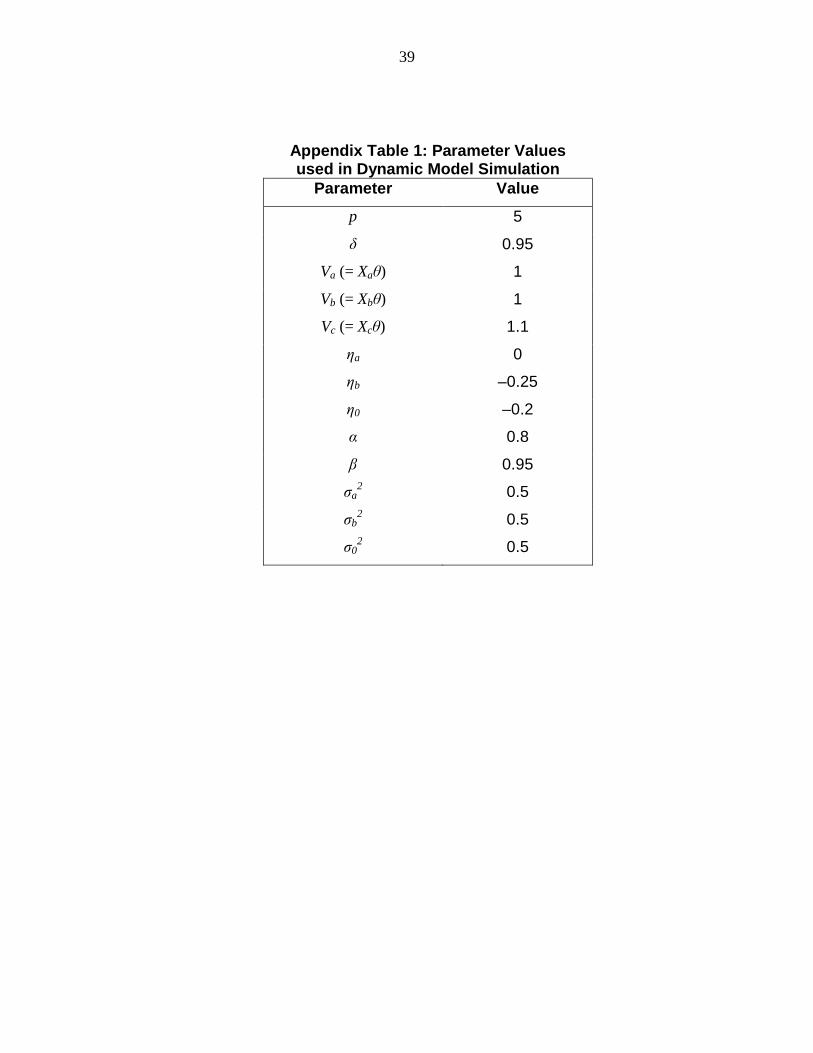
39
Appendix Table 1: Parameter Values used in Dynamic Model Simulation
Parameter Value
p 5
δ 0.95
Va (= Xaθ) 1
Vb (= Xbθ) 1
Vc (= Xcθ) 1.1
ηa 0
ηb –0.25
η0 –0.2
α 0.8
β 0.95
σa2 0.5
σb2 0.5
σ02 0.5

40
Appendix Table 2: IV Regressions, First-stage
Instrumented Variable Cumulative Insight Penetration Cumulative Prius Penetration Instrument Point Estimate Standard Error Point Estimate Standard Error Per Capita Honda Regs. (1999) * (t=4) 0.35 0.66 -3.85 0.68 Per Capita Honda Regs. (1999) * (t=5) 0.39 0.66 -4.06 0.69 Per Capita Honda Regs. (1999) * (t=6) 0.36 0.66 -4.01 0.69 Per Capita Honda Regs. (1999) * (t=7) 0.35 0.66 -4.01 0.69 Per Capita Honda Regs. (1999) * (t=8) 0.34 0.66 -3.96 0.69 Per Capita Honda Regs. (1999) * (t=9) 0.33 0.67 -3.94 0.70 Per Capita Honda Regs. (1999) * (t=10) 0.33 0.67 -3.91 0.70 Per Capita Honda Regs. (1999) * (t=11) 0.35 0.67 -3.90 0.70 Per Capita Honda Regs. (1999) * (t=12) 0.35 0.67 -3.91 0.70 Per Capita Honda Regs. (1999) * (t=13) 0.36 0.68 -3.95 0.71 Per Capita Honda Regs. (1999) * (t=14) 0.35 0.68 -3.96 0.71 Per Capita Honda Regs. (1999) * (t=15) 0.34 0.68 -3.97 0.70 Per Capita Honda Regs. (1999) * (t=16) 0.34 0.68 -3.97 0.70 Per Capita Honda Regs. (1999) * (t=17) 0.32 0.69 -4.04 0.71 Per Capita Honda Regs. (1999) * (t=18) 0.32 0.68 -4.04 0.71 Per Capita Honda Regs. (1999) * (t=19) 0.33 0.68 -4.03 0.71 Per Capita Honda Regs. (1999) * (t=20) 0.33 0.69 -4.03 0.71 Per Capita Honda Regs. (1999) * (t=21) 0.34 0.69 -4.06 0.72 Per Capita Honda Regs. (1999) * (t=22) 0.44 0.69 -4.00 0.72 Per Capita Honda Regs. (1999) * (t=23) 0.44 0.69 -4.00 0.72 Per Capita Honda Regs. (1999) * (t=24) 0.35 0.69 -4.03 0.72 Per Capita Honda Regs. (1999) * (t=25) 0.31 0.70 -4.06 0.72 Per Capita Honda Regs. (1999) * (t=26) 0.41 0.69 -4.06 0.72 Per Capita Honda Regs. (1999) * (t=27) 0.39 0.70 -4.06 0.72 Per Capita Honda Regs. (1999) * (t=28) 0.39 0.70 -4.08 0.72 Per Capita Toyota Regs. (1999) * (t=4) -0.05 0.48 2.99 0.49 Per Capita Toyota Regs. (1999) * (t=5) -0.09 0.48 3.07 0.50 Per Capita Toyota Regs. (1999) * (t=6) -0.06 0.48 3.05 0.50 Per Capita Toyota Regs. (1999) * (t=7) -0.06 0.48 3.08 0.50 Per Capita Toyota Regs. (1999) * (t=8) -0.05 0.48 3.05 0.50 Per Capita Toyota Regs. (1999) * (t=9) -0.04 0.49 3.03 0.50 Per Capita Toyota Regs. (1999) * (t=10) -0.04 0.48 3.02 0.50 Per Capita Toyota Regs. (1999) * (t=11) -0.05 0.48 3.02 0.50 Per Capita Toyota Regs. (1999) * (t=12) -0.05 0.48 3.02 0.50 Per Capita Toyota Regs. (1999) * (t=13) -0.06 0.49 3.06 0.51 Per Capita Toyota Regs. (1999) * (t=14) -0.05 0.49 3.07 0.51 Per Capita Toyota Regs. (1999) * (t=15) -0.05 0.49 3.07 0.51 Per Capita Toyota Regs. (1999) * (t=16) -0.05 0.49 3.07 0.51 Per Capita Toyota Regs. (1999) * (t=17) -0.04 0.50 3.12 0.51 Per Capita Toyota Regs. (1999) * (t=18) -0.03 0.49 3.12 0.51 Per Capita Toyota Regs. (1999) * (t=19) -0.04 0.49 3.12 0.51 Per Capita Toyota Regs. (1999) * (t=20) -0.03 0.50 3.12 0.52 Per Capita Toyota Regs. (1999) * (t=21) -0.04 0.50 3.14 0.52 Per Capita Toyota Regs. (1999) * (t=22) -0.04 0.50 3.15 0.52 Per Capita Toyota Regs. (1999) * (t=23) -0.02 0.50 3.14 0.52 Per Capita Toyota Regs. (1999) * (t=24) -0.01 0.50 3.12 0.52 Per Capita Toyota Regs. (1999) * (t=25) -0.01 0.50 3.14 0.52 Per Capita Toyota Regs. (1999) * (t=26) -0.10 0.50 3.13 0.52 Per Capita Toyota Regs. (1999) * (t=27) -0.11 0.50 3.12 0.52 Per Capita Toyota Regs. (1999) * (t=28) -0.15 0.50 3.12 0.52 F-statistic (p-value) 50.39 (0.000) 236.38 (0.000) Note: Coefficients for variables included in the second stage (retail gasoline price, state tax incentives, HOV lane access, demographics, state FE and time FE) are not reported. Standard errors clustered by state.