consumer willingness to pay for locally grown …ageconsearch.umn.edu/bitstream/6815/2/sp08ca06.pdf2...
TRANSCRIPT

1
Consumer Willingness to Pay for Locally Grown Products: The Case of South Carolina
Carlos E. Carpio Assistant Professor, Department of Applied Economics and Statistics, Clemson
University, Clemson, SC 29634-0313, [email protected]
Olga Isengildina-Massa
Assistant Professor, Department of Applied Economics and Statistics, Clemson University, Clemson, SC 29634-0313, [email protected]
Selected Paper prepared for presentation at the Southern Agricultural Economics Association Annual Meeting, Dallas, TX, February 2-6, 2008
Copyright 2008 by Carlos E. Carpio and Olga Isengildina-Massa. All rights reserved.
Readers may make verbatim copies of this document for non-commercial purposes by any means, provided that this copyright notice appears on all such copies.

2
Consumer Willingness to Pay for Locally Grown Products:
The Case of South Carolina
Abstract
The objective of this study is to evaluate South Carolina (SC) consumers’ willingness to
pay for “SC grown” products. Results indicate that consumers in SC are willing to pay an
average premium of 27% for local produce and 23% for local animal products.
Premiums for local products are influenced by age, gender, and income.
Key words: Contingent valuation, demand for local products, state branding and
promotion programs

3
Introduction
In recent years there has been an increase in consumer interest in locally produced
foods. A lead article in the March 12, 2007 issue of Time magazine labels “local… the
new ideal that promises healthier bodies and healthier planet” (Cloud, 2007). Consumer
interest in local foods is reflected in the continued growth of the number of farmers
markets which increased from 2,410 in 1996 to 4,385 in 2006 (AMS, 2006). This interest
also resulted in the success of the Whole Foods grocery chain which offers a variety of
locally grown products (Whole Foods Market, 2007). Other grocery chains are also
supporting this trend of emphasizing and offering locally grown products. For example,
Bi-Lo grocery stores, a SC-based chain, have promoted locally grown produce since 2004
(SCDA, 2004).
The rise in consumer interest in local foods has been accompanied by increased
participation of state departments of agriculture in promoting locally grown foods. While
“state grown” promotion programs have been in place since the 1930s, the number of
states conducting such programs went up from 23 to 43 between 1995 and 2006
(Patterson, 2006). A large portion of this increase resulted from the Community Food
Security Act, which generated $22 million of support for 166 local food system initiatives
from 1996 to 2003 (Tauber and Fisher, 2002). Previous research suggests that at least
some of these state branding and promotion programs have been successful.
Govindasamy et al. (2003) argue that the Jersey Fresh program provided a $32 return for
fruit and vegetable growers for every dollar invested in the program.
While this evidence suggests that consumers have strong preferences for locally
grown products, there is limited information about the exact magnitude and drivers of

4
these preferences. In fact, our literature review identified only a few studies that looked
at the demand for locally grown agricultural products. Eastwood, Brooker and Orr (1987)
argue that consumers in Tennessee have no strong preferences for or against locally
grown fresh produce with exception of tomatoes. However, it is likely that consumer
preferences have changed since this 1987 study. Jekanowski, Williams and Schiek
(2000) found that 60% of Indiana consumers were very likely to consume locally
produced food products. The remaining 40% of Indiana consumers in their study were
either neutral or somewhat likely to purchase locally produced food products. They found
that female consumers who have positive perception about local product quality and who
were long time state residents have a greater likelihood of purchasing local agricultural
products. Loureiro and Hine (2002) show that Colorado consumers are willing to pay a
higher premium for “local” than for “organic” or “GMO-free” attribute in potatoes. This
premium was calculated at 10% over the initial price with consumer preferences for
locally grown potatoes mostly driven by concerns about nutrition. In contrast, Brown
(2003) indicated that 58% of surveyed Missouri consumers were unwilling to pay a
premium for locally grown food products if they were of the same quality as other
products. However, 22% of respondents indicated that they would pay at least a 5 % (and
in some cases much greater) price premium. Darby et al. (2008) showed that Midwestern
consumers value locally grown strawberries more than strawberries grown elsewhere in
the U.S. Interestingly, consumers that shopped at direct marketing outlets were willing to
pay almost twice the premium of the grocery store shoppers ($0.92 vs. $0.48) per basket
of locally grown strawberries. The authors argued that the preference for a “local”
attribute is separate from the “freshness” and “less corporate” product attributes.

5
The literature reviewed here supports the argument by Giraud, Bond and Bond
(2005) that the premiums consumers are willing to pay for locally branded products vary
by state and by product. Given that no information is available about South Carolina
consumer’s preferences for locally grown products and importance of this information for
producers, retailers and government agencies involved in promoting locally produced
agricultural products, the primary objective of this study is to evaluate South Carolina
consumers’ willingness to pay for the “locally grown” characteristic in produce products
and animal products. A secondary objective is to identify the socio-demographic
characteristics affecting consumer preferences for the SC agricultural products.
This study uses a contingent valuation framework because this approach allows
isolating consumer preferences for a specific product attribute (“SC grown” in this case)
and measure consumer willingness to pay (WTP) for this attribute. In terms of a more
general contribution, most previous studies of consumer preferences have either focused
the importance of the “local” attribute at the specific product level (e.g., Darby et al.,
2008; Loureiro and Hine, 2002; Eastwood, Brooker and Orr, 1987), or at the aggregate
agricultural product level (Jekanowski, Williams and Schiek, 2000; Brown, 2003). This
study extends the literature by calculating and comparing consumer willingness to pay for
“local” attribute at an intermediate level of produce and animal product aggregation.
This information may be particularly useful for evaluating alternative investments in
different product promotions.
The results of this study will help policymakers and marketers to make more
informed decisions about consumer response to labeling and promotion of locally grown
products. This research will also provide these groups with a means of targeting

6
consumer groups that may be more responsive to promotion efforts. For policymakers
and marketers, estimates of the premiums that consumers are willing to pay for the
locally grown attribute in various products can guide promotion investment decisions and
efficient fund allocation. This issue is particularly important since many of the recent
state branding campaigns (including the effort just started in South Carolina) are taxpayer
funded.1 For producers, the information contained in this study may help select most
profitable marketing strategies.
Conceptual Framework
The contingent valuation framework is used to elicit South Carolina consumer
preferences for produce with the “SC grown” attribute. Contingent valuation methods
have been traditionally used to evaluate consumer preferences for non-market (e.g.
environmental) goods. However, in recent years contingent valuation has been applied to
measure consumer preferences for new products or products with new attributes or
features, such as genetically modified products (Kaneko and Chern, 2005; Loureiro and
Hine, 2002), or eco-labeled products (Loureiro, McCluskey and Mittelhammer, 2002).
We use contingent valuation approach because it allows us to concentrate on the “SC
grown” attribute in products and measure consumer willingness to pay (WTP) for this
specific attribute.
Contingent valuation methods ask respondents hypothetical questions about their
willingness to pay for products with specific attributes. Evaluation of consumer responses
to these questions also allows estimation of the proportion of population (i.e., market
share) willing to purchase a product with specific attribute at alternative prices (Louviere,

7
Hensher, and Swait, 2000). The product attribute examined in this study is the “South
Carolina grown” characteristic. The contingent valuation questions used in the consumer
survey are presented in Appendix 1. The questions use a dichotomous choice format,
where a responder is asked to identify his/her choice to buy or not to buy a product at the
stated price. Two types of products are investigated: produce products and animal
products. Surveyed individuals were initially asked if they would purchase an in-state or
out-of-state grown product at the same bid price, i.e., price differential (PDI) equal zero.
If respondents indicated a preference for in-state products, they were subsequently asked
if they would be willing to pay a randomly selected premium bid, i.e. price differential
(PDH) greater than zero, to consume the in-state grown product over the out-of-state
product. If they did not indicate a preference for in-state products in the first question, a
follow up question with a price bid was not asked.2
The initial and follow-up bids were expressed in terms of a percentage premium
over the product price for two reasons. First, the approach controls for cross-price effects
(Lusk and Hudson, 2004). Second, percentage premiums are a valid measure of price
regardless of the variability in the quality and quantity of products purchased by
households. The percentage price premium bids used for in-state products were 0% (for
initial bid) and 5%, 10%, 20%, 30% and 50% (for follow-up bid) above out-of-state
product prices and were determined by pre-testing of the survey.
The three possible responses to the bid scenarios are (1) a “no” to the first bid
(i.e., no preference for in-state over out-of-state products at 0% premium), (2) “yes” to
both bids (i.e., preference at 0% premium and preference at higher premium), (3) a “yes”
followed by a “no” (preference at 0% premium, but no preference at higher premium).

8
The sequence of questions defines the following ranges for the true WTP values: (-∞,
PDI], [PDI, PDH], [PDH, -∞). The following three discrete outcomes of the bidding
process are observable:
(1) ⎪⎩
⎪⎨
⎧
<<<
<=
WTPPDPDWTPPD
PDWTPD
H
HI
I
321
where WTP is the individual’s willingness to pay function for “South Carolina grown”
attribute in products. Assume that the WTP function is:
(2) uXWTP += β
where X is a vector of explanatory variables, β is a conformable vector of coefficients and
u is a random variable accounting for unobservable characteristics. If ),0(~ 2σFu ,
where F is a cumulative distribution function with mean zero and variance 2σ , then the
choice probabilities corresponding to expression (1) are:
(3)
)(1)()3(
)()()()2(
)()()1(
ββ
ββββ
ββ
XPDFXPDuPDP
XPDFXPDFXPDuXPDPDP
XPDFXPDuPDP
HH
LHHL
LL
−−=−<==
−−−=−<<−==
−=−<==
and the log-likelihood becomes:
(4) )](1[ln
)]()(ln[)(ln
3
21
β
βββ
XPDF
XPDFXPDFXPDFL
HD
LHD
LD
−−+
−−−+−=
∑
∑∑
where Dj indicates the group of individuals belonging to the jth bidding process outcome.
Given a choice for the F cumulative distribution function, the parametersβ and 2σ can
be estimated. Theoretically, the WTP for in-state produce can have both positive
(premium) and negative (discount) values.3 The WTP is also restricted in the lower tail

9
by a 100% discount (free good) and on the upper tail by the disposable income. The
results of this model are interpreted as the proportion of consumers willing to pay for
“South Carolina grown” attribute more than a stated premium (Louviere, Hensher and
Swait, 2000).
Estimation of the parameters in equation (4) requires an assumption about the
parametric distribution F. The most commonly assumed distribution functions for F are
the lognormal and normal distributions (e.g., Cameron, 1988; Lusk, 2003). The model
was estimated for both distributions to test for sensitivity of the results to the distribution
assumption. Maximization of the log-likelihood function (4) was performed using
MATLAB. The vector of explanatory variables in (2) included socio-demographic
characteristics of the individuals as well as the variables related with consumers’
perceptions and motivations. The socio-demographic characteristics included in (2) were
hypothesized to be similar to those influencing consumer expenditures on fruits and
vegetables in general (e.g., Nayga, 1995) and those included in other analyses of
consumer preferences for local products (e.g., Jekanowski, Williams, and Schiek, 2000).
In addition, consumer perceptions and motivations regarding state-grown products were
also hypothesized to influence their choice.
Data
The data for this study were collected by Richard Quinn and Associates via a
telephone survey of a random sample of South Carolina consumers conducted on March
7 and 8, 2007. The survey generated 500 observations. The survey was designed to
measure the attitudes and perceptions of South Carolina consumers about “SC grown”

10
agricultural products. The survey also collected information on the socioeconomic
characteristics of the respondents as well as consumers’ perceptions about the quality of
SC products and motivations to buy state grown products.
Table 1 presents a summary comparison of the socio-demographic characteristics
of the sample versus the state population. The survey respondents were slightly older,
wealthier, and better educated than the average South Carolina resident. The sample
proportion of female respondents and household size were similar to the corresponding
characteristics of the state population. The survey revealed that most South Carolinians
shop for groceries at least once a week and spend on average about $106 per shopping
trip. On an average shopping trip South Carolina residents spend about $21 on produce
and about $38 on animal products.
Table 2 presents the consumer responses to the contingent valuation questions for
produce. The survey revealed that at equal prices (0% premium), 95% of consumers
would choose state-grown produce over out-of-state produce. At a 5% premium level,
78% of consumers will still prefer state-grown fruits and vegetables. The South Carolina
preference in consumers decreases as the premium level increases, representing only 30%
of the market at the 50% premium level. Responses are very similar for animal products.
At equal prices, 94% of South Carolina consumers would choose state-grown animal
products over out-of-state animal products. At a 5% premium level, 75% of consumers
will still prefer state-grown animal products. At the higher premium levels, the market
share for state-grown animal products decreases more rapidly than for produce, with 33%
of consumers choosing state-grown animal products at the 30% premium level and only
14% of consumers choosing state-grown animal products at the 50% premium level.

11
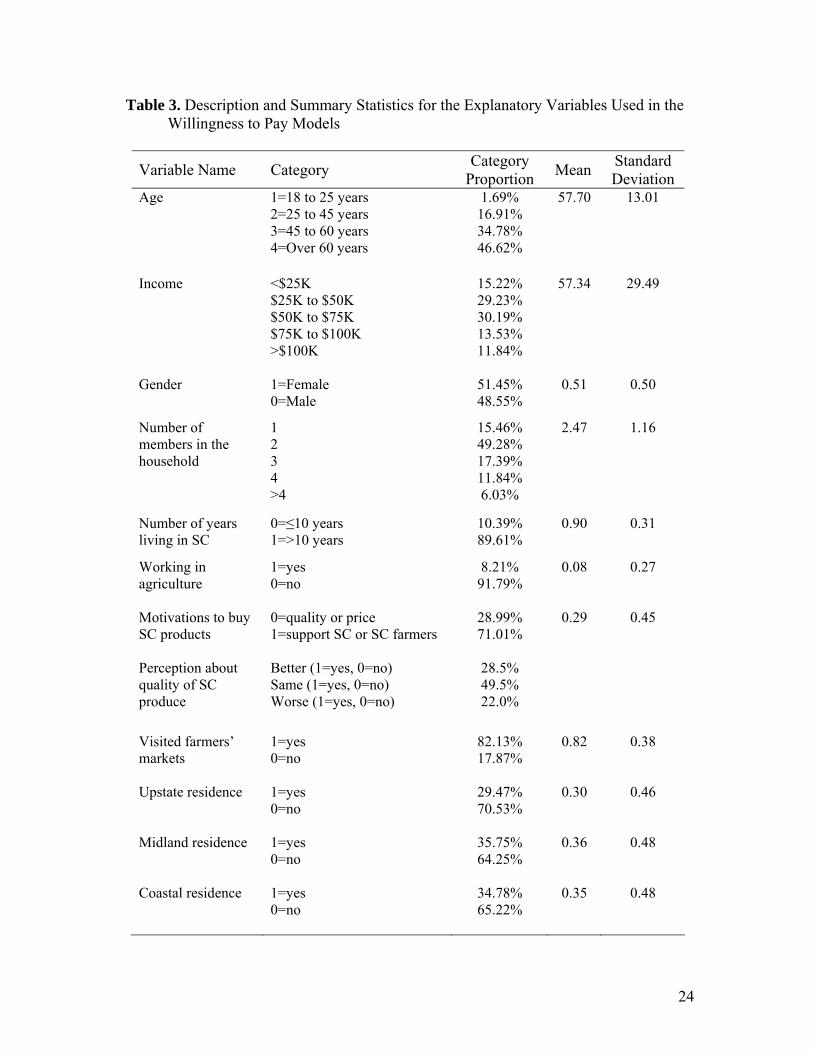
Table 3 presents summary statistics and definitions of the variables used in the
willingness to pay models. Socio-demographic factors hypothesized to influence
consumer willingness to pay for state-grown produce include age, income, gender,
location and number of members in the household (standard variables used in demand for
food models, e.g., Nayga, 1995).
Previous studies have shown that consumers often respond to non-pecuniary
factors in their choice of consumption locally grown products (e.g., Scarpa, Phillippidis,
and Spalantro, 2005; Eastwood, Brooker and Orr, 1987). Consumer characteristics
describing length of residence in the state, employment in agricultural sectors, and
making purchases through direct marketing outlets are included to represent these non-
pecuniary factors. It was also hypothesized that the motivation to buy SC products has an
impact on the premiums consumers are willing to pay for these products. The majority of
survey respondents (71%) indicated that their main motivation to buy SC products was
either to support SC farmers or the SC economy. Only 24% of respondents indicated that
their main motivation in choosing SC products was their superior quality. However, it is
not clear which motivation (quality or farmer support) would result in the highest
premium.
Finally, the perception about of the quality of SC products versus out of state
products was included as an explanatory variable in the WTP models. When consumers
were asked how the quality of SC products compares to out-of-state products, 78%
indicated that SC products were about the same or better quality than products from other
states. It was expected that consumers that have a positive perception about the quality of
the local products would be willing to pay a higher premium for these products.

12
Estimation Results
The estimation results section is divided in two parts. The first part presents the
results corresponding to the population mean willingness to pay measures and the
simulated demand curves and the second part shows the results related with the factors
driving the willingness to pay for South Carolina grown products.
The mean willingness to pay for SC produce and animal products was obtained by
estimating equation (2) using only an intercept. The resulting parameter estimates
correspond to the population mean willingness to pay premium (Cameron, 1988). The
results presented in table 4 show that mean willingness to pay for South Carolina grown
animal products was slightly lower than that for produce, 23% and 27.5%, respectively,
based on the model assuming a normal distribution. This finding is consistent with our
expectations because the local attribute may offer more advantages in produce than in
animal products. Still, it is important to point out that this difference in willingness to
pay premiums is very small with overlapping 95% confidence intervals.
There is little difference between the results estimated with a model assuming a
normal distribution and a model assuming a lognormal distribution, which suggests that
results are robust with respect to this assumption. Both sets of results are also consistent
with the empirical data shown in table 2, which suggests that the mean willingness to pay
is between 20% and 30%.
The models including only the intercept were also used to simulate demand
curves for South Carolina grown produce and animal products. Figure 1 presents the
simulated demand equations using the normal and lognormal models as well as the

13
empirical contingent valuation response data (as also shown in table 2). Points on the
simulated demand curves and the raw contingent valuation data points show the
proportion of the population (i.e., market share) that would choose SC grown products
over out-of-state products at various premium levels. Therefore, figure 1 can be used to
make comparisons between the simulated curves and the observed responses, between the
simulated demand equations assuming different distribution assumptions, and finally
between the demand curves for produce and animal products.
Figure 1 shows that simulated model results are very close to the observed
responses. Figure 1 also indicates that the demand curves based on normal and lognormal
distribution assumptions are similar. Finally, the comparison between the demand curves
for South Carolina grown produce and animal products reveals that the main difference
between them is the value of the intercept between the demand curves and the vertical
axis. This intercept represents the premium value at which all South Carolina consumers
will stop choosing South Carolina grown over out-of-state products. This premium is
higher for produce (85%) than for animal products (71%), which is consistent with the
empirical evidence showing that market share for animal products drops more rapidly as
the premium increases.
The estimated equations were also used to analyze the sensitivity of the demand
for the “South Carolina grown” attribute to changes in the premium level. Using the
estimated demand equations we found that the “premium” elasticity for the local attribute
at equal prices (0% premium) was -0.90 in produce, which indicates that at equal prices a
1% increase in the premium for SC produce relative to out-of-state produce will decrease
the share of the market by 0.90%. At the mean willingness to pay premium of 27.5%, the

14
price elasticity for produce was -1.80. South Carolina consumers are more sensitive to
changes in the premiums for local attribute in animal products relative to those in
produce. The “premium” elasticity for animal products is about -1.2 at zero price
premium and about -2.5 at the mean willingness to pay premium of 23%.4 This finding
does not necessarily imply a higher potential for a promotion program in fresh fruit and
vegetables. Since our survey revealed that South Carolinians spend about twice as much
on animal products as they do on produce, a smaller premium on animal products may
result in a greater overall market value of the “SC grown” attribute.
To investigate the importance of factors that are likely to affect consumer WTP
for South Carolina grown attribute in agricultural products, the WTP functions (equation
2) were estimated using the explanatory variables described in table 3. Results of the full
WTP model estimations are presented in Table 5.5 The marginal effects of the continuous
variables represent the change in the willingness to pay for SC grown products given a
one unit change in the variable. Thus, each additional year of age increases the
willingness to pay for the local attribute by 0.3% for produce and 0.2% for animal
products. Income was a statistically significant driver of consumer willingness to pay a
premium for local attribute in produce, but, interestingly, not in animal products. A
$10,000 increase in income was estimated to raise the willingness to pay premium for SC
produce and animal products by 0.6% and 0.2%, respectively. However, the income
effect in the WTP model for animal products was not statistically different from zero.
The effects of the other continuous variables included in the model (number of years
living in the state, number of members in the household) were not statistically significant
for either set of products.

15
The marginal effects of the dummy explanatory variables are interpreted relative
to the dummy variables not included in the model (a male consumer who lives in the
Coastal area of SC, who did not visit farmers’ markets in the previous year, does not
work in the agricultural sector, perceives SC produce as equal in quality to out of state
produce, whose main motivation to buy SC produce is based on quality/price). The
results suggest that consumer perception about the quality of SC products have a strong
impact on WTP for the local attribute. Individuals who perceive SC products being of
better quality than out-of-state products are willing to pay an 11% higher premium for
produce and a 6.5% higher premium for animal products than individuals who perceive
quality to be the same. On the other hand, relative to individuals who perceive local and
out state products to be the same, individuals who perceive SC products as being of lower
quality than out-of-state products are willing to pay a 5.6% and 2% lower premiums for
produce and animal products, respectively. This finding has several implications. First, a
special emphasis on the quality of the products may be an effective advertising tool.6
Another implication is that the campaign should direct efforts to assure that the
agricultural products using the SC grown logo or the advertising materials are of the best
possible quality.
The results also indicate that consumers whose main motivation for buying SC
products is to support SC farmers or the SC economy are willing to pay an additional
4.2% premium in produce and 3.3% premium in animal products relative to consumers
whose decision to buy SC grown products is driven by quality and price. This finding
suggests that promotional messages that encourage “hometown pride” may increase
campaign effectiveness.

16
Female consumers are willing to pay an additional 4.4% premium for local
characteristic in animal products relative to male consumers. No statistically significant
difference in premiums was detected between males and females for local attribute in
produce. This finding is important because traditionally females do the lion’s share of
household grocery shopping. As a result, their perceptions should carry greater weight in
actual markets. Accordingly, females should be a primary target of buy local campaigns
in general.
Individuals who visited farmers’ markets at least once during the previous year
are willing to pay an additional 6.1% premium for the local attribute in produce and a
4.2% premium in animal products. This result is consistent with the findings of Darby et
al. (2008) and it was expected since visiting farmers’ markets is associated with
consumer preference for locally produced fruits and vegetables. This finding suggests
that part of the campaign efforts should be focused on advertising SC products at
farmers’ markets, especially since 82% of the respondents reported visiting farmers’
markets at least once during the last twelve months. Furthermore, farmers’ markets have
the additional bonus of contributing directly to farm income and local economies
(Hughes et al., 2008).
Finally, individuals who work in the agricultural sector are willing to pay an
additional 8.2% premium in produce and an 8.5% premium in animal products for the
South Carolina grown attribute. This result may imply a greater “hometown pride” in
individuals employed in agricultural sector. However, it should be interpreted with care,
since the response bias based on the link with subsequent market prices in this case may

17
cause these individuals to overstate their preferences (producers willing to enhance their
own income).
Summary and Conclusions
The purpose of this study was to evaluate South Carolina consumers’ preferences
for South Carolina grown products. Specifically, the analysis focused on the estimation
of South Carolina consumers’ willingness to pay for the “SC grown” attribute in produce
and animal products and factors that affect these preferences. The data on consumer
preferences was collected via a telephone survey conducted on March 7 and 8, 2007.
The findings of this study suggest that South Carolinians have strong preferences
for South Carolina grown products. South Carolinians are willing to pay an average
premium of about 27% for state-grown produce and about 23% for state-grown animal
products relative to out-of-state grown products. This finding suggests good prospects
for the agricultural branding and promotion campaign in South Carolina if marketers are
able to differentiate and consumers are able to identify local products. Currently only
32% of consumers can identify SC products. It also indicates that South Carolina
producers can add value to their locally grown products by labeling and identifying them
as “SC grown.”
South Carolinians are more sensitive to changes in the premium for local attribute
in animal products than in produce, as the “premium” elasticity at the mean willingness
to pay is -2.5 for the former and -1.80 for the latter. However, this finding does not imply
that the biggest potential in a market labeling program is in the produce market. Our
survey revealed that South Carolinians spend about twice as much on animal products as

18
they do on produce. Therefore, a smaller premium on animal products may result in
greater overall market value of “SC grown” attribute.
Perceived product quality had a significant impact on the premiums consumers
are willing to pay for SC grown products. Thus, individuals who perceive SC products
being of better quality than out-of-state products are willing to pay 11% higher premium
for produce products and 6.5% higher premium for animal products than individuals who
perceive quality to be the same. This suggests that a campaign that puts an emphasis on
the quality of the South Carolina grown products may be effective. To protect the
premium consumers are willing to pay for South Carolina products the SC grown logo
should only be attached to products that achieve a specific quality standard. The fact that
the primary motivation for choosing SC grown produce is to support local farmers and
local economy (71% of respondents) rather than price and quality factors (29% of
respondents) suggests that South Carolina branding campaign may be successful despite
the fact that many SC consumers may be unable to detect differences in product quality.
Higher premium levels associated with the individuals who visit farmers markets
suggest that part of the campaign efforts should be focused on advertising SC products at
Farmers’ Markets, especially since 82% of the respondents reported visiting a Farmers’
Market at least once during the last twelve months. Farmers’ markets have the added
benefits of directly enhancing farm income and local economic activity. The fact that
willingness to pay for SC grown products increases with age and income (produce) and is
influence by gender (female for animal products) suggest additional promotion and
pricing opportunities at high-end grocery stores with programs and publications targeting
females.

19
The results of this study highlight the importance of monitoring changes in
consumer preferences in general and for local food systems in particular. For example, a
study examining consumer willingness to pay for selected local versus non-Tennessee
grown by Eastwood, Brooker and Orr (1987) found that consumers do not have strong
preferences for locally grown fresh produce. In contrast, our results indicate that in 2007
South Carolinians have strong preferences for locally grown products. Together, results
from the two studies imply that the local foods movement is starting to markedly change
consumer preferences. Hence, a major area of future research could be to determine
when this change began, how advanced is it, and to what degree can consumers be
expected to have stronger preferences for local foods in the future. Such an effort would
require investigating possible determining factors including but not limited to the
association between organic production and local food systems, news items touting the
benefits of local foods, and concerns about the food mile and energy consumption.

20
References
AMS. Farmers Market Growth 1994-2006. U.S. Dept. of Agriculture, Agricultural
Marketing Service. December 2006. Available:
http://www.ams.usda.gov/farmersmarkets/FarmersMarketGrowth.htm (Accessed
December 11, 2007).
Brown, C. “Consumers’ Preferences for Locally Produced Food: A Study in Southeast
Missouri.” American Journal of Alternative Agriculture 18(2003):213-224.
Cameron, T. “A New Paradigm for Valuing Non-Market Goods Using Reference Data,”
Journal of Environmental and Economics and Management 15(1988):355-379.
Cloud, J. “My Search for the Perfect Apple.” Time, March 12, 2007:43-50.
Darby, K., M.T. Batte, S. Ernst, and B. Roe. “Decomposing Local: A Conjoint Analysis
of Locally Produced Foods.” American Journal of Agricultural Economics
(2008) (forthcoming).
Eastwood, D.B., J.R. Brooker, and R.H. Orr. “Consumer Preferences for Local versus
Out-of-State Grown Selected Fresh Produce: The Case of Knoxville, Tennessee.”
Southern Journal of Agricultural Economics 19(December 1987):183-194.
Giraud, K.L., C.A. Bond, and J.J.Bond. “Consumer Preferences for Locally Made
Specialty Food Products across Northern New England.” Agricultural and
Resource Economics Review 34(2005): 204-216.
Govindasamy, R., B. Schilling, K. Sullivan, C. Turvey, L. Brown and V. Puduri.
“Returns to the Jersey Fresh Promotional Program: The Impacts of Promotional
Expenditures on Farm Cash Receipts in New Jersey.” Working Paper, Dept. of

21
Agricultural, Food and Resource Economics and the Food Policy Institute,
Rutgers, The State University of New Jersey, 2003.
Hughes, D.W., C. Brown, S. Miller, and T. McConnell. “Evaluating the Economic
Impact of Farmers’ Markets Using an Opportunity Cost Framework.” Journal of
Agricultural and Applied Economics 39, 1(April 2008) (forthcoming).
Jekanowski, M.D., D.R. Williams II, and William A. Schiek. “Consumers’ Willingness
to Purchase Locally Produced Agricultural Products: An Analysis of an Indiana
Survey.” Agricultural and Resource Economics Review 29, 8(April 2000):43-53.
Kaneko, N., and W.S. Chern. “Willingness to Pay for Genetically Modified Oil,
cornflakes, and Salmon: Evidence from a U.S. Telephone Survey.” Journal of
Agricultural and Applied Economics 37, 3 (December 2005):701-719.
Loureiro, M.L., and S. Hine. “Discovering Niche markets: a comparison of Consumer
Willingness to Pay for Local (Colorado Grown), Organic, and GMO-Free
Products.” Journal of Agricultural and Applied Economics 34, 3 (December
2002):477-487.
Loureiro, M.L., J.J. McCluskey, and R.C. Mittelhammer. “Will Consumers Pay a
Premium for Eco-labeled Apples?” The Journal of Consumer Affairs 3(Winter
2002): 203-218.
Louviere, J.J., D.A. Hensher, and J.D. Swait. Stated Choice Methods: Analysis and
Application. Cambridge: Cambridge University Press, 2000.
Lusk, J.L. 2003. “Effects of Cheap Talk on Consumer Willingness-to-Pay for Golden
Rice.” American Journal of Agricultural Economics 85(4):840-856.

22
Lusk, J.L., and M.D. Hudson. “Willingness-to-Pay Estimates and Their Relevance to
Agribusiness Decision Making.” Review of Agricultural Economics 26(Summer
2004):152-169.
Nayga, Jr., R.M. “Determinants of US Household Expenditures on Fruit and Vegetables:
a Note and Update.” Journal of Agricultural and Applied Economics, 27
(December 1995):588-594.
Patterson, P.M. “State-Grown Promotion Programs: Fresher, Better?” Choices 21(1st
Quarter 2006):41-46.
Patterson, P.M., H. Olofsson, T.J. Richards, T.J., and S. Sass. “An Empirical Analysis of
State Agricultural Product Promotions: A Case Study on Arizona Grown.”
Agribusiness: An International Journal 15(1999):179-196.
Scarpa, R., G. Phillippidis, and F. Spalatro. “Product-Country Images and Preference
Heterogeneity for Mediterranean Food Products: A Discrete Choice Framework.”
Agribusiness: An International Journal 21(2005):329-249.
South Carolina Department of Agriculture. “Locally Grown-Freshly Familiar” Campaign
Introduced by BI-LO.” May 24, 2004 Press Release. Available:
http://www.state.sc.us/scda/pressreleases/archives/2004pressreleases/may/pressrel
eases/bilo.htm (Accessed December 20, 2007).
Tauber, M and Fisher, A. “A Guide to Community Food Projects.” Community Food
Security Coalition, Venice, CA, 2002.
Whole Foods Market. Fresh and New. [Online]. Available:
http://www.wholefoodsmarket.com/freshnew/index.html. (Accessed December
11, 2007).

23
Table 1. Socio-Demographic Characteristics of Survey Respondents versus State Population
Note: State population data was obtained from the U.S. Census Bureau 2006 American Community Survey (available at http://www.census.gov/acs/www/).
Table 2. Consumer Choice of “State-Grown” Products Relative to Out-of-State Products
Produce Animal Products State-Grown Out-of-State State-Grown Out-of-State
Premium Percent Percent Percent Percent
0% 95 5 94 6
5% 78 22 75 25
10% 65 35 70 30
20% 57 43 55 45
30% 46 54 33 67
50% 30 70 14 86
Socio-demographic characteristics Sample State Population
Median age for population 18 years and older
45-60
40-44
Female
51.5% 51.3%
Median household income
$50,000-$75,000 $41,100
Persons per household
2.47 2.52
High school degree
92.0% 81.3%
24
Table 3. Description and Summary Statistics for the Explanatory Variables Used in the Willingness to Pay Models
Variable Name Category Category Proportion Mean Standard
Deviation Age 1=18 to 25 years
2=25 to 45 years 3=45 to 60 years 4=Over 60 years
1.69% 16.91% 34.78% 46.62%
57.70 13.01
Income <$25K $25K to $50K $50K to $75K $75K to $100K >$100K
15.22% 29.23% 30.19% 13.53% 11.84%
57.34 29.49
Gender 1=Female
0=Male 51.45% 48.55%
0.51 0.50
Number of members in the household
1 2 3 4 >4
15.46% 49.28% 17.39% 11.84% 6.03%
2.47 1.16
Number of years living in SC
0=≤10 years 1=>10 years
10.39% 89.61%
0.90 0.31
Working in agriculture
1=yes 0=no
8.21% 91.79%
0.08 0.27
Motivations to buy SC products
0=quality or price 1=support SC or SC farmers
28.99% 71.01%
0.29 0.45
Perception about quality of SC produce
Better (1=yes, 0=no) Same (1=yes, 0=no) Worse (1=yes, 0=no)
28.5% 49.5% 22.0%
Visited farmers’ markets
1=yes 0=no
82.13% 17.87%
0.82 0.38
Upstate residence 1=yes 0=no
29.47% 70.53%
0.30 0.46
Midland residence 1=yes 0=no
35.75% 64.25%
0.36 0.48
Coastal residence 1=yes 0=no
34.78% 65.22%
0.35 0.48

25
Table 4. Mean Willingness to Pay Premiums (%) for South Carolina Grown Products
Product Normal Model
Lognormal Model
Produce
27.5
[24.7, 30.2]
26.4
[23.5, 29.2]
Animal Products
23 [20.4, 25.5]
22 [19.4, 24.6]
Note: Estimates calculated using equation (2) with only an intercept. Numbers in brackets are the lower and upper bounds
of a 95% confidence interval

26
Table 5. Estimation Results of the Willingness to Pay Model for South Carolina Grown Products
Variable Produce Animal Products
Intercept 0.956*** (0.092)
1.069*** (0.087)
Age 0.003*** (0.001)
0.002** (0.001)
Income 0.006* (0.004)
0.002 (0.004)
Gender 0.016 (0.025)
0.044** (0.024)
Size of household -0.004 (0.012)
-0.005 (0.011)
Number of years living in SC 0.013 (0.040)
-0.028 (0.043)
Working in agriculture 0.082** (0.048)
0.085** (0.045)
Reasons for buying SC prod. 0.043* (0.027)
0.033* (0.025)
Perceive higher local quality 0.111*** (0.031)
0.065*** (0.028)
Perceive lower local quality -0.056** (0.030)
-0.020 (0.030)
Visited farmers’ markets 0.061** (0.031)
0.042* (0.031)
Upstate region 0.014 (0.031)
-0.021 (0.029)
Midland region 0.012 (0.030)
0.006 (0.028)
σ2 0.196*** (0.012)
0.167*** (0.011)
Log-likelihood -342.0 -272.1 Note: Numbers in parenthesis are asymptotic standard errors. One asterisk indicates significance at the 10% level, two asterisks indicate significance at the 5% level, and three asterisks indicate significance at the 1% level.

27
Panel A: Produce
-40-20
020406080
100120
0 10 20 30 40 50 60 70 80 90
Market Share (%)
Prem
ium
/Dis
coun
t for
SC
G
row
n (%
)
Normal Observed Lognormal
Panel B: Animal Products
-40-20
020406080
100120
0 10 20 30 40 50 60 70 80 90
Market Share (%)
Prem
ium
/Dis
coun
t for
SC
G
row
n (%
)
Normal Observed Lognormal
Figure 1. Demand for South Carolina (SC) Grown Products at Different Premium/Discount Levels

28
Appendix
Contingent Valuation Questions Used in the Consumer Survey
1. If you were buying vegetables or fruit from the market, and you could choose at equal prices between produce grown in South Carolina and out-of-state produce, which one would you choose? [Categorize based on response] Produce grown in SC [if chosen go to a] 1 Out-of-state produce 2 If the person takes more than a few seconds, ask: are you Not sure? 3 Makes no difference? 4 Don’t know? 5 a. [If produce marked as grown in SC was the respondent’s first choice then ask] Okay, what if the price of SC grown produce was [5%, 10%, 20%, 30%, 50%] more expensive than out of state products, which one would you choose? Produce marked as grown in SC 1 Out-of-state produce 2 If the person takes more than a few seconds, ask: are you Not sure? 3 Makes no difference? 4 Don’t know? 5 2. How about meat, fish, poultry and diary products? If you were buying animal products, and you could choose at equal prices between products grown in South Carolina and out-of-state products, which one would you choose? [Categorize based on response] Produce grown in SC [if chosen go to a] 1 Out-of-state produce 2 If the person takes more than a few seconds, ask: are you Not sure? 3 Makes no difference? 4 Don’t know? 5

29
a. [If SC produced animal products was the respondent’s first choice then ask] Okay, what if the price of SC produced animal products was [5%, 10%, 20%, 30%, 50%] more expensive than out of state products, which one would you choose?
SC produced animal products 1 Out-of-state animal products 2 If the person takes more than a few seconds, ask: are you Not sure? 3 Makes no difference? 4 Don’t know? 5

30
Endnotes
1 Part of the motivation for this study was to provide feedback to the SC Department of
Agriculture regarding the potential consumer response to the state branding campaign
prior to its implementation. The agricultural marketing and branding campaign in South
Carolina was launched on May 22, 2007 (subsequent to when our dated was collected).
The agricultural marketing and branding campaign was initially funded with a $500,000
grant from the South Carolina Department of Agriculture.
2 Statistically, ignoring the follow up question to a “no” answer to the first question does
not allow us to estimate the left side of the distribution more precisely. However, given
the small number of respondents that answer “no” to the first question, it will not likely
have a major impact on the final results.
3 If needed, re-scaled WTP values can be restricted to be higher than zero. 4 Given the differences between some of the socioeconomic characteristics of the
population and the sample, the mean willingness to pay was also estimated using a sub-
sample constructed by eliminating survey respondents that were older than 60 years. The
estimated mean willingness to pay value was very close to that obtained using the entire
sample.
5 In the interest of space results are only presented for the models that assume a normal
distribution. Results were very similar between the normal cdf WTP models the
lognormal cdf models. These results for lognormal cdf models are available from the
authors upon request.
6 Interestingly, campaign’s slogan is “Nothing’s fresher, nothing’s finer.”