consumeradvertising4.8
TRANSCRIPT

Direct-to-Consumer Advertising and Alternative Medicine Prescriptions: Evidence from
Advertising Expenditure Data and the Medical Expenditure Panel Survey
February 18, 2012
By Bram Gallagher
Abstract
The United States allows both direct-to-consumer advertising (DTCA) of prescription
medicine and the sale of untested complementary and alternative medicines (CAM) as dietary
supplements. I use a hurdle model to estimate the effect of DTCA for prescription drugs
indicated for five symptoms that both respond to the placebo effect and are most commonly
treated by CAM on prescriptions obtained for alternative remedies on the extensive and
intensive margins. Results from the Medical Expenditure Panel Survey and IMS Health
advertising data suggest that advertising expenditure does not have a significant effect on the
amount spent on CAM, but does have a significant positive effect on the number of CAM
prescriptions obtained in the population of people that obtained at least one CAM
prescription.
I. Introduction and Motivation
Only two industrialized countries, the United States and New Zealand, allow direct-to-
consumer advertisements (DTCA) for prescription pharmaceuticals. However, there is a long-
standing debate in these countries and in others about the potential good or harm DTCA
causes to the consumers of medicine. This is not an insignificant debate, as $4.9 Billion was
spent in 2007 in the US on DTCA of prescription medicines (Frosch et al., 2010). An
examination of the rapidly expanding expenditures on prescription drugs in the United States
found that DTCA by itself may be responsible for one-fifth of the increase in spending
between 1994-2005, not only by increasing the price of prescription drugs but also, and more
1

significantly, by increasing the usage of prescription drugs. The proportion of total
promotional expenditures accounted for by DTCA has risen from 14.2% in 1996 to 18.2% in
2005 while it has also seen a tremendous expansion in terms of absolute dollars, from $150
million in 1993 to the aforementioned $4.9 billion figure in 2007 (Dave and Saffer, 2010).
While the increase in DTCA has happened, the proportion of staff the FDA has employed to
ensure that ads follow regulations has fallen since at least 2002, and the proportion of
broadcast ads screened by the FDA before being approved has fallen dramatically, from 64%
in 1999 to 32% in 2004 (Donohue et al., 2007).
Auton (2006) reviewed the then-current arguments proposed by medical professionals
and economists in support of and against DTCA. Among the benefits of DTCA, he cites better
informed patients, reduction in under-treatment of ailments, and improved patient
compliance. He also lists patients pressuring their doctors for unnecessary drugs, confusion
about side-effects, increased medical risks from new drugs, and, interestingly, turning
“conditions common to human existence and ageing” into medical conditions as harmful
effects. The latter effect may reflect an opinion expressed strongly by Moynihan, Heath, and
Henry (2002), who wrote, “Pharmaceutical companies are actively involved in sponsoring the
definition of diseases and promoting them to both prescribers and consumers” and, on the
specific topic of irritable bowel syndrome, “what for many people is a mild functional
disorder-- requiring little more than reassurance about its benign natural course-- is being
reframed as a serious disease attracting a label and a drug, with all the associated harms and
costs.” Although these benefits and costs were not quantified by Auton (2006), a study by
Mintzes (2005) provides some insight into how these ads are viewed. Advertisers and
pharmaceutical groups viewed DTCA positively, while health professionals, consumer groups,
and public officials viewed them negatively.
2
There is some disagreement over whether DTCA actually encourages patients to seek
appropriate treatment, or merely influences them to switch brands of pharmaceuticals for an
ailment they are already treating. For instance, Rosenthal et al. (2003) find that DTCA
increases the use of the entire class of medicine being advertised rather than specific drugs,
while Kalyanaram (2009) reports empirical evidence of brand-switching as a result of DTCA.
Another potential benefit of DTCA could be that the ads promote a useful placebo
effect, reinforcing the perception of pharmaceuticals' effects. Placebo effects are generally
interpreted as conditioning patients to certain stimuli or establishing expectations for what
effects a drug will have (Almasi et al., 2006). A study of the content of DTCA found that 95%
of the ads contained an emotional appeal, often portraying a patient whose life is out of
control, and associating use of the drug with regaining that control and winning social
approval, a result which is consistent with these theories of placebo (Frosch et al., 2007). The
study concludes that the educational content of the ads is generally low.
If DTCA for prescription medicines increases demand for an entire class of drugs and
reinforces the placebo effect, DTCA ads may also increase the demand for untested,
alternative complementary and alternative medicine (CAM), defined by David Eisenberg as
“treatments that are neither generally taught in medical schools nor available at hospitals
Eisenberg et al., 1993).” CAM saw a marked increase in usage in the United States during the
1990's, with 33.8% in 1990 and 42.1% in 1997 of all Americans having used at least one CAM
therapy. In 2002 and 2007, respectively, 36% and 38.3% of Americans used at least one CAM
therapy in the previous year, excluding prayer (Fontarosa and Lundberg, 1998; Eisenburg et
al., 1998; Barnes et al., 2004; Barnes and Bloom, 2008). The apparent drop in the fraction of
CAM consumers between 1997 and 2002 may be due to differences in how CAM therapies are
defined in these studies rather than an indication of a real decrease in their popularity. The
3

increase in usage of CAM has occurred despite the fact that providers of CAM therapies,
including natural preparations, vitamin supplements, dietary supplements, or homeopathic
remedies, are not required to substantiate rigorously any claims about their effectiveness
(Dietary Supplement Health and Education Act of 1994). Although seemingly a rich subject
for economic analysis, CAM usage has been studied predominately by medical researchers.
There are some circumstances in which an enhanced placebo effect could actually work
against a patients long-term health, especially if less effective remedies are substituted for
those which are potentially more effective (Gallagher and Snow, 2011). This raises the
question of whether untested treatments are a complement to conventional medicine or if
they are substituting for conventional medicine in response to the increasing average out-of-
pocket expenses for prescription medicines that has occurred in the last decade (Stagnitti,
2007). A survey conducted in 1998 determined that 4.4% of individuals dismiss conventional
medicine in favor of CAM therapies, and found that most people who used CAM did so
because of personal beliefs rather than concerns about medical care costs (Astin, 1998). Druss
and Rosenheck (1999) indicated that, among patients who sought treatment for an ailment
and some preventative treatments, 2.7% used CAM remedies exclusively. One study of HIV
infected individuals found that 3% forwent conventional treatment in favor of CAM therapies,
and a quarter of patients took CAM therapies even though they had potentially adverse
reactions to the conventional treatment they received (Hsiao, 2003). Studies examining the
potential substitution effect usually do not focus on particular treatments or what the
treatments are used for, leaving open the question whether there are specific ailments for
which consumers are particularly likely to employ CAM therapies as a substitute for
conventional medicine.
4

II. Theory
Do advertisements for prescription drugs increase the demand for alternative remedies
traditionally used to treat similar symptoms? Since I would not expect a large fraction of the
population to consume uniform, positive amounts of alternative remedies, both the extensive
and intensive margins of alternative remedy consumption should be investigated. Specifically,
the extent to which DTCA influences the consumer to buy any amount of alternative remedies,
and how much alternative remedies the participating consumers consume in terms of the
number of individual prescriptions and the expenditure on them is the subject of this study.
Some consumers are observed to choose zero alternative remedies and others positive
amounts. This motivates the use of two distinct models for corner solution outcomes. For the
amount spent on alternative remedies I have a roughly continuous variable, expenditure, with
a positive probability of this outlay being zero for any given consumer. I can apply a pooled
Tobit model, specified as
E it=max0, x it uit , t=1,2,. .. ,T
u it | x it ~ N 0, 2(1)
where t is the month when observing new prescriptions and the round when examining total
expenditure, E, on new and existing prescriptions.
A defining feature of the Tobit model is that it forces the processes behind both
acquiring any prescriptions at all and the amount of prescriptions filled, if any are filled, to be
estimated jointly. If the underlying processes determining these two decisions are
fundamentally different, then employing a class of models known as hurdle models is
appropriate (Wooldridge, 2002; Cameron and Trivedi, 1998). I first estimate a model of
whether or not an individual purchases an alternative remedy, using the probit model
5

P y=0 | x =1−x , (2)
where Φ is the standard normal cumulative distribution function and y is binary variable that
is equal to one if there is either positive expenditure on alternative medicine prescriptions or a
positive number of prescriptions acquired and equal zero otherwise. After this step, I can
estimate the amount spent on alternative medicine, conditioned on some positive spending,
using the ordinary least-squares estimator with Huber-White (robust) standard errors.
For the number of acquired prescriptions, I use the Poisson distribution to obtain the
conditional probability
P y | y0, x = P y | x1−exp−
for y0 (3)
where μ=exp(xβ) and
P y | x = exp − y
y! (4)
(Long and Reese, 2006). I use the user-generated Stata module trpois0, created by Joseph
Hilbe (1999). This module is used as the second step of a two-step hurdle model procedure.
Since there is no loss of information between the steps, this two-step procedure is equivalent
to a model that maximizes a single likelihood (McDowell, 2003). This module also includes a
Huber-White (robust) variance estimator.
The negative binomial distribution is a viable alternative distribution for count models
when the data are over-dispersed, so alternative estimates using the negative binomial
distribution for the second step in the hurdle model are presented for comparison. When
using the negative binomial distribution, the conditional probability can be expressed as
P y | y0, x = P y | x
1−1 −1
for y0 (5)
where
6

P y | x = y−1y ! −1 −1
−1 a−1
−1
y
(6)
and α represents a parameter of unobserved heterogeneity (Long and Reese 2006). This
model is estimated using the Stata module trnbin0, also by Hilbe (1999).
The timing of advertisements is also important to the question of how advertising
expenditure affects alternative remedy acquisition and expenditures. While advertising in the
same period could be expected to have the greatest effect on sales, previous period ads may
also affect subsequent sales. The duration of the advertising effect on sales is an empirical
question that has generated some debate; the general consensus seems to suggest that the
effect lasts for months rather than years. Clarke (1976) presents a survey of early attempts to
estimate the duration of the advertising effect, and finds that it generally lasts from between
three to fifteen months, with the majority of the effect usually expressed in the first three
months. Leone (1995) finds empirical support for the conclusion that the advertising effect
duration is between three and nine months when taking into account biases that occur when
advertising data are excessively aggregated. Franses and Vroomen (2006), using two large
data sets, find that 95% of the advertising effect occurs within three months. These empirical
findings suggest that, when advertising data are aggregated by month, expenditure during the
current period and a distributed lag of expenditure over several previous months should
capture most of the advertising effect on sales.
III. Data
To provide some empirical insight into this problem, I use the Medical Expenditure
Panel Survey (MEPS), a survey conducted annually by the Agency for Healthcare Research
and Quality. This survey draws on subjects from the National Health Interview Survey (NHIS)
to provide data on medical expenditures in the United States. I use two components from
7

each of the releases of the survey from 2002 to 2007. The first is the household component,
which includes demographic data on the person being interviewed, such as race, income,
education, and marital status. The observations are then weighted to provide nationally
representative information. The second is the prescription medicine component, which
includes information on medicines and the cost of those medicines prescribed to and
purchased or obtained by the subjects in the household file. I use data publicly available since
the 2002 survey, when the survey began to include total amounts spent on prescriptions for
two alternative remedies: herbal remedies and nutraceutical products, which include dietary
supplements and vitamins.
I combine these two components to produce a data set that includes all individuals who
participated for the entire length of a survey year from the 2002 to 2007 releases. The data
include 116,112 unique individuals interviewed over an eighty-four month period beginning in
January 2001 and ending in December 2007. The MEPS is not a true panel when the survey
years 2002-2007 are pooled. Instead, it consists of seven overlapping panels, the first and last
of which contain information gathered in three rounds of interviews at approximately six
month intervals, with the rest containing five rounds. Therefore, each individual participates
in either three or five rounds, and each round is, on average, five and half months long;
however, the MEPS is structured so that the first round is often only one month long, the
month of the first interview. To include some information on prescription drug consumption
prior to the survey, I extend the first round to six months, resembling the overall average
round length.
During the complete scope of the data, 559 new prescriptions for alternative remedies
were written and acquired, and 1,549 instances of an individual acquiring a prescribed
alternative remedy were recorded. For individuals who consumed alternative remedies,
8

expenditures on them in a single round ranged from $1.85 to $2824.62, with $135.38 being
the average expenditure in any given round by an individual who consumes at least one
alternative remedy.
The data set includes variables specific to the individuals concerning age, marital
status, gender, race, education, and annual income. Table 1 provides some descriptive
statistics for these variables. Educational attainment is defined as the highest degree obtained
at the time of the first interview. Personal annual income may be negative because it includes
losses by individually owned businesses. The variable Poverty Category measures the
individual's family income as a percentage of the poverty level in 100% increments and is
bottom-coded at 100% and top-coded at 500%. For the purposes of analysis, I have split this
variable into four categories, the lowest category being the excluded dummy variable. The
Hispanic variable includes all individuals who report being Hispanic, regardless of race. The
black and Asian variables indicate individuals who report being black or Asian but not
Hispanic. The excluded race category is all other races besides black and Asian who do not
report being Hispanic. The HS degree variable includes both holders of high school diplomas,
individuals who have passed the GED test, and individuals who reported having some college
education but not having finished college. The excluded education category is not having a
degree, and the apparently low percentage of respondents that have any degree reflects the
oversampling of children. Age is top-coded at 85 for privacy reasons.
9

Because of the original design of the NHIS, specific groups such as Hispanics, children,
and blacks are oversampled. The MEPS is intended to provide nationally representative data
on the non-institutionalized, civilian population, and so includes a sample weight for each
individual based on race, age, poverty status, region, and metropolitan statistical area, using
the Current Population Survey as the control. Unless otherwise indicated, I use these
sampling weights in each estimation procedure.
10
Table 1: Summary Statistics for Entire PopulationVariable Mean Min Max
Income 19102.05 26095.34 -61641 430904Poverty Category 3.4 1.39 1 5Male 47% 50% 0 1Hispanic 26% 44% 0 1Black 16% 37% 0 1Asian 4% 20% 0 1HS degree 34% 47% 0 1Bachelor's 9% 29% 0 1Graduate degree 5% 21% 0 1Other degree 5% 21% 0 1Age 34.4 22.45 0 85Married 0.38 0.48 0 1
N=116112
Std. Dev.
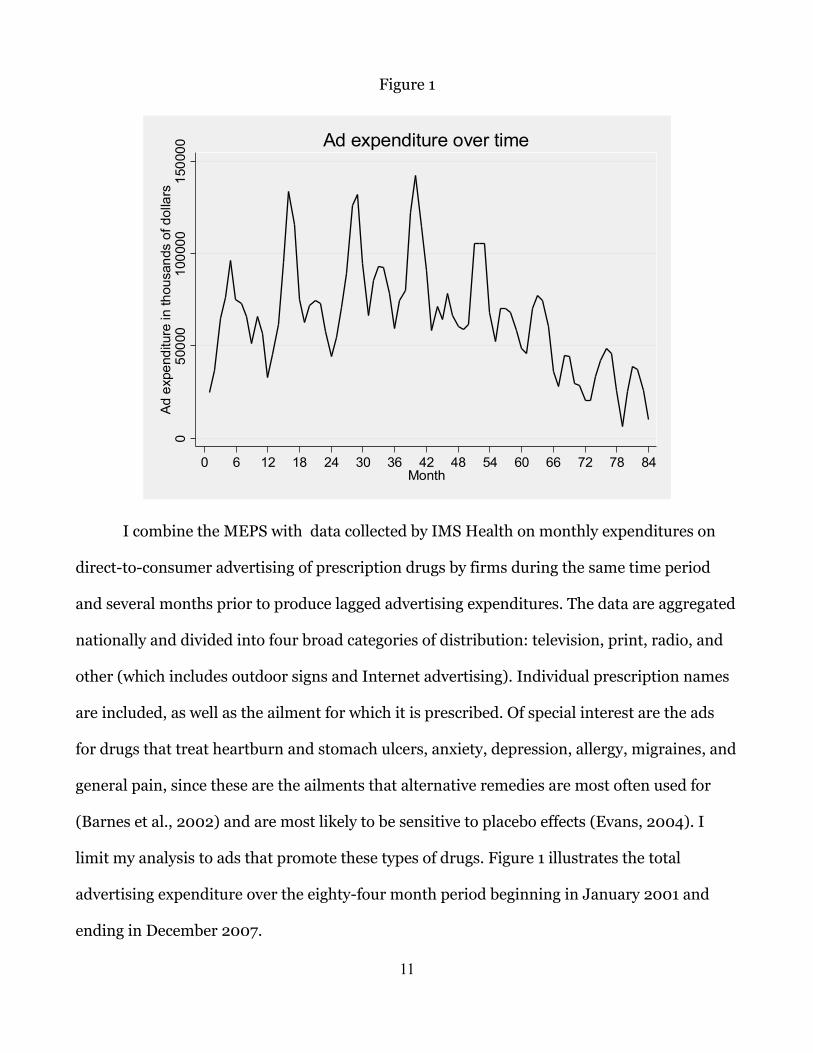
Figure 1
I combine the MEPS with data collected by IMS Health on monthly expenditures on
direct-to-consumer advertising of prescription drugs by firms during the same time period
and several months prior to produce lagged advertising expenditures. The data are aggregated
nationally and divided into four broad categories of distribution: television, print, radio, and
other (which includes outdoor signs and Internet advertising). Individual prescription names
are included, as well as the ailment for which it is prescribed. Of special interest are the ads
for drugs that treat heartburn and stomach ulcers, anxiety, depression, allergy, migraines, and
general pain, since these are the ailments that alternative remedies are most often used for
(Barnes et al., 2002) and are most likely to be sensitive to placebo effects (Evans, 2004). I
limit my analysis to ads that promote these types of drugs. Figure 1 illustrates the total
advertising expenditure over the eighty-four month period beginning in January 2001 and
ending in December 2007.
11
050
000
1000
0015
0000
Ad e
xpen
ditu
re in
thou
sand
s of
dol
lars
0 6 12 18 24 30 36 42 48 54 60 66 72 78 84Month
Ad expenditure over time
There is some apparent annual periodicity leading to large spikes in ad expenditure in
the month of April, which has a mean expenditure that is 154% of the overall mean. The peak
advertising month is April 2004, with an expenditure of $142,097,090. Regressing ad
expenditure on the month before and after this peak shows clear linear trends, robust to
including April as a control variable, as summarized in Table 2.
This is in contrast to the general trend of increasing new prescriptions over the same period,
as illustrated by figure 2.
The ad data are combined with the MEPS data in two ways. New prescriptions
generated during the course of the survey are reported by month, as are ad expenditures. For
the part of the survey population that acquired at least one new prescription of any kind, ad
expenditures are matched to each month that the individual was active in the survey,
including at least six months for round one. This combination is used to examine the effect of
ads for conventional drugs indicated for the five previously identified ailments on new
prescriptions for alternative medicine. I include as explanatory variables for new prescriptions
the advertising expenditure in the current month, as well as a distributed lag of advertising
expenditure for the three previous months.
12
Table 2: OLS Regression of Ad Expenditure Prior to and After April, 2004All Months Prior After Prior, April After, April
Month -515.3** 1089.6** -1731.8** 1039** -1663.5**(118.2) (340.5) (205) (287) (177.3)
April 44989** 32370.4**(11043.1) (8091.6)
n= 84 40 45 40 45Significance levels: +:10% *:5% **:1%

Figure 2
For total expenditure and number of prescriptions, the MEPS aggregates by round.
Each individual has a value for each round that describes the total number of alternative
remedies that each individual consumer reported acquiring during that round and how much
in total was spent on alternative remedies during that round. Since the average round length
is more than five months, only expenditures in the current round are considered. This
aggregation produces some measurement error because remedies could have been bought in
months before ads were released or ads released at the end of one round could convince a
consumer to acquire alternative remedies at the beginning of the next round. Weighting of ads
in the beginning of the round may help to provide better estimates of the causal effect of prior
advertising on current-round consumption.
13
010
2030
New
Pre
scrip
tions
0 6 12 18 24 30 36 42 48 54 60 66 72 78 84Month
New prescriptions over time

IV. Results
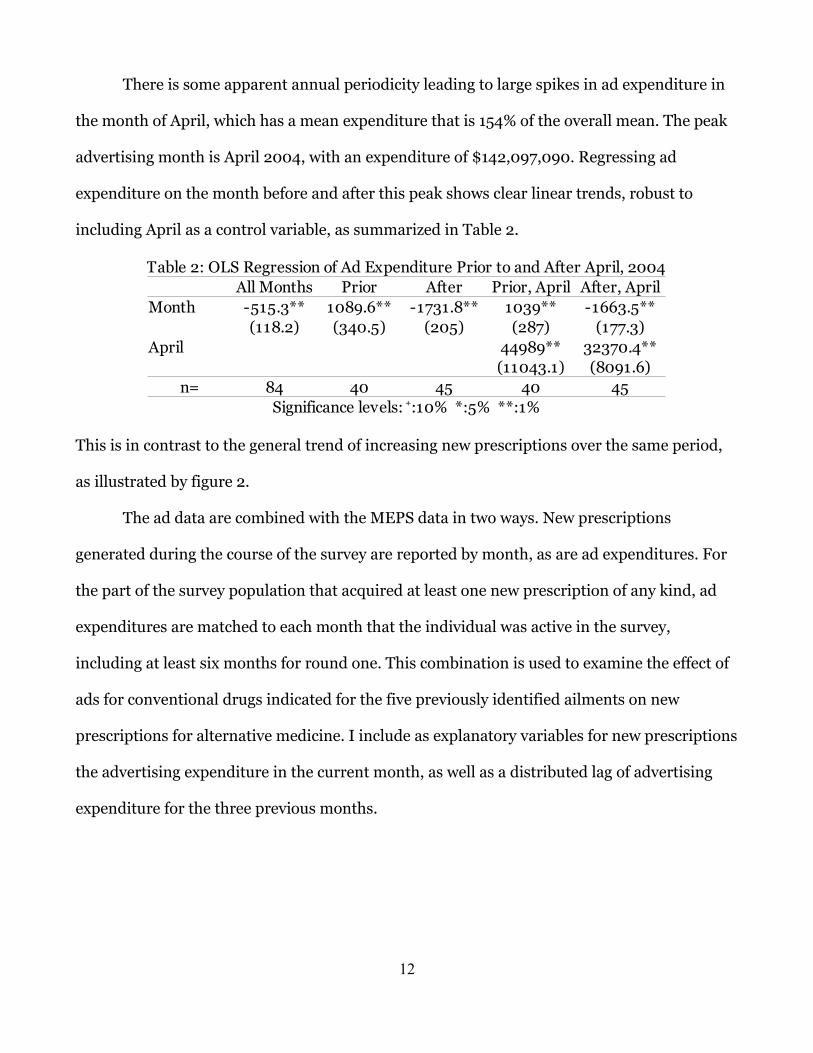
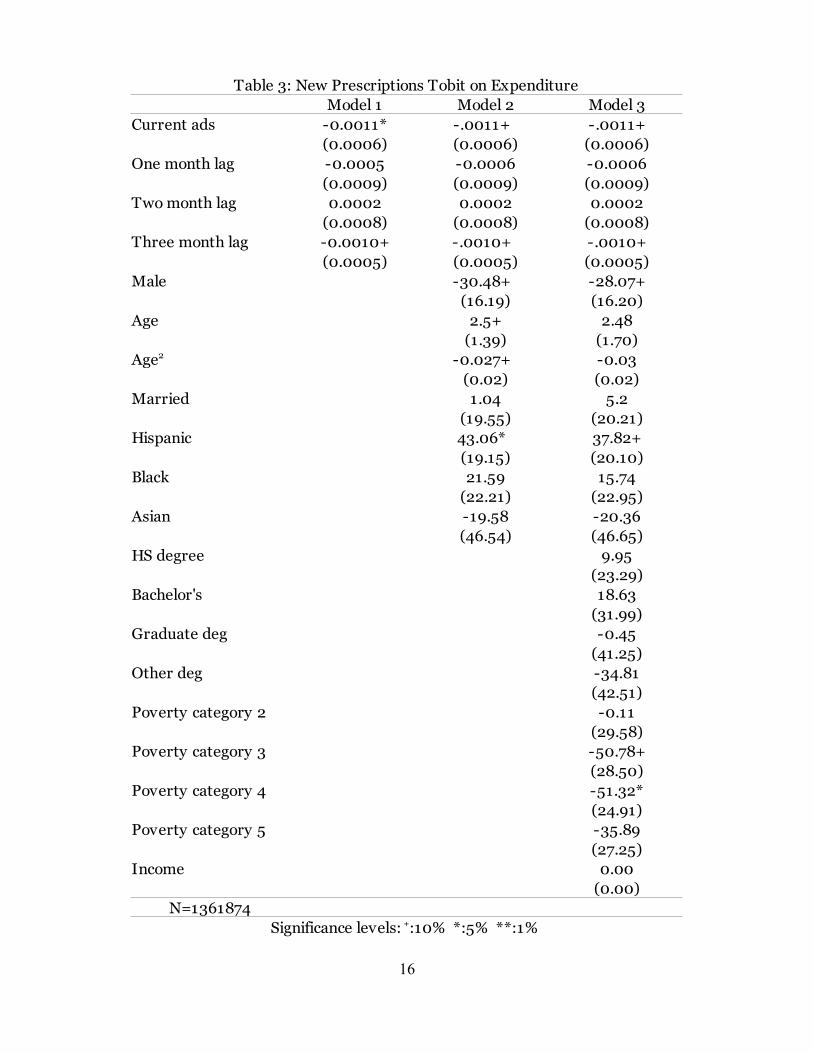
Turning first to new prescriptions, since most respondents spend zero dollars on new
alternative remedy prescriptions for any particular month, I employ a Tobit model to estimate
the effect of advertising (expressed in thousands of dollars) on expenditure on new alternative
medicine prescriptions (expressed in dollars). Table 3 summarizes the results for the Tobit
model. The new prescription analysis only includes the survey respondents who had acquired
at least one new prescription during the course of the survey-- 71,019 out the total of 116,112
unique individuals included in all the surveys examined in this study. The number of
observations for these models is, in this case, 1,361,874 since each person is examined over
each month he or she was included in the survey.
To test the robustness of the estimates to changes in model specification, several
alternative specifications are estimated. The first is a simple bivariate model of total ad
expenditure and prescription expenditure. The second model adds demographic variables.
The third model adds socioeconomic status variables.
The results from Table 3 indicate that current ad expenditure has a weak, negative
effect on expenditures on new alternative medicine prescriptions. The range of total ad
expenditures is $6,804,300 to $142,097,090 per month, leading to a total range of current ad
expenditures' potential effect on alternative remedy expenditures of about $7.50 to $156. The
magnitude of the effect is nearly identical for each of the three model specifications,
suggesting that the result is robust to changes in those model specifications. The three month
lag also has a nearly identical effect in both magnitude and precision.
Males spend about $30 less on alternative medicine acquisition than observationally
equivalent females, while Hispanics about $40 more on average than non-Hispanics. As
people age, they spend $2.50 more per year on alternative medicine, but this effect is
14

imprecisely estimated. The quadratic formulation suggests that this effect attenuates with age.
While education seems not to affect spending on new prescription alternative medicine
prescriptions, being in the middle poverty categories (i.e. being in a household that earns
between 201% and 400% of poverty level income) reduces the acquisition of alternative
medicine by about $50. When taking into account household income, individual income has
no effect on acquisition of alternative remedies.
An important feature of the Tobit model is that it forces the process underlying the
choice to acquire zero or positive amounts of alternative remedies to be the same. An
alternative model for corner-solution outcomes is the hurdle model, which allows the two
processes to be estimated separately. Specifically, a probit model can be used to model the
binomial choice of whether or not to acquire alternative medicine. A zero-truncated count
model can be used to see how many new prescriptions individuals acquire, and a standard
regression model can be used to estimate the amount spent given that they obtain at least one
prescription. Table 4 summarizes the results of estimating a probit model of the effects of
advertising expenditure, this time measured in millions of dollars merely to scale the results,
on the extensive margin of acquiring new prescriptions.
The estimated results match up with the Tobit model of expenditures in sign and
significance. Current and three-month lagged expenditure have a significant, negative effect
on the probability that a respondent will acquire an alternative remedy prescription. Being
male, again, has a negative effect on acquiring prescriptions, while being Hispanic has a
positive effect. Age has a weak positive effect when not including socioeconomic status
variables. The middle poverty categories have a negative effect.
15
16
Table 3: New Prescriptions Tobit on ExpenditureModel 1 Model 2 Model 3
Current ads -0.0011*(0.0006) (0.0006) (0.0006)
One month lag -0.0005 -0.0006 -0.0006(0.0009) (0.0009) (0.0009)
Two month lag 0.0002 0.0002 0.0002(0.0008) (0.0008) (0.0008)
Three month lag -0.0010+(0.0005) (0.0005) (0.0005)
Male -30.48+ -28.07+(16.19) (16.20)
Age 2.5+ 2.48(1.39) (1.70)
-0.027+ -0.03(0.02) (0.02)
Married 1.04 5.2(19.55) (20.21)
Hispanic 43.06* 37.82+(19.15) (20.10)
Black 21.59 15.74(22.21) (22.95)
Asian -19.58 -20.36(46.54) (46.65)
HS degree 9.95(23.29)
Bachelor's 18.63(31.99)
Graduate deg -0.45(41.25)
Other deg -34.81(42.51)
Poverty category 2 -0.11(29.58)
Poverty category 3 -50.78+(28.50)
Poverty category 4 -51.32*(24.91)
Poverty category 5 -35.89(27.25)
Income 0.00(0.00)
N=1361874
-.0011+ -.0011+
-.0010+ -.0010+
Age2
Significance levels: +:10% *:5% **:1%

17
Model 1 Model 2 Model 3Current ads -0.0026+ -0.0026+ -0.0025+
-(0.0013) -(0.0013) -(0.0013)One month lag -0.0013 -0.0014 -0.0014
-(0.0020) -(0.0020) -(0.0020)Two month lag 0.0006 0.0006 0.0006
-(0.0020) -(0.0020) -(0.0020)Three month lag -0.0023+ -0.0023+ -0.0024+
-(0.0013) -(0.0013) -(0.0013)Male -0.0844* -0.0795*
-(0.04) -(0.04)Age 0.01+ 0.01
(0.00) (0.00)0.00 0.00
(0.00) (0.00)Married 0.01 0.02
-(0.05) -(0.05)Hispanic 0.110* 0.0961*
-(0.05) -(0.05)Black 0.06 0.05
-(0.05) -(0.06)Asian -0.07 -0.07
-(0.11) -(0.11)HS degree 0.02
-(0.06)Bachelor's 0.04
-(0.08)Graduate deg 0.00
-(0.10)Other deg -0.08
-(0.10)Poverty category 2 0.00
-(0.07)Poverty category 3 -0.123+
-(0.07)Poverty category 4 -0.127*
-(0.06)Poverty category 5 -0.10
-(0.07)Income 0.00
(0.00)N=1361874
Table 4: New Prescriptions Probit on Decision to Buy
Age2
Significance levels: +:10% *:5% **:1% ***: .1%

18
Table 5: New Prescriptions Hurdle RegressionModel 1 Model 2 Model 3
Current ads -0.0006 -0.0011 -.0013+ (0.0007) (0.0007) (0.0007)
One month lag 0.0003 0.0009 0.0009(0.0011) (0.0010) (0.0011)
Two month lag -0.0005 -0.0008 -0.0006(0.0008) (0.0007) (0.0008)
Three month lag -0.0008 -0.0004 -0.0006(0.0005) (0.0005) (0.0005)
Male 55.12* 67.96** (24.09) (26.05)
Age 5.18* 6.666* (2.57) (2.91)
-.0541* -.066* (0.03) (0.03)
Married -21.86 -37.98(25.50) (31.12)
Hispanic -40.7* -31.7+(19.05) (20.00)
Black -42.11* -31.47(20.26) (20.78)
Asian 97.51 160.72(101.34) (96.16)
HS degree 17.37(26.06)
Bachelor's 31.01(34.92)
Graduate deg 52.43(36.90)
Other deg -40.43(53.69)
Poverty category 2 -36.67(24.85)
Poverty category 3 -7.82(28.05)
Poverty category 4 -5.83(28.96)
Poverty category 5 32.32(37.25)
Income -.0014* (0.00)
N=281
Age2
Significance levels: +:10% *:5% **:1%

The second step of the hurdle model is either an OLS regression for the continuous
variable expenditure, or a zero-truncated count model for the number of acquired new
prescriptions. This can be modeled alternately as having a Poisson or negative-binomial
distribution depending on whether or not the data is over-dispersed. Table 5 summarizes the
results of the regression model with advertising expenditure measured in thousands of
dollars, and table 6 summarizes the results of the zero-truncated count model with advertising
expenditure measured in millions of dollars, again for scaling purposes. Count models
followed by (P) use the Poisson distribution, while models followed by (NB) use the negative
binomial. The number of observations is much smaller than before, since these models are
conditioned on respondents acquiring alternative remedy prescriptions. The regression
model, despite conditioning on acquiring alternative medicine, produces similar, though
generally less precise, estimates of the effects of current and three month lagged advertising
expenditure. However, being male or Hispanic switch signs for the conditional sample,
implying an increase in expenditure of between $55 and $68 and a decrease in expenditure of
between $32 and $41, respectively. The effect of age is more precisely estimated and larger in
magnitude, suggesting an increase in expenditure of $5 to $7 for each year of age, with the
same negative quadratic effect. The coefficient on black becomes significant in Model 2,
reducing expenditure by $42. For the conditional sample, poverty categories no longer affect
expenditure, while a $1,000 increase in annual individual income now predicts a $1.36
reduction in expenditure.
19

Turning to the count model estimates, as summarized in Table 6, I now find that
advertising expenditure has a positive effect on the number of prescriptions for all models.
20
Table 6: New Prescriptions Hurdle Model, Poisson and Negative Binomial DistributionsModel 1 (P) Model 2 (P) Model 3 (P) Model 1 (NB) Model 2 (NB) Model 3 (NB)
Current ads 0.0081* 0.0085* 0.012** 0.0091 0.000010+ 0.000011+(0.0037) (0.0037) (0.0037) (0.0061) (0.0057) (0.0055)
One month lag -0.0067 -0.0075 -0.012* -0.0058 -0.0086 -0.0111(0.0061) (0.0062) (0.0061) (0.0095) (0.0090) (0.0087)
Two month lag 0.0051 0.0073 0.0113 0.0043 0.0092 0.0139(0.0062) (0.0000) (0.0064) (0.0101) (0.0095) (0.0094)
Three month lag -0.0057 -0.0081* -0.011* -0.0067 -0.0099 -0.0137* (0.0040) (0.0041) (0.0042) (0.0068) (0.0064) (0.0064)
Male -0.428** -0.374* -0.551** -0.442* -(0.14) -(0.15) -(0.21) -(0.21)
Age -0.01+ -0.01 -0.01 0.00-(0.01) -(0.01) -(0.02) -(0.02)
0.00 0.00 0.00 0.00(0.00) (0.00) (0.00) (0.00)
Married 0.337* 0.462** 0.431* 0.516* -(0.14) -(0.15) -(0.21) -(0.21)
Hispanic -0.434** -0.574** -0.562* -0.719** -(0.16) -(0.16) -(0.23) -(0.24)
Black 0.20 0.12 0.29 0.16-(0.15) -(0.15) -(0.26) -(0.25)
Asian 0.44 0.44 0.5 0.73-(0.29) -(0.29) -(0.56) -(0.54)
HS degree -0.05 0.02-(0.15) -(0.22)
Bachelor's 0.13 0.23-(0.23) -(0.36)
Graduate deg -0.27 -0.19-(0.32) -(0.47)
Other deg -0.29 -0.43-(0.39) -(0.54)
Poverty category 2 0.08 0.24-(0.20) -(0.32)
Poverty category 3 -0.22 -0.27-(0.18) -(0.29)
Poverty category 4 -0.62 -0.691* -(0.19) -(0.28)
Poverty category 5 -0.562** -0.657* -(0.20) -(0.31)
Income 0.00 0.00(0.00) (0.00)
N=294
Age2
Significance levels: +:10% *:5% **:1%

With the exception of Model 1 for the negative binomial case, this effect is precisely estimated.
Using the range of total ad expenditure, the total difference that advertising makes on
alternative medicine prescriptions for people that acquire at least some alternative medicine is
equivalent to slightly more than one monthly prescription. The three month lagged
expenditure has a smaller, negative effect, and for Model 3 in the Poisson case, so does the
one month lagged expenditure. Being male and an increase in age both now have negative
effects. Thus, while being male and older generally leads to higher expenditure, it reduces the
number of individual prescriptions. Being married increases the average number of
prescriptions by up to one half a prescription on average, and being Hispanic or in the above-
described middle poverty categories reduces the number of prescriptions by as much 0.7
prescriptions.
Next, I estimate the models using the entire sample and the total acquisitions of
alternative remedies, including individuals who did not acquire any new prescriptions during
the duration of the survey and existing prescriptions. Since monthly data are only reported for
new prescriptions, the data for this section are aggregated by round, so expenditure on both
advertising and on all prescriptions is the sum of all monthly expenditures during a particular
round, measured in thousands of dollars for the Tobit and regression models and millions for
the probit and zero-truncated count models. The number of prescriptions includes new
prescriptions and preexisting prescriptions from prior to that round still being taken. The
tables are labeled “round-only” to indicate that the level of measurement is now the individual
respondents' round instead of month.
Table 7 summarizes the results of a estimating Tobit model on the round-only data.
Model 4 includes disaggregated current-round ad expenditure in the four broad media
classes. The estimated coefficients on current expenditure are again negative and precisely
21

estimated. Their magnitudes are predictably smaller, since I am not conditioning on
respondents having acquired at least one prescription. Being male lowers expenditure about
$65, but the effect of age is not statistically significant. While being Hispanic now only barely
decreases expenditure, being Asian is associated with about $120 to $130 lower expenditure.
Of the socioeconomic status variables, having an “other degree” is associated with about $80
lower expenditure, and the middle poverty categories are both associated with about $85
lower expenditure and are precisely estimated. When disaggregated current ad expenditure is
introduced, only radio advertisements have a significant effect and represents more than one
and a half cent lower expenditure on alternative medicine per $1,000 of radio advertisements.
22

23
Table 7: Round Only Tobit on ExpenditureModel 1 Model 2 Model 3 Model 4
Current ads(0.0001) (0.0001) (0.0001)
Male -66.7** -63.72** -63.29**(17.59) (17.87) (17.85)
Age 1.35 2.38 2.46(1.56) (1.78) (1.78)0.02 0.01 0.01
(0.02) (0.02) (0.02)Married 8.84 4.53 4.95
(19.69) (20.13) (20.00)Hispanic -0.80 -1.13+ -2.25
(23.03) (25.34) (25.37)Black -7.85 -9.3 -9.20
(24.76) (25.47) (25.35)Asian -122.03* -127.15* -128.2*
(51.04) (51.39) (51.33)HS degree -16.33 -17.24
(23.92) (23.87)Bachelor's 39.72 38.94
(31.61) (31.55)Graduate deg -30.92 -31.02
(43.31) (43.21)Other deg -78.91+ -80.81+
(43.35) (43.29)Poverty category 2 -54.92 -54.17
(39.04) (38.82)Poverty category 3 -86.27** -85.16**
(32.56) (32.38)Poverty category 4 -85.45 -84.26**
(26.33) (26.15)Poverty category 5 -17.01 -14.92
(29.55) (29.36)Income 0.00 0.00
(0.00) (0.00)TV ads in round 0.00
(0.00)Print ads in round 0.00
(0.00)Radio ads in round
0.004Other ads in round 0.00
(0.00)N=466298
-.0003** -.0003** -.0003**
Age2
-.016***

24
Model 1 Model 2 Model 3 Model 4Current ads -0.0005** -0.0005** -0.0005**
-(0.000094) -(0.000096) -(0.000096)Male -0.124** -0.12** -0.12**
-(0.03) (0.03) (0.03)Age 0.0022 0.0033 0.0035
-0.0026 0.0029 0.00290.00 0.00 0.00
(0.00) (0.00) (0.00)Married 0.02 0.02 0.016458
-(0.03) (0.03) (0.033932)Hispanic 0.01 0.01+ 0.01
-(0.04) (0.04) (0.04)Black -0.01 -0.01 -0.01
-(0.04) (0.04) (0.04)Asian -0.223**
-(0.08) (0.08) (0.08)HS degree -0.02 -0.021980
(0.04) (0.040534)Bachelor's 0.08 0.08
(0.05) (0.05)Graduate deg -0.06 -0.06
(0.07) (0.07)Other deg
(0.07) (0.07)Poverty category 2 -0.1 -0.1
(0.07) (0.07)Poverty category 3
(0.05) (0.053550)Poverty category 4
(0.05) (0.05)Poverty category 5 -0.05 -0.05
(0.05) (0.05)Income 0.00 0.00
(0.00) (0.00)TV ads in round 0.000335
(0.000235)Print ads in round 0.00
(0.00)Radio ads in round
(0.01)Other ads in round 0.00
(0.00)N=466298
Table 8: Round Only Probit on Decision to Buy
Age2
-.231** -.234**
-.123+ -.127+
-.148** -.147**
-.166** -.165**
-.0247**
Significance levels: +:10% *:5% **:1% ***: .1%

25
Table 9: Round Only Hurdle RegressionModel 1 Model 2 Model 3 Model 4
Current ads -0.0002** 0.00005 0.00005 0.00005
Male 75.28** 82.76** 79.69** (28.96) (27.92) (27.29)
Age 1.52 4.92 4.23(3.63) (4.06) (4.26)-0.03 -0.06 -0.05(0.03) (0.04) (0.04)
Married -36.38 -60.68* -43.50(24.20) (25.39) 26.59
Hispanic -108.36** -97.95+ -93.66** (31.52) (32.27) (31.26)
Black -38.94 -9.50 7.2(34.50) (33.68) (32.29)
Asian 121 154.35* 152.53** (71.74) (62.16) (54.79)
HS degree -22.15 -21.81(27.46) 28.19
Bachelor's -34.11 -27.64(36.78) (36.80)
Graduate deg 94.44 103.76(57.41) (57.26)
Other deg -82.82+ -64.26(45.85) (47.98)
Poverty category 2 34.17 50.35(33.37) (35.18)
Poverty category 3 15.67 17.54(26.90) 26.75
Poverty category 4 134.51** 139.6** (48.52) (47.51)
Poverty category 5 136.92** 134.11**(33.45) (34.19)
Income0.0005 (0.0005)
TV ads in round -0.0001(0.0003)
Print ads in round 0.0009(0.0005)
Radio ads in round(0.0063)
Other ads in round -0.0016(0.0015)
N=646
-.0002** -.0002**
Age2
-.0017** -.0018**
-.013*
Significance levels: +:10% *:5% **:1%

Table 8 summarizes the results from estimating a probit model on the extensive margin
of consuming alternative medicine using the round only data. The signs and significance
levels from the estimated coefficients are similar to those of the previously estimated in the
Tobit model.
Table 9 presents a summary of results from an OLS regression on alternative medicine
expenditures, using the group that spent at least some money on alternative medicine during
the course of the survey. For this group, advertising expenditure has a negative and precisely
estimated effect, though only for radio advertising in the disaggregate model. Estimated
effects from the new prescriptions group were also negative, but only model three produced a
(marginally) significant estimate. The effect of being male switches from negative in the Tobit
and probit results to positive in the OLS estimates, leading to $75 to $83 higher expenditure.
The coefficient on being Asian also switches, leading to about $33 higher consumption, and
being Hispanic has an effect of much greater magnitude and precision, implying from $94 to
$108 lower expenditure.
For the socioeconomic status variables, having some “other degree” has an effect
similar to the Tobit model, though is not statistically significant in Model 4. Unlike in the
Tobit results, being in the top poverty categories (i.e. those households that make 400% of
poverty level income or more) implies an increase in expenditure from $135 to $140, and an
additional dollar of personal income decreases expenditure by about 0.17 cents. The person
with the highest personal income in this sample made $171,213, so while being in the highest
poverty category will have the effect of lowering expenditure by $135, the personal income
itself will have the effect lowering expenditure by about $280, leading to a net decrease in
expenditure. The combination of these effects and the estimates from the Tobit suggest a dip
in expenditure among middle income that is lessened at higher incomes.
26

Finally, Table 10 summarizes the results from estimating the zero-truncated Poisson
and negative binomial count models for the number of alternative prescriptions acquired
during a round. The Poisson model produces more precise estimates, notably for advertising
during a round. The estimated effect is smaller than when I use the round-aggregate data.
When attention is focused on new prescriptions, the three month lag of expenditure has a
negative effect while the current month has a positive effect. Since rounds are generally at
least three months long, the smaller coefficient may reflect the combination of monthly
effects. The disaggregate model shows that, for the Poisson results and among different types
of advertising, only radio advertising has a statistically significant, positive effect. Being black
has a positive effect on expenditure, leading to a third to two-fifths additional prescriptions
more per round. Being Hispanic has a somewhat smaller negative effect, implying a fifth to a
quarter of one prescription fewer on average. Income has a negative effect; using the
wealthiest person in the sample as an illustrative example, a respondent that earned $171,213
would take two-thirds of one prescription fewer on average than a respondent who earned
zero dollars. Being in various poverty categories, on the other hand, seems to have no effect on
the number of prescriptions.
27

V. Conclusions and Suggestions for Further Research
The effect of DTCA on CAM usage appears nuanced and not entirely straightforward.
Figures 1 and 2 illustrate that expenditures on DTCA for the five ailments associated with
placebo effects have been declining, while prescriptions for CAM reported in the MEPS have
been increasing. Since only a small fraction of people in the MEPS acquire prescriptions for
CAM, these broad trends may apply differently to different parts of the population.
28
Table 10: Round Only Hurdle Model With Poisson and Negative Binomial DistributionsModel 1 (P) Model 2 (P) Model 3 (P) Model 4 (P) Model 1 (NB) Model 2 (NB) Model 3 (NB) Model 4 (NB)
Round ads 0.0004** 0.0004* 0.0004* 0.0006+ 0.0004 0.0004-(0.0002) (0.0002) (0.0002) (0.0003) (0.0003) (0.0003)
Male 0.00 0.05 0.0431 0.03 0.09 0.09(0.07) (0.07) (0.0675) (0.11) (0.11) (0.11)
Age 0.008 .0159* 0.014+ 0.012 0.021+ 0.0190.007 (0.0076) (0.01) (0.0105) (0.0119) (0.0120)
0.000006 0.00 0.00 0.00 0.00 0.00(0.0001) (0.00) (0.00) (0.00) (0.00) (0.00)
Married 0.152* 0.149* 0.174* 0.17 0.18 0.2(0.07) (0.07) (0.07) (0.11) (0.12) (0.12)
Hispanic -0.163+ -0.230* -0.214* -0.17 -0.267+ -0.251+ (0.09) (0.09) (0.09) (0.13) (0.14) (0.14)
Black 0.307** 0.295** 0.310** 0.421** 0.394** 0.406** (0.08) (0.08) (0.08) (0.15) (0.15) (0.15)
Asian 0.11 0.15 0.15 0.14 0.22 0.20(0.19) (0.19) (0.19) (0.33) (0.33) (0.33)
HS degree -0.01 -0.01 -0.01 -0.01(0.08) (0.08) (0.13) (0.13)
Bachelor's 0.10 0.10 0.13 0.14(0.11) (0.11) (0.19) (0.19)
Graduate deg 0.02 0.04 0.12 0.15(0.15) (0.15) (0.25) (0.25)
Other deg -0.25 -0.21 -0.29 -0.24(0.18) (0.18) (0.28) (0.28)
Poverty category 2 -0.04 -0.02 -0.05 -0.04(0.13) (0.13) (0.21) (0.21)
Poverty category 3 -0.171 -0.164 -0.102 -0.093(0.1061) (0.1065) (0.1696) (0.1688)
Poverty category 4 -0.13 -0.13 -0.12 -0.11(0.09) (0.10) (0.15) (0.15)
Poverty category 5 -0.11 -0.12 -0.16 -0.16(0.11) (0.11) (0.18) (0.18)
Income -0.00000385* -0.00000378* -0.000004 -0.000004(0.000002) (0.000002) (0.000003) (0.000003)
TV ads in round 0.00 0.00(0.0006) (0.0009)
Print ads in round 0.00240** 0.00(0.0008) (0.0014)
Radio ads in round 0.00 0.00(0.0133) (0.0216)
Other ads in round 0.00 0.002350(0.0042) (0.0067)
N=646Significance levels: +:10% *:5% **:1%
Age2

Generally, advertising expenditure reduce expenditure on CAM using both monthly
and round-only data , even when conditioning on purchasing at least some CAM. However,
the number of total CAM prescriptions acquired is generally positively related to advertising
expenditure when I condition on purchasing some CAM. Older people have higher
expenditures, and income leads to higher expenditures at the top and bottom extremes. Racial
effects vary widely in sign, magnitude, and precision depending on the population examined.
Education appears to have little or no effect, controlling for income and other factors.
The analysis is limited by the scope of the data. In particular, respondents' use of CAM
is defined by the number of prescriptions acquired during the period covered by the MEPS.
Since CAM, by definition, does not require a prescription to acquire, much of the actual CAM
use is probably obscured. More comprehensive data on CAM usage would provide clearer,
more widely applicable, results. Also, the advertising data are aggregated to provide national
totals, without regard to location of residence within the US, so including location to control
for that dimension of unobserved heterogeneity is not possible.
References
Almasi, Elizabeth A., Randall S. Stafford, Richard L. Kravitz, Peter R. Mansfield. 2006.
What Are the Public Health Effects of Direct-to-Consumer Drug Advertising? PLoS Medicine.
3(3): e145.
Astin, John A. 1998. Why Patients Use Alternative Medicine: Results From a National
Survey. JAMA. 279: 1548-1553.
Auton, Frank. 2006. Direct to Consumer Advertising (DTCA) of Pharmaceuticals: an
Updated Review of the Literature and Debate Since 2003. Economic Affairs. 26(3): 24-32.
Barnes, PM, E Powell-Griner, K McFann, RL Nahin. 2004. Complementary and
alternative medicine use among adults: United States, 2002. Advance Data from Vital and
29

Health Statistics. 343: 1-19.
Barnes, P.M. and Barbara Bloom. 2008. Complementary and Alternative Medicine Use
Among Adults and Children: United States, 2007. National Health Statistics Reports. 12.
Cameron, A. C. and P. K. Trivedi. 1998. Regression Analysis of Count Data. New York:
Cambridge University Press.
Clarke, Darral G. 1976. Econometric measurement of the duration of advertising effect
on sales. Journal of Marketing Research. 13(4): 345-357.
Dave, Dhaval, and Hanry Saffer. 2010. The Impact of Direct-to-Consumer Advertising
on Pharmaceutical Prices and Demand. NBER Working Paper No. w15969.
Dietary Supplement Health and Education Act of 1994. Pub L No. 103-417, Stat 4325
(codified at USC §301 [1994]).
Division of Health Interview Statistics, CDC. 2008. NHIS Survey Description.
Donohue, Julie M., Marisa Cevasco, and Meridith B. Rosenthal. 2007. A Decade of
Direct-to-Consumer Advertising of Prescription Drugs. New England Journal of Medicine.
357: 673-681.
Druss, B. G. and R. A. Rosenheck. 1999. Association between use of unconventional
therapies and conventional medical services. JAMA. 282(7): 651-6.
Eisenberg, David M., R.C. Kessler, C. Foster, F.E. Norlock, D.R. Calkins, and T.L.
Delbanco. 1993. Unconventional medicine in the United States. Prevalence, costs, and
patterns of use. New England Journal of Medicine. 328(4):246-52.
Eisenberg, David M., R.B. Davis, S.L. Ettner, S. Appel, S. Wilkey, M. Van Rompay, and
R.C. Kessler. 1998. Trends in Alternative Medicine Use in the United States, 1990-1997.
JAMA. 280: 1569-1575.
Evans, Dylan. 2004. Suppression of the acute-phase response as a biological
30

mechanism for the placebo effect. Medical Hypotheses. 64(1): 1-7.
Fontanarosa, Phil B. and George Lundberg. 1998. Alternative Medicine Meets Science.
JAMA. 280: 1618-1619.
Franses, Philip Hans and Bjørn Vroomen. 2006. Estimating confidence bounds for
advertising effect duration intervals. Journal of Advertising. 35(2): 33-37.
Frosch, Dominick L., Patrick M. Krueger, Robert C. Hornik, Peter F. Cronholm, and
Frances K. Barg. 2007. Creating Demand for Prescription Drugs: A Content Analysis of
Television Direct-to-Consumer Advertising. Annals of Family Medicine. 5: 6-13.
Frosch, Dominick L., David Grande, Derjung M. Tarn, and Richard L. Kravitz. 2010. A
Decade of Controversy: Balancing Policy With Evidence in the Regulation of Prescription
Drug Advertising. American Journal of Public Health. 100(1): 24-32.
Hsiao, An-Fu. 2003. Complementary and Alternative Medicine Use and Substitution
for Conventional Therapy by HIV-Infected Patients. Journal of Acquired Immune Deficiency
Syndromes. 33(2): 157-65.
Hilbe, J. 1999. sg102: Zero-truncated Poisson and negative binomial regression. Stata
Technical Bulletin 47: 37–40.
Kalyanaram, G. K. 2009. The endogenous modeling of the effect of direct-to-consumer
advertising in prescription drugs. International Journal of Pharmaceutical and Healthcare
Marketing. 3(2): 137-148.
Leone, Robert P. 1995. Generalizing what is known about temporal aggregation and
advertising carryover. Marketing Science. 14(3): G141-G150.
Long, J. Scott and Jeremy Freese. 2006. Regression Models for Categorical Dependent
Variables Using Stata. 2d ed. College Station: Stata Press.
McDowell, Allen. 2003. From the help desk: hurdle models. The Stata Journal. 3(2):
31

178-184.
Mintzes, B, M. Barer, J. Lexchin, and K.L. Basset. 2005. Introduction of direct-to-
consumer advertising of prescription drugs in Canada: an opinion survey on regulatory policy.
Research in Social and Administrative Pharmacy. 1(2):310-30.
Moynihan, Ray, Iona Heath, and David Henry. 2002. Selling Sickness: The
Pharmaceutical Industry and Disease Mongering. British Medical Journal. 324(7342): 886-
890.
Rosenthal, Meridith B., Ernst R. Berndt, Julie M. Donohue, Arnold M. Epstein, and
Richard G. Frank. 2003. Demand Effects of Recent Changes in Prescription Drug Promotion.
Forum for Health Economics and Policy. 6: (Frontiers in Health Policy Research), Article 2.
Stagnitti, Marie. 2007. Trends in Outpatient Prescription Drug Utilization and
Expenditures, 1997 and 2004. Medical Expenditure Panel Survey Statistical Brief #168.
Wooldridge, Jeffrey. 2002. Econometric Analysis of Cross Section and Panel Data.
Cambridge: MIT Press.
32