container terminals capacity evaluation considering port …€¦ · · 2017-04-09container...
TRANSCRIPT

CONTAINER TERMINALS CAPACITY EVALUATION CONSIDERING PORT SERVICE LEVEL BASED ON SIMULATION
Ningning Li
Jingjing Yu Guolei Tang*
Da Li Yong Zhang
Dalian Neusoft University of Information Faculty of Infrastructure Engineering Dalian 116032, China Dalian University of Technology
Dalian 116024, China *E-mail: [email protected]
KEYWORDS
Container Terminal, Throughput Capacity, Port Service Level, Simulation and Modeling. ABSTRACT Throughput capacity is the production capacity of port enterprise under constant exotic environment, and plays a significant role in production control. According to the analysis on influencing factors of throughput capacity and characters of operation system, this paper proposes a simulation model of container terminal operation system based on port service level. By changing input parameters, different simulation schemes can be obtained with the objective to define the relationship between port service level and throughput capacity of container terminals. And some reasonable suggestions can be given to improve the throughput capacity of container terminals. 1. INTRODUCTION
With the development of economy and the expansion of foreign trade, container throughputs of coastal ports have increased rapidly in China. So new container berths should be planned but with limited shoreline resources. The throughput capacity is an important issue involving respective interests from governments and enterprises. To save coastal port resources, and provide scientific and reasonable port resources for shipping lines, the throughput capacity of container terminal should be evaluated reasonably to determine an optimal berth numbers. In China, a mandatory Design Code of General Layout for Sea Port (MTPRC 2014) provides a set of procedures to evaluate container terminal capacities. However, the existing methods evaluate the throughput capacity without considering port service level and interactions between subsystems. Therefore, a practical approach to evaluate the throughput capacities of Chinese container terminals based on MTPRC (2014).
Many researches have been carried out on
throughput capacity of container terminals. These
achievements are mainly divided into the following three categories. The first one studies the port capacity using queue theory (Wang et al. 2008; Lee et al. 2014). For example, Wang et al. (2008) used Stochastic Petri Net to establish both a hierarchical model of the container terminal capacity and a dynamic model of subsystems to determine the capacities of the subsystems and detect the bottleneck of port system. However, as the data and the queue configuration are more sophisticated, the researchers have to resort to simulation (Demirci 2003, Quy et al. 2008, Imai et al. 2001, 2005, Wanke 2011, Tang et al. 2016, Azab et al., 2016). So the second one focuses on throughput capacities of specific container terminals/berths using simulation (Wang et al. 2004; Wu et al. 2013). For example, Wu et al. (2013) built a simulation model for barge berths of Kwan Chung container terminals to examine the relationship between berthing capacity and service level in terms of vessel waiting time. And the last one covers the impact analysis of the factors on container terminal capacities (Xie 2008; Liu 2009; Ding 2010; Zhang 2013) For example, Ding (2010) established a simulation model to estimate the throughput capacities of a container terminal under different combination patterns of the types of arriving ships. These researches provide invaluable information and insights regarding methodologies how to describe the stochastics characteristics of ship arrivals and berth service, how to evaluate terminal’s service level, and how to simulate the ship-berth link planning operation.
Therefore, considering the stochastic and dynamic
characteristics of port system (Demirci 2003, Quy et al. 2008, Tang et al. 2016), in this paper, on the basis of Chinese mandatory Design Code (MTPRC 2014), we establish a simulation model of container terminal operations, to estimate the throughput capacity in terms of port service level for container terminals using Arena simulation software (Arena 2017). And the deduced relationships between port service level and throughput capacity of container terminals which are main contributions of this paper, will provide some reasonable suggestions to container terminal planning.
Proceedings 31st European Conference on Modelling and Simulation ©ECMS Zita Zoltay Paprika, Péter Horák, Kata Váradi, Péter Tamás Zwierczyk, Ágnes Vidovics-Dancs, János Péter Rádics (Editors) ISBN: 978-0-9932440-4-9/ ISBN: 978-0-9932440-5-6 (CD)

2. CONTAINER TERMINAL CAPACITY
According to Chinese mandatory Design Code ofGeneral Layout for Sea Ports (MTPRC 2014), when planning a container terminal, an important consideration is to provide a sufficient annual container-handling capability (terminal capacity). Obviously, the acceptable level of service provided by a terminal is not considered when evaluating terminal capacity. Therefore, in this paper, we define the container terminal capacity as the capacity of the container terminal, in terms of containers (Twenty-foot Equivalent Unit, TEU) that can be handled per year with an adequate service level.
The chosen indicator for port service level is the average waiting time / average service time ratio, expressed as S=AWT/AST, in which, AWT represents the average waiting time of ships in the port and AST represents the average service time required for loading and discharging a ship under normal circumstances.
3. SIMULATION MODELING FOR CONTAINERTERMINAL OPERATIONS
3.1 Basic Assumptions
(1) Container ships are served on first-come-first-served basis (FCFS).
(2) The loading operation at apron starts once thedischarging operation is finished.
(3) The quay cranes and yard cranes are equippedaccording to the berth tonnage, and based on the number of quay cranes, the internal trucks can be allocated with the principle of shortest path.
3.2 Simulation Model Implementation
In most container terminals in China, the orientation of the storage blocks is parallel to the shore. And rubber-tired gantry cranes (RTGs) are used for the yard operations, and internal and external trucks for the horizon transport between quay and storage yard, as well as between storage yard and landside interfaces (Ji et al. 2010). According to the logic model illustrated in Figure 1, we implement a simulation model to simulate the processes of Chinse container terminal, which covers five sub-models, which are ship berthing and deberthing sub-model, ship loading and discharging sub-model, horizontal transport sub-model, yard operation sub-model and gate operation sub-model.
Ship arrives
Does the weather allow
to enter the port?
Yes
Enter the channel
Wait in anchorage area
No
Is the berth idle?
Yes
No
Berthing operation
Is ready for loading and discharging operation?
Yes
Loading and discharging operation
Wait in berthNo
Deberthing operation
Enter the channel
Ship departs
External trucks arrival at yard
Internal trucks arrive at yard
Determine the storage yard number of containers
Select yard crane
Is the yard crane idle?Wait for service
No
Finish loading and discharging operations
Yes
Truck departs
External trucks arrival at/depart port
Select the import/export channel
Is the channel idle?
External trucks accept channel services
External trucks arrival at yard/depart port
Yes
Wait for services
No
(a) Container terminal Front Operation (b) Yard Operation (c) Gate OperationFigure 1: The Related Logical Model of Container Terminal Operation
We establish the model using Arena software, and the Figure 2 shows the simulation model of container terminal operations using Arena. The modeling processes are described as follows:
(1) Ship berthing and deberthing sub-modelsimulates the process that the inbound ship travels through the channel from the anchorage and arrives at the berth, and after the berth service time for discharging and loading containers, the outbound ship deberths, travels through the channel and leaves the port. In this sub-model, the entity is the ship with some
attributions, such as the dimension, tonnage and single ship loading and discharging capacity.
(2) Ship loading and discharging operation sub-model includes two processes: loading and -discharging. The loading process is that the internal trucks transport containers to the terminal apron, and then the assigned quay cranes load containers onto the ship. The discharging process is to unload containers onto trucks from the ship. In this sub-model, the entity is the container with assigned type and dimensions.

(3) Horizontal transport sub-model simulates the horizontal movement between the berth and yard or gate. In this sub-model, we set the container and yard truck as the entities, and its attributes of truck include the assigned yard block, and travel route.
(4) Yard operation sub-model simulates the loading
and discharging process when containers are transported
to the yard by trucks. In this sub-model, the entity is the container, and the resources are the bays for stacking containers and RTGs in the block of destination.
(5) The gate operation sub-model provides entrance
roads for external trucks. The entity in this sub-model is the trucks, and the resources are the access roads.
ShipGenerator
AssignShipInformation VBA Decide 5 DelayTime
Assign timeArriveVBAAnchroage
Dispose 7
DecideTonnage1
AssignTimeTNOW
VBA Seize storage_in
Release storage_in in_fairway Assign for
Load or Unload RouteToBerth
Separate 11
Assign timeUnloadingB
egin
Hold for Ship
Leaving
Assign timeLoading
OverDelay 62
timeLeavingBerthVBADecide For
Release Berth
Assign timeRelease
Berth
Seize storage_out
Release storage_out out_fairway VBA
Ship Dispose
Port
SeizeBerthVBA
SeizeBerthVBA
Create truck_pickup
Assign current day VBA Separate
33
Delay 58 Separate 36
Dispose 17
VBA
Delay 59
VBADelay for startup of
truck_pickup
Assign gateway into port for truck_pickup
Seize gateway into port of
truck_pickup
Delay in gateway into port of
truck_pickup
Release gateway into port of
truck_pickup
Assign information of truck_pickup
VBA
VBA
delay in route from gate of truck_pickup
type index of truck_pickup
ToGateVBA
Delay in gateway into
port of truck_pickup
Assign gateway into port for truck_pickup
VBARelease gateway
out port of truck_pickup
Create truck_Send
Assign current day2
VBA Separate 34
Delay 56 Separate 35
Dispose 16
VBA
Delay 57
VBADelay for startup of
truck_send
Assign gateway into port for truck_send
Seize gateway into port of truck_send
Delay in gateway into port of
truck_pickup
Release gateway into port of truck_send
Assign information of
truck_sendVBA
VBA
delay in route from gate of truck_send
type index of truck_send
FormGateVBA
Delay in gateway into
port of truck_send
Assign gateway into port for truck_send
VBARelease gateway
out port of truck_send
Gate operation sub-model
Ship berthing and deberthing sub-modelStationYardSet
Decide load or unload for
yard
Decide Container Type_1
Assign Num_container_
unload
VBADecide when to load_yard
Separate the laststationYard
Assign load or unload for berth
and yard
VBA
Create export_empty
Create export_reefer
Create export_heavy
VBA
VBA
VBA
VBA export_heavy
Anchroage
Create export_dangerous
Dispose the model_3
export_empty
export_reefer
export_danerous
YardDischarging
VBA
Decide Container Type_3
YardLoading
VBA
Decide According to
tag_
Decide Container Type_2
TransportToBerth
Release heavy
yardVBAVBADispose
truck_pickup
Yard operation sub-model
StationBerthSet
load or unload Delay 61 4 containers
VBA
DecideGlobalSerial_1
ShipDischarging
VBA
Batch for ship and truck
together go
Separate the batch
Accoring to tag
DecideGlobalSerial_2
TransportToYard
Relaese qcs VBA Dispose 8
Batch for Crane
DecideGlobalSerial_3
Shiploading VBA
Assign Num_container
_load Array
VBADecide when to singal
copy oneSignal for
ship to leave
Dispose 6
Dispose 18
Utilization status of quay cranes
Ship loading and discharging operation sub-model
Createtruck_pickup__
Assign current day VBA Separate
33
Delay 58 Separate 36
Dispose 17
VBA
Delay 59
VBADelay for startup of
truck_pickup__
Assign gatewayinto port for truck_pickup__
Seize gateway into port of
truck_pickup__
Delay in gateway into port of
truck_pickup__
Release gateway into port of
truck_pickup__
Assign information of truck_pickup__
VBA
VBA
delay in routefrom gate of truck_pickup__
typ oftype index of type index of trutrucktru _ kuppickupckup__
ToGateVBA
D l iDelay in Delay ingateway into
port of trucktrucktruck_pickuppickuppickup__
Assign gateway into port for truck_pickup__
VBARelease gateway
out port of truck_pickup__
Create truck_Send
Assign current day2
VBA Separate 34
Delay 56 Separate 35
Dispose 16
VBA
Delay 57
VBADelay for startup of
truck_send
Assign gateway into port for truck_send
Seize gateway into port of truck_send
Delay in gateway into port of
truck_pickup__
Release gateway into port of truck_send
Assign information of
truck_sendVBA
VBA
delay in routefrom gate of truck_send
type index oftype index of ty oftrtrucktru _ dsendnd
FormGateVBA
D l iDelay in Delay ingateway into
port of trucktrucktruck_sendsendsend
Assign gateway into port for truck_send
VBARelease gateway
out port of truck_send
Gate operation sub-model
ShipGenerator
AssignShipInformation VBA Decide 5 DelayTime
Assign timeArriveVBAAnchroage
Dispose 7
DecideTonnage1
AssignTimeTNOW
VBA Seize storage_in
Releasestorage_in in_fairway Assign for
Load or Unload RouteToBerth
Separate11
Assign timeUnloadingB
egin
Hold for Ship
Leaving
Assign timeLoading
OverDelay 62
timeLeavingBerthVBADecide For
Release Berth
Assign timeRelease
Berth
Seizestorage_out
Release storage_out out_fairway VBA
Ship Dispose
Port
SeizeBerthVBA
SeizeBerthVBA
Ship berthing and deberthing sub-modelStationYardSet
Decide loadDecide load Decide load or unload for
yard
Decide Container Type_1
Assign Num_container_
unload
VBADecide when to load_yard_
Separate the laststationYard
Assign load or unload for berth
and yard
VBA
Create export_empty
Create export_reefer
Create export_heavy_
VBA
VBA
VBA
VBA export_heavy_
Anchroage
Create export_dangerous
Dispose the model_3
export_empty
export_reefer
export_danerous
YardDischarging
VBA
Decide Container Type_3
YardLoading
VBA
Decide According to
tag_
Decide ContainerType_22
TransportToBerth
Releaseheavy
yardVBAddVBADispose
truck_pickup__
Yard operation sub-model
G
StationBerthSet
load or unload Delay 61 4 containers
VBA
DecideGlobDecideGlobD obalSeriala __11
ShipDischarging
VBA
Batch for ship B tand truck
together goggtogether g
Separate the batch
AAA toccoring to ccor totag
DecideGlobDecideGlobDe obaalSeriala ___222
TransportToYard
Relaeseqcs VBA Dispose 8
Batch for Crane
DecideGlobDecideGlobDecideGlobaalSeriala ___333
ShiploadingVBA
Assign Num_container
_load Array
VBADecideDecideDecidewhen to singalsingalsingal
copy oneSSi l fSignal for Si l f
ship to leaveleaveleave
Dispose 6
Dispose 18
Utilization statusof q yquay cranes
Ship loading and discharging operation sub-model
Simulation model of container terminals
Figure 2: The Simulation Model of Container Terminal
3.3 Model Verification and Validation
To verify and validate the implemented simulation model that it is correctly implemented with respect to
the process of throughput capacity, we take three effective measures: Firstly, the model is developed in stages and through sub-models in which each stage is

individually examined by a subject-matter expert. Secondly, tracing approach is used throughout the model development phase. Via tracing, we compare the simulation results with manual calculations to check if the logic implemented in the model is as intended. Finally we take Yantian International Container Terminal (YICT) as the example. The actual throughput of YICT is 8.62 million TEU in 2010. And model parameters can be obtained according to the actual operation situation of YICT in 2010. Then the throughput calculated by using this model is 8.74 million thousand TEU, with the discrepancy of 1.39%. So the implemented simulation model is reliable and can be used for further study.
4. RELATIONSHIP BETWEEN PORT SERVICE LEVEL AND THROUGHPUT CAPACITY OF CHINESE CONTAINER TERMINALS
4.1 Simulation Setup
Container terminal characteristics include the number of berths and their tonnages, and distribution of berth service time. In this study, the simulation experiments evaluate 8 classes of n-DWT berths i.e., n = {10000t, 20000t, 30000t, 50000t, 70000t, 100000t, 120000t, 150000t}, and 6 options for the number of each class of berths, nbth = {1, 2, 3, 4, 5, 6}, totaling 48 container terminal scenarios to be investigated.
The values or distributions of the simulation model
parameters, are determined according to Chinese mandatory Design Code of General Layout for Sea Ports (MTPRC 2014). For example, the ships arrive rates follow Poisson distribution with the daily number of ship arrivals varying within certain ranges. Other parameters’ values are listed in Table 1 and 2.
Table 1: Some Model Parameters
Model parameters Value
Time (h) Auxiliary operation and berthing time
3~5
Efficiency of yard
handling equipment (TEU/h)
Heavy container yard
40
Empty container yard
60
Dangerous container yard
40
Refrigerated container yard
40
Gate inspection
time (s)
Ingate empty trucks TRIA(20,25,30) Ingate loaded trucks TRIA(30,40,50)
Outgate empty trucks
TRIA(5,10,15)
Outgate loaded trucks
TRIA(30,40,50)
Table 2: Model Parameters of equipment
Tonnage DWT (t)
Design efficiency of
quay crane(TEU/h)
Number of quay crane per
berth
Number of
trucks per
quay crane
Number of
RTGs per
quay crane
10000 40 2 14 8
20000 40 2 14 8
30000 48 3 21 12
50000 48 4 28 16 70000 48 4 28 16
100000 60 5 35 20
120000 80 5 35 20
150000 80 5 35 20
4.2 Analysis and Discussion
Running the simulation model, the relationship between port service level (AWT/AST) and average berth capacity (Pt) of container terminals with the corresponding of change in the number of berths for different tonnages of berths can be obtained:
(1) As shown in Figure 3, given the same number of
berths, the terminal throughput capacity increases with the values of AWT/AST. And the relationship between terminal capacity and AWT/AST follows an exponential function with monotone increasing.
(2) As shown in Figure 4, given the same value of
AWT/AST, when the number of berths is larger than 3~5, the throughput capacity of marginal berths drops rapidly. Therefore, a terminal with 3~5 berths is relatively economic and reasonable design.
(3) Given the same number of berths, container
berth can be divided into 4 classes (10,000/20,000 DWT), 30,000 DWT, (50,000/70,000 DWT), and 100,000 DWT based on throughput capacity with a certain port service level. The recommended terminal throughput capacity in terms of AWT/AST are listed in Table 3, which are used to evaluate the terminal capacity and determine the number of new berths.
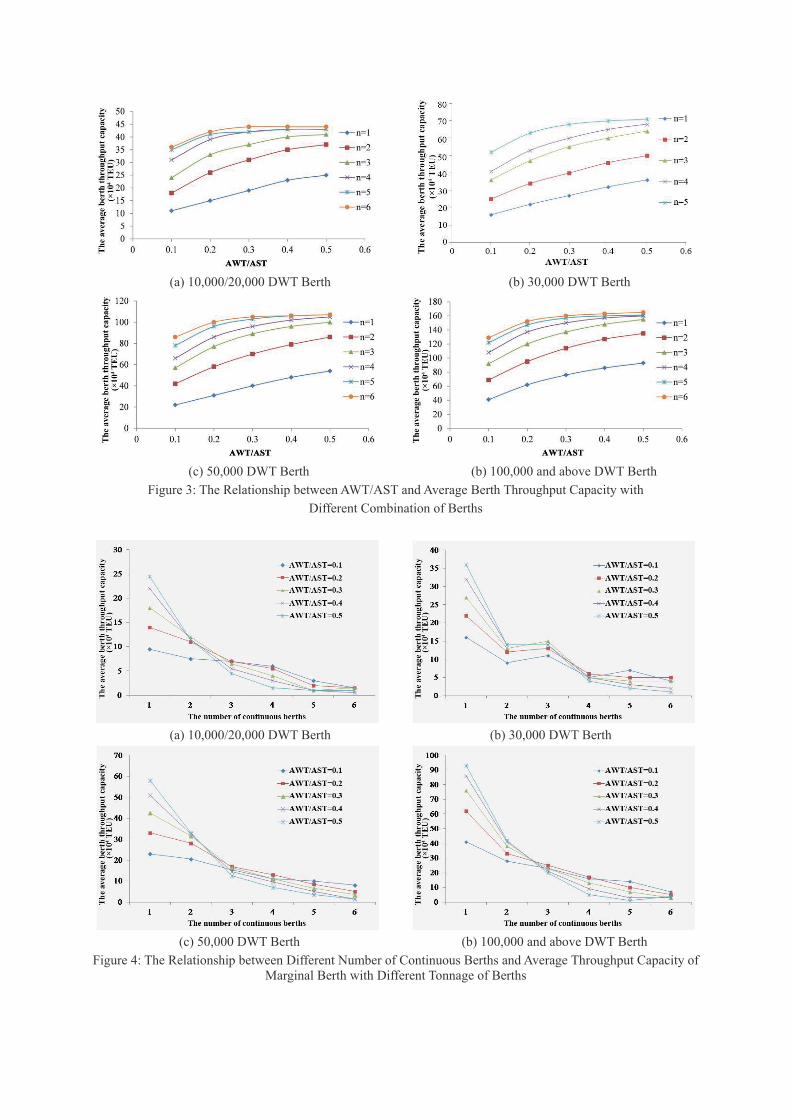
(a) 10,000/20,000 DWT Berth (b) 30,000 DWT Berth
(c) 50,000 DWT Berth (b) 100,000 and above DWT Berth
Figure 3: The Relationship between AWT/AST and Average Berth Throughput Capacity with Different Combination of Berths
(a) 10,000/20,000 DWT Berth (b) 30,000 DWT Berth
(c) 50,000 DWT Berth (b) 100,000 and above DWT Berth
Figure 4: The Relationship between Different Number of Continuous Berths and Average Throughput Capacity of Marginal Berth with Different Tonnage of Berths

Table 3: Berth Throughput Capacity for Different Number of Continuous Berths with Varying Berth Tonnage
The Number of Continuous Berths
Tonnage of Berths
AWT/AST 0.1 0.2 0.3 0.4 0.5
1
10,000/20,000 DWT 10 14 18 22 25 30,000 DWT 16 22 27 32 36
50,000/70,000 DWT 23 33 43 51 58 100,000 DWT 41 62 76 86 93
2
10,000/20,000 DWT 17 25 30 34 36 30,000 DWT 25 34 40 46 50
50,000/70,000 DWT 44 61 74 84 91 100,000 DWT 69 95 114 127 135
3
10,000/20,000 DWT 24 32 37 39 41 30,000 DWT 36 47 55 60 64
50,000/70,000 DWT 59 78 91 98 104 100,000 DWT 92 120 137 148 155
4
10,000/20,000 DWT 30 38 41 42 42 30,000 DWT 41 53 60 65 68
50,000/70,000 DWT 70 91 102 108 111 100,000 DWT 108 137 150 157 160
5
10,000/20,000 DWT 33 40 42 43 43 30,000 DWT 48 58 64 68 70
50,000/70,000 DWT 80 100 108 113 114 100,000 DWT 122 147 157 160 161
6
10,000/20,000 DWT 35 41 43 44 44 30,000 DWT 52 63 68 70 71
50,000/70,000 DWT 88 105 112 114 116 100,000 DWT 129 152 160 163 165
5. CONCLUSIONS
In this paper, we have established a simulation model of the container terminal operation system to obtain the relationship between the port service level and the throughput capacity of container terminals. According to the results of this simulation model, we can draw some conclusions.
(1) The average berth throughput capacity of
container terminals increases exponentially with the value of the port service level (AWT/AST) increasing given the same number of berths.
(2) The continuous berth number n has great
influence on the average berth capacity of container terminals. And the continuous arrangement of 3~5 berths is relatively economical and reasonable.
(3) The recommended terminal throughput capacity
in terms of AWT/AST are deduced, which are used to evaluate the terminal capacity and determine the number of new berths.
The simulation model provides technical support for
the further systematical research on the throughput capacity of container terminals, and it can also be used
as a guide for the planning and operation of container terminals.
ACKNOWLEDGEMENTS
This paper is a partial result of the project supported by the National Natural Science Foundation, China (No. 51579035) and Support High-Level Talents Innovation and Entrepreneurship Projects, Dalian, China (No. 2016RQ024).
REFERENCES Arena: Arena http:// www.arenasimulation.com /. (Accessed
from January 2017) Azab A.E, Amr B, Eltawil. 2016. “A Simulation Based Study
of the Effect of Truck Arrival Patterns on Truck Turn Time in Container Terminals”. In Proceedings of the 30th European Conference on Modelling and Simulation, 80-86.
Demirci, E. 2003 Simulation modeling and analysis of a port investment, Simulation, 79, 94-105.
Ding YZ 2010. “Throughput Capacity of a Container Terminal Considering the Combination Patterns of the Types of Arriving Vessels”. Journal of Shanghai Jiaotong University (English Edition), Vol 15, No.1, 124-128.
Imai, a., Nishimura, E. and Papadimitrou, S. (2001) The dynamic berth allocation problem for a container port. Transportation Research Part B, 35: 401-417.
Imai, a., Sun, X., Nishimura, E., Papadimitrou, S. (2005) Berth allocation in a container port: using a continuous location space approach. Transportation Research part B, 39: 199-221.
Lee B.K. et al. 2014. “Analysis on Container Port Capacity: A Markovian Modeling Approach.” OR Spectrum, Vol 36, No.2, 425–54.
Liu F. 2009. “Study on the Berth Capacity and Related Indexes of Container Terminal”. Dalian Maritime University, Dalian, China.
Ministry of Transport of the People’s Republic of China (MTPRC). (2014) Design code of general layout of sea ports, JTS 165-2013. Beijing: China Communication Press.
Quy, N.M., Vrijling, J.K., and Van Gelder, P.H.A.J.M. (2008). "Risk-and simulation-based optimization of channel depths, entrance channel of Cam Pha Coal Port." Simulation, 84, 41-55.
Tang, G., Guo, Z., Yu, X, Song, X, Du P. (2014) “SPAC to improve port performance for seaports with very long one-way entrance channels.” Journal of Waterway, Port, Coastal, and Ocean Engineering, 140(040140114).
Wang WY. et al. 2008 “System Simulation of Capacity for Container Terminal Based on Stochastic Petri Net”. In Proceedings of 2008 International Conference on Automation and Logistics, 2889-2892.
Wang ZM. 2004. “On the Reasonable Throughput Capacity of Container Terminals”. Port and Waterway Engineering, No.3, 16-20.
Wanke, P. (2011). Ship-berth link and demurrage costs: evaluating different allocation policies and queue priorities via simulation. Pesquisa Operacional, 31(1), 113-134.
Wu, YZ. Peng, C. 2013. “An Analysis of Capacity and Service level of the Container Terminals of Hong Kong”. In Proceedings of the 10th International Conference on Service Systems and Service Management, 404-409
Xie CX. 2008. “Study on Some Problems about the Calculation of the Berth Capacity of Container Terminal”. Dalian Maritime University, Dalian, China.
Zhang LN. 2013. “The Influence of Container Arrival Distribution on the Throughout Capacity”. Dalian Maritime University, Dalian, China.
AUTHOR BIOGRAPHIES
NINGNING LI studied in Shandong University from 2001 to 2005, and got the Bachelor’s Degree. Then she went to Dalian University of Technology and obtained the Master’s Degree in 2008. And
now, she as an associate professor is working in Dalian Neusoft University of Information, focusing on data mining and mobile application.
JINGJING YU was born in Chaoyang City, Liaoning Province, China, and went to Dalian University of Technology, where she majored in port and waterway engineering and obtained the Bachelor’s
Degree in 2015. Now, she is studying for a Doctor’s Degree in the field of simulation for port and waterway engineering analysis. Her e-mail address is: [email protected], and her Webpage can be found at http://port .dlut.edu.cn.
DA LI was born in Weifang City, Shandong Province, China, and went to Harbin Engineering University to study port and waterway engineering. In 2016, he obtained the Bachelor’s Degree. Now, he is studying for a Master’s Degree in the field
of simulation for port and waterway engineering analysis in Dalian University of Technology. His e-mail address is: [email protected], and his Webpage can be found at http://port.dlut.edu.cn.
YONG ZHANG was born in Zaozhuang City, Shandong province, China, and went to Dalian University of Technology. Where he majored in port and waterway engineering and obtained the Bachelor’s Degree in 2016. Now he is studying for a
master‘s Degree in the field of simulation for port and waterway engineering analysis. His e-mail address is [email protected] and his Webpage can be found at http://port.dlut.edu.cn
GUOLEI TANG went to Dalian University of Technology, where he obtained the Doctor’s Degree in Hydrology and Water Resources in 2009. He worked for a couple of years for the simulation modeling in engineering, and
now, he is leading a large research group in the field of simulation for port and waterway engineering. His e-mail address is: [email protected], and his Webpage can be found at http://port.dlut.edu.cn.