contents...sulphur. these allotropes of sulphur consist of the same chemical species but differ in...
TRANSCRIPT
THE STATEMENT
The phase Rule is an important generalization dealing withthe behaviour of heterogeneous systems. In general it may besaid that with the application of phase rule it is possible to predictqualitatively by means of a diagram the effect of changingpressure, temperature and concentration on a heterogeneoussystem in equilibrium. This relationship governing allheterogeneous equilibria was first discovered as early as 1874 byan American physicist Willard Gibbs. Gibb’s Phase Rule is freefrom flaws and limitations which are a common feature of all othergeneralizations of Physical Chemistry based on hypotheticalassumptions as to the nature of the constitution of matter. It maybe stated mathematically as follows :
F = C – P + 2
where F is the number of degrees of freedom, C is the number ofcomponents and P is the number of phases of the system. Theterms ‘phase’, ‘component’, and ‘degree of freedom’ involved inthe statement of the Phase Rule have a special significance and aclear understanding of these terms is essential before we proceedfurther with the subject.
697
1919191919 The Phase RuleC H A P T E R
C O N T E N T S
PHASE RULE
WHAT IS MEANT BY A ‘PHASE’ ?
WHAT IS MEANT BY‘COMPONENTS’?
DEGREES OF FREEDOM
DERIVATION OF THE PHASERULE
ONE–COMPONENT SYSTEM
PHASE DIAGRAMS
POLYMORPHISM
EXPERIMENTAL DETERMINATIONOF TRANSITION POINT
THE WATER SYSTEM
THE SULPHUR SYSTEM
TWO–COMPONENT SYSTEMS
THE SILVER–LEAD SYSTEM
THE ZINC–CADMIUM SYSTEM
THE POTASSIUM IODIDE–WATERSYSTEM
THE MAGNESIUM–ZINC SYSTEM
THE FERRIC CHLORIDE–WATERSYSTEM
THE SODIUM SULPHATE–WATERSYSTEM
698 1919191919 PHYSICAL CHEMISTRY
WHAT IS MEANT BY A ‘PHASE’ ?
A phase may be defined as : any homogeneous part of a system having all physical and chemicalproperties the same throughout. A system may consist of one phase or more than one phases.
(1) A system containing only liquid water is one-phase or 1-phase system (P = 1)(2) A system containing liquid water and water vapour (a gas) is a two-phase or 2-phase system
(P = 2).(3) A system containing liquid water, water vapour and solid ice is a three-phase or 3-phase
system.A system consisting of one phase only is called a homogeneous system.A system consisting of two or more phases is called a heterogeneous system.
Explanation of the Term ‘Phase’Ordinarily three states of matter-gas, liquid, and solid are known as phases. However in phase
rule, a uniform part of a system in equilibrium is termed a ‘phase’. Thus a liquid or a solid mixturecould have two or more phases.
Let us consider a few examples to understand the meaning of the term phase as encountered inphase rule.
(1) Pure substances. A pure substance (solid, liquid, or gas) made of one chemical speciesonly, is considered as one phase. Thus oxygen (O2), benzene (C6H6), and ice (H2O) are all 1-phasesystems. It must be remembered that a phase may or may not be continuous. Thus, whether ice ispresent in one block or many pieces, it is considered one phase.
(2) Mixtures of gases. All gases mix freely to form homogeneous mixtures. Therefore anymixture of gases, say O2 and N2, is a 1-phase system.
(3) Miscible liquids. Two completely miscible liquids yield a uniform solution. Thus a solutionof ethanol and water is a 1-phase system.
(4) Non-miscible liquids. A mixture of two non-miscible liquids on standing forms two separatelayers. Hence a mixture of chloroform (CHCl3) and water constitutes a 2-phase system.
(5) Aqueous solutions. An aqueous solution of a solid substance such as sodium chloride (orsugar) is uniform throughout. Therefore it is a 1-phase system.
However, a saturated solution of sodium chloride in contact with excess solid sodium chloride isa 2-phase system.
(6) Mixtures of solids. (i) By definition, a phase must have throughout the same physical andchemical properties. Ordinary sulphur as it occurs in nature is a mixture of monoclinic and rhombicsulphur. These allotropes of sulphur consist of the same chemical species but differ in physicalproperties. Thus mixture of two allotropes is a 2-phase system.
(ii) A mixture of two or more chemical substances contains as many phases. Each of thesesubstances having different physical and chemical properties makes a separate phase. Thus a mixtureof calcium carbonate (CaCO3) and calcium oxide (CaO) constitutes two phases.
Let us consider the equilibrium system : the Decomposition of Calcium carbonate. When calciumcarbonate is heated in a closed vessel, we have
CaCO3 CaO + CO2(solid) (solid) (gas)
There are two solid phases and one gas phase. Hence it is a 3-phase system.
699THE PHASE RULE
WHAT IS MEANT BY ‘COMPONENTS’?A system ‘C’ in the Phase Rule equation stands for the number of components of a system in
equilibrium. The term component may be defined as : the least number of independent chemicalconstituents in terms of which the composition of every phase can be expressed by means of achemical equation.
Explanation of the Term ‘Component’To understand the above definition and to use it for finding the number of components of a
system, remember that :(a) The chemical formula representing the composition of a phase is written on LHS.(b) The rest of the chemical constituents existing independently in the system as
represented by chemical formulas are placed on RHS.(c) The quantities of constituents on RHS can be made minus (–) or zero (0) to get at the
composition of the phase on LHS.Now let us proceed to discuss the number of components of some systems.(1) Water and sulphur systems are 1-component systems. Water system has three phases :
ice, water, and water vapour. The composition of all the three phases is expressed in terms of onechemical individual H2O. Thus water system has one component only.
Sulphur system has four phases : rhombic sulphur, monoclinic sulphur, liquid sulphur andsulphur vapour. The composition of all these phases can be expressed by one chemical individualsulphur (S). Hence it is a 1-component system.
As is clear from above, when all the phases of a system can be expressed in terms of onechemical individual, it is designated as a one-component or 1-component system.
(2) Mixture of gases. A mixture of gases, say O2 and N2, constitutes one phase only. Itscomposition can be expressed by two chemical substances O2 and N2.
Phase ComponentsGaseous Mixture = x O2 + y N2
Hence a mixture of O2 and N2 has two components. In general the number of components of agaseous mixture is given by the number of individual gases present.
(3) Sodium chloride solution. A solution of sodium chloride in water is a 1-phase system. Itscomposition (xNaCl.yH2O) can be expressed in terms of two chemical individuals, sodium chlorideand water.
Phase ComponentsAq. solution of = NaCl + y H2O
sodium chlorideTherefore an aqueous solution of sodium chloride or any other solute is a two-component or
2-component system.A saturated solution of sodium chloride, in contact with excess solid sodium chloride has two
phase, namely aqueous solution and solid sodium chloride. The composition of both phase can beexpressed in terms of two chemical individuals NaCl and H2O.
Phase Components Aq. solution of = x NaCl + y H2Osodium chloride
Solid sodium chloride = NaCl + 0 H2OHence a saturated solution of sodium chloride or any other solute in contact with solid solute,
is 2-component system.
700 1919191919 PHYSICAL CHEMISTRY
(4) Decomposition of Calcium carbonate. When calcium carbonate is heated in a closed vessel,the following equilibrium system results.
CaCO3 CaO + CO2(solid) (solid) (gas)
It has three phase : calcium carbonate, calcium oxide, and carbon dioxide. The composition of allthe phase can be expressed in terms of any two of the three chemical substances in equilibrium.
Let us select calcium oxide (CaO) and carbon dioxide (CO2) as the components. Then we canwrite,
Phase ComponentsCaCO3 = CaO + CO2
CaO = CaCO3 – CO2CO2 = CaCO3 – CaO
Again, selecting calcium carbonate (CaCO3) and calcium oxide (CaO) as the components, wehave
Phase ComponentsCaCO3 = CaCO3 + 0 CaO
CaO = 0 CaCO3 + CaOCO2 = CaCO3 – CaO
Thus decomposition of calcium carbonate is a 2-components system.Furthermore, as is clear from the above examples, by the components of a system is meant the
number of chemical individuals and not any particular chemical substances by name.(5) Dissociation of Ammonium chloride. Ammonium chloride when heated in a closed vessel
exists in equilibrium with the products of dissociation, ammonia (NH3) and hydrogen chloride gas(HCl).
NH4Cl NH3 + HCl(solid) (gas) (gas)
The system consists of two phase, namely, solid NH4Cl and the gaseous mixture containing NH3and HCl. The constituents of the mixture are present in the same proportion in which they arecombined in solid NH4Cl. The composition of both the phase can, therefore, be expressed in terms ofthe same chemical individual NH4Cl.
Phase ComponentsSolid = NH4Cl
Gaseous = x NH3 + x HCl or x NH4ClThus dissociation of ammonium chloride is a one-component system.
DEGREES OF FREEDOMThe term Degree of Freedom represented by F in the phase Rule equation (F = C – P + 2) is
defined as follows : the least number of variable factors (concentration, pressure and temperature)which must be specified so that the remaining variables are fixed automatically and the system iscompletely defined
A system with F = 0 is known as nonvariant or having no degree of freedom.A system with F = 1 is known as univariant or having one degree of freedom.A system with F = 2 is known as bivariant or having two degrees of freedom.
Explanation of the Term Degree of FreedomA system is defined completely when it retains the same state of equilibrium (or can be reproduced
exactly) with the specified variables. Let us consider some examples.
701THE PHASE RULE
(1) For a pure gas, F = 2. For a given sample of any pure gas PV = RT. If the values of pressure(P) and temperature (T) be specified, volume (V) can have only one definite value, or that the volume(the third variable) is fixed automatically. Any other sample of the gas under the same pressure andtemperature as specified above, will be identical with the first one. Hence a system containing a puregas has two degrees of freedom (F = 2).
(2) For a mixture of gases, F = 3. A system containing a mixture of two or more gases iscompletely defined when its composition, temperature and pressure are specified. If pressure andtemperature only are specified, the third variable i.e., composition could be varied. Since it is necessaryto specify three variables to define the system completely, a mixture of gases has three degrees offreedom (F = 3).
(3) For water water vapour, F = 1. The system water in equilibrium with water vapour, hastwo variables temperature and pressure. At a definite temperature the vapour pressure of water canhave only one fixed value. Thus if one variable (temperature or pressure) is specified, the other isfixed automatically. Hence the system water has one degree of freedom (F = 1).
(4) For saturated NaCl solution, F = 1. The saturated solution of sodium chloride in equilibriumwith solid sodium chloride and water vapour.
NaCl NaCl-solution water vapour(solid)
Thus the system is completely defined if we specify temperature only. The other two variablesi.e,. the composition of NaCl-solution (solubility) and vapour pressure have a definite value at afixed temperature. Hence the system has one degree of freedom.
(5) For ice-water-vapour system, F = 0. In the system ice water vapour, the three phasescoexist at the freezing point of water. Since the freezing temperature of water has a fixed value, thevapour pressure of water has also a definite value. The system has two variables (temperature andpressure) and both these are already fixed. Thus the system is completely defined automatically,there being no need to specify any variable. Hence it has no degree of freedom (F = 0).
DERIVATION OF THE PHASE RULEConsider a heterogeneous system in equilibrium of C components in which P phases are present.
We have to determine the degrees of freedom of this system i.e., the number of variables which mustbe arbitrarily fixed in order to define the system completely. Since the state of the system will dependupon the temperature and the pressure, these two variables are always there. The concentrationvariables, however, depend upon the number of phases. In order to define the composition of eachphase it is necessary to specify the concentration of (C – 1) constituents of each phase, theconcentration of the remaining component being determined by difference. For P phases, therefore,the total number of concentration variables will be P (C – 1) and these along with the two variablesmentioned above viz., temperature and pressure, make the total number of the variables of the systemequal to [P (C – 1) + 2].
On thermodynamic consideration when a system is in equilibrium, the partial molal free energyof each constituent of a phase is equal to the partial molal free energy of the same constituent inevery other phase. Since the partial molal free energy of the constituents of a phase is a function ofthe temperature, pressure and (C – 1) concentration variables, it follows that if there is one componentin two phases, it is possible to write one equation amongst the variables and if there is one componentin three phases, this fact may be written with the help of two equations. In general, therefore, whenP phases are present, (P – 1) equations are available for each component and for C components, thetotal number of equations or variables are C (P – 1).
Since the number of equations is equal to the number of variables, the number of unknown
702 1919191919 PHYSICAL CHEMISTRY
variables or degrees of freedom (F) will be :F = No. of variables – Number of equations
= [P (C – 1) + 2] – [C (P – 1)]= PC – P + 2 – PC + C= C – P + 2
F = C – P + 2
ONE–COMPONENT SYSTEMFor a one-component system we can write the phase rule equation as :
F = C – P + 2 = 1 – P + 2 = 3 – PThree cases may arise :Case 1. When only one phase is present,∴ F = 3 – 1 = 2Thus the system is bivariant. It can be completely defined by specifying the two variables,
temperature and pressure. Or that, both the temperature and pressure can be varied independently.Therefore a single phase is represented by an area on P, T-graph.
Case 2. When two phases are in equilibrium,F = 3 – 2 = 1
The system then has one degree of freedom and is termed monovariant. This means that thepressure cannot be changed independently if we change the temperature. The pressure is fixedautomatically for a given temperature. A two-phase system is depicted by a line on a P, T-graph.
Case 3. When three phases are in equilibrium,F = 3 – P = 3 – 3 = 0
∴ F = 0The system has zero degree of freedom and is termed nonvariant or invariant. This special
condition can be attained at a definite temperature and pressure. The system is, therefore, definedcompletely and no further statement of external conditions is necessary. A three-phase system isdepicted by a point on the P, T-graph. At this point the three phases (solid, liquid, vapour) are inequilibrium and, therefore, it is referred to as the Triple point.
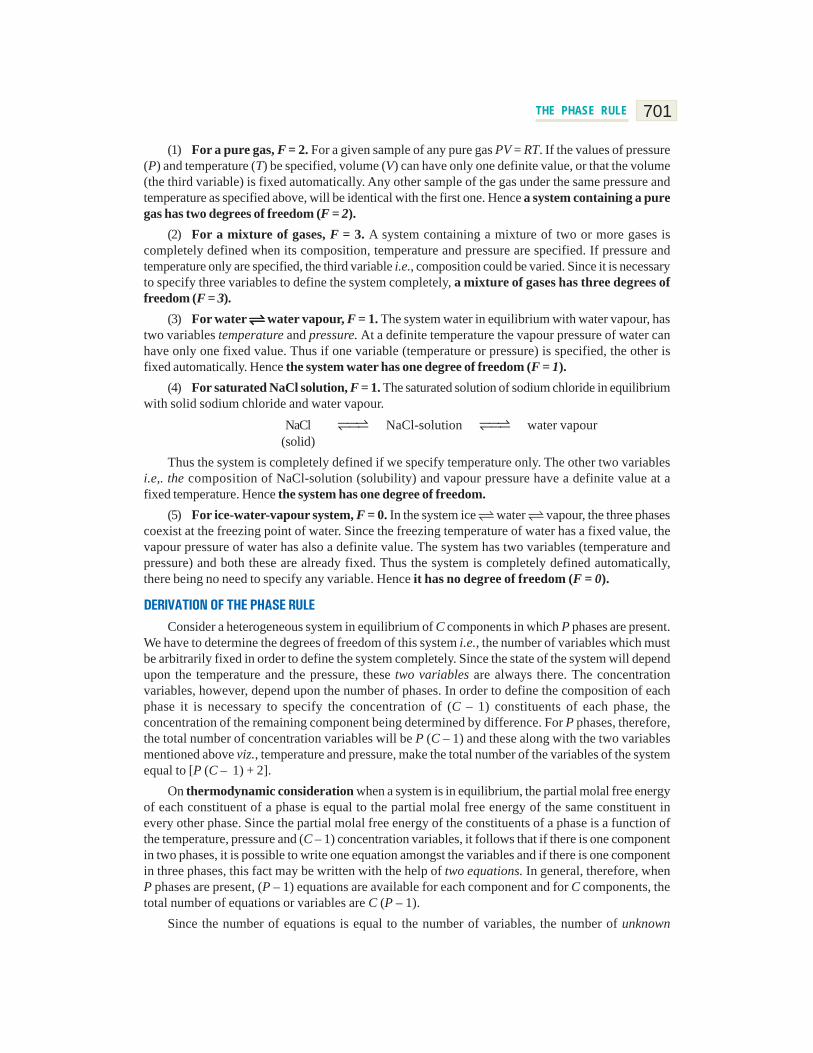
PHASE DIAGRAMSA phase diagram is a plot showing the conditions of pressure and temperature under which two
or more physical states can exist together in a state of dynamic equilibrium. Fig. 19.1 is a typicalphase diagram for a one-component system. The diagram consists of : (a) the Regions or Areas;(b) the Lines or Curves; and (c) the Triple point.
The significance of the characteristic features (Areas, Curves, Triple point) of a phase diagramare discussed below.
(1) Regions or AreasThe diagram is divided into three regions or areas which are labelled as ‘solid’, ‘liquid’, and
‘vapour’. These areas in Fig. 19.1 are COB, COA and AOB. Each of the three areas shows theconditions of temperature and pressure under which the respective phase can exist. Applying thephase rule to the system when only one phase is present, we have
F = 1 – 1 + 2 = 2i.e., each single phase has two degrees of freedom.
703THE PHASE RULE
C
O
Liquid
Solid
Vapour
Triple point
B
Vapo
risat
ion
curv
e
A
Metastable
Sublimation
curve
A
Temperature
Pres
sure
A typical phase diagram of a one component system.Figure 19.1
Fusio
n cu
rve
Thus each area of phase diagram represents a bivariant system. At conditions wholly withinone of the three areas, both the variables (pressure and temperature) can be varied independentlywithout causing a change in the state of equilibrium. Therefore in order to define the condition of thephase both pressure and temperature must be stated.
(2) Lines or CurvesThere are three lines or curves separating the regions or areas. These curves show the conditions
of equilibrium between any two of the three phases i.e., solid/liquid, liquid/vapour, solid/vapour.(a) Solid/liquid line (OC) which represents the equilibrium Solid Liquid, is referred to as the
Melting curve or Fusion curve.(b) Liquid/vapour line (OA) which represents the equilibrium Liquid Vapour, is referred to as
the Vapour Pressure curve or Vaporisation curve for the liquid.(c) Solid/vapour line (OB), which represents the equilibrium Solid Vapour, is referred to as
the Sublimation curve.Applying phase rule to a one-component two-phase system.
F = C – P + 2 = 1 – 2 + 2 = 1Thus phase rule predicts that the two phase equilibria stated above will have one degree of
freedom. Along any of three lines on the phase diagram when one variable (pressure or temperature)is specified, the other is fixed automatically.
(3) Triple PointThe three boundary lines enclosing the three areas on the phase diagram intersect at a common
point called the Triple point. A triple point shows the conditions under which all the three phases(solid, liquid, vapour) can coexist in equilibrium. Thus the system at the triple point may be representedas :
Solid Liquid VapourApplying the phase rule equation, we have
F = C – P + 2 = 1 – 3 + 2 = 0
704 1919191919 PHYSICAL CHEMISTRY
which predicts that the system has no degree of freedom.At the triple point both pressure and temperature on the diagram are fixed and, therefore, the
system is nonvariant. This implies that if we try to change temperature or pressure, the equilibriumwill be disturbed. For example, if we lower the pressure on the system, all the liquid will vaporise,leaving only two phases.
In case of water system, the temperature and pressure for the triple point are 0.0076º and 4.58 mmHg respectively.
Metastable EquilibriumThe vapour pressure curve AO of the liquid phase terminates at O, when the liquid freezes (or
solidifies). However by careful cooling of the liquid under conditions that crystals do not form, thecurve AO can be extended to A'. This means that the liquid can be cooled far below the freezing pointor ‘supercooled’ without separation of the crystals. The supercooled liquid is in an unstable condition.On the slightest disturbance as introduction of a seed crystal, the entire liquid solidifies rapidly.Thus the dashed curve OA' represents a metastable equilibrium,
Supercooled Liquid VapourThis system at once reverts to the true stable system
Solid Vapourunder suitable conditions. It is noteworthy that the dashed curve of the metastable liquid lies abovethe normal sublimation curve (BO). This implies that the vapour pressure of the metastable phase isalways higher than that of the stable phase at the same temperature.
POLYMORPHISMThe occurrence of the same substance in more than one crystalline forms is known as
Polymorphism. This phenomenon is shown by both elements and compounds. In the case ofelements the term allotropy is often used. The individual crystalline forms of an element arereferred to as polymorphs or allotropes. Rhombic and monoclinic sulphur are two polymorphs orallotropes of sulphur. The polymorphic or allotropic forms of an element have distinct physicalproperties and constitute separate phases.
Allotropy can be divided into three types : Enantiotropy, Monotropy and Dynamic allotropy.(1) Enantiotropy
In some cases one polymorphic form (or allotrope) can change into another at a definitetemperature when the two forms have a common vapour pressure. This temperature is known as thetransition temperature. One form is stable above this temperature and the other form below it. Whenthe change of one form to the other at the transition temperature is reversible, the phenomenon iscalled enantiotropy and the polymorphic forms enantiotropes. For example, rhombic sulphur(α-Sulphur) on heating changes to monoclinic sulphur (β-Sulphur) at 95.6º C (transition temperature).Also, monoclinic sulphur, on cooling, again changes to rhombic sulphur at 95.6ºC. That is,
95.6°Cα-Sulphur β-Sulphur
Thus α-Sulphur and β-Sulphur are enantiotropic.
(2) MonotropyIt occurs when one form is stable and the other metastable. The metastable changes to the stable
form at all temperatures and the change is not reversible. Thus there is no transition temperature asthe vapour pressures are never equal. This type of polymorphism is exhibited by phosphorus,
White phosphorus ⎯⎯→ Red phosphorus

705THE PHASE RULE
Another example is graphite and diamond, graphite being stable and diamond metastable,although the change is infinitely slow.
(3) Dynamic allotropySome substances have several forms which can coexist in equilibrium over a range of temperature.
The amount of each is determined by the temperature. The separate forms usually have differentmolecular formulae but the same empirical formula. This form of allotropy, known asdynamic allotropy, resembles enantiotropy in that it is reversible but there is no fixed transitionpoint.
An example of dynamic allotropy is provided by liquid sulphur which consists of threeallotropes Sμ, Sπ and Sλ.
Sμ Sπ SλThese three forms of sulphur differ in molecular structure. Sλ is S8, Sπ is S4 while formula of Sμ is
not known. The composition of the equilibrium mixture at 120ºC and 444.6ºC (b.p. of sulphur) is :120ºC Sμ 0% Sπ 3.7% Sλ 96.3%444.6ºC Sμ 37% Sπ 4% Sλ 59%
EXPERIMENTAL DETERMINATION OF TRANSITION POINTThe temperature at which a polymorphic substance changes from one form to another, is
known as the transition temperature or transition point. For example, rhombic variety of sulphur isconverted to the monoclinic form of sulphur at 95.6º C at atmospheric pressure. The transitiontemperature in a particular case can be determined by measuring a change in physical propertiessuch as colour, density, solubility, etc.
(1) Colour changeIf a little mercury (II) iodide is placed in a melting point tube attached to a thermometer and
heated in some form of apparatus (e.g., electrical heater), it is possible to record temperature at whichthe red mercury (II) iodide changes to the yellow form.
(2) Density changeAs rhombic sulphur changes to monoclinic sulphur, there is a decrease in density and, therefore,
an increase in volume. The change in volume is employed to measure the transition temperature byusing an apparatus known as Dilatometer shown in Fig. 19.2.
Liquid paraffin
Solid sulphur
Water bath
ScaleCapillary
tube
Heat(a)
Coo
ling
T1 T2
Temperature(b)
Scal
e re
adin
g
Hea
ting
( ) A dilatometer; ( ) Change in volume plotted against temperature recorded with a dilatometer.a b
Figure 19.2

706 1919191919 PHYSICAL CHEMISTRY
Some powdered rhombic sulphur is placed in the glass bulb and liquid paraffin (an inert liquid)is introduced above the sulphur. The apparatus is then immersed in a heating water-bath, thetemperature of which is raised. The scale reading and the temperature is recorded every minute. Aplot of liquid level in the capillary against temperature gives a curve as in Fig. 19.2 (b). On cooling ofthe dilatometer, reverse changes take place but due to thermal lag the curve assumes the form shownin the figure. The transition temperature is taken as the mean of the respective temperatures whereexpansion starts (T1) and contraction begins (T2).
(3) Solubility changeTwo forms of the same substance have different solubilities but at the transition point they have
identical solubility. Thus if solubility-temperature graph is plotted for the two forms, it is found toconsist of two parts with a sharp break. While one part represents the solubility curve for one form,the second part represents that for the other. At the meeting point of the two curves, the solubility ofthe two forms is the same and it indicates the transition temperature. For example, in the diagram forthe system sodium sulphate-water, the solubility curves of Na2SO4 (rhombic) and Na2SO4.10H2Omeet at 32.2ºC. Thus 32.2ºC is the transition temperature where Na2SO4.10H2O changes to Na2SO4.
(4) Cooling curve methodThere is often an evolution or absorption of heat when one form passes to the other. Suppose
that form A is converted into form B on heating. Now let B be allowed to cool and a curve obtained byplotting the temperature against the time. The otherwise steady curve has a distinct break at atemperature corresponding to the transition point because here heat is evolved from B.
This method is suitable for determining the transition temperature between different hydrates ofa salt or between a hydrate and an anhydrous salt (e.g., Na2SO4.10H2O to Na2SO4), or for differentforms of a metal.
THE WATER SYSTEMUnder normal conditions the system ‘water’ is a three-phase, one-component system. The three
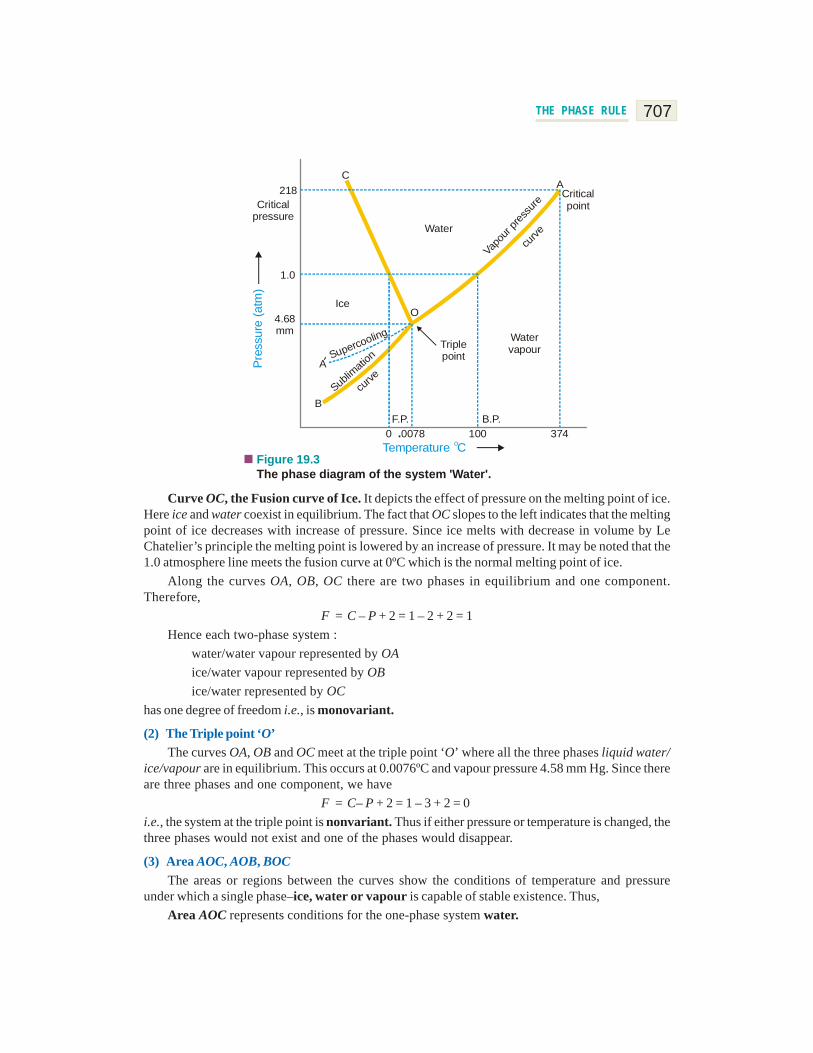
phases involved are liquid water, ice, water vapour. All these phases can be represented by onechemical entity H2O and hence one component of the system. The number of phases which can existin equilibrium any time depends on the conditions of temperature and pressure. The phase diagramor PT-graph of the system/ water/ice/vapour is shown in Fig. 19.3. The salient features of the phasediagram are listed below.
(1) The Curves OA, OB, OC(2) The Triple Point O(3) The Areas AOC, AOB, BOCLet us proceed to discuss the significance of each of these features.
(1) The Curves OA, OB, OCThese three curves meet at the point O and divide the diagram into three regions or areas.Curve OA, the Vapour Pressure curve of Water. It represents the vapour pressure of liquid
water at different temperatures. The two phases water and water vapour coexist in equilibrium alongthis curve. The curve OA terminates at A, the critical point (218 atm, temp. 374ºC) when the liquid andvapour are indistinguishable from each other and there is left one phase only. When the vapourpressure is equal to one-atmosphere, the corresponding temperature, as indicated on the phasediagram is the boiling point (100ºC) of water.
Curve OB, the Sublimation curve of Ice. It shows the vapour pressure of solid ice at differenttemperatures. The two phases solid ice and vapour coexist in equilibrium along this curve. At thelower limit the curve OB terminates at absolute zero (– 273ºC) where no vapour exists.
707THE PHASE RULE
Temperature Co0 .0078 100 374
Watervapour
ACriticalpoint
Vapo
ur pre
ssure
curve
Water
C218
Criticalpressure
1.0
4.68mm
Pres
sure
(atm
)
A
BSub
limati
on
curve
Supercooling
OIce
Triplepoint
F.P. B.P.
The phase diagram of the system 'Water'.Figure 19.3
Curve OC, the Fusion curve of Ice. It depicts the effect of pressure on the melting point of ice.Here ice and water coexist in equilibrium. The fact that OC slopes to the left indicates that the meltingpoint of ice decreases with increase of pressure. Since ice melts with decrease in volume by LeChatelier’s principle the melting point is lowered by an increase of pressure. It may be noted that the1.0 atmosphere line meets the fusion curve at 0ºC which is the normal melting point of ice.
Along the curves OA, OB, OC there are two phases in equilibrium and one component.Therefore,
F = C – P + 2 = 1 – 2 + 2 = 1Hence each two-phase system :
water/water vapour represented by OAice/water vapour represented by OBice/water represented by OC
has one degree of freedom i.e., is monovariant.
(2) The Triple point ‘O’The curves OA, OB and OC meet at the triple point ‘O’ where all the three phases liquid water/
ice/vapour are in equilibrium. This occurs at 0.0076ºC and vapour pressure 4.58 mm Hg. Since thereare three phases and one component, we have
F = C– P + 2 = 1 – 3 + 2 = 0i.e., the system at the triple point is nonvariant. Thus if either pressure or temperature is changed, thethree phases would not exist and one of the phases would disappear.
(3) Area AOC, AOB, BOCThe areas or regions between the curves show the conditions of temperature and pressure
under which a single phase–ice, water or vapour is capable of stable existence. Thus,Area AOC represents conditions for the one-phase system water.

708 1919191919 PHYSICAL CHEMISTRY
Area AOB represents conditions for the one-phase system water vapour.Area BOC represents conditions for the one-phase system ice.In all the three areas there being one-phase and one-component, we have
F = C – P + 2 = 1 – 1 + 2 = 2Thus each system water, water vapour, or ice has 2 degrees of freedom i.e., the system is
bivariant.(4) Metastable system : Supercooled Water/Vapour System
The vapour pressure curve of water AO can be continued past the triple point as shown by thedashed line OA'. That is, water can be supercooled by carefully eliminating solid particles. Thesupercooled water/vapour system is metastable (unstable). It at once reverts to the stable systemice/vapour on the slightest disturbance or introducing a crystal of ice.
THE SULPHUR SYSTEMIt is a one-component, four-phase system. The four phases are :(a) Two solid polymorphic forms :
(i) Rhombic Sulphur (SR)(ii) Monoclinic Sulphur (SM)
(b) Sulphur Liquid (SL)(c) Sulphur Vapour (SV)All the four phase can be represented by the only chemical individual ‘sulphur’ itself and hence
one component of the system.The two crystalline forms of sulphur SR and SM exhibit enantiotropy with a transition point at
95.6ºC. Below this temperature SR is stable, while above it SM is the stable variety. At 95.6ºC eachform can be gradually transformed to the other and the two are in equilibrium. At 120ºC, SM melts.Thus,
ºR M L
95.61 120ºS S S
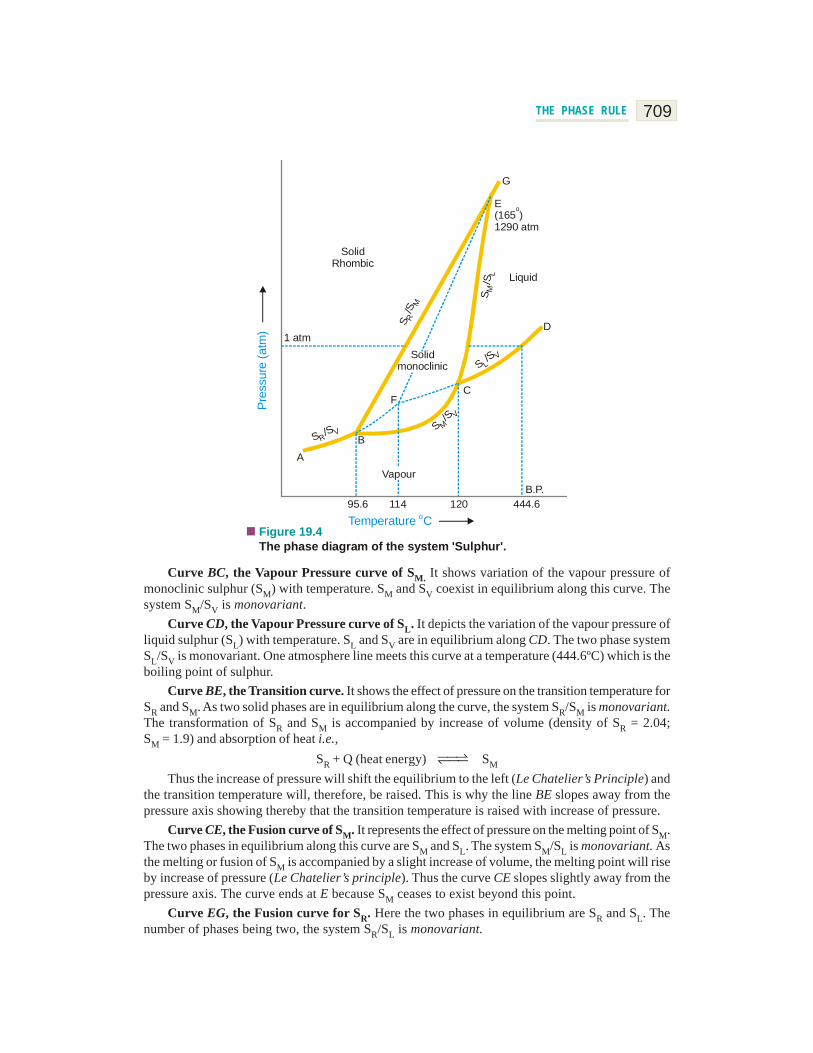
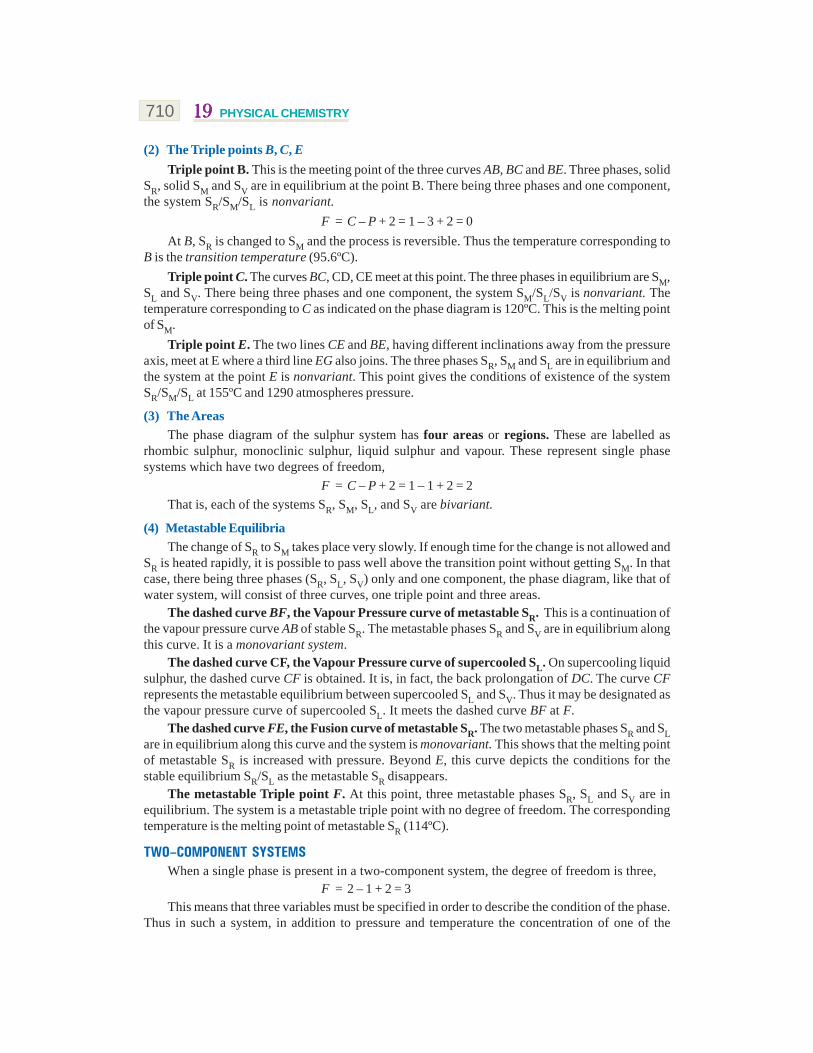
The phase diagram for the sulphur system is shown in Fig. 19.4. The salient features of thephase diagram are described below.
(i) The six curves AB, BC, CD, BE, CE, EG(ii) The three Triple points B, C, E(iii) The four areas :
ABG marked ‘solid Rhombic’BEC marked ‘solid Monoclinic’GECD marked ‘liquid Sulphur’ABCD marked ‘Sulphur vapour’
Let us now proceed to discuss the significance of these features :(1) The curves AB, BC, CD, BE, CE, EG
These six curves divide the diagram into four areas.Curve AB, the Vapour Pressure curve of SR. It shows the vapour pressure of solid rhombic
sulphur (SR) at different temperatures. Along this curve the two phases SR and sulphur vapour (SV)are in equilibrium. The system SR/SV has one degree of freedom,
F = C – P + 2 = 1 – 2 + 2 = 1i.e., it is monovariant.
709THE PHASE RULE
G
E(165 )1290 atm
o
Liquid
S/
MS L
D
SolidRhombic
1 atm
FC
S/S
LV
BA
95.6 114 120 444.6B.P.
Temperature Co
Pres
sure
(atm
)
S/S
RM
Vapour
Solidmonoclinic
S/
MS V
The phase diagram of the system 'Sulphur'.Figure 19.4
S /SR
V
Curve BC, the Vapour Pressure curve of SM. It shows variation of the vapour pressure ofmonoclinic sulphur (SM) with temperature. SM and SV coexist in equilibrium along this curve. Thesystem SM/SV is monovariant.
Curve CD, the Vapour Pressure curve of SL. It depicts the variation of the vapour pressure ofliquid sulphur (SL) with temperature. SL and SV are in equilibrium along CD. The two phase systemSL/SV is monovariant. One atmosphere line meets this curve at a temperature (444.6ºC) which is theboiling point of sulphur.
Curve BE, the Transition curve. It shows the effect of pressure on the transition temperature forSR and SM. As two solid phases are in equilibrium along the curve, the system SR/SM is monovariant.The transformation of SR and SM is accompanied by increase of volume (density of SR = 2.04;SM = 1.9) and absorption of heat i.e.,
SR + Q (heat energy) SMThus the increase of pressure will shift the equilibrium to the left (Le Chatelier’s Principle) and
the transition temperature will, therefore, be raised. This is why the line BE slopes away from thepressure axis showing thereby that the transition temperature is raised with increase of pressure.
Curve CE, the Fusion curve of SM. It represents the effect of pressure on the melting point of SM.The two phases in equilibrium along this curve are SM and SL. The system SM/SL is monovariant. Asthe melting or fusion of SM is accompanied by a slight increase of volume, the melting point will riseby increase of pressure (Le Chatelier’s principle). Thus the curve CE slopes slightly away from thepressure axis. The curve ends at E because SM ceases to exist beyond this point.
Curve EG, the Fusion curve for SR. Here the two phases in equilibrium are SR and SL. Thenumber of phases being two, the system SR/SL is monovariant.
710 1919191919 PHYSICAL CHEMISTRY
(2) The Triple points B, C, ETriple point B. This is the meeting point of the three curves AB, BC and BE. Three phases, solid
SR, solid SM and SV are in equilibrium at the point B. There being three phases and one component,the system SR/SM/SL is nonvariant.
F = C – P + 2 = 1 – 3 + 2 = 0At B, SR is changed to SM and the process is reversible. Thus the temperature corresponding to
B is the transition temperature (95.6ºC).Triple point C. The curves BC, CD, CE meet at this point. The three phases in equilibrium are SM,
SL and SV. There being three phases and one component, the system SM/SL/SV is nonvariant. Thetemperature corresponding to C as indicated on the phase diagram is 120ºC. This is the melting pointof SM.
Triple point E. The two lines CE and BE, having different inclinations away from the pressureaxis, meet at E where a third line EG also joins. The three phases SR, SM and SL are in equilibrium andthe system at the point E is nonvariant. This point gives the conditions of existence of the systemSR/SM/SL at 155ºC and 1290 atmospheres pressure.
(3) The AreasThe phase diagram of the sulphur system has four areas or regions. These are labelled as
rhombic sulphur, monoclinic sulphur, liquid sulphur and vapour. These represent single phasesystems which have two degrees of freedom,
F = C – P + 2 = 1 – 1 + 2 = 2That is, each of the systems SR, SM, SL, and SV are bivariant.
(4) Metastable EquilibriaThe change of SR to SM takes place very slowly. If enough time for the change is not allowed and
SR is heated rapidly, it is possible to pass well above the transition point without getting SM. In thatcase, there being three phases (SR, SL, SV) only and one component, the phase diagram, like that ofwater system, will consist of three curves, one triple point and three areas.
The dashed curve BF, the Vapour Pressure curve of metastable SR. This is a continuation ofthe vapour pressure curve AB of stable SR. The metastable phases SR and SV are in equilibrium alongthis curve. It is a monovariant system.
The dashed curve CF, the Vapour Pressure curve of supercooled SL. On supercooling liquidsulphur, the dashed curve CF is obtained. It is, in fact, the back prolongation of DC. The curve CFrepresents the metastable equilibrium between supercooled SL and SV. Thus it may be designated asthe vapour pressure curve of supercooled SL. It meets the dashed curve BF at F.
The dashed curve FE, the Fusion curve of metastable SR. The two metastable phases SR and SLare in equilibrium along this curve and the system is monovariant. This shows that the melting pointof metastable SR is increased with pressure. Beyond E, this curve depicts the conditions for thestable equilibrium SR/SL as the metastable SR disappears.
The metastable Triple point F. At this point, three metastable phases SR, SL and SV are inequilibrium. The system is a metastable triple point with no degree of freedom. The correspondingtemperature is the melting point of metastable SR (114ºC).
TWO–COMPONENT SYSTEMSWhen a single phase is present in a two-component system, the degree of freedom is three,
F = 2 – 1 + 2 = 3This means that three variables must be specified in order to describe the condition of the phase.
Thus in such a system, in addition to pressure and temperature the concentration of one of the
711THE PHASE RULE
components has also to be given. For graphic representation of these variables, three coordinateaxes at right angles to each other would be required. Therefore the phase diagram obtained would bea solid model.
For the sake of having simple plane diagrams we generally consider only two variables, the thirdone being a constant. For example, for a solid/liquid equilibrium, the gas phase in usually absent andthe effect of pressure on the equilibrium is very small. Thus when a two-component system consistsof solid and liquid phases only, the effect of pressure may be disregarded. Then it is necessary totake into account the remaining variables viz., temperature and concentration. Such a solid/liquidsystem with the gas phase absent is called a condensed system.
The experimental measurements of temperature and concentration in condensed systems areusually carried out under atmospheric pressure. Since the degree of freedom in such a case isreduced by one, we may write the Reduced Phase rule as
F' = C – P + 1where F' gives the remaining degrees of freedom of the system. The reduced phase rule is moreconvenient to apply to solid/liquid two-component condensed system.
Since the only variables for two-component solid/liquid systems are temperature andcomposition, the phase diagrams for such systems consist of Temperature-Concentration graphs(TC graphs).
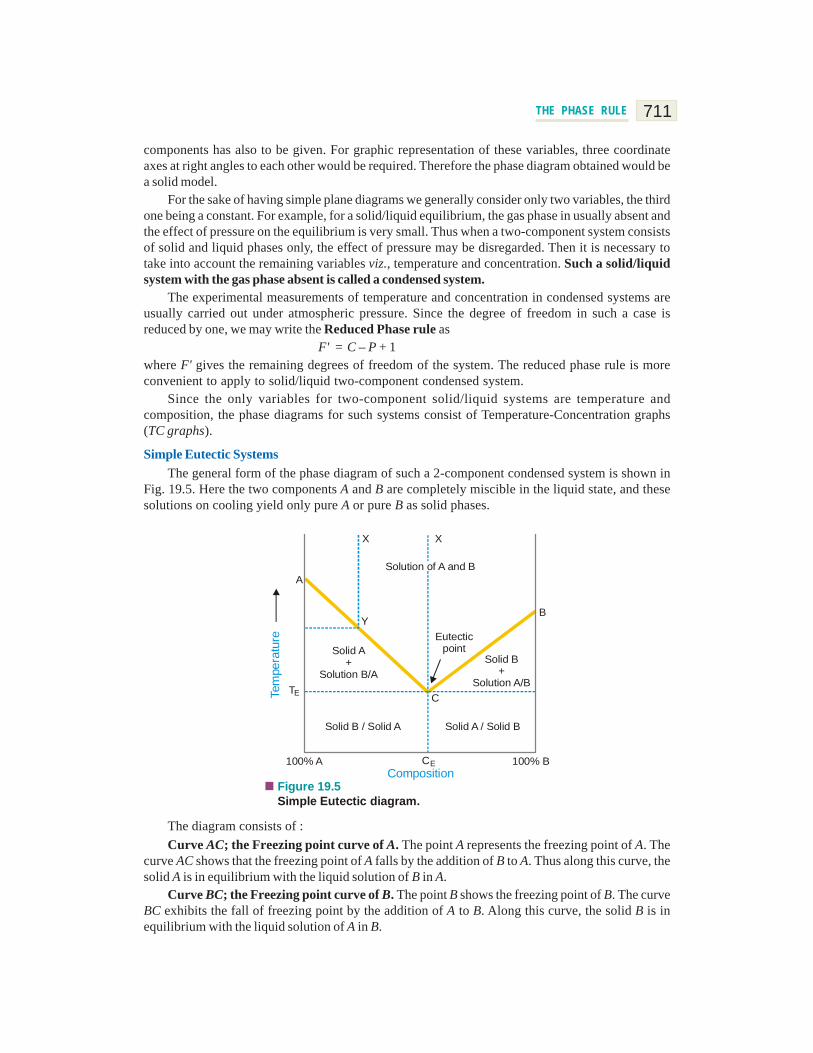
Simple Eutectic SystemsThe general form of the phase diagram of such a 2-component condensed system is shown in
Fig. 19.5. Here the two components A and B are completely miscible in the liquid state, and thesesolutions on cooling yield only pure A or pure B as solid phases.
100% A 100% BCEComposition
X X
A
Y
Solution of A and B
B
Eutecticpoint
Solid B+
Solution A/B
Solid A+
Solution B/A
Solid B / Solid A Solid A / Solid B
TETem
pera
ture
Simple Eutectic diagram.Figure 19.5
C
The diagram consists of :Curve AC; the Freezing point curve of A. The point A represents the freezing point of A. The
curve AC shows that the freezing point of A falls by the addition of B to A. Thus along this curve, thesolid A is in equilibrium with the liquid solution of B in A.
Curve BC; the Freezing point curve of B. The point B shows the freezing point of B. The curveBC exhibits the fall of freezing point by the addition of A to B. Along this curve, the solid B is inequilibrium with the liquid solution of A in B.
712 1919191919 PHYSICAL CHEMISTRY
Applying the reduced phase rule equation to the equilibria represented by the curve AC and CBi.e., solid A/solution and solid B/solution respectively, we have
F = C – P + 1 = 2 – 2 + 1 = 1The degree of freedom is one i.e., both equilibria are monovariant.The Eutectic point C. The two curves AC and BC meet at the point C. Here both the solids A and
B must be in equilibrium with the solution phase (solution of A and B). The number of phases is 3. Byapplying the reduced phase rule equation, we have
F' = C – P + 1 = 2 – 3 + 1 = 0Thus the system represented by the point C is nonvariant. In other words, both the temperature
and composition of the system solid A/solid B/solution are fixed.The mixture of components A and B as at point C melts at the lowest temperature TE indicated on
the graph. The point C is therefore, called the Eutectic point (Greek eutectos = easy melting). Thecorresponding composition (CE) and temperature (TE) are known as the eutectic composition and theeutectic temperature respectively of the system.
The eutectic mixture, although it has a definite melting point, is not to be regarded as acompound. The reasons are : (i) the components are not in stoichiometric proportions; and (ii) onexamination under a microscope these reveal the existence of separate crystals of the components.
The Area above the curves AC and BC. Here the two components A and B are present as liquidsolutions of varying compositions. As a homogeneous solution of A and B constitutes one phaseonly, this system is bivariant.
F = C – P + 1 = 2 – 1 + 1 = 2Therefore to define the system at any point in this area, both temperature and composition have
to be specified.
Effect of CoolingWhen the A/B solution at any point in the area above ACB is cooled, the cooling dashed line
meets the curve AC, say at Y. Here solid A separates and the equilibrium shifts down along the curveAC. The change of composition and temperature continues till the eutectic point C is reached whensolid B also separates. Thus in the area below AC and above TE line, there exist two phases viz., solidA and solution A/B, and the system is bivariant. Similarly, cooling of solution B/A on the other sideof eutectic, on reaching the curve BC would yield solid B/solution system. Thus the area below BCup to TE line would represent solid B and solution.
If the solution just above the eutectic point is cooled, a solid mixture (eutectic mixture) ofeutectic composition CE, will be obtained straightaway.
Since below TE line no liquid can exist, the entire area below this line would represent the systemsolid A/solid B.
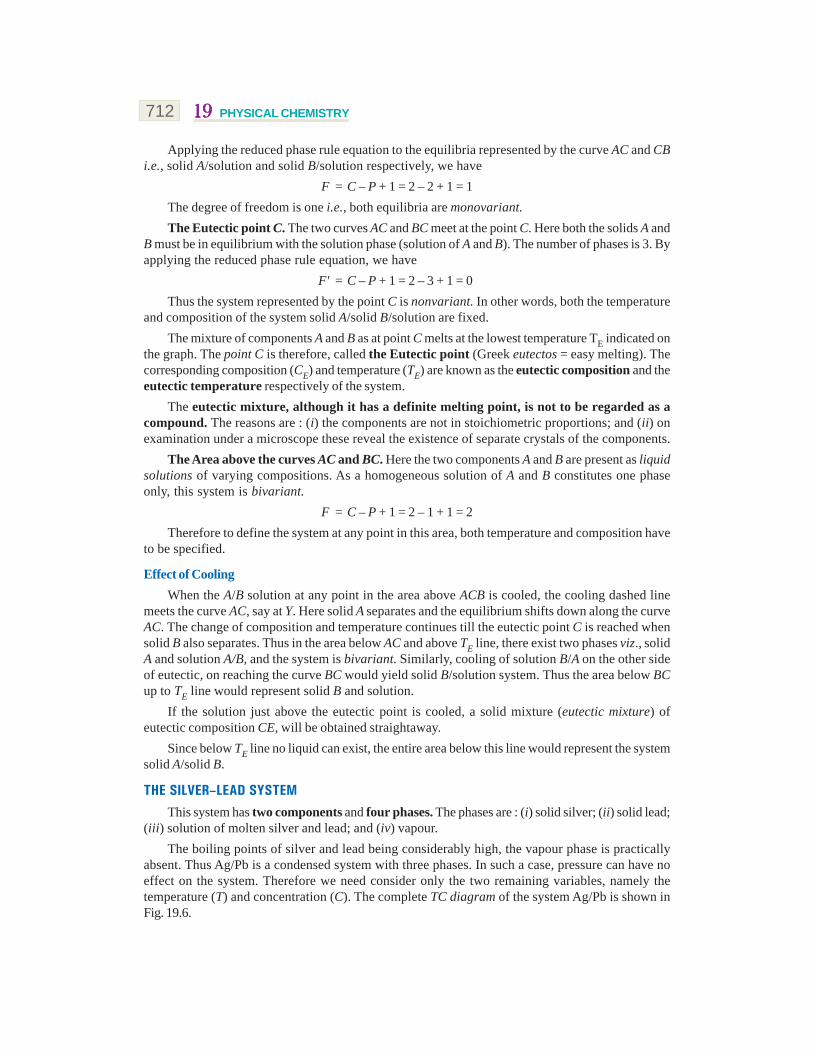
THE SILVER–LEAD SYSTEMThis system has two components and four phases. The phases are : (i) solid silver; (ii) solid lead;
(iii) solution of molten silver and lead; and (iv) vapour.The boiling points of silver and lead being considerably high, the vapour phase is practically
absent. Thus Ag/Pb is a condensed system with three phases. In such a case, pressure can have noeffect on the system. Therefore we need consider only the two remaining variables, namely thetemperature (T) and concentration (C). The complete TC diagram of the system Ag/Pb is shown inFig. 19.6.
713THE PHASE RULE
A961
Liquid (Pb/Ag)
X
B
Y
327Eutecticpoint
Solid Ag/Solution (Pb/Ag) Solid Pb/
Solution (Ag/Pb)
100 Ag0 Pb
97.5 Pb2.5 Ag
100 Pb0 AgComposition
Solid Ag/Pb
303Tem
pera
ture
Co
C
The phase diagram of Ag/Pb system.Figure 19.6
The salient features of the diagram are :(a) Two curves, AC and BC(b) Eutectic point, C(c) Three areas : (i) above ACB; (ii) below AC; (iii) below BCCurve AC; the Freezing point curve of Ag. A represents the freezing point or melting point of
solid silver (961ºC) and the curve AC shows that the addition of lead lowers the melting point alongit. The phases in equilibrium along AC are solid silver and solution of silver and lead. Applying thereduced phase rule equation
F' = C – P + 1 = 2 – 2 + 1 = 1Thus the system Ag/solution is monovariant.Curve B; the Freezing point curve of Pb. B represents the melting point of solid lead (327ºC) and
the curve BC shows that the melting point is lowered by addition of silver. The phases in equilibriumalong BC are solid lead and solution. The system is monovariant.
The Eutectic point C. The curves AC and BC intersect at C, which is called the eutectic point.Here three phases solid Ag, solid Pb, and solution are in equilibrium. Applying the reduced phaserule equation
F' = C – P + 1 = 2 – 3 + 1 = 0Thus the system Ag/Pb/solution at C is nonvariant. Both the variables, temperature (303ºC) and
composition (97.5% Pb, 2.5% Ag) are fixed. If you raise the temperature above the eutectic temperature,the solid phases Ag and Pb disappear and if you cool below it, you will land in the solid Ag/Pb areawhere solution phase is nonexistent.
The Area above AOC. This region represents the single phase system, the solution of molten Agand Pb. Applying the reduced phase rule equation, we have
F' = C – P + 1 = 2 – 1 + 1 = 2Thus the system solution Ag/Pb is bivariant.
The area below AC represents the phases Ag + solution, while that below BC the phasesPb + solution. The area below the temperature 303º, represents solid Ag + solid Pb. All these areas
714 1919191919 PHYSICAL CHEMISTRY
have two phases and one degree of freedom,F = C – P + 1 = 2 – 2 + 1 = 1
Pattinson’s Process for the Desilverisation of Argentiferous LeadThis process of recovery of silver from argentiferous lead is based on the facts contained in the
diagram (Fig. 19.6). The argentiferous lead containing small amount of silver (less than 0.1%) ismelted well above the melting temperature of pure lead (327ºC). Let the point X represent the system‘molten lead’ on the diagram. It is then allowed to cool when the temperature of the melt falls alongthe dashed line XY. As the temperature corresponding to Y on the curve BC is reached solid leadbegins to separate and the solution would contain relatively larger amount of silver. On furthercooling, more of lead separates and we travel along the curve BC until the eutectic point C isreached. Lead is continuously removed by means of ladles and the percentage of silver in the meltgoes on increasing. At C, an alloy containing 2.5% Ag and 97.5% Pb is obtained. This is treated forthe recovery of silver profitably.
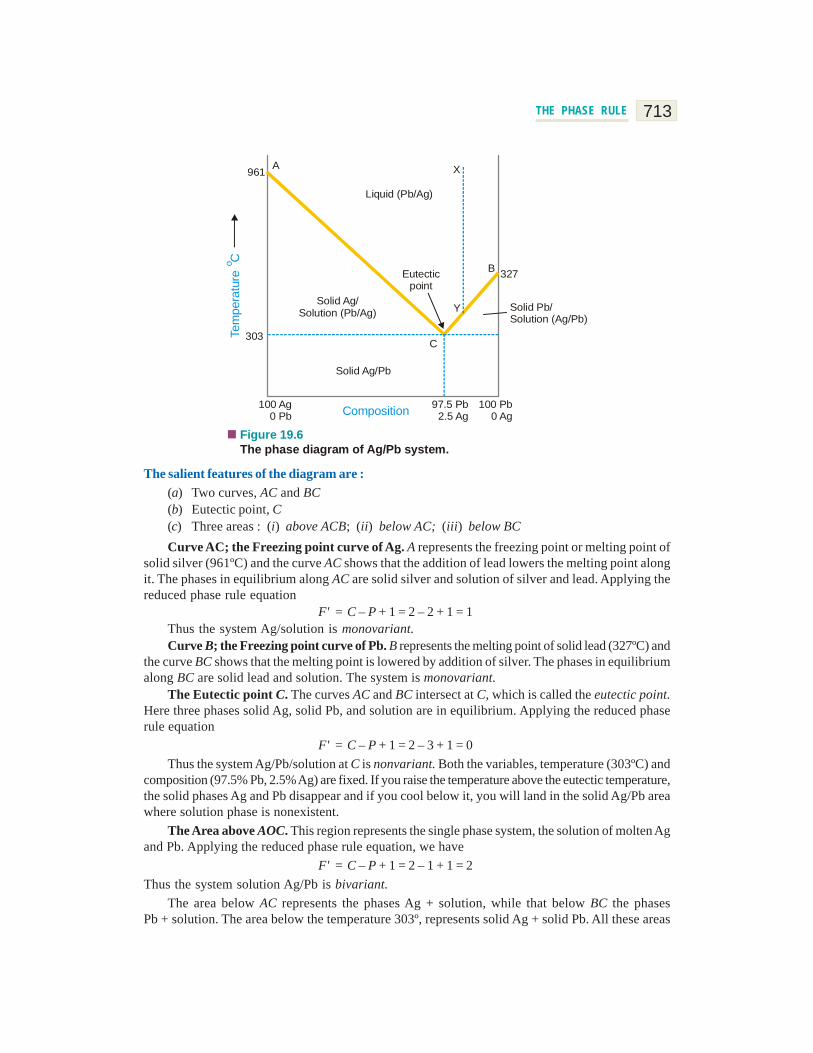
THE ZINC–CADMIUM SYSTEMThis is another example of a metal/metal system with a eutectic. The phase diagram is shown in
Fig 19.7 which is similar to the one for silver/lead system. It consists of :
B
Solid Zn +Solid Cd
270o
321o
Cd +Liquid
Eutecticpoint
O
Solid Cd+Solid Zn
Zn + Liquid
Liquid419
o A
100 Zn0 Cd
100 Cd0 Zn
83 Cd17 ZnComposition
Tem
pera
ture
Co
Phase diagram of Zn-Cd system.Figure 19.7
Curve AO; the Freezing point curve of Zinc. A represents the freezing point (or melting point) ofzinc (419ºC). The curve AO shows that the melting point of zinc is lowered by the addition ofcadmium. The phases in equilibrium along AO are solid zinc and liquid solution of zinc and cadmium.Applying the reduced phase rule equation.
F' = C – P + 1 = 2 – 2 + 1 = 1Thus the system solid zinc/solution is monovariant.Curve BO; the Freezing point curve of Cadmium. The point B represents the melting point of
cadmium (321ºC). The curve BO shows the fall of melting point of cadmium on the addition of zinc.Along this curve, solid cadmium is in equilibrium with the liquid solution of zinc and cadmium.
715THE PHASE RULE
Applying the reduced phase rule equation to the equilibrium cadmium/solution,F' = C – P + 1 = 2 – 2 + 1 = 1
Thus the degree of freedom is one and the equilibrium is monovariant.The Eutectic point O. The curves AO and BO meet at O. Here, solid zinc, solid cadmium and
solution are in equilibrium. The number of phases is, therefore, three.F = C – P + 1 = 2 – 3 + 1 = 0
Thus the system at point O is nonvariant. The point O is called the eutectic point. Both thetemperature and composition being fixed, the system has no degree of freedom. The eutectictemperature is 270º and the eutectic composition is 83% cadmium 17% zinc.
The Area above AO. In this area, both the components zinc and cadmium are present as liquidsolution of varying composition. The solution of the two metals being homogeneous, constitutesone phase only. Thus the system represented by the area above AO is bivariant.
F = C – P + 1 = 2 – 1 + 1 = 2The Area above BO. In this area, zinc and cadmium exist as liquid solution. The composition of
the solution is indicated on the composition axis. The liquid solution, regardless of its composition,represents one phase only. Thus the system in the area above BO is bivariant.
F = C – P + 1 = 2 – 1 + 1 = 2The effect of cooling. If the solution in the area above AO is cooled, zinc separates as the curve
itself is reached. This continues till the point O when the solid eutectic mixture (83% Cd + 17% Zn)separates. Similarly, the solution above BO on cooling allows the separation of cadmium. Thiscontinues till the point O is reached at 270ºC and eutectic mixture separates. As clear from thediagram, the area below the curve AO represents zinc and solution; the area below BO showscadmium and solution. The area below the eutectic temperature represents the system solid zinc/solid cadmium.
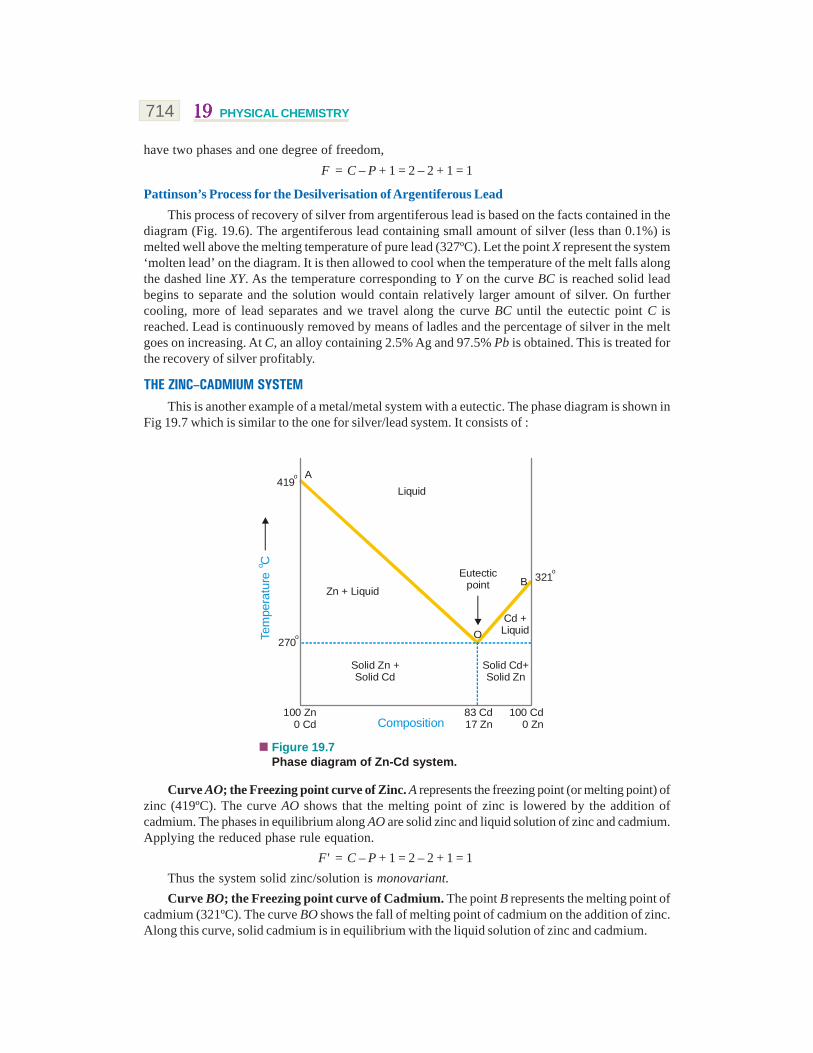
POTASSIUM IODIDE–WATER SYSTEMIt has four phases : (i) Solid KI ; (ii) Solution of KI in water ; (iii) Ice; and (iv) Vapour. Only two
chemical constituents KI and H2O being necessary to depict the composition of all the four phases,it is a two-component system.
Since the conditions for the existence of the various phases are studied at atmospheric pressurethe vapour phase is ignored and the system KI-H2O is regarded as a condensed system. Pressurebeing constant, the two variables, temperature and concentration will be considered. The TC diagramof the system is shown in Fig. 19.8. It consists of :
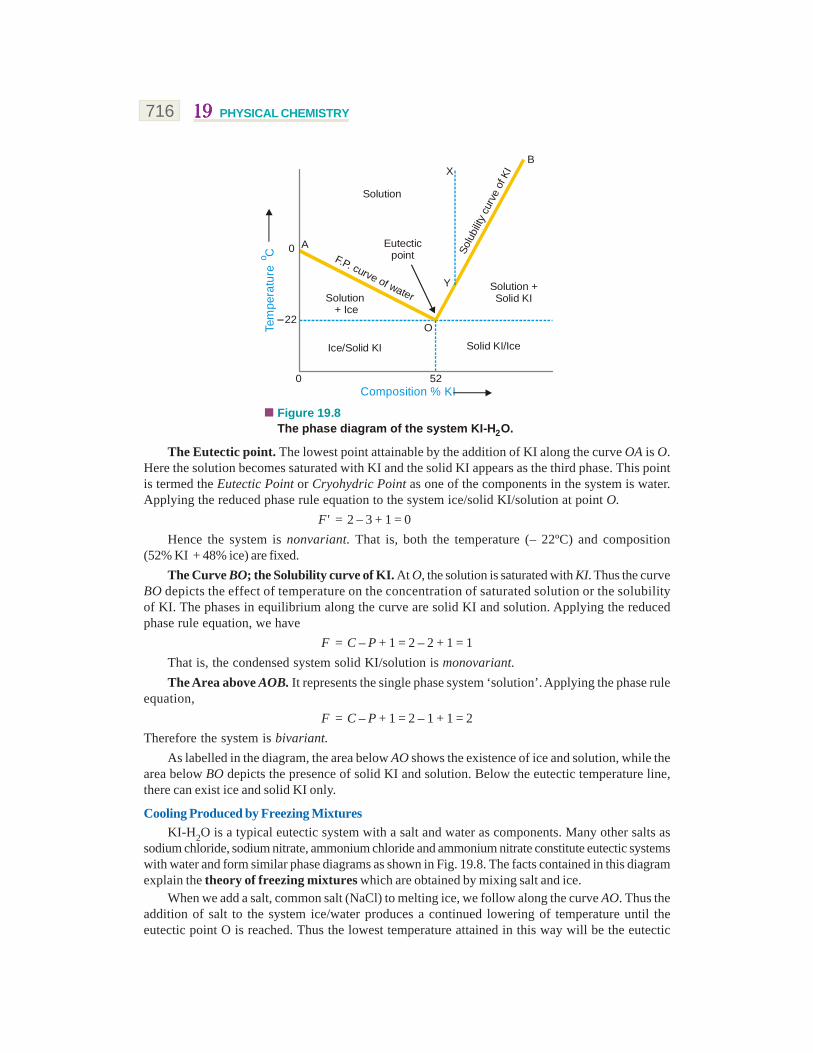
(a) The Curves AO and OB(b) The Eutectic Point O(c) The area above AOB and the areas below the curves OA and BOThe Curve AO; the Freezing point curve of Water. The point A represents the freezing point of
water or the melting point of ice (0ºC) under normal conditions. The curve AO shows that the meltingpoint of ice falls by the addition of solid KI. As more and more of KI is added, the concentrationof solution and the melting temperature changes along the curve AO. The phases in equilibriumalong the curve AO are ice and solution. Applying the reduced phase rule equation to the condensedsystem ice/solution, we have
F' = 2 – 2 + 1 = 1Thus the system is monovariant.
716 1919191919 PHYSICAL CHEMISTRY
AF.P. curve of waterSolution + Ice
Eutecticpoint
Solution +Solid KI
Y
Solu
bility
cur
ve o
f KI
BX
Solution
O
Ice/Solid KI Solid KI/Ice
22
0
Composition % KI0 52
Tem
pera
ture
Co
The phase diagram of the system KI-H O.2
Figure 19.8
The Eutectic point. The lowest point attainable by the addition of KI along the curve OA is O.Here the solution becomes saturated with KI and the solid KI appears as the third phase. This pointis termed the Eutectic Point or Cryohydric Point as one of the components in the system is water.Applying the reduced phase rule equation to the system ice/solid KI/solution at point O.
F' = 2 – 3 + 1 = 0Hence the system is nonvariant. That is, both the temperature (– 22ºC) and composition
(52% KI + 48% ice) are fixed.The Curve BO; the Solubility curve of KI. At O, the solution is saturated with KI. Thus the curve
BO depicts the effect of temperature on the concentration of saturated solution or the solubilityof KI. The phases in equilibrium along the curve are solid KI and solution. Applying the reducedphase rule equation, we have
F = C – P + 1 = 2 – 2 + 1 = 1That is, the condensed system solid KI/solution is monovariant.The Area above AOB. It represents the single phase system ‘solution’. Applying the phase rule
equation,F = C – P + 1 = 2 – 1 + 1 = 2
Therefore the system is bivariant.As labelled in the diagram, the area below AO shows the existence of ice and solution, while the
area below BO depicts the presence of solid KI and solution. Below the eutectic temperature line,there can exist ice and solid KI only.
Cooling Produced by Freezing MixturesKI-H2O is a typical eutectic system with a salt and water as components. Many other salts as
sodium chloride, sodium nitrate, ammonium chloride and ammonium nitrate constitute eutectic systemswith water and form similar phase diagrams as shown in Fig. 19.8. The facts contained in this diagramexplain the theory of freezing mixtures which are obtained by mixing salt and ice.
When we add a salt, common salt (NaCl) to melting ice, we follow along the curve AO. Thus theaddition of salt to the system ice/water produces a continued lowering of temperature until theeutectic point O is reached. Thus the lowest temperature attained in this way will be the eutectic
717THE PHASE RULE
temperature (– 22.0ºC). Alternatively, we may start with a concentrated solution of the salt representedby point X on the phase diagram. As we withdraw heat by adding ice, we travel along the dashed lineXY. At Y which lies on the solubility curve BO, the solution becomes saturated with the salt. Onfurther withdrawing heat, we go along with the curve BO until the eutectic point is reached. Thus thesame minimum temperature can be attained with a freezing mixture, whether we add salt to ice or iceto salt solution. The eutectic temperatures of some salt/ice systems are listed below.
System Eutectic Temperature
NH4Cl + ICE – 16.0ºCNaCl.2H2O + ICE – 22.0ºCKNO2 + ICE – 2.6ºCNaNO2 + ICE – 18.1ºCKCl + ICE – 11.4ºC
Systems in which two components form a solid compoundSo far we have studied systems in which the two components exist as separate entities whether
in the solid or solution phase. There are a number of systems known, in which two metals form anintermetallic compound, or a salt and water form a solid hydrate.
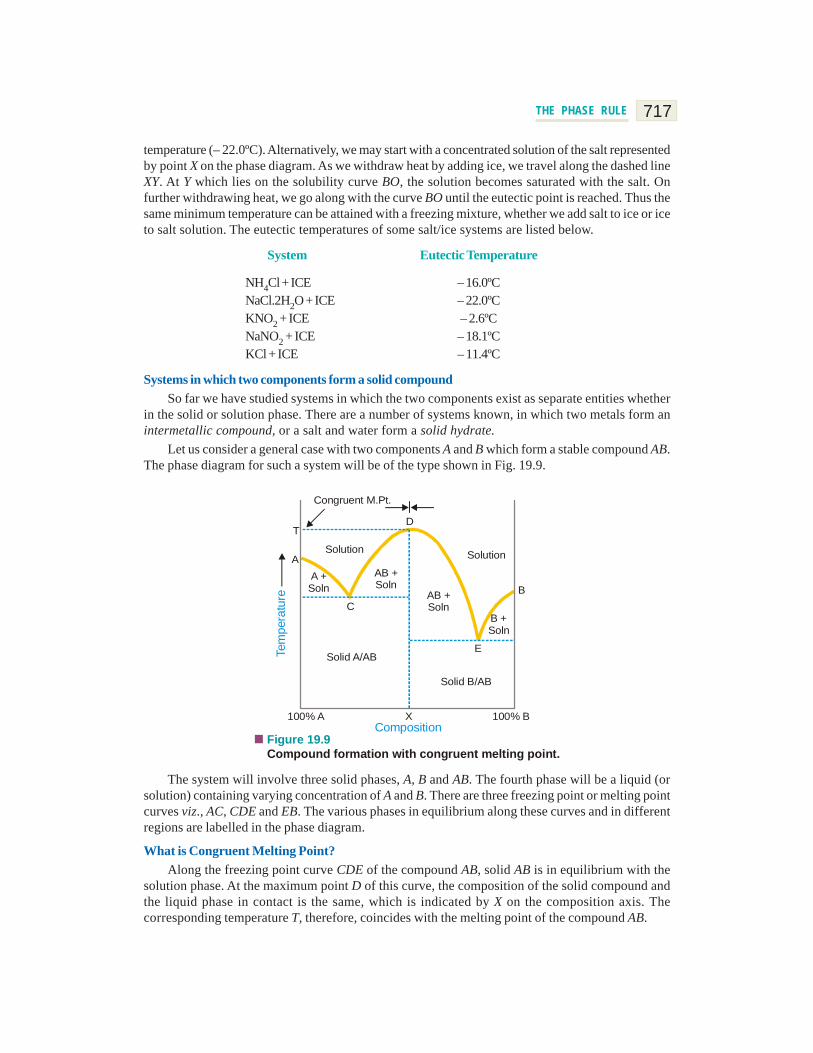
Let us consider a general case with two components A and B which form a stable compound AB.The phase diagram for such a system will be of the type shown in Fig. 19.9.
D
Congruent M.Pt.
T
ASolution Solution
BA +Soln
AB +Soln
AB +Soln
B +Soln
C
ESolid A/AB
Solid B/AB
100% B100% A X
Tem
pera
ture
Composition
Compound formation with congruent melting point.Figure 19.9
The system will involve three solid phases, A, B and AB. The fourth phase will be a liquid (orsolution) containing varying concentration of A and B. There are three freezing point or melting pointcurves viz., AC, CDE and EB. The various phases in equilibrium along these curves and in differentregions are labelled in the phase diagram.
What is Congruent Melting Point?Along the freezing point curve CDE of the compound AB, solid AB is in equilibrium with the
solution phase. At the maximum point D of this curve, the composition of the solid compound andthe liquid phase in contact is the same, which is indicated by X on the composition axis. Thecorresponding temperature T, therefore, coincides with the melting point of the compound AB.
718 1919191919 PHYSICAL CHEMISTRY
When the solid compound AB and the liquid phase have identical composition at the maximumpoint on the freezing point curve, the corresponding temperature is said to be the CongruentMelting Point of the compound.
At point D since both the phases have the same composition, the system has one componentonly. Hence it is nonvariant.
F = C – P + 1 = 1 – 2 + 1 = 0The diagram in Fig. 19.9 has the appearance of two simple eutectic diagrams joined together at
the position of arrows. The diagram to the left represents the eutectic system A/AB, while that on theright the system AB/B. The phase diagram of the system Zinc-Magnesium is exactly of the typeshown in Fig. 19.9.
The salt-water systems often involve the formation of several compounds (hydrates). Forexample, the system Ferric chloride-Water forms as many as four hydrates. Thus the compositephase diagram could be regarded as made of four simple eutectic diagrams.
Some common 2-component systems involving the formation of one or more compounds withcongruent melting points are discussed below.
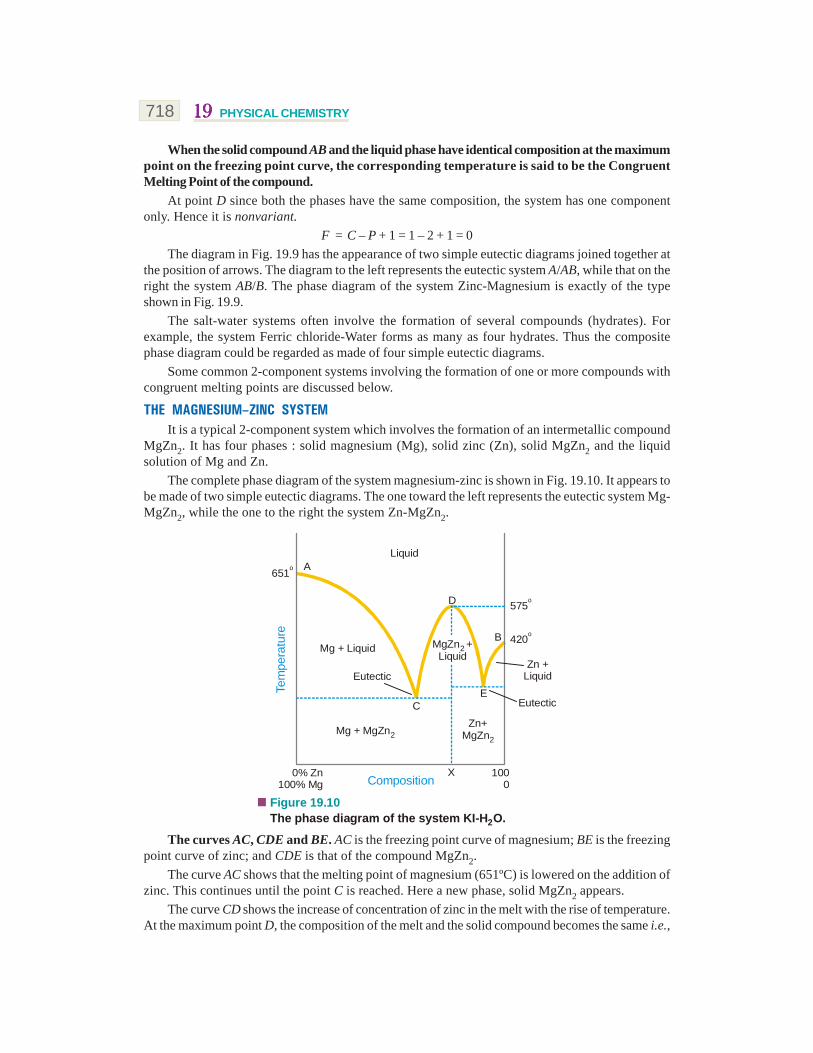
THE MAGNESIUM–ZINC SYSTEMIt is a typical 2-component system which involves the formation of an intermetallic compound
MgZn2. It has four phases : solid magnesium (Mg), solid zinc (Zn), solid MgZn2 and the liquidsolution of Mg and Zn.
The complete phase diagram of the system magnesium-zinc is shown in Fig. 19.10. It appears tobe made of two simple eutectic diagrams. The one toward the left represents the eutectic system Mg-MgZn2, while the one to the right the system Zn-MgZn2.
Eutectic
A651o
Liquid
D
B
575o
420o
Zn +Liquid
MgZn +Liquid
2
EC
Eutectic
Mg + Liquid
Zn+MgZn2
Mg + MgZn2
X 1000
0% Zn100% Mg
The phase diagram of the system KI-H O.2
Figure 19.10
Tem
pera
ture
Composition
The curves AC, CDE and BE. AC is the freezing point curve of magnesium; BE is the freezingpoint curve of zinc; and CDE is that of the compound MgZn2.
The curve AC shows that the melting point of magnesium (651ºC) is lowered on the addition ofzinc. This continues until the point C is reached. Here a new phase, solid MgZn2 appears.
The curve CD shows the increase of concentration of zinc in the melt with the rise of temperature.At the maximum point D, the composition of the melt and the solid compound becomes the same i.e.,
719THE PHASE RULE
MgZn2. The point D, therefore, represents the melting point of MgZn2 (575ºC). The curve DE nowshows the lowering of the melting point with the addition of zinc until the lowest point is attained.Here solid zinc appears.
The curve BE exhibits that the melting point of zinc (420ºC) falls with the addition of magnesiumuntil the point E is reached.
Along the freezing point curves AC, CDE and BE, there are two phases in equilibrium viz., onesolid phase (Mg, Zn, or MgZn2) and the other liquid phase. Applying the reduced phase ruleequation, we have
F = C – P + 1 = 2 – 2 + 1 = 1This shows that the system Mg/liquid, Zn/liquid and MgZn2/liquid are all monovariant.Eutectic points C and E. There are two eutectic points in the phase diagram. The systems at the
points C and E have two components and three phases in equilibrium. Phases Present
C Solid Mg, solid MgZn2, LiquidE Solid Zn, solid MgZn2, Liquid
These systems are, therefore, nonvariant.F = C – P + 1 = 2 – 3 + 1 = 0
Congruent Melting Point. As already stated, the composition of the compound MgZn2 and themelt at D is identical. The corresponding temperature is the congruent melting point of the compound.Here the system has two phases viz., the solid compound and the melt. Both these can be representedby one component (MgZn2). Therefore the system at D is nonvariant,
F = C – P + 1 = 1 – 2 + 1 = 0The Areas. The area above the curves AC, CDE and BE represents the solution of magnesium
and zinc (the melt). The single phase system at any point in this area is bivariant.The phases present in the other regions of the phase diagram are as labelled.
THE FERRIC CHLORIDE–WATER SYSTEMThis provides an example of a 2-component system in which many compounds (hydrates) are
formed. It is a composite system made of several simple eutectic systems.Seven-phase condensed system. Ferric chloride (Fe2Cl6) forms four stable crystalline hydrates :
Formula Abbreviated AbbreviatedName Formula
Fe2Cl6.12H2O Dodecahydrate 12H2OFe2Cl6.7H2O Heptahydrate 7H2OFe2Cl6.5H2O Pentahydrate 5H2OFe2Cl6.4H2O Tetrahydrate 4H2O
The other three phases involved are ice, anhydrous ferric chloride and solution. Since allmeasurements of temperature and concentration are made at atmospheric pressure, the vapourphase is ignored and the system Fe2Cl6/H2O is considered a condensed system.
Two components. As the composition of all the seven phases can be represented by theconstituents Fe2Cl6 and H2O, it is a two-component system.
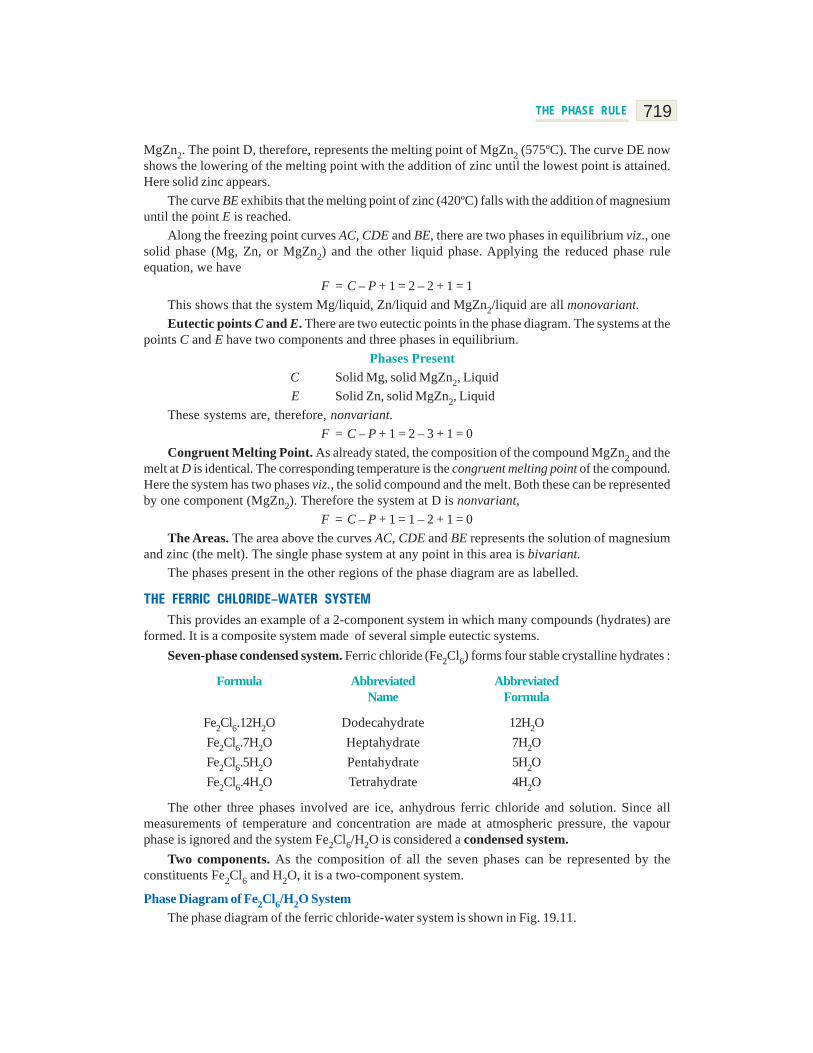
Phase Diagram of Fe2Cl6/H2O SystemThe phase diagram of the ferric chloride-water system is shown in Fig. 19.11.
720 1919191919 PHYSICAL CHEMISTRY
FeC
l.12
HO
26
2
FeC
l.7H
O2
62
FeC
l.5H
O2
62
FeC
l.4H
O2
62
FeC
l2
6
C
DF
E
G
HJ
I
K
X1 X2to
0o A
BIce
Solution
100% Water0% Fe Cl2 6
0%100%
The Ferric chloride-Water system.Figure 19.11
Tem
pera
ture
Composition
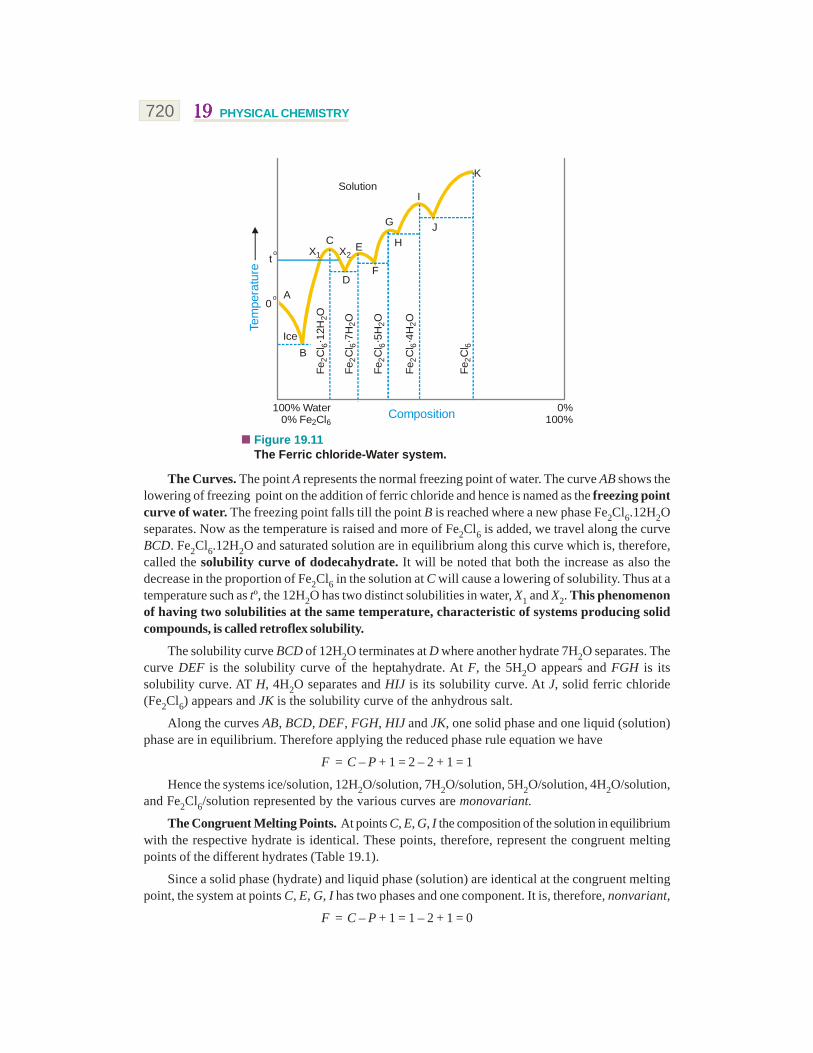
The Curves. The point A represents the normal freezing point of water. The curve AB shows thelowering of freezing point on the addition of ferric chloride and hence is named as the freezing pointcurve of water. The freezing point falls till the point B is reached where a new phase Fe2Cl6.12H2Oseparates. Now as the temperature is raised and more of Fe2Cl6 is added, we travel along the curveBCD. Fe2Cl6.12H2O and saturated solution are in equilibrium along this curve which is, therefore,called the solubility curve of dodecahydrate. It will be noted that both the increase as also thedecrease in the proportion of Fe2Cl6 in the solution at C will cause a lowering of solubility. Thus at atemperature such as tº, the 12H2O has two distinct solubilities in water, X1 and X2. This phenomenonof having two solubilities at the same temperature, characteristic of systems producing solidcompounds, is called retroflex solubility.
The solubility curve BCD of 12H2O terminates at D where another hydrate 7H2O separates. Thecurve DEF is the solubility curve of the heptahydrate. At F, the 5H2O appears and FGH is itssolubility curve. AT H, 4H2O separates and HIJ is its solubility curve. At J, solid ferric chloride(Fe2Cl6) appears and JK is the solubility curve of the anhydrous salt.
Along the curves AB, BCD, DEF, FGH, HIJ and JK, one solid phase and one liquid (solution)phase are in equilibrium. Therefore applying the reduced phase rule equation we have
F = C – P + 1 = 2 – 2 + 1 = 1
Hence the systems ice/solution, 12H2O/solution, 7H2O/solution, 5H2O/solution, 4H2O/solution,and Fe2Cl6/solution represented by the various curves are monovariant.
The Congruent Melting Points. At points C, E, G, I the composition of the solution in equilibriumwith the respective hydrate is identical. These points, therefore, represent the congruent meltingpoints of the different hydrates (Table 19.1).
Since a solid phase (hydrate) and liquid phase (solution) are identical at the congruent meltingpoint, the system at points C, E, G, I has two phases and one component. It is, therefore, nonvariant,
F = C – P + 1 = 1 – 2 + 1 = 0
721THE PHASE RULE
TABLE 19.1. CONGRUENT MELTING POINTS OF HYDRATES OF Fe2Cl6Point Congruent m.p. Hydrate
C 37º 12H2OE 32.5º 7H2OG 56º 5H2OI 73.5º 4H2O
The Eutectic points. The phase diagram of the system Fe2Cl6-H2O could be split into five simpleeutectic diagrams as shown by dashed lines in Fig. 19.11. The point A represents the melting point ofice, while C represents the congruent melting point of 12H2O. The eutectic diagram is made of thecurve AB, the melting point curve of ice and the curve CB, the melting point curve of 12H2O. Thelowest point attainable on these curves, B, is the eutectic point. Similarly the other eutectic points inthe phase diagram are D, F, H, J.
Eutectic Point Temperature Phases in Equilibrium
B – 55º ice, 12H2O, solutionD 27.4º 12H2O, 7H2O, solutionF 30º 7H2O, 5H2O, solutionH 55º 5H2O, 4H2O, solutionJ 66º 4H2O, Fe2Cl6, solution
At each of these eutectic points, the system has three phases and two components. Applyingthe reduced phase rule equation, we have
F = C – P + 1 = 2 – 3 + 1 = 0That is, the system is nonvariant.
THE SODIUM SULPHATE–WATER SYSTEM
Sodium sulphate forms two hydrates Na2SO4.10H2O (decahydrate) and Na2SO4.7H2O(heptahydrate). Furthermore, the anhydrous salt can exist in two enantiotropic crystalline forms,viz., rhombic and monoclinic. The remaining phases are solid ice, solution, and vapour. Since alldeterminations are made at atmospheric pressure, the vapour phase is ignored. Thus thesystem Na2SO4-H2O is a six phase condensed system.
The composition of all the six phases can be represented by the constituents Na2SO4 and H2O.Hence the sodium sulphate-water system has two components.
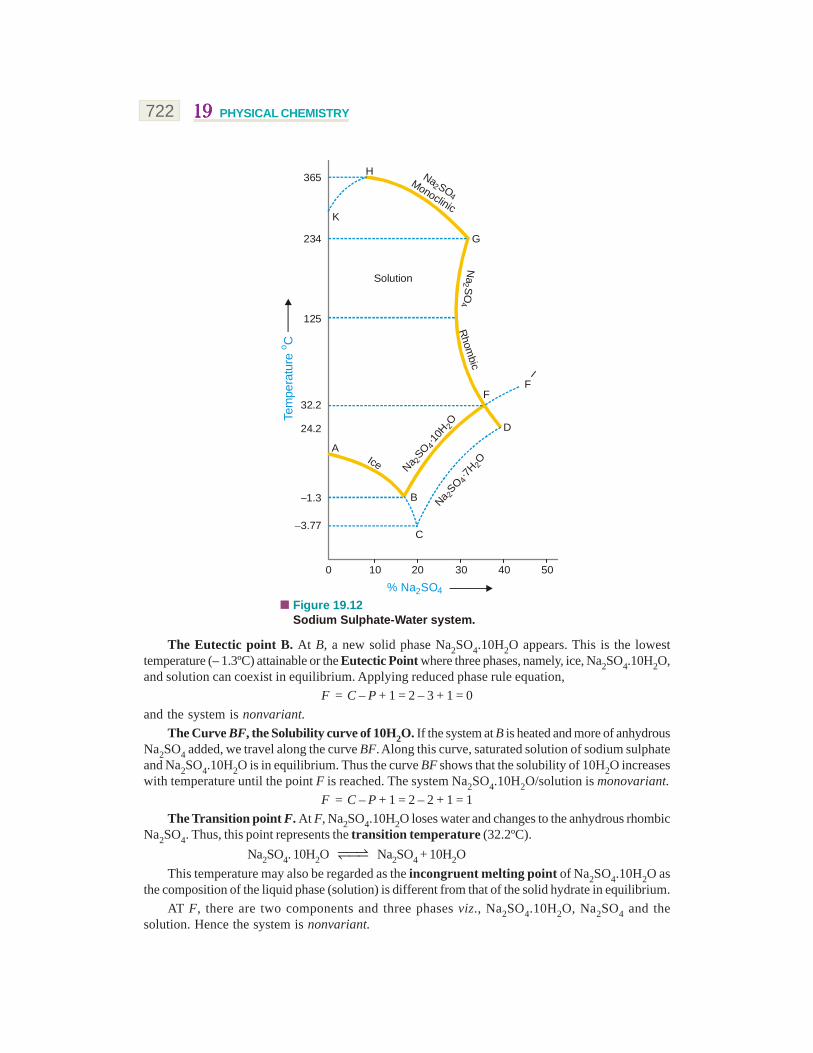
The phase diagram (or TC graph) is shown in Fig. 19.12.
The Curve AB, the Melting point curve of ice. The point A (0ºC) is the melting point of ice.The curve AB shows the lowering of melting point of ice on the addition of anhydrous Na2SO4. Thetwo phases in equilibrium along AB are ice and solution. Applying the reduced phase rule equation,
F = C – P + 1 = 2 – 2 + 1 = 1
That is the system ice/solution is monovariant.
722 1919191919 PHYSICAL CHEMISTRY
Na SOMonoclinic
24
H
K
365
234 G
Solution
Na
SO
24
125
32.2
24.2
Rhom
bic
FF
AIce Na
SO. 10
HO
2
4
2Na
SO. 7H
O
2
4
2
D
1.3
3.77
B
C
0 10 20 30 40 50
% Na SO2 4
Tem
pera
ture
Co
Sodium Sulphate-Water system.Figure 19.12
The Eutectic point B. At B, a new solid phase Na2SO4.10H2O appears. This is the lowesttemperature (– 1.3ºC) attainable or the Eutectic Point where three phases, namely, ice, Na2SO4.10H2O,and solution can coexist in equilibrium. Applying reduced phase rule equation,
F = C – P + 1 = 2 – 3 + 1 = 0and the system is nonvariant.
The Curve BF, the Solubility curve of 10H2O. If the system at B is heated and more of anhydrousNa2SO4 added, we travel along the curve BF. Along this curve, saturated solution of sodium sulphateand Na2SO4.10H2O is in equilibrium. Thus the curve BF shows that the solubility of 10H2O increaseswith temperature until the point F is reached. The system Na2SO4.10H2O/solution is monovariant.
F = C – P + 1 = 2 – 2 + 1 = 1The Transition point F. At F, Na2SO4.10H2O loses water and changes to the anhydrous rhombic
Na2SO4. Thus, this point represents the transition temperature (32.2ºC).Na2SO4. 10H2O Na2SO4 + 10H2O
This temperature may also be regarded as the incongruent melting point of Na2SO4.10H2O asthe composition of the liquid phase (solution) is different from that of the solid hydrate in equilibrium.
AT F, there are two components and three phases viz., Na2SO4.10H2O, Na2SO4 and thesolution. Hence the system is nonvariant.
723THE PHASE RULE
F = C – P + 1 = 2 – 3 + 1 = 0The Curve FG, the Solubility curve of rhombic Na2SO4. When the system at F is heated,
ultimately all the 10H2O will disappear and we pass along the curve FG, the solubility curve ofanhydrous rhombic Na2SO4. The curve shows that the solubility decreases up to 125ºC with rise oftemperature and then increases till we reach the point G. At G (234ºC), the rhombic Na2SO4 changesinto the monoclinic form. Thus G represents a transition point where enantiotropic transformationoccurs. With two components and three phases in equilibrium, the system at G is nonvariant.
F = C – P + 1 = 2 – 3 + 1 = 0The Curve GH, the Solubility curve of monoclinic Na2SO4. On continued heating the system at
G, ultimately the rhombic Na2SO4 completely changes into the monoclinic Na2SO4. Then we passalong the curve GH, which is the solubility curve of the monoclinic salt. This shows that the solubilityfalls gradually with rise in temperature up to 365ºC, the critical point of the solution. The systemalong GH has two components and two phases, namely, Na2SO4 monoclinic and solution. Thus,
F = C – P + 1 = 2 – 2 + 1 = 1the system is monovariant.
Metastable Equilibria of Na2SO4/H2O SystemThe metastable equilibria of the system Na2SO4-H2O are shown by dashed lines in the phase
diagram.1. The Curve FF'. If enough time is not allowed at F, 10H2O is not changed into anhydrous
rhombic Na2SO4. The curve FF', therefore, is the solubility curve of metastable 10H2O.2. The Curve BC. If by careful cooling, 10H2O does not separate at B, we pass along the
dashed curve BC. This is the freezing point curve of metastable supercooled solutionsaturated with respect to 10H2O.
3. The Eutectic C. At C (– 3.77º), metastable 7H2O appears. Therefore, the point C is theeutectic point where three metastable phases viz., supercooled solution, ice, and 7H2Ocoexist in equilibrium.
4. The Curve CD. By raising the temperature of the system at C, we pass along the dashedcurve CD, the solubility curve of metastable 7H2O.
5. The Curve FD. When a saturated solution with respect to rhombic Na2SO4 is cooled quickly10H2O does not appear at F (32.2º) and we pass on to D. The dashed curve FD is, therefore,the solubility curve of metastable 10H2O.
6. The Transition point D. The point D represents the transition point where the metastable7H2O is changed into metastable rhombic Na2SO4.
EXAMINATION QUESTIONS
1. Define or explain the following terms :(a) Phase rule (b) Degree of freedom(c) Phase (d) Component
2. Explain the term component. How many components are present in the following systems?(a) Water Water - vapour (b) KCl + Water KCl hydrateAnswer. (a) 1; (b) 2
3. How many phases are present in each of the following systems :
724 1919191919 PHYSICAL CHEMISTRY
(i) a drop of water placed in a stoppered bottle.(ii) a piece of molten ice placed in a beaker covered with a watch glass.(iii) mixture of N2, H2 and O2.Answer. (i) 2; (ii) 2; (iii) 1
4. Draw a phase diagram for such a component system which contains more than one solid phase. Explainthe following terms with the help of the diagrams :(a) Triple point(b) Invariant system(c) Metastable equilibrium
5. The number of components present in the following system :(i) a solution of common salt(ii) MgCO3(s) MgO(s) + CO2(g) (in a closed vessel)(iii) NH4Cl(s) NH3(g) + HCl(g)Answer. (i) 2; (ii) 2; (iii) 1
6. (a) Explain the terms(i) Phase (ii) Component(iii) Degree of freedom.How are they related?(b) Define Eutectic point.(c) Discuss the phase diagram of sulphur and water.
7. For one component system, the triple point is an invariant point. Discuss.8. A saturated solution of sodium sulphate with excess of the salt is at equilibrium with its vapour in a
closed vessel. How many phases and components are present? What are the degrees of freedom in thissystem?
9. (a) Derive Gibbs phase rule from thermodynamic considerations.(b) Explain why the fusion curve of ice has a negative slope whereas the sublimation curve has
positive slope in the phase diagram.10. Explain the following briefly :
(i) NH4Cl in equilibrium with its dissociation product is a one component system.(ii) Sulphur system at any of its triple point is a non-variant system.
11. (a) State and explain the phase rule. Explain various terms involved.(b) Draw and explain the phase diagram of one component three phase system.
12. Explain the following terms :(a) Eutectic point (b) Eutectic mixture(c) Condensed system (d) Triple point
13. State the phase rule. Explain the various terms used in it. Discuss the derivation of the phase rule fromthermodynamic considerations. (Delhi BSc, 2000)
14. Draw the complete phase diagram for water system and prove that the conclusions in regard to thedegree of freedom as derived from the diagram are the same as the deduction from the phase rule.
(Bhopal BSc, 2000)15. (a) Draw a well labelled phase diagram of KI-water system and discuss its salient features.
(b) Calculate the number of components, number of phases and degrees of freedom of the followingsystems:
(i) A liquid at critical temperature(ii) A binary azeotrope (Mysore BSc, 2000)
725THE PHASE RULE
16. The melting point curve of ice in the water system has a negative slope. Explain it with the help of thephase diagram of water system. (Agra BSc, 2000)
17. (a) Describe KI-H2O system on the basis of phase rule.(b) Explain critical solution temperature. (Jiwaji BSc, 2001)
18. Distinguish between Eutectic point and Peritectic point. (Delhi BSc, 2001)19. What is the difference between Transition temperature and melting temperature?
(Delhi BSc, 2001)20. Determine the number of phases, components and number of degrees of freedom for the following
systems :(i) N2(g) + O2(g) 2NO(g)(ii) Na2SO4.10H2O Na2SO4 + 10H2O(g) (Allahabad BSc, 2001)
21. (a) Explain Triple point and Eutectic point with examples.(b) Explain why the melting point curve is inclined towards pressure axis in the phase diagram of
water. (Sri Venkateswara BSc, 2002)22. Calculate the number of phases, components and degree of freedom in the following systems :
(i) N2O4(g) 2NO2(g)(ii) Solid carbon in equilibrium with gaseous CO, CO2 and O2 at 100°C.
(Jamia Millia BSc, 2002)23. Briefly explain the following giving one example of each type :
(i) System with upper critical solution temperature.(ii) System with lower critical solution temperature.(iii) System with both lower and upper critical solution temperatures.
(MD Rohtak BSc, 2002)24. (a) Discuss the phase equilibria of a system involving two solids and liquids.
(b) Explain triangular plots. (Jamia Millia BSc, 2002)25. Draw graph of water system and explain it in detail. (Jiwaji BSc, 2002)26. Describe phenol-water system with respect to critical solution temperature. (Nagpur BSc, 2002)27. What is the criterion for multiphase system to be in equilibrium? How are degrees of freedom calculated?
Panjab BSc, 2002)28. (a) In LiI, the equilibrium interionic distance, ro is much greater than the sum of rLi+ and rI–. How can
you account for this?(b) MgCO3 is thermally less stable than CaCO3. Explain. (Guru Nanak Dev BSc, 2002)
29. In the phase diagram for water(i) What is upper limit of liquid-vapour equilibrium line?(ii) Why is solid-liquid equilibrium line almost vertical and slightly tilted to the left?
(Panjab BSc, 2002)30. Draw a vapour pressure composition diagram showing positive deviations from Raoult’s law.
(Guru Nanak Dev BSc, 2003)31. Find out the number of degrees of freedom in the following systems :
(i) Sulphur( ) Sulphur(vap)(ii) Saturated solution of NaCl
(iii) CaCO3(s) CaO(s) + CO2(g)(iv) A mixture of water and water vapour at the triple point of water
(v) NH4Cl(s) NH3(g) + HCl(g)
726 1919191919 PHYSICAL CHEMISTRY
(vi) Na2SO4 . 10H2O Na2SO4(s) + 10H2O (Allahabad BSc, 2002)32. Determine the number of components, number of phases and degrees of freedom for the following
systems :(i) H2O(s) H2O( ) H2O(g)(ii) CaCO3(s) CaO(s) + CO2(g) (Arunachal BSc, 2002)
33. Discuss the salient features of phase diagram of sulphur system. Why can four phases of heterogeneoussystem not exist at equilibrium. (Jammu BSc, 2002)
34. (a) Discuss the main features of phase diagram of a two component system (solids) that is completelymiscible is the liquid phase.
(b) How many number of phases and components are present in the following systems?(i) A mixture of molten lead, silver and bismuth.(ii) CaCO3(s) CaO(s) + CO2(g) (MD Rohtak BSc, 2002)
35. Apply phase rule to water system. (HS Gaur BSc, 2002)36. Deduce the phase rule equation on the basis of thermodynamics. (Nagpur BSc, 2003)37. Is it possible to obtain pure ethanol by distillation a mixture of ethanol and water? Explain.
(Kolkata BSc, 2003)38. (a) What is a condensed system? Write the reduced phase rule equation.
(b) Discuss salient features of lead-silver system. (Arunachal BSc, 2003)39. (a) In phase equilibria, what is understood by the number of degrees of freedom and reduced phase
rule.(b) Deduce Gibbs phase rule equation from thermodynamic considerations, making it clear what are
these considerations. (Guru Nanak Dev BSc, 2004)40. Discuss main features of the phase diagram of water system, explaining especially why the slope of
solid-liquid line is negative for water. (Guru Nanak Dev BSc, 2004)41. (a) Explain the terms : component, degree of freedom, eutectic and triple point. Calculate the number
of components, number of phases and degrees of freedom of a liquid at its critical temperature.(b) How do the phase diagram of Kl.H2O and Pb-Ag systems differ from each other?
(Banaras BSc, 2004)42. Write short notes on the following :
(a) Phase rule for condensed systems(b) Functioning of freezing mixtures (Agra BSc, 2004)
43. (a) Derive Gibbs Phase rule thermodynamically.(b) Describe an experimental method for determining a phase diagram of a two-component system.
(Madras BSc, 2004)44. Calculate the degrees of freedom and number of components for a system of sodium chloride solution in
water containing undissolved salt, in equilibrium with water vapour.Answer. 1 and 2 (Baroda BSc, 2005)
45. How many degrees of freedom will be present in a solution of sodium sulphate in equilibrium with watervapour ?Answer. 2 (Madurai BSc, 2005)
46. The vapour pressure of 2,2,4-trimethylpentane at 20.7 ºC and 29.1oC are 40 and 60 torr respectively.Calculate the enthalpy of vaporization of this compound.Answer. 35.6 kJ mol–1 (Delhi BSc, 2006)
47. Determine the number of phases, components and degrees of freedom in the system : Ice, water andvapour in equilibrium.Answer. 3,1 and 0 (Agra BSc, 2006)
727THE PHASE RULE
MULTIPLE CHOICE QUESTIONS
1. The phase rule was first discovered by(a) Nernst (b) Gibbs(c) Arrhenius (d) Le ChatelierAnswer. (b)
2. Mathematically, the phase rule can be expressed by (F is the number of degrees of freedom, C thenumber of components and P is the number of phases of the system)(a) F + P = C + 2 (b) F = C – P + 2(c) P = C – F + 2 (d) all of theseAnswer. (d)
3. A system containing liquid water and water vapour has the number of phases equal to(a) 0 (b) 1(c) 2 (d) 3Answer. (c)
4. A mixture of three gases O2, N2 and CO2 is(a) 1-phase system (b) 2-phase system(c) 3-phase system (d) 4-phase systemAnswer. (a)
5. A mixture of two miscible liquids (ethanol and water) has the number of phases equal to(a) zero (b) one(c) two (d) threeAnswer. (b)
6. A mixture of two immiscible liquids (chloroform and water) constitutes a system having the number ofphases equal to(a) zero (b) one(c) two (d) threeAnswer. (c)
7. Decomposition of calcium carbonate represented by the equation CaCO3(s) CaO(s) + CO2(g) ina closed vessel constitutes a system with number of phases equal to(a) 0 (b) 1(c) 2 (d) 3Answer. (d)
8. A saturated solution of sodium chloride is a(a) one phase system (b) two phase system(c) three phase system (d) none of theseAnswer. (b)
9. Water system has three phases - ice, water and vapours. The number of components in the system is(a) one (b) two(c) three (d) fourAnswer. (a)
10. A mixture of gases O2 and N2 constitutes one phase only. The number of components in the system is(a) zero (b) one(c) two (d) threeAnswer. (c)
11. The decomposition of CaCO3 in a closed vessel is represented by the equationCaCO3(s) CaO(s) + CO2(g)
728 1919191919 PHYSICAL CHEMISTRY
The number of phases and components respectively are(a) 2 and 3 (b) 3 and 2(c) 2 and 2 (d) 3 and 3Answer. (b)
12. A saturated solution of sodium chloride in contact with solid solute has the phases and componentsequal to(a) 2 and 2 (b) 2 and 3(c) 3 and 2 (d) 3 and 3Answer. (a)
13. The total number of variable factors which must be specified so that the remaining variables are fixedautomatically and the system is completely defined. It is known as(a) a phase (b) a component(c) degrees of freedom (d) none of theseAnswer. (c)
14. For a pure gas and mixture of gases, the degrees of freedom are(a) 2 and 2 (b) 2 and 3(c) 3 and 2 (d) 3 and 3Answer. (b)
15. A saturated solution of NaCl in water has degrees of freedom equal to(a) one (b) two(c) three (d) fourAnswer. (a)
16. For one component system the phase rule is(a) F = 3 – P (b) F = 2 – P(c) F = 1 – P (d) none of theseAnswer. (a)
17. The vapour pressure of the metastable phase is always _______ than that of the stable phase at thesame temperature(a) lower (b) higher(c) constant (d) none of theseAnswer. (b)
18. At a triple point(a) both the temperature and pressure are fixed(b) only the temperature is fixed(c) only the pressure is fixed(d) sometimes pressure and sometime temperature is fixedAnswer. (a)
19. The occurrence of the same substance in more than one crystalline forms is known as(a) isomerism (b) racemisation(c) polymorphism (d) none of theseAnswer. (c)
20. The temperature at which a polymorphic substance changes from one form to another is called(a) equilibrium temperature (b) triple point(c) Boyle’s temperature (d) transition temperatureAnswer. (d)
21. For one phase and one component system, the degrees of freedom are equal to(a) 1 (b) 2(c) 3 (d) 4Answer. (b)
729THE PHASE RULE
22. When a single phase is present in a two component system, the degree of freedom is(a) zero (b) one(c) two (d) threeAnswer. (d)
23. The number of components present in the following systems(i) Water Water vapour(ii) KCl + Water KCl hydrate(a) 1 and 1 (b) 1 and 2(c) 2 and 1 (d) 2 and 3Answer. (b)
24. The decomposition of NH4Cl is represented by the equationNH4Cl(s) NH3(g) + HCl(g)The number of components present in the system is(a) 0 (b) 1(c) 2 (d) 3Answer. (d)
25. The number of components in a solution of common salt is(a) 0 (b) 1(c) 2 (d) 3Answer. (c)
26. A drop of water is placed in a stoppered bottle. How many phases are present in the system?(a) 0 (b) 1(c) 2 (d) 3Answer. (c)
27. A piece of molten ice is placed in a beaker covered with a water glass. How many phases are present inthe system?(a) 0 (b) 1(c) 2 (d) 3Answer. (c)
28. A system with zero-degree of freedom is known as(a) monovariant (b) bivariant(c) invariant (d) none of theseAnswer. (c)
29. For a three phase system with one component, the degree of freedom according to phase rule is(a) 0 (b) 1(c) 2 (d) 3Answer. (a)
30. The transition temperature of a substance is that temperature at which(a) one enantiomer changes into another enantiomer(b) one allotropic form changes to another(c) all the three phases (solid, liquid and gas) can co-exist in equilibrium(d) none of the aboveAnswer. (b)
31. A dilatometer is an apparatus used to measure(a) transition temperature (b) triple point(c) eutectic point (d) all of theseAnswer. (a)
32. The reduced phase rule for a condensed system is
730 1919191919 PHYSICAL CHEMISTRY
(a) F = C – P + 2 (b) F′ = C – P + 1(c) F′ = C – P (d) F = C – P + 3Answer. (b)
33. The phase rule is applicable to(a) homogenous systems(b) reversible systems(c) irreversible systems(d) heterogeneous system whether physical or chemicalAnswer. (d)
34. At a triple point(a) three phases co-exist in equilibrium(b) the vapour pressure is equal to the atmospheric pressure(c) there are three components in equilibrium(d) there are three degrees of freedomAnswer. (a)
35. For one component system, at triple point the number of degrees of freedom is(a) zero (b) one(c) two (d) threeAnswer. (a)
36. For one component system, there does not exist a quadruple point as the number of degrees of freedomcannot be(a) zero (b) –1(c) 1 (d) 2Answer. (b)
37. The sulphur system has four phases: rhombic, monoclinic, liquid and vapour sulphur. It is(a) one-component system (b) two-component system(c) three-component system (d) four-component systemAnswer. (a)
38. Which one of the following is not a heterogenous system?(a) CaCO3(s) CaO(s) + CO2(g) (b) Water vapour Water(c) NH4Cl(s) NH3(g) + HCl(g) (d) H2 + I2 2HIAnswer. (d)
39. For a bivariant system, the degrees of freedom are(a) one (b) two(c) three (d) fourAnswer. (c)
40. A saturated solution of NaCl has one degree of freedom. It is(a) monovariant (b) non-variant(c) bi-variant (d) none of theseAnswer. (a)
41. For a two component system in a single phase, the degree of freedom is(a) zero (b) one(c) two (d) threeAnswer. (d)
42. A one component system has four phases. Can the four phases co-exist in equilibrium?(a) no (b) yes(c) sometimes (d) none of theseAnswer. (a).