contents · web view6,280. 6,510. new investment resulting from government facilitation services...
TRANSCRIPT
Contents
Contents............................................................................................................................................................................................. 1Portfolio performance reporting – non-financial....................................................................................................................................2
Changes to the department during 2017–18.....................................................................................................................................2
Reporting progress towards achieving departmental objectives in the report of operations.................................................................3
Objective 1...................................................................................................................................................................................... 3
Progress towards achieving this objective.........................................................................................................................................3
Additional comments on Resources Output Performance Measures...............................................................................................14
Objective 2.................................................................................................................................................................................... 16
Progress towards achieving this objective.......................................................................................................................................16
Objective 3.................................................................................................................................................................................... 26
Progress towards achieving this objective.......................................................................................................................................27
Objective 4.................................................................................................................................................................................... 38
Progress towards achieving departmental objectives......................................................................................................................38
1
Document titleSub title
Portfolio performance reporting – non-financialThe portfolio performance reporting – non-financial section includes the:
report on progress towards achieving objectives
report on performance against output performance measures.
Changes to the department during 2017–18The objectives, objective indicators and outputs for the department were reviewed and updated to reflect a change to the department’s priorities.
The department has made changes to its objectives for 2017–18 as shown in the table below:
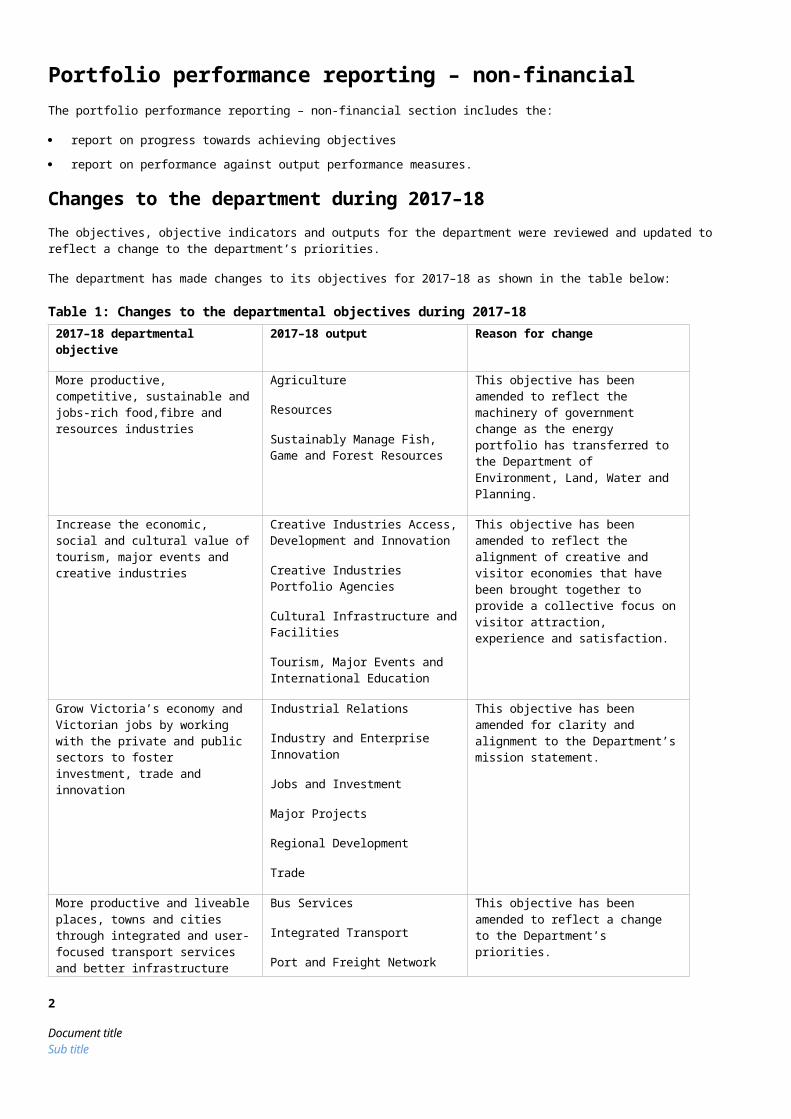
Table 1: Changes to the departmental objectives during 2017–182017–18 departmental objective 2017–18 output Reason for change
More productive, competitive, sustainable and jobs-rich food,fibre and resources industries
Agriculture
Resources
Sustainably Manage Fish, Game and Forest Resources
This objective has been amended to reflect the machinery of government change as the energy portfolio has transferred to the Department of Environment, Land, Water and Planning.
Increase the economic, social and cultural value of tourism, major events and creative industries
Creative Industries Access, Development and Innovation
Creative Industries Portfolio Agencies
Cultural Infrastructure and Facilities
Tourism, Major Events and International Education
This objective has been amended to reflect the alignment of creative and visitor economies that have been brought together to provide a collective focus on visitor attraction, experience and satisfaction.
Grow Victoria’s economy and Victorian jobs by working with the private and public sectors to foster investment, trade and innovation
Industrial Relations
Industry and Enterprise Innovation
Jobs and Investment
Major Projects
Regional Development
Trade
This objective has been amended for clarity and alignment to the Department’s mission statement.
More productive and liveable places, towns and cities through integrated and user-focused transport services and better infrastructure
Bus Services
Integrated Transport
Port and Freight Network Access
Road Asset Management
Road Operations and Network Improvements
Taxi and Hire Vehicle Services
Train Services
Tram Services
Transport Safety, Security and
This objective has been amended to reflect a change to the Department’s priorities.
2
Document titleSub title
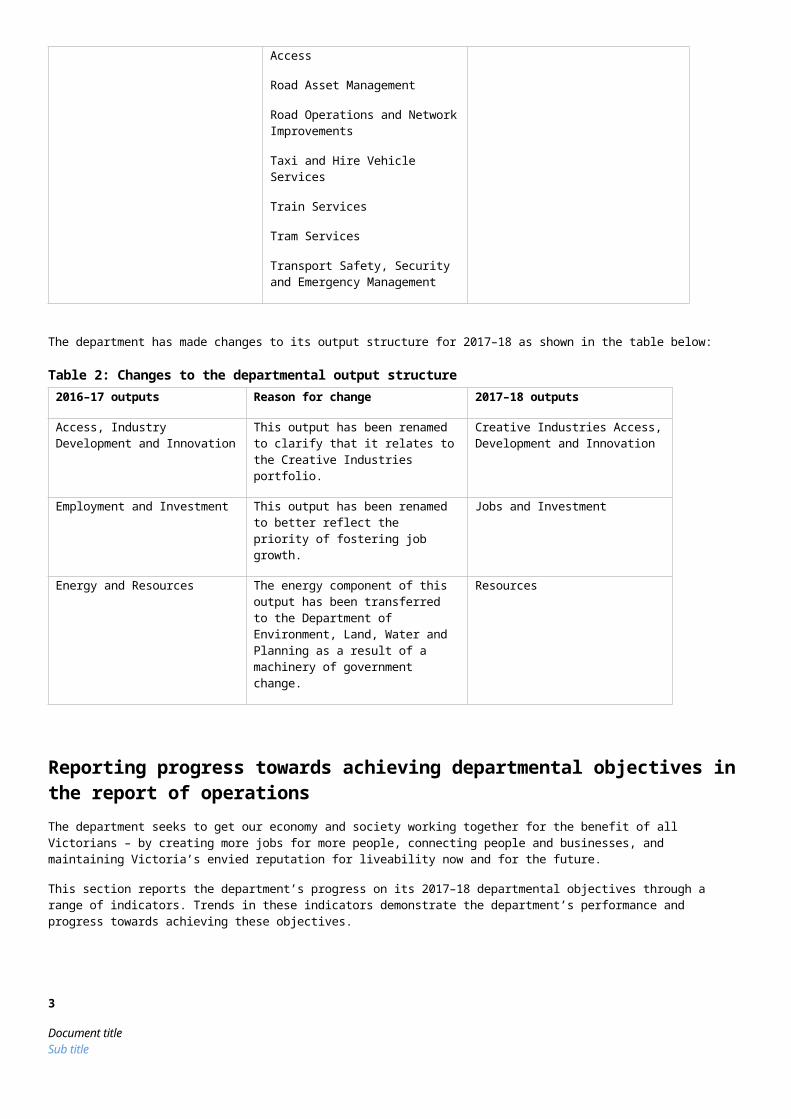
Emergency Management
The department has made changes to its output structure for 2017–18 as shown in the table below:
Table 2: Changes to the departmental output structure2016–17 outputs Reason for change 2017–18 outputs
Access, Industry Development and Innovation
This output has been renamed to clarify that it relates to the Creative Industries portfolio.
Creative Industries Access, Development and Innovation
Employment and Investment This output has been renamed to better reflect the priority of fostering job growth.
Jobs and Investment
Energy and Resources The energy component of this output has been transferred to the Department of Environment, Land, Water and Planning as a result of a machinery of government change.
Resources
Reporting progress towards achieving departmental objectives in the report of operationsThe department seeks to get our economy and society working together for the benefit of all Victorians – by creating more jobs for more people, connecting people and businesses, and maintaining Victoria’s envied reputation for liveability now and for the future.
This section reports the department’s progress on its 2017–18 departmental objectives through a range of indicators. Trends in these indicators demonstrate the department’s performance and progress towards achieving these objectives.
Objective 1 More productive, competitive, sustainable and jobs-rich food, fibre and resources industries
The department seeks to create the conditions for and support increased employment, investment and trade in the food, fibre and resources sectors by delivering policy, regulation, research, development and extension programs as well as emergency management.
Progress towards achieving this objectiveIn 2017–18, the department reported progress against this objective using the following objective indicators and outputs:
Objective Indicators Value of Victorian food and fibre exports
Value of Victorian agriculture production
Percentage of assessed fish stocks that are fished sustainably
Annual number of metres drilled for minerals exploration in Victoria
Annual level of production of minerals and extractives
Outputs Agriculture
Resources
Sustainably Manage Fish, Game and Forest Resources
3
Document titleSub title
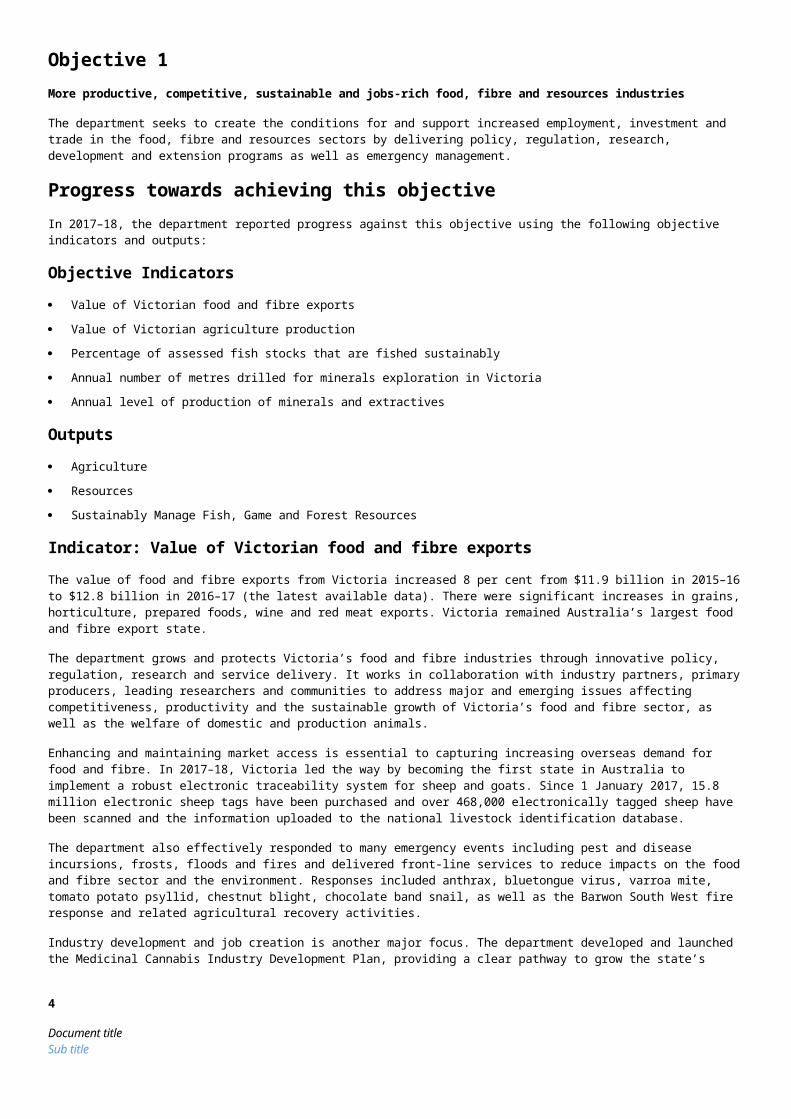
Indicator: Value of Victorian food and fibre exportsThe value of food and fibre exports from Victoria increased 8 per cent from $11.9 billion in 2015–16 to $12.8 billion in 2016–17 (the latest available data). There were significant increases in grains, horticulture, prepared foods, wine and red meat exports. Victoria remained Australia’s largest food and fibre export state.
The department grows and protects Victoria’s food and fibre industries through innovative policy, regulation, research and service delivery. It works in collaboration with industry partners, primary producers, leading researchers and communities to address major and emerging issues affecting competitiveness, productivity and the sustainable growth of Victoria’s food and fibre sector, as well as the welfare of domestic and production animals.
Enhancing and maintaining market access is essential to capturing increasing overseas demand for food and fibre. In 2017–18, Victoria led the way by becoming the first state in Australia to implement a robust electronic traceability system for sheep and goats. Since 1 January 2017, 15.8 million electronic sheep tags have been purchased and over 468,000 electronically tagged sheep have been scanned and the information uploaded to the national livestock identification database.
The department also effectively responded to many emergency events including pest and disease incursions, frosts, floods and fires and delivered front-line services to reduce impacts on the food and fibre sector and the environment. Responses included anthrax, bluetongue virus, varroa mite, tomato potato psyllid, chestnut blight, chocolate band snail, as well as the Barwon South West fire response and related agricultural recovery activities.
Industry development and job creation is another major focus. The department developed and launched the Medicinal Cannabis Industry Development Plan, providing a clear pathway to grow the state’s emerging medicinal cannabis industry. Thanks to a collaborative approach across Agriculture Victoria, Invest Victoria and Invest Assist, Victoria is leading Australia in establishing this new industry, including securing the world’s largest medicinal cannabis company, Canopy Growth Corporation, to set up their Asia-Pacific headquarters in Victoria.
The Victorian Government also announced new animal industries planning reforms to balance industry growth, environmental protection and community amenity. The reforms introduce new land use definitions and associated planning controls for animal industries into the Victoria Planning Provisions and all local planning schemes in Victoria. This clarifies land use planning regulation, allows farmers more flexibility to manage their farms and facilitates risk-based assessment of planning permit applications.
DEDJTR’s aim of creating and diffusing knowledge through research, collaboration and commercialisation was enhanced through the establishment of the DairyBio and DairyFeedbase innovation partnerships as joint ventures between Agriculture Victoria and the Australian dairy industry. These initiatives attract $100 million of investment over five years delivering high impact research for improved animal and plant breeding, animal nutrition and feedbase productivity.
Animal Welfare Victoria was established and is implementing Victoria’s first ever Animal Welfare Action Plan. The welfare of domestic animals was improved through delivery of the Domestic Animals Amendment (Puppy Farm and Pet Shops) Act 2017 and the Code of Practice for the Keeping of Racing Greyhounds.
Figure 1: Food and fibre exports from Victoria
Table 3 Value of Victorian food and fibre exports
4
Document titleSub title

Measure (unit of measure) 2014–15 2015–16 2016–17 2017–18
Food and fibre exports from Victoria ($ billion) 12.1 11.9 12.8 Data available in October 2018
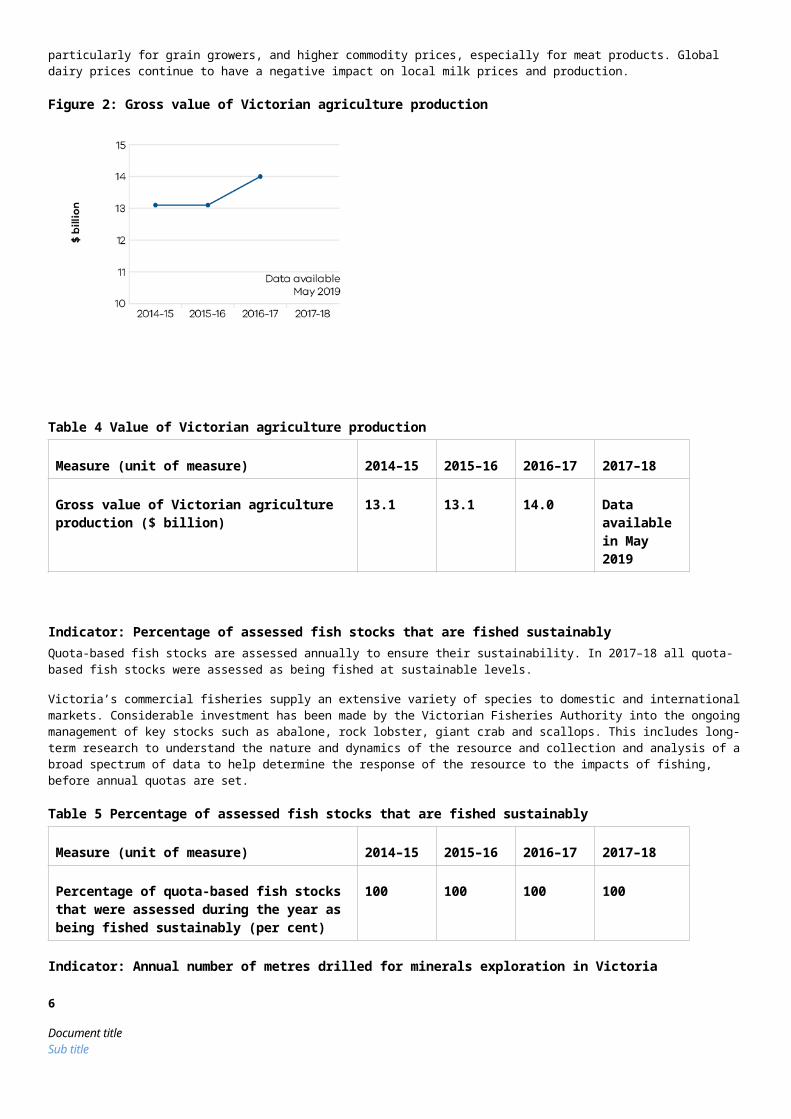
Indicator: Value of Victorian agriculture productionThe value of Victorian agriculture production increased 7 per cent from $13.1 billion in 2015–16 to $14.0 billion in 2016–17 (the latest available data). This was driven by better seasonal conditions, particularly for grain growers, and higher commodity prices, especially for meat products. Global dairy prices continue to have a negative impact on local milk prices and production.
Figure 2: Gross value of Victorian agriculture production
Table 4 Value of Victorian agriculture production
Measure (unit of measure) 2014–15 2015–16 2016–17 2017–18
Gross value of Victorian agriculture production ($ billion)
13.1 13.1 14.0 Data available in May 2019
Indicator: Percentage of assessed fish stocks that are fished sustainablyQuota-based fish stocks are assessed annually to ensure their sustainability. In 2017–18 all quota-based fish stocks were assessed as being fished at sustainable levels.
Victoria’s commercial fisheries supply an extensive variety of species to domestic and international markets. Considerable investment has been made by the Victorian Fisheries Authority into the ongoing management of key stocks such as abalone, rock lobster, giant crab and scallops. This includes long-term research to understand the nature and dynamics of the resource and collection and analysis of a broad spectrum of data to help determine the response of the resource to the impacts of fishing, before annual quotas are set.
Table 5 Percentage of assessed fish stocks that are fished sustainably
Measure (unit of measure) 2014–15 2015–16 2016–17 2017–18
Percentage of quota-based fish stocks that were assessed during the year as being fished
100 100 100 100
5
Document titleSub title
sustainably (per cent)
Indicator: Annual number of metres drilled for minerals exploration in VictoriaThere were 191,658 metres drilled in Victoria’s resources sector for minerals exploration in 2016–17 (the latest available data). This was a 30 per cent increase from the previous year mainly driven by continued successful drilling activity at the Fosterville gold mine.
Exploration success at the Fosterville gold mine is driving increased production with 263,845 ounces produced in 2017. This is more than double the production level of 2015 (123,095 ounces).
Figure 3: Annual number of metres drilled for minerals exploration in Victoria
Table 6 Annual number of metres drilled for minerals exploration in Victoria
Measure (unit of measure) 2014–15 2015–16 2016–17 2017–18
Annual number of metres drilled for minerals exploration in Victoria (metres)
87,321 147,167 191,658 Data available November 2018
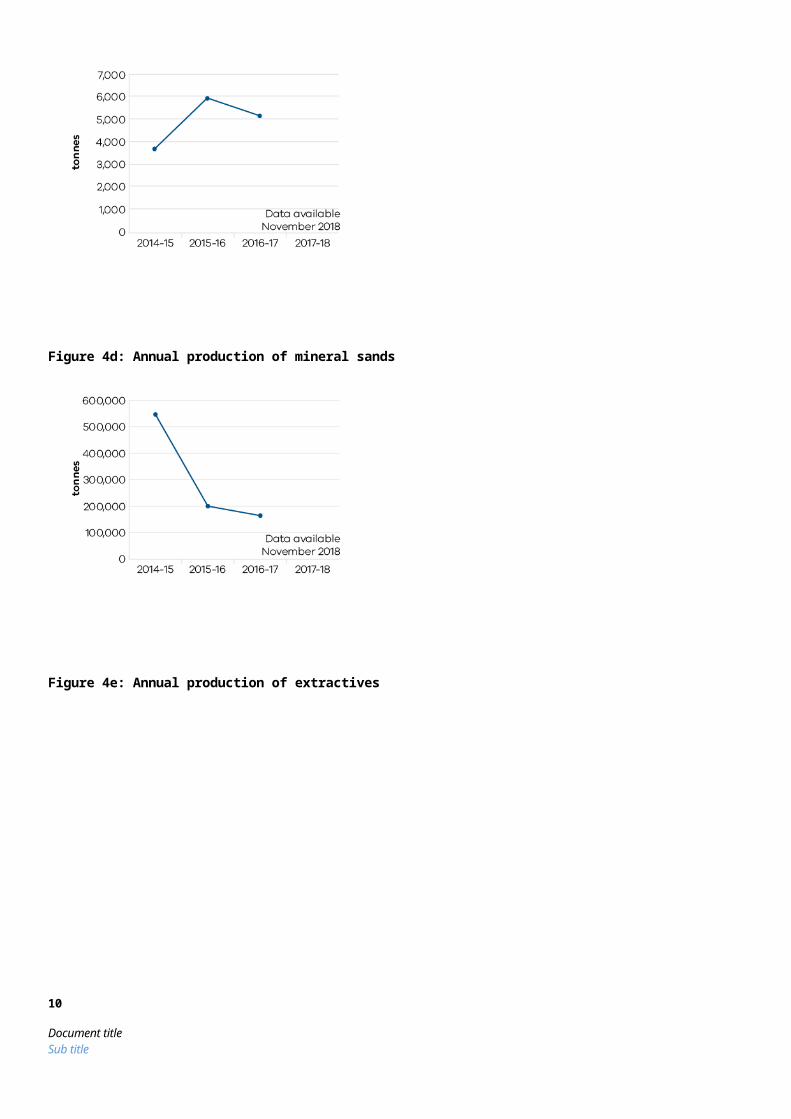
Indicator: Annual level of production of minerals and extractives Overall gold production in Victoria during 2016–17 (latest available data) was 329,452 ounces compared to 256,653 ounces in the previous year. Production for extractives (sand, stone, and gravel) in 2016–17 (latest available data) was 57 million tonnes, up 21 per cent from 2015–16 due to higher demand for new housing and infrastructure development in Victoria. The level of mineral sands production (164,353 tonnes in 2016–17 (latest available data)) is lower, reflecting the exhaustion of Iluka Resources mines at Douglas and Ouyen in western Victoria. Brown coal production at 56 million tonnes in 2016–17 (latest available data) was 6 per cent lower than the previous year due mainly to lower production following the closure of the Hazelwood coal mine on 31 March 2017.
To attract new exploration investment to Victoria, the Minister for Resources launched a new tender for 11 exploration blocks (covering a 9,500-square kilometre area) on 22 June 2018. This forms part of the Stavely minerals initiative in western Victoria and is supported by a community engagement program and new geological information. The tenders closed on 15 August 2018. This program is supported by the TARGET co-funded exploration grants program with grants of up to $500,000 per block available.
On 15 June 2018, the Helping Victoria Grow: Extractive Resources Strategy was released. The strategy is focused on ensuring high quality extractive resources continue to be available at a competitive price to support Victoria’s growth. This follows on from the launch of two pilot projects on 9 February 2018 in the Wyndham and South Gippsland local government areas. The pilot projects, partnering with local councils and Department of Environment, Land, Water and Planning (DELWP), aim to better define strategically important extractive resource areas and apply suitable planning provisions to secure these areas. With the demand for extractive resources expected to double by 2050, the protection of key resources is vital for supporting infrastructure development in Victoria.
The Victorian Gas Program is progressing, including the delivery of the first Progress Report on 12 January 2018 (highlighting an initial analysis of Victoria’s onshore conventional gas resources) and the release on 16 May 2018 of five new oil and gas exploration blocks
6
Document titleSub title

located in the offshore Otway Basin in western Victoria. Other activities associated with this science program include finalising collaborative research agreements with the CSIRO as part of the underground gas storage work stream, commissioning a $1 million contract to develop a new 3D geological model of the Gippsland Basin, and continuing to engage with local communities and stakeholders to provide information about the risks, effects and potential benefits of onshore conventional gas exploration and development.
The CarbonNet project, funded by the Victorian and Commonwealth governments, is investigating the development of a commercial scale carbon capture and storage network in the Gippsland Basin. As part of this project a marine seismic survey was completed in February 2018. The information from this survey will inform the next phase of the project. The CarbonNet project provides a pathway for low emission products such as hydrogen produced from coal. The Hydrogen Energy Supply Chain Pilot Demonstration Project, a world first, was launched on 12 April 2018 and has the potential to generate new jobs and attract investment to the Latrobe Valley.
In December 2017, the Commissioner for Better Regulation released a report into the earth resources regulator – Getting the Groundwork Right. Since the release of the report, the Department has progressed key actions to improve regulation of earth resources including actions for reducing the backlog of regulatory approvals. The 2018–19 Budget allocated $12.7 million for improving earth resources regulation to address the recommendations within the report by the Commissioner for Better Regulation over the next two years. An Implementation Plan (Getting the Groundwork Right: Implementation Plan) was released on 3 May 2018. Key priorities include speeding up approvals for quarries in the extractives sector for low risk projects, developing improved guidance materials, working with DELWP to improve the interface with planning, and developing standard risk management plans.
Table 7 Annual level of production of minerals and extractives
Measure (unit of measure) 2014–15 2015–16 2016–17 2017–18
Annual production of brown coal (1,000 tonnes) 60,957 59,757 56,095 Data available November 2018
Annual production of gold (ounces) 198,387 256,653 329,452 Data available November 2018
Annual production of antimony (tonnes) 3,684 5,945 5,138 Data available November 2018
Annual production of mineral sands (tonnes) 546,514 200,107 164,353 Data available November 2018
Annual production of extractives (million tonnes)
50.0 47.3 57.4 Data available November 2018
Figure 4a: Annual production of brown coal
7
Document titleSub title
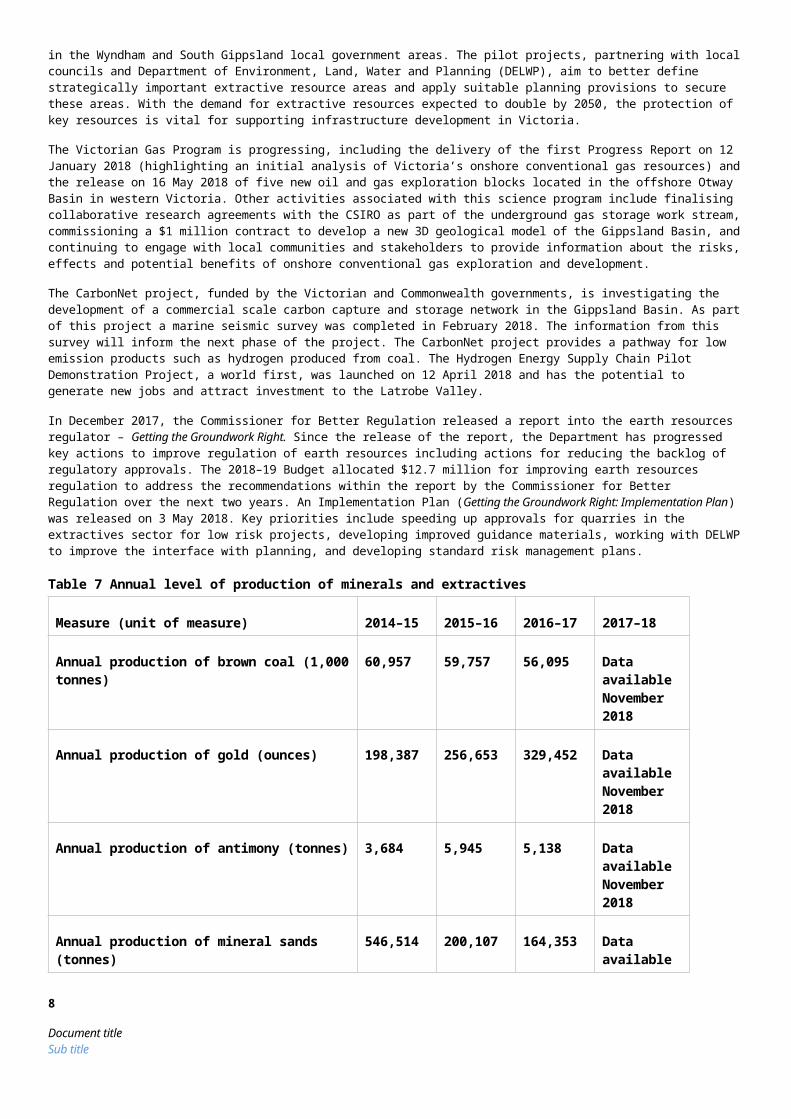
Figure 4b: Annual production of gold
Figure 4c: Annual production of antimony
8
Document titleSub title
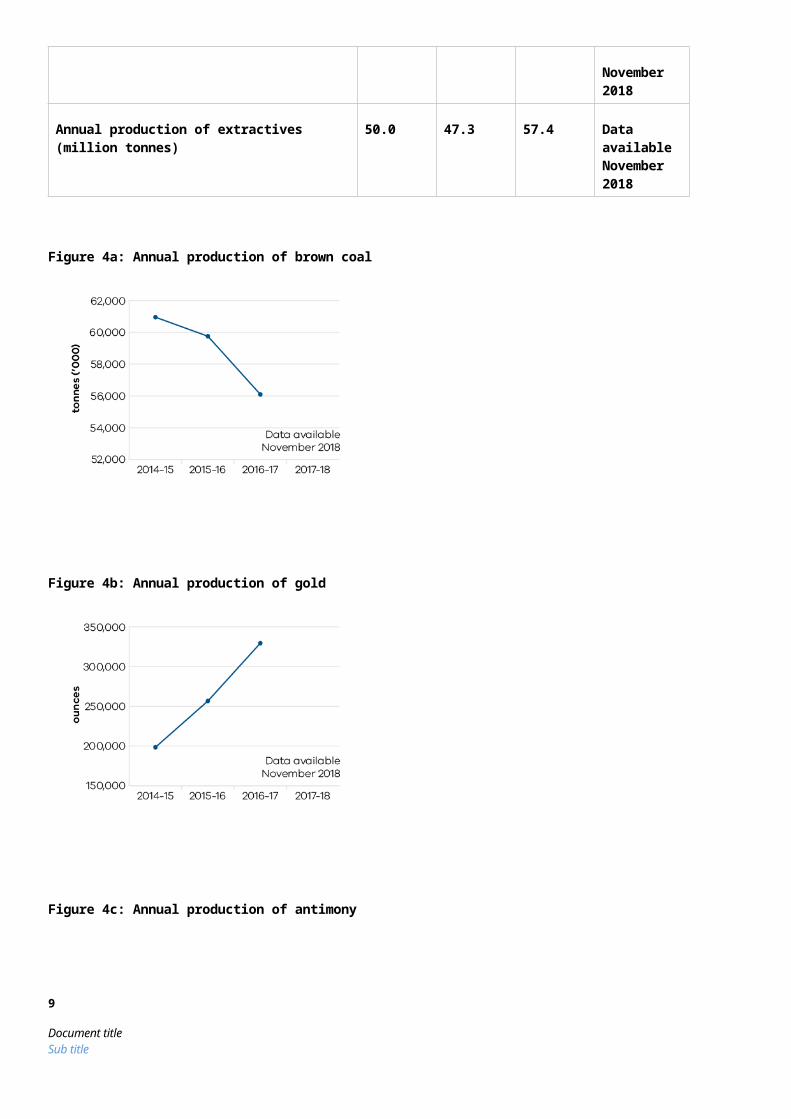
Figure 4d: Annual production of mineral sands
Figure 4e: Annual production of extractives
Performance against output performance measures
Table 8 represents performance against the Agriculture output. This output delivers effective and efficient regulation, compliance, emergency management, biosecurity research and development, and diagnostic services to protect and enhance market access by addressing trade barriers and managing the risks of pests, diseases and chemical use.
The department undertakes research and development to develop new technologies and practices and provides services to enhance their adoption to increase farm productivity and supply chain efficiencies. The department also provides policy advice and support to help industries and businesses manage economic and climatic volatility, natural disasters and biosecurity emergencies, and meet consumer and community expectations for animal welfare, food safety and environmental standards.
Table 8 Output: AgriculturePerformance measures Unit of
measure2017–18 actual
2017–18 target
Performance variation (%)
Result
QUANTITY
9
Document titleSub title
Animal pest, disease and residue control programs maintained to ensure Victorian agricultural produce complies with food safety and biosecurity standards required to access markets
number 5 5 0.0
Applications for intellectual property protection number 16 16 0.0
Client interactions with land health services number 1,742 1,700 2.5
Clients engaged with agriculture productivity services number 4,638 3,910 18.6
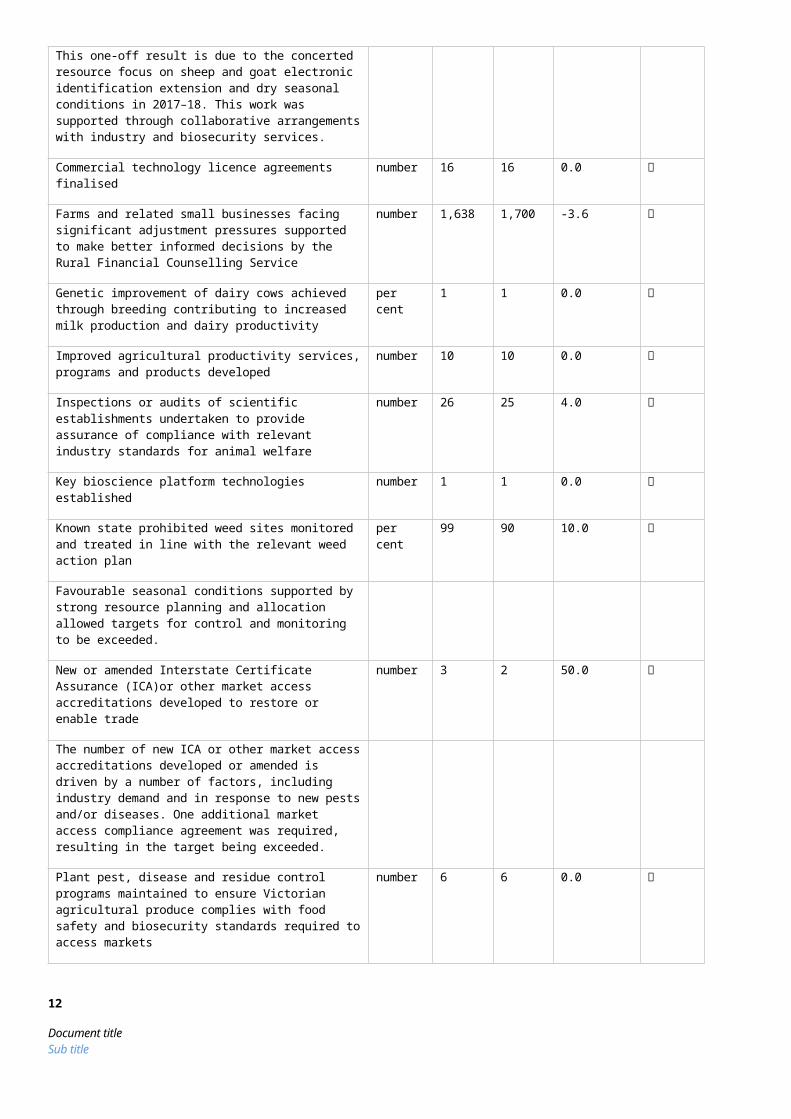
This one-off result is due to the concerted resource focus on sheep and goat electronic identification extension and dry seasonal conditions in 2017–18. This work was supported through collaborative arrangements with industry and biosecurity services.
Commercial technology licence agreements finalised number 16 16 0.0
Farms and related small businesses facing significant adjustment pressures supported to make better informed decisions by the Rural Financial Counselling Service
number 1,638 1,700 -3.6
Genetic improvement of dairy cows achieved through breeding contributing to increased milk production and dairy productivity
per cent 1 1 0.0
Improved agricultural productivity services, programs and products developed
number 10 10 0.0
Inspections or audits of scientific establishments undertaken to provide assurance of compliance with relevant industry standards for animal welfare
number 26 25 4.0
Key bioscience platform technologies established number 1 1 0.0
Known state prohibited weed sites monitored and treated in line with the relevant weed action plan
per cent 99 90 10.0
Favourable seasonal conditions supported by strong resource planning and allocation allowed targets for control and monitoring to be exceeded.
New or amended Interstate Certificate Assurance (ICA)or other market access accreditations developed to restore or enable trade
number 3 2 50.0
The number of new ICA or other market access accreditations developed or amended is driven by a number of factors, including industry demand and in response to new pests and/or diseases. One additional market access compliance agreement was required, resulting in the target being exceeded.
Plant pest, disease and residue control programs maintained to ensure Victorian agricultural produce complies with food safety and biosecurity standards required to access markets
number 6 6 0.0
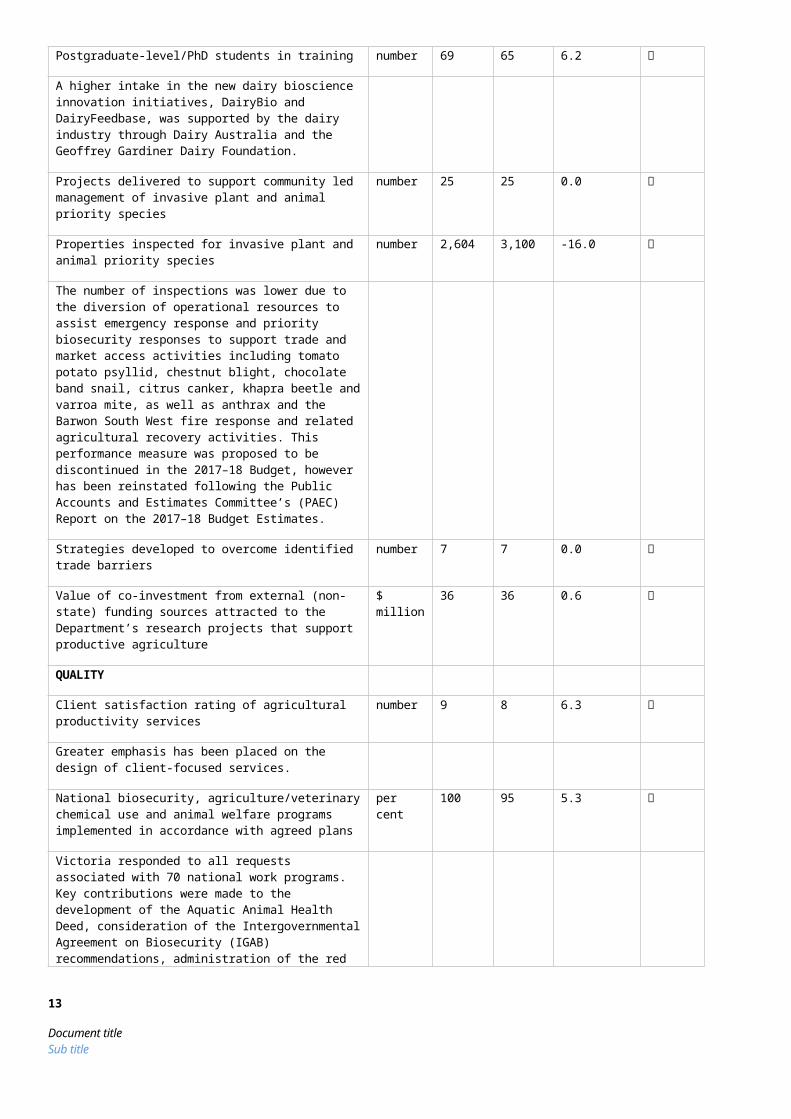
Postgraduate-level/PhD students in training number 69 65 6.2
A higher intake in the new dairy bioscience innovation initiatives, DairyBio and DairyFeedbase, was supported by the dairy industry through Dairy Australia and the Geoffrey Gardiner Dairy Foundation.
10
Document titleSub title

Projects delivered to support community led management of invasive plant and animal priority species
number 25 25 0.0
Properties inspected for invasive plant and animal priority species
number 2,604 3,100 -16.0
The number of inspections was lower due to the diversion of operational resources to assist emergency response and priority biosecurity responses to support trade and market access activities including tomato potato psyllid, chestnut blight, chocolate band snail, citrus canker, khapra beetle and varroa mite, as well as anthrax and the Barwon South West fire response and related agricultural recovery activities. This performance measure was proposed to be discontinued in the 2017–18 Budget, however has been reinstated following the Public Accounts and Estimates Committee’s (PAEC) Report on the 2017–18 Budget Estimates.
Strategies developed to overcome identified trade barriers number 7 7 0.0
Value of co-investment from external (non-state) funding sources attracted to the Department’s research projects that support productive agriculture
$ million 36 36 0.6
QUALITY
Client satisfaction rating of agricultural productivity services number 9 8 6.3
Greater emphasis has been placed on the design of client-focused services.
National biosecurity, agriculture/veterinary chemical use and animal welfare programs implemented in accordance with agreed plans
per cent 100 95 5.3
Victoria responded to all requests associated with 70 national work programs. Key contributions were made to the development of the Aquatic Animal Health Deed, consideration of the Intergovernmental Agreement on Biosecurity (IGAB) recommendations, administration of the red imported fire ant, fruit fly and tomato potato psyllid responses and Australia’s traceability system.
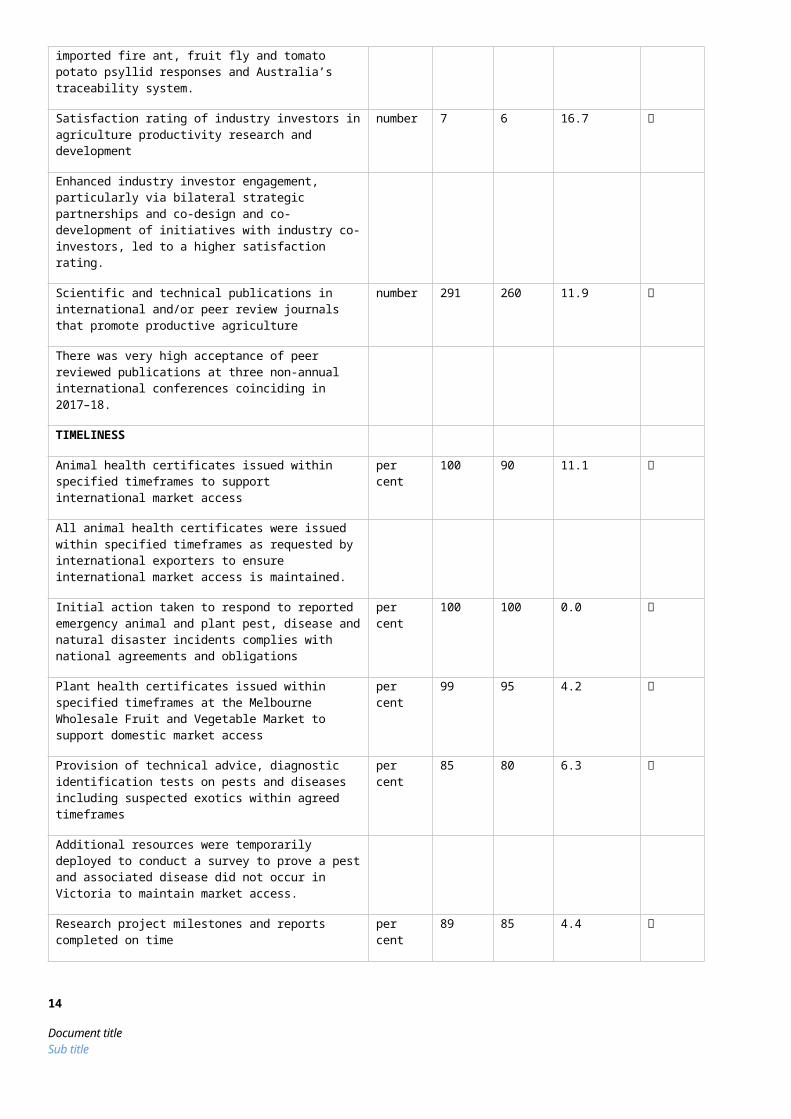
Satisfaction rating of industry investors in agriculture productivity research and development
number 7 6 16.7
Enhanced industry investor engagement, particularly via bilateral strategic partnerships and co-design and co-development of initiatives with industry co-investors, led to a higher satisfaction rating.
Scientific and technical publications in international and/or peer review journals that promote productive agriculture
number 291 260 11.9
There was very high acceptance of peer reviewed publications at three non-annual international conferences coinciding in 2017–18.
TIMELINESS
Animal health certificates issued within specified timeframes to support international market access
per cent 100 90 11.1
All animal health certificates were issued within specified timeframes as requested by international exporters to ensure international market access is maintained.
Initial action taken to respond to reported emergency animal per cent 100 100 0.0
11
Document titleSub title
and plant pest, disease and natural disaster incidents complies with national agreements and obligations
Plant health certificates issued within specified timeframes at the Melbourne Wholesale Fruit and Vegetable Market to support domestic market access
per cent 99 95 4.2
Provision of technical advice, diagnostic identification tests on pests and diseases including suspected exotics within agreed timeframes
per cent 85 80 6.3
Additional resources were temporarily deployed to conduct a survey to prove a pest and associated disease did not occur in Victoria to maintain market access.
Research project milestones and reports completed on time per cent 89 85 4.4
COST
Total output cost $ million 374.9 401.3 -6.6
The 2017–18 result was lower than budget primarily due to a rephase in the Agriculture Infrastructure and Jobs Fund (AIJF).
Note: Performance target achieved or exceeded Performance target not achieved – within 5 per cent variance Performance target not achieved – exceeds 5 per cent variance
Table 9 represents performance against the Resources output. This output develops and delivers policy, programs and regulation to enable investment and generate jobs through the sustainable development of the state’s earth resources, including extractives, minerals and petroleum.
The department acquires and provides access to high-quality geoscience data and knowledge to inform government decision making and attract new investment and jobs to the state. It develops and implements legislative and regulatory reforms in the earth resources sector to improve outcomes for all stakeholders.
Supporting investment in resources and low emission technologies, the department fosters innovation, productivity, jobs and trade in the State’s earth resources sector. Through strategic resource and related land use planning, new opportunities are able to be identified for Victoria’s earth resources, along with supporting major infrastructure development in the state.
The department also regulates the earth resources sector through transparent, consistent and timely regulatory processes that provide industry with confidence to invest and have regard to the needs of communities and minimise impacts to the environment.
Table 9 Output: ResourcesPerformance measures Unit of
measure2017–18 actual
2017–18 target
Performance variation (%)
Result
QUANTITY
Community and stakeholder engagement information forums
number 72 40 80.0
Key resources programs increased the number of information forums held during 2017–18 due to increased demand by local communities and stakeholders for information and consultation.
12
Document titleSub title
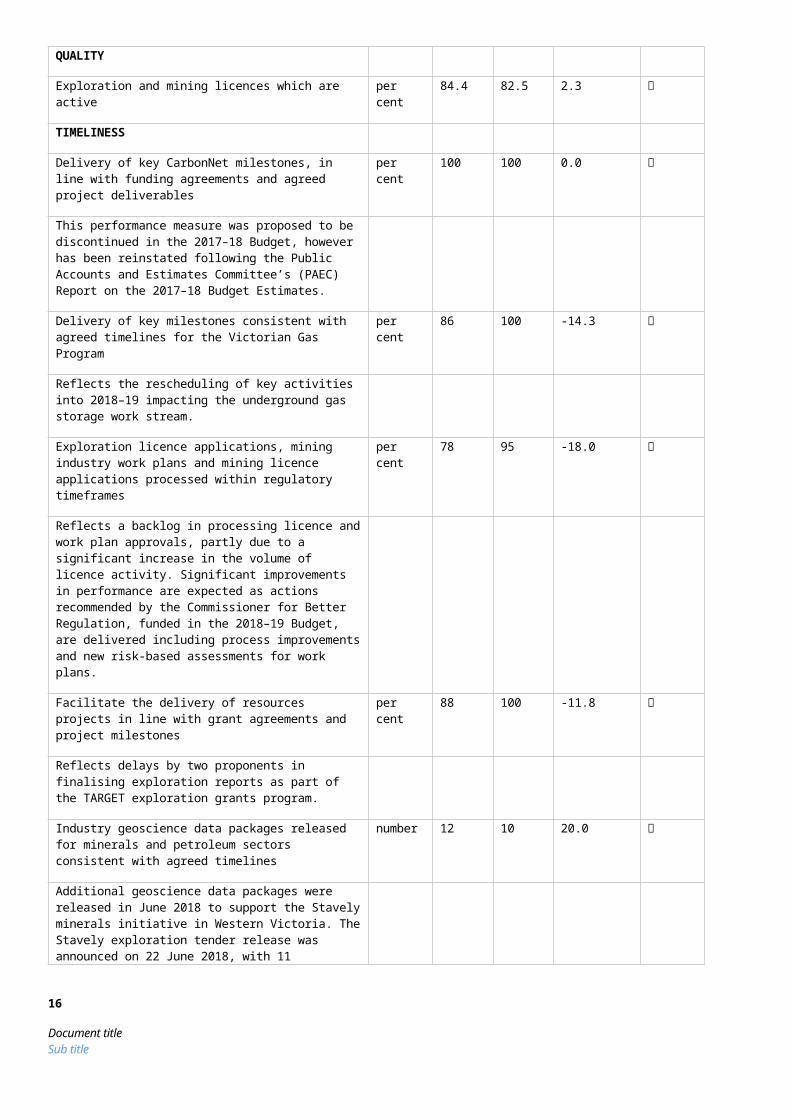
QUALITY
Exploration and mining licences which are active per cent 84.4 82.5 2.3
TIMELINESS
Delivery of key CarbonNet milestones, in line with funding agreements and agreed project deliverables
per cent 100 100 0.0
This performance measure was proposed to be discontinued in the 2017–18 Budget, however has been reinstated following the Public Accounts and Estimates Committee’s (PAEC) Report on the 2017–18 Budget Estimates.
Delivery of key milestones consistent with agreed timelines for the Victorian Gas Program
per cent 86 100 -14.3
Reflects the rescheduling of key activities into 2018–19 impacting the underground gas storage work stream.
Exploration licence applications, mining industry work plans and mining licence applications processed within regulatory timeframes
per cent 78 95 -18.0
Reflects a backlog in processing licence and work plan approvals, partly due to a significant increase in the volume of licence activity. Significant improvements in performance are expected as actions recommended by the Commissioner for Better Regulation, funded in the 2018–19 Budget, are delivered including process improvements and new risk-based assessments for work plans.
Facilitate the delivery of resources projects in line with grant agreements and project milestones
per cent 88 100 -11.8
Reflects delays by two proponents in finalising exploration reports as part of the TARGET exploration grants program.
Industry geoscience data packages released for minerals and petroleum sectors consistent with agreed timelines
number 12 10 20.0
Additional geoscience data packages were released in June 2018 to support the Stavely minerals initiative in Western Victoria. The Stavely exploration tender release was announced on 22 June 2018, with 11 exploration blocks made available.
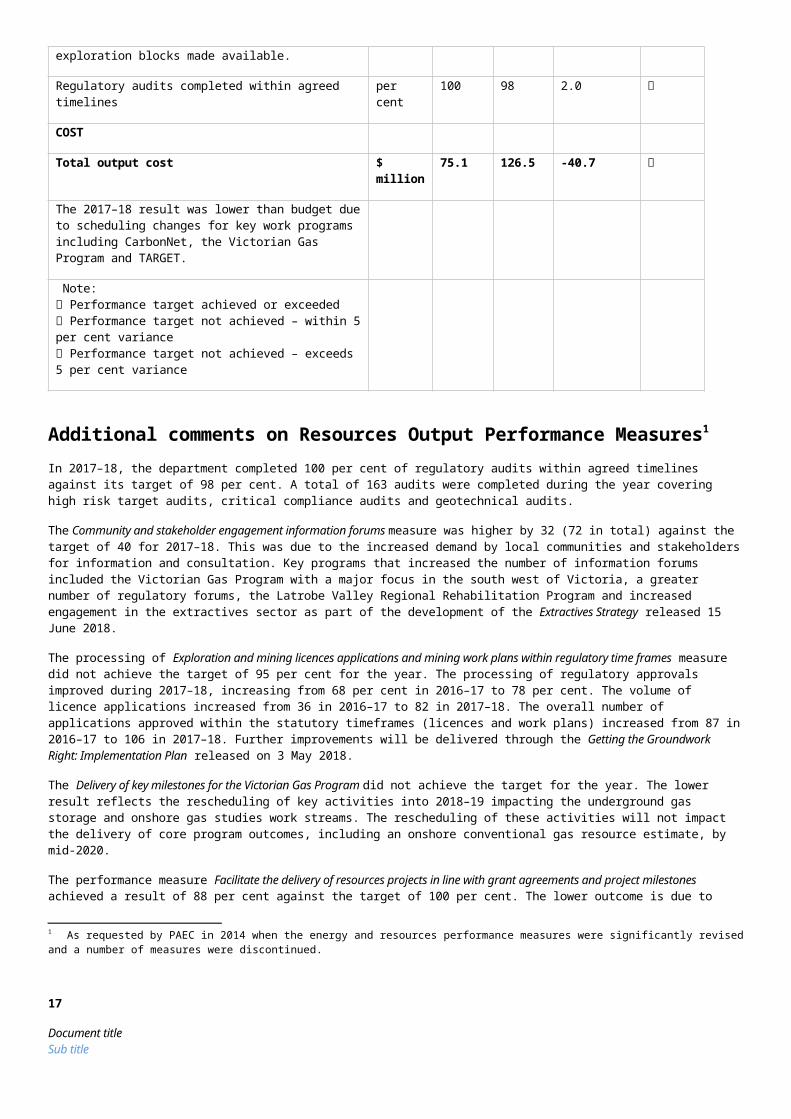
Regulatory audits completed within agreed timelines per cent 100 98 2.0
COST
Total output cost $ million 75.1 126.5 -40.7
The 2017–18 result was lower than budget due to scheduling changes for key work programs including CarbonNet, the Victorian Gas Program and TARGET.
Note: Performance target achieved or exceeded Performance target not achieved – within 5 per cent variance Performance target not achieved – exceeds 5 per cent variance
13
Document titleSub title
Additional comments on Resources Output Performance Measures1
In 2017–18, the department completed 100 per cent of regulatory audits within agreed timelines against its target of 98 per cent. A total of 163 audits were completed during the year covering high risk target audits, critical compliance audits and geotechnical audits.
The Community and stakeholder engagement information forums measure was higher by 32 (72 in total) against the target of 40 for 2017–18. This was due to the increased demand by local communities and stakeholders for information and consultation. Key programs that increased the number of information forums included the Victorian Gas Program with a major focus in the south west of Victoria, a greater number of regulatory forums, the Latrobe Valley Regional Rehabilitation Program and increased engagement in the extractives sector as part of the development of the Extractives Strategy released 15 June 2018.
The processing of Exploration and mining licences applications and mining work plans within regulatory time frames measure did not achieve the target of 95 per cent for the year. The processing of regulatory approvals improved during 2017–18, increasing from 68 per cent in 2016–17 to 78 per cent. The volume of licence applications increased from 36 in 2016–17 to 82 in 2017–18. The overall number of applications approved within the statutory timeframes (licences and work plans) increased from 87 in 2016–17 to 106 in 2017–18. Further improvements will be delivered through the Getting the Groundwork Right: Implementation Plan released on 3 May 2018.
The Delivery of key milestones for the Victorian Gas Program did not achieve the target for the year. The lower result reflects the rescheduling of key activities into 2018–19 impacting the underground gas storage and onshore gas studies work streams. The rescheduling of these activities will not impact the delivery of core program outcomes, including an onshore conventional gas resource estimate, by mid-2020.
The performance measure Facilitate the delivery of resources projects in line with grant agreements and project milestones achieved a result of 88 per cent against the target of 100 per cent. The lower outcome is due to delays by two proponents in finalising exploration reports as part of the TARGET exploration grants program. The milestones and associated grant payments will be delivered in 2018-19.
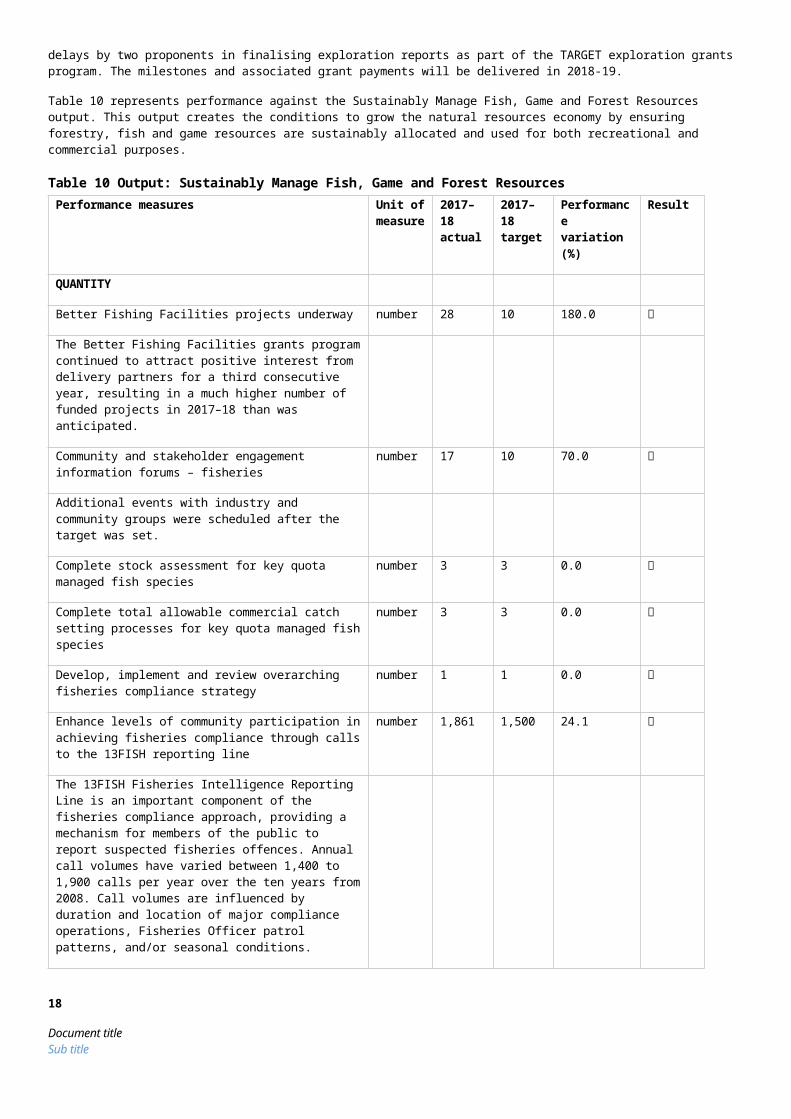
Table 10 represents performance against the Sustainably Manage Fish, Game and Forest Resources output. This output creates the conditions to grow the natural resources economy by ensuring forestry, fish and game resources are sustainably allocated and used for both recreational and commercial purposes.
Table 10 Output: Sustainably Manage Fish, Game and Forest ResourcesPerformance measures Unit of
measure2017–18 actual
2017–18 target
Performance variation (%)
Result
QUANTITY
Better Fishing Facilities projects underway number 28 10 180.0
The Better Fishing Facilities grants program continued to attract positive interest from delivery partners for a third consecutive year, resulting in a much higher number of funded projects in 2017–18 than was anticipated.
Community and stakeholder engagement information forums – fisheries
number 17 10 70.0
Additional events with industry and community groups were scheduled after the target was set.
Complete stock assessment for key quota managed fish species
number 3 3 0.0
Complete total allowable commercial catch setting processes for key quota managed fish species
number 3 3 0.0
Develop, implement and review overarching fisheries compliance strategy
number 1 1 0.0
Enhance levels of community participation in achieving fisheries compliance through calls to the 13FISH reporting line
number 1,861 1,500 24.1
The 13FISH Fisheries Intelligence Reporting Line is an
1 As requested by PAEC in 2014 when the energy and resources performance measures were significantly revised and a number of measures were discontinued.
14
Document titleSub title

important component of the fisheries compliance approach, providing a mechanism for members of the public to report suspected fisheries offences. Annual call volumes have varied between 1,400 to 1,900 calls per year over the ten years from 2008. Call volumes are influenced by duration and location of major compliance operations, Fisheries Officer patrol patterns, and/or seasonal conditions.
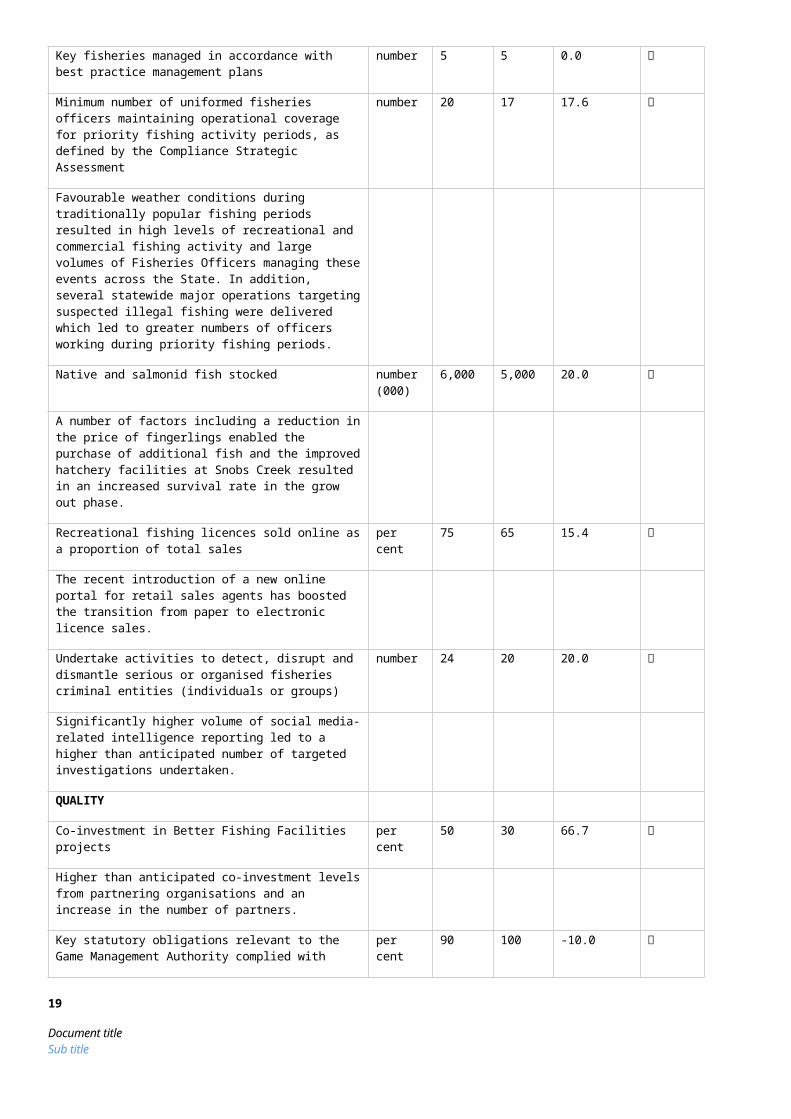
Key fisheries managed in accordance with best practice management plans
number 5 5 0.0
Minimum number of uniformed fisheries officers maintaining operational coverage for priority fishing activity periods, as defined by the Compliance Strategic Assessment
number 20 17 17.6
Favourable weather conditions during traditionally popular fishing periods resulted in high levels of recreational and commercial fishing activity and large volumes of Fisheries Officers managing these events across the State. In addition, several statewide major operations targeting suspected illegal fishing were delivered which led to greater numbers of officers working during priority fishing periods.
Native and salmonid fish stocked number (000)
6,000 5,000 20.0
A number of factors including a reduction in the price of fingerlings enabled the purchase of additional fish and the improved hatchery facilities at Snobs Creek resulted in an increased survival rate in the grow out phase.
Recreational fishing licences sold online as a proportion of total sales
per cent 75 65 15.4
The recent introduction of a new online portal for retail sales agents has boosted the transition from paper to electronic licence sales.
Undertake activities to detect, disrupt and dismantle serious or organised fisheries criminal entities (individuals or groups)
number 24 20 20.0
Significantly higher volume of social media-related intelligence reporting led to a higher than anticipated number of targeted investigations undertaken.
QUALITY
Co-investment in Better Fishing Facilities projects per cent 50 30 66.7
Higher than anticipated co-investment levels from partnering organisations and an increase in the number of partners.
Key statutory obligations relevant to the Game Management Authority complied with (tabling annual report, audits, business plan and board appointments)
per cent 90 100 -10.0
All requirements met with the exception of the annual business plan which was prepared but not submitted to the Minister or published on the internet due to an internal review of operations that could have resulted in operational changes.
Key statutory obligations relevant to the Victorian Fisheries Authority complied with (tabling annual report, audits, business plan and board appointments)
per cent 90 100 -10.0
All requirements met with the exception of publishing an annual business plan and submitting quarterly performance
15
Document titleSub title
reports. As the Victorian Fisheries Authority was in its first year of operation, priority was given to development of a broader Strategic Plan.
Key statutory obligations relevant to VicForests complied with (tabling annual report, audits, corporate plan and board appointments)
per cent 100 100 0.0
TIMELINESS
Proportion of fisheries cost recovery levies reviewed and set prior to the commencement of the licensing year (1 April)
per cent 100 100 0.0
Research project milestones and reports completed on time (Fisheries)
per cent 90 90 0.0
COST
Total output cost $ million 93.0 89.9 3.5
Note: Performance target achieved or exceeded Performance target not achieved – within 5 per cent variance Performance target not achieved – exceeds 5 per cent variance
Objective 2Increase the economic, social and cultural value of tourism, major events and creative industries
The department seeks to increase the economic, social and cultural value of the creative industries to Victoria, grow the number and yield of visitors and international students, and position Victoria as a major events destination.
The department aims to ensure that all Victorians reap the benefits of a vibrant creative state and does this through the provision of industry assistance programs, infrastructure development, sustainable activities, and policy advice.
Progress towards achieving this objectiveIn 2017–18, the department reported progress against this objective using the following objective indicators and outputs:
Objective Indicators Attendances at Creative Industries agencies and funded Major Performing Arts organisations
Employment in the Creative Industries sector
Tourists and students attracted to Victoria
Outputs Creative Industries Access, Development and Innovation
Creative Industries Portfolio Agencies
Cultural Infrastructure and Facilities
Tourism, Major Events and International Education
Indicator: Attendances at Creative Industries agencies and funded Major Performing Arts organisationsIn 2017–18, Victoria’s state-owned arts and cultural institutions - Arts Centre Melbourne, Australian Centre for the Moving Image (ACMI), Docklands Studios Melbourne, Film Victoria, Geelong Performing Arts Centre, Melbourne Recital Centre, Museums Victoria, National Gallery of Victoria (NGV), and State Library Victoria – were attended by a record 13 million visitors. Attendance has steadily grown at these institutions over the last four years from 10 million visitors.
16
Document titleSub title
The NGV Triennial was a highlight of the year,a massive showcase of contemporary art and design from around the globe, which attracted more than 1.2 million visitors to the NGV, more than any exhibition in the gallery’s 157-year history.
A major reimagining of the Melbourne Arts Precinct in Southbank was announced, with the Victorian Government investing $208 million for the project’s first stage. Work commenced in 2017–18 on this once-in-a-generation project which will include an iconic new contemporary art and design gallery,NGV Contemporary; the revitalisation of the Arts Centre Melbourne’s Theatres Building; new and renewed public spaces and new pedestrian connections; and a new creative hub.
Figure 5: Attendances at Creative Industries portfolio agencies
Table 11: Attendances at Creative Industries agencies and funded Major Performing Arts organisationsMeasure (unit of measure) 2014–15 2015–16 2016–17 2017–18
Attendances at creative industries portfolio agencies (number ('000)) 10,189 11,403 11,766 13,170
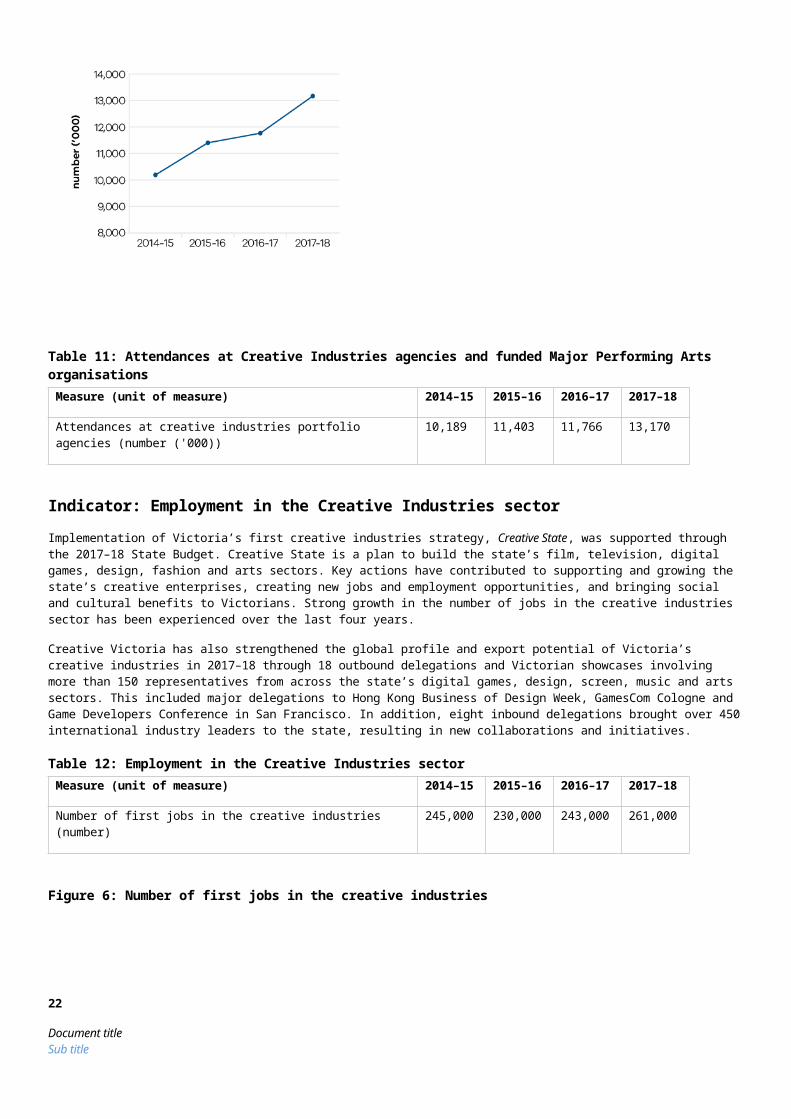
Indicator: Employment in the Creative Industries sectorImplementation of Victoria’s first creative industries strategy, Creative State, was supported through the 2017–18 State Budget. Creative State is a plan to build the state’s film, television, digital games, design, fashion and arts sectors. Key actions have contributed to supporting and growing the state’s creative enterprises, creating new jobs and employment opportunities, and bringing social and cultural benefits to Victorians. Strong growth in the number of jobs in the creative industries sector has been experienced over the last four years.
Creative Victoria has also strengthened the global profile and export potential of Victoria’s creative industries in 2017–18 through 18 outbound delegations and Victorian showcases involving more than 150 representatives from across the state’s digital games, design, screen, music and arts sectors. This included major delegations to Hong Kong Business of Design Week, GamesCom Cologne and Game Developers Conference in San Francisco. In addition, eight inbound delegations brought over 450 international industry leaders to the state, resulting in new collaborations and initiatives.
Table 12: Employment in the Creative Industries sectorMeasure (unit of measure) 2014–15 2015–16 2016–17 2017–18
Number of first jobs in the creative industries (number) 245,000 230,000 243,000 261,000
Figure 6: Number of first jobs in the creative industries
17
Document titleSub title
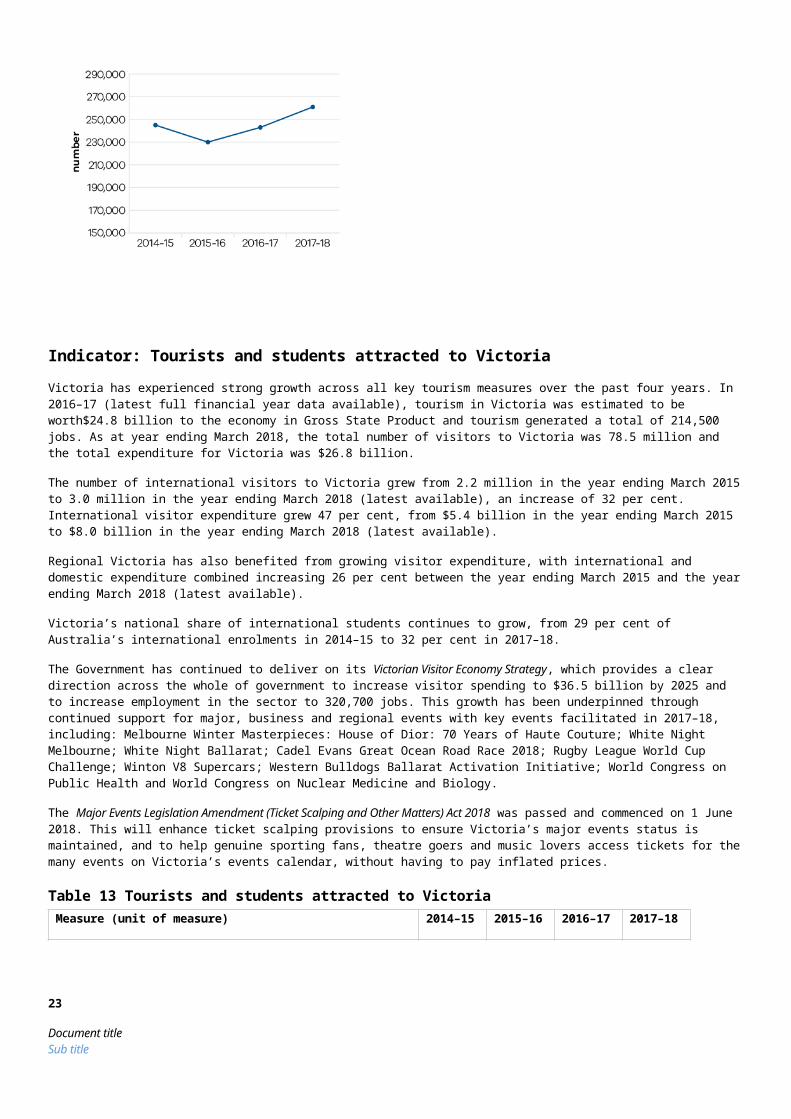
Indicator: Tourists and students attracted to VictoriaVictoria has experienced strong growth across all key tourism measures over the past four years. In 2016–17 (latest full financial year data available), tourism in Victoria was estimated to be worth$24.8 billion to the economy in Gross State Product and tourism generated a total of 214,500 jobs. As at year ending March 2018, the total number of visitors to Victoria was 78.5 million and the total expenditure for Victoria was $26.8 billion.
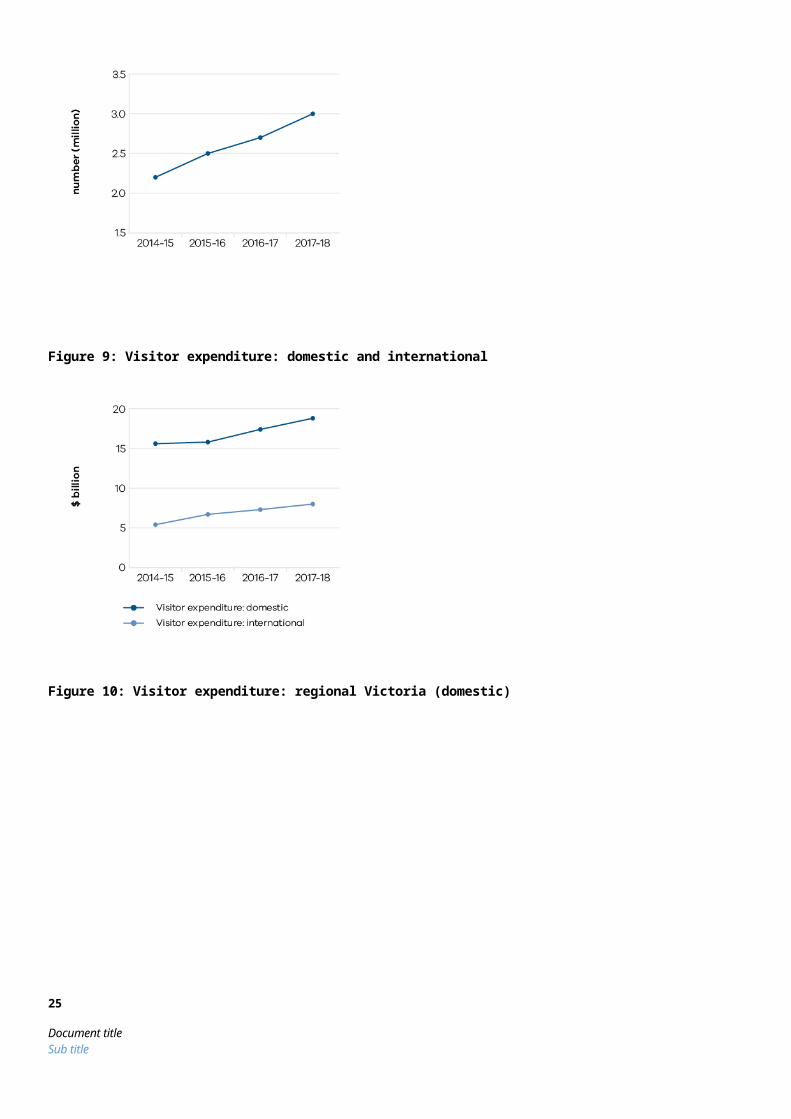
The number of international visitors to Victoria grew from 2.2 million in the year ending March 2015 to 3.0 million in the year ending March 2018 (latest available), an increase of 32 per cent. International visitor expenditure grew 47 per cent, from $5.4 billion in the year ending March 2015 to $8.0 billion in the year ending March 2018 (latest available).
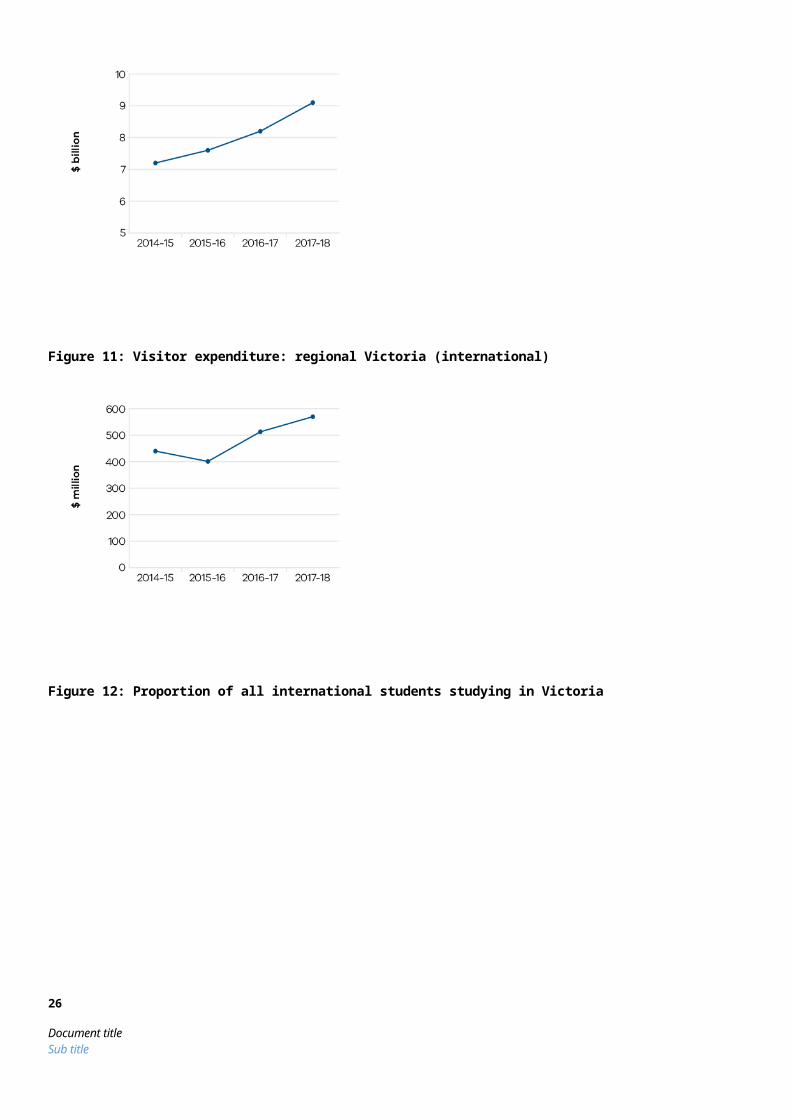
Regional Victoria has also benefited from growing visitor expenditure, with international and domestic expenditure combined increasing 26 per cent between the year ending March 2015 and the year ending March 2018 (latest available).
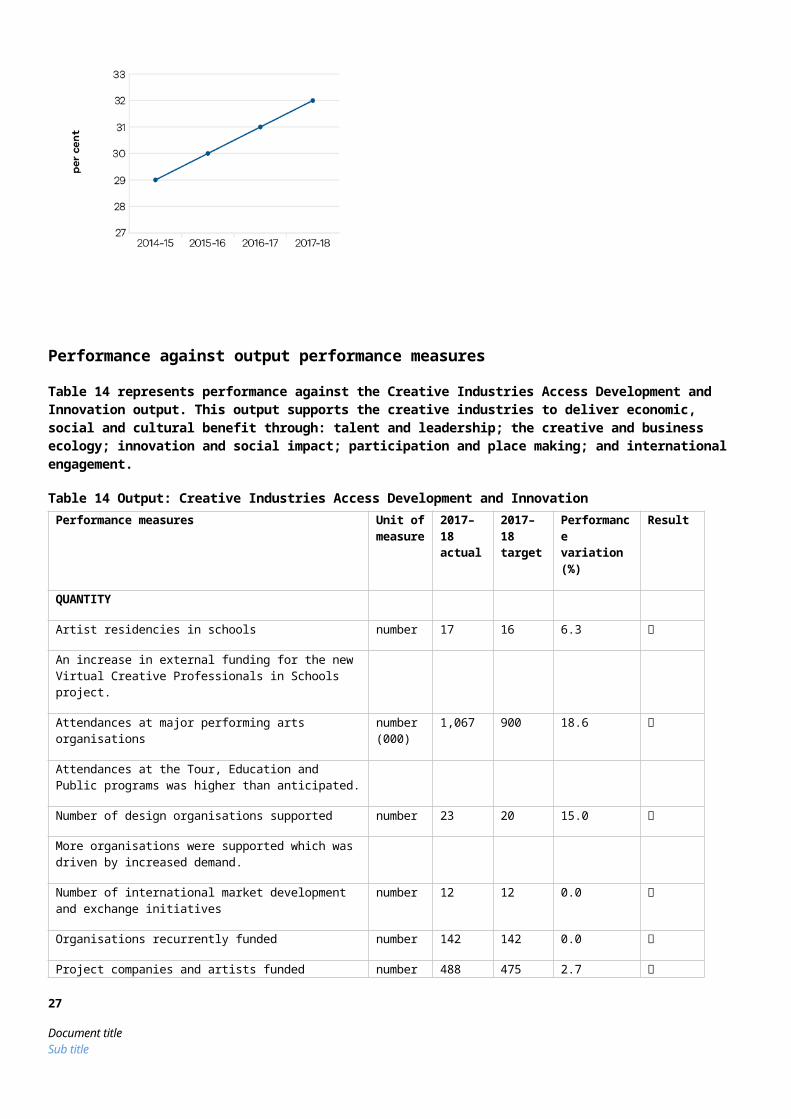
Victoria’s national share of international students continues to grow, from 29 per cent of Australia’s international enrolments in 2014–15 to 32 per cent in 2017–18.
The Government has continued to deliver on its Victorian Visitor Economy Strategy, which provides a clear direction across the whole of government to increase visitor spending to $36.5 billion by 2025 and to increase employment in the sector to 320,700 jobs. This growth has been underpinned through continued support for major, business and regional events with key events facilitated in 2017–18, including: Melbourne Winter Masterpieces: House of Dior: 70 Years of Haute Couture; White Night Melbourne; White Night Ballarat; Cadel Evans Great Ocean Road Race 2018; Rugby League World Cup Challenge; Winton V8 Supercars; Western Bulldogs Ballarat Activation Initiative; World Congress on Public Health and World Congress on Nuclear Medicine and Biology.
The Major Events Legislation Amendment (Ticket Scalping and Other Matters) Act 2018 was passed and commenced on 1 June 2018. This will enhance ticket scalping provisions to ensure Victoria’s major events status is maintained, and to help genuine sporting fans, theatre goers and music lovers access tickets for the many events on Victoria’s events calendar, without having to pay inflated prices.
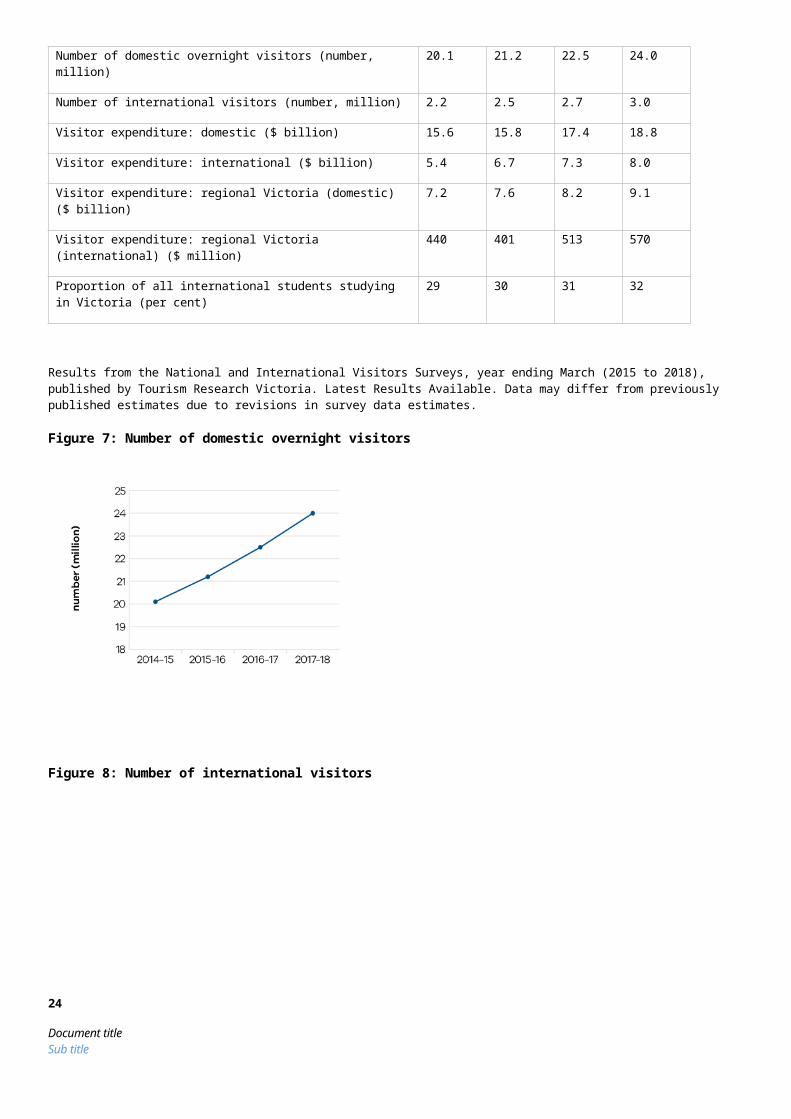
Table 13 Tourists and students attracted to VictoriaMeasure (unit of measure) 2014–15 2015–16 2016–17 2017–18
Number of domestic overnight visitors (number, million) 20.1 21.2 22.5 24.0
Number of international visitors (number, million) 2.2 2.5 2.7 3.0
Visitor expenditure: domestic ($ billion) 15.6 15.8 17.4 18.8
Visitor expenditure: international ($ billion) 5.4 6.7 7.3 8.0
Visitor expenditure: regional Victoria (domestic) ($ billion) 7.2 7.6 8.2 9.1
Visitor expenditure: regional Victoria (international) ($ million) 440 401 513 570
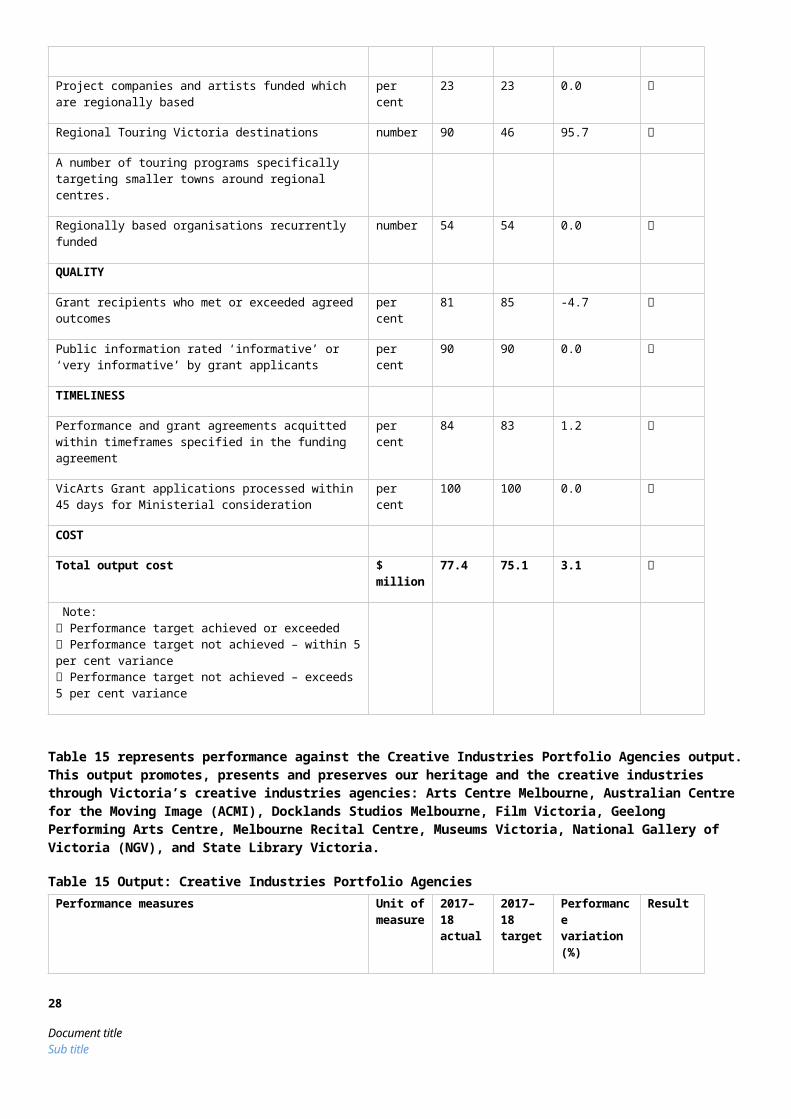
Proportion of all international students studying in Victoria (per cent) 29 30 31 32
18
Document titleSub title
Results from the National and International Visitors Surveys, year ending March (2015 to 2018), published by Tourism Research Victoria. Latest Results Available. Data may differ from previously published estimates due to revisions in survey data estimates.
Figure 7: Number of domestic overnight visitors
Figure 8: Number of international visitors
Figure 9: Visitor expenditure: domestic and international
19
Document titleSub title
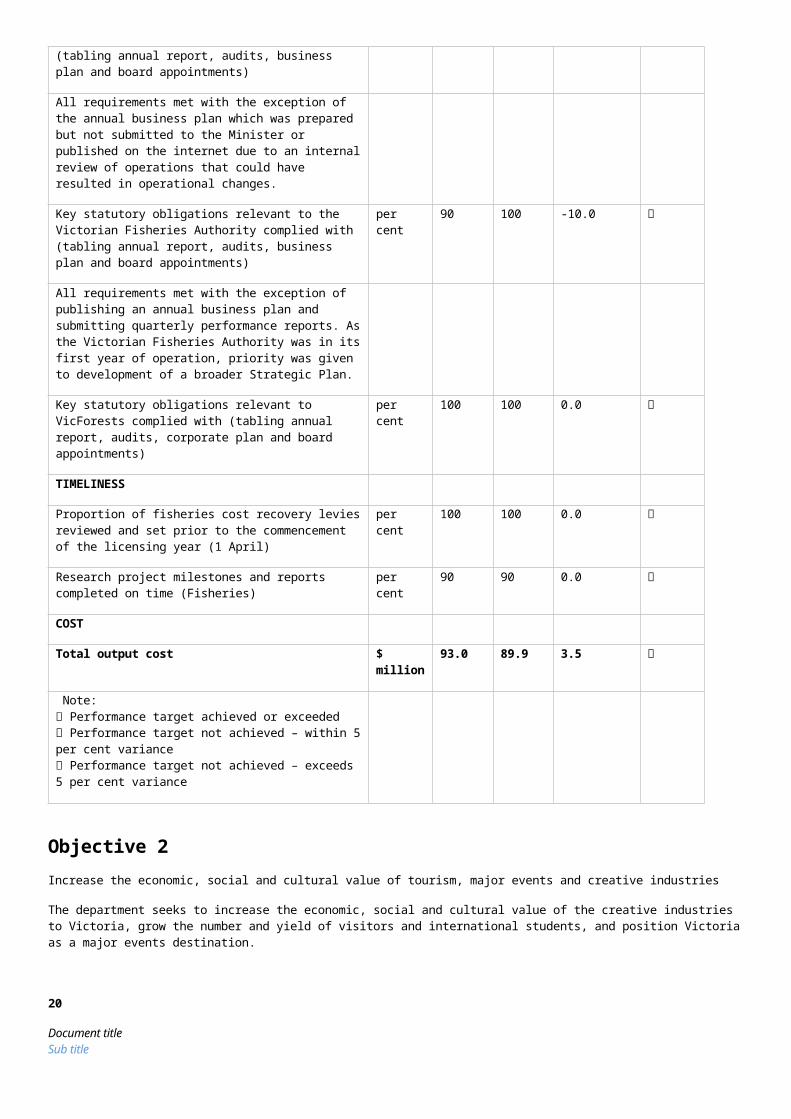
Figure 10: Visitor expenditure: regional Victoria (domestic)
Figure 11: Visitor expenditure: regional Victoria (international)
20
Document titleSub title
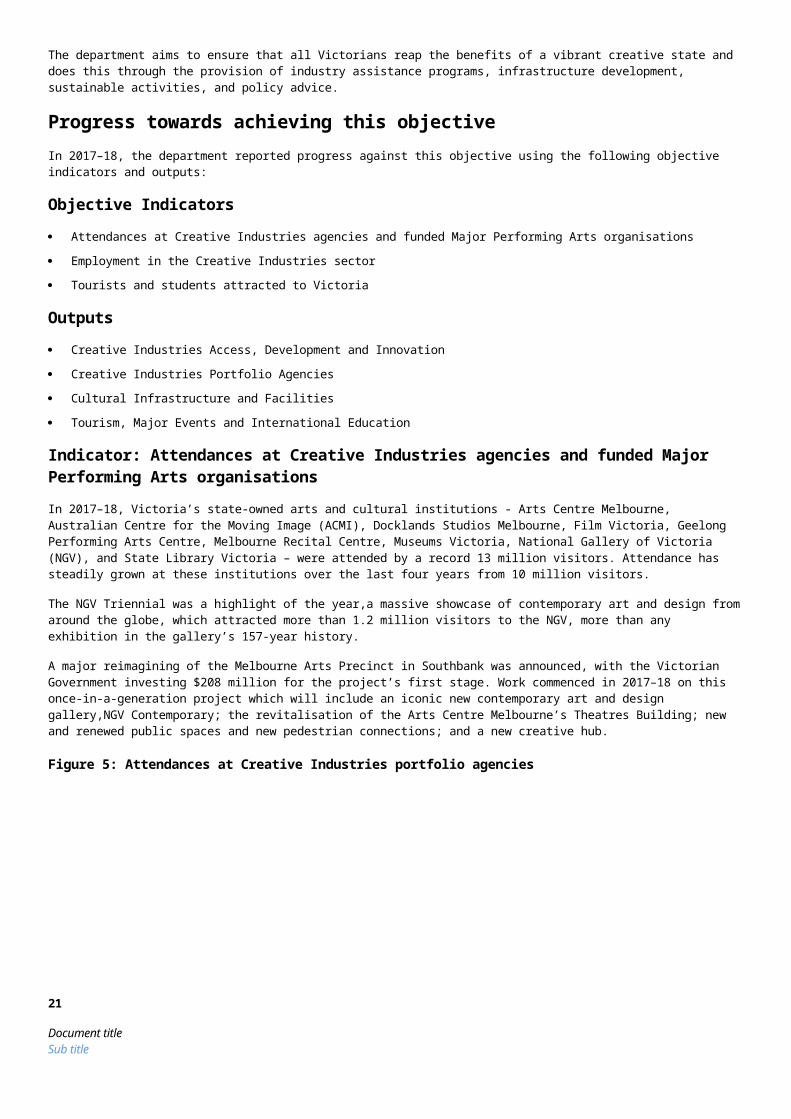
Figure 12: Proportion of all international students studying in Victoria
Performance against output performance measures
Table 14 represents performance against the Creative Industries Access Development and Innovation output. This output supports the creative industries to deliver economic, social and cultural benefit through: talent and leadership; the creative and business ecology; innovation and social impact; participation and place making; and international engagement.
Table 14 Output: Creative Industries Access Development and InnovationPerformance measures Unit of
measure2017–18 actual
2017–18 target
Performance variation (%)
Result
QUANTITY
Artist residencies in schools number 17 16 6.3
An increase in external funding for the new Virtual Creative Professionals in Schools project.
Attendances at major performing arts organisations number (000)
1,067 900 18.6
21
Document titleSub title
Attendances at the Tour, Education and Public programs was higher than anticipated.
Number of design organisations supported number 23 20 15.0
More organisations were supported which was driven by increased demand.
Number of international market development and exchange initiatives
number 12 12 0.0
Organisations recurrently funded number 142 142 0.0
Project companies and artists funded number 488 475 2.7
Project companies and artists funded which are regionally based
per cent 23 23 0.0
Regional Touring Victoria destinations number 90 46 95.7
A number of touring programs specifically targeting smaller towns around regional centres.
Regionally based organisations recurrently funded number 54 54 0.0
QUALITY
Grant recipients who met or exceeded agreed outcomes per cent 81 85 -4.7
Public information rated ‘informative’ or ‘very informative’ by grant applicants
per cent 90 90 0.0
TIMELINESS
Performance and grant agreements acquitted within timeframes specified in the funding agreement
per cent 84 83 1.2
VicArts Grant applications processed within 45 days for Ministerial consideration
per cent 100 100 0.0
COST
Total output cost $ million 77.4 75.1 3.1
Note: Performance target achieved or exceeded Performance target not achieved – within 5 per cent variance Performance target not achieved – exceeds 5 per cent variance
Table 15 represents performance against the Creative Industries Portfolio Agencies output. This output promotes, presents and preserves our heritage and the creative industries through Victoria’s creative industries agencies: Arts Centre Melbourne, Australian Centre for the Moving Image (ACMI), Docklands Studios Melbourne, Film Victoria, Geelong Performing Arts Centre, Melbourne Recital Centre, Museums Victoria, National Gallery of Victoria (NGV), and State Library Victoria.
Table 15 Output: Creative Industries Portfolio AgenciesPerformance measures Unit of
measure2017–18 actual
2017–18 target
Performance variation (%)
Result
QUANTITY
Additional employment from production supported by Film number 8,245 8,000 3.1
22
Document titleSub title
Victoria
Agency website visitation number (000)
22,373 21,000 6.5
Driven by popularity of agency programs.
Members and friends of agencies number 66,621 48,000 38.8
A successful exhibition season and promotions.
Students participating in agency education programs number 518,581 550,000 -5.7
Redevelopment and capital improvement projects reduced capacity.
Users/attendances at all agencies number (000)
13,170 10,700 23.1
Successful exhibitions, offering users of the State Library a wider experience and interaction with the collections, and the popularity of temporary exhibitions and national and international touring programs.
Value of film, television and digital media production supported by Film Victoria
$ million 213 180 18.3
An additional large scale project supported by the Victorian Government.
Volunteer hours number 98,901 98,900 0.0
QUALITY
Agency collections storage meeting industry standard per cent 83 86 -3.5
Visitors satisfied with visit: Arts Centre Melbourne per cent 96 95 1.1
Visitors satisfied with visit: Australian Centre for the Moving Image
per cent 95 94 1.1
Visitors satisfied with visit: Geelong Performing Arts Centre per cent 98 98 0.0
Visitors satisfied with visit: Melbourne Recital Centre per cent 97 92 5.4
Programming was well-received by audiences and continued efforts to improve front of house services, communications and general customer service.
Visitors satisfied with visit: Museums Victoria per cent 96 95 1.1
Visitors satisfied with visit: National Gallery of Victoria per cent 98 95 3.2
Visitors satisfied with visit: State Library Victoria per cent 90 90 0.0
TIMELINESS
Arts portfolio public body annual reports tabled in Parliament by the required statutory dates
per cent 100 100 0.0
COST
Total output cost $ million 428.7 365.8 17.2
The 2017–18 result was higher than budget primarily due to increased exhibition costs and revised expenditure profiles primarily as a result of the revaluation of departmental
23
Document titleSub title
cultural facilities.
Note: Performance target achieved or exceeded Performance target not achieved – within 5 per cent variance Performance target not achieved – exceeds 5 per cent variance
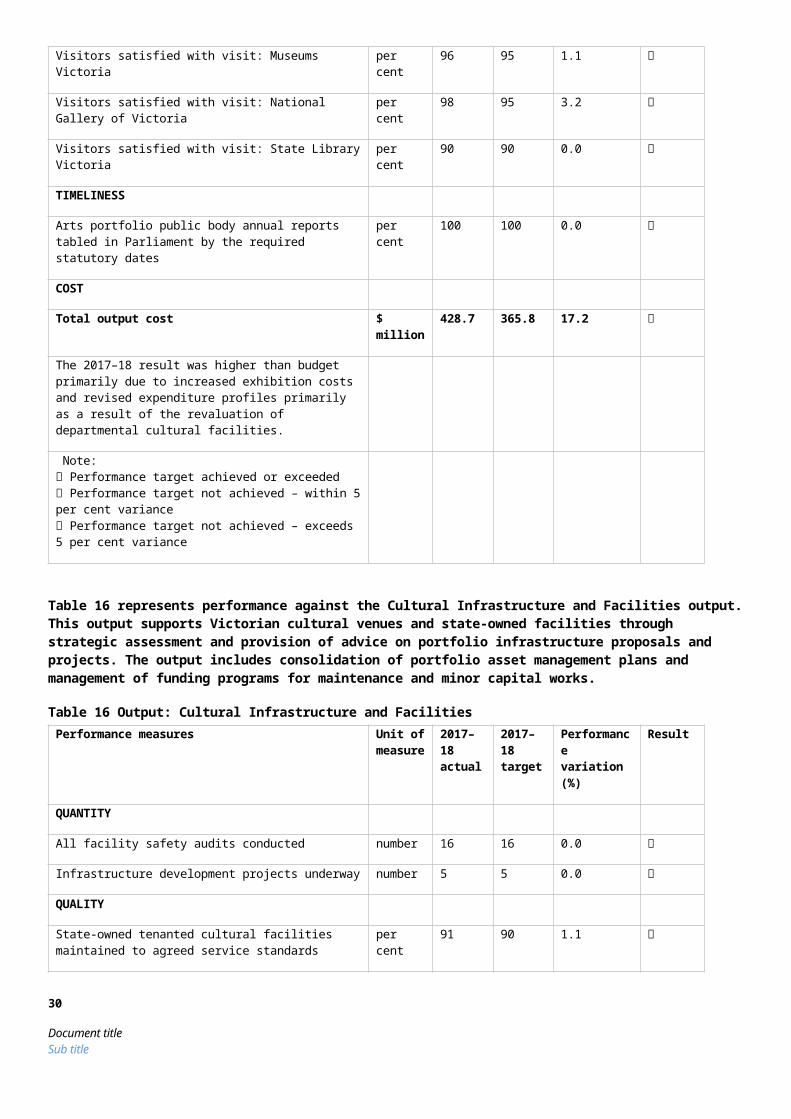
Table 16 represents performance against the Cultural Infrastructure and Facilities output. This output supports Victorian cultural venues and state-owned facilities through strategic assessment and provision of advice on portfolio infrastructure proposals and projects. The output includes consolidation of portfolio asset management plans and management of funding programs for maintenance and minor capital works.
Table 16 Output: Cultural Infrastructure and FacilitiesPerformance measures Unit of
measure2017–18 actual
2017–18 target
Performance variation (%)
Result
QUANTITY
All facility safety audits conducted number 16 16 0.0
Infrastructure development projects underway number 5 5 0.0
QUALITY
State-owned tenanted cultural facilities maintained to agreed service standards
per cent 91 90 1.1
Success measures of projects achieved per cent 92 90 2.2
TIMELINESS
Cultural Facilities Maintenance Fund projects delivered within agreed timeframes
per cent 86 90 -4.4
COST
Total output cost $ million 118.5 102.5 15.6
The 2017–18 result was higher than budget primarily due to increased funding for facilities maintenance and procurement.
Note: Performance target achieved or exceeded Performance target not achieved – within 5 per cent variance Performance target not achieved – exceeds 5 per cent variance
Table 17 represents performance against the Tourism, Major Events and International Education output. This output maximises employment and the long-term economic benefits of tourism, international education and major events to Victoria by developing and marketing the State as a competitive destination.
Table 17 Output: Tourism, Major Events and International EducationPerformance measures Unit of
measure2017–18 actual
2017–18 target
Performance variation (%)
Result
QUANTITY
24
Document titleSub title
Major sporting and cultural events facilitated number 26 18 44.4
Due to a higher number of events being formerly contracted and delivered in 2017–18. Events facilitated in 2017–18 include: Australian Open Tennis 2018, Melbourne Winter Masterpieces: Aardman (ACMI), Rugby Union Events Package: Wallabies v Ireland, Rip Curl Pro, Festival of Sails, Fast Five Netball World Series, Hockey Australia International Tournament, FIG (Gymnastics) Individual Apparatus World Cup Series, White Night Melbourne 2018, White Night Ballarat 2018, Jayco Herald Sun Tour 2018, Cadel Evans Great Ocean Road Race 2018, FIM Superbikes World Championships, Melbourne Food and Wine Festival (2017 - 2019), Virgin Australia Melbourne Fashion Festival, Melbourne Winter Masterpieces: House of Dior: 70 Years of Haute Couture, State of Origin, Rugby League World Club Challenge, FIBA World Cup Qualifiers: Australia v Philippines and Australia v Chinese Taipei, Melbourne Winter Masterpieces: MoMA, Melbourne Winter Masterpieces: Wonderland (ACMI), Real Madrid Experience, Rugby League World Cup, FIFA Qualifier: Australia v Thailand, Volvo Ocean Race, Pop Up Globe.
Number of domestic overnight visitors number (million)
24.0 22.6 6.2
Higher than expected growth recorded in domestic visitors to and within Victoria. This is the latest available data for the year ending March 2018 from the National Visitor Survey published by Tourism Research Australia in June 2018.
Number of visitors (international) number (million)
3.0 2.9 3.4
This is the latest available data for the year ending March 2018 from the International Visitor Survey, published by Tourism Research Australia in July 2018.
Proportion of all international students studying in Victoria per cent 32 30 6.7
Growth was driven by high performing Asian markets such as China and India, which make up 48 per cent of international enrolments in the state. This is the latest available full year data for the year ending December 2017, sourced from the Commonwealth Department of Education and Training, published in March 2018.
Visitor expenditure: domestic $ billion 18.8 17.7 6.2
Higher than expected growth recorded in domestic expenditure driven by both domestic daytrip and overnight visitors to and within Victoria. This is the latest available data for the year ending March 2018 from the National Visitor Survey published by Tourism Research Australia in June 2018.
Visitor expenditure: international $ billion 8.0 7.8 2.6
This is the latest available data for the year ending March 2018 from the International Visitor Survey, published by Tourism Research Australia in July 2018.
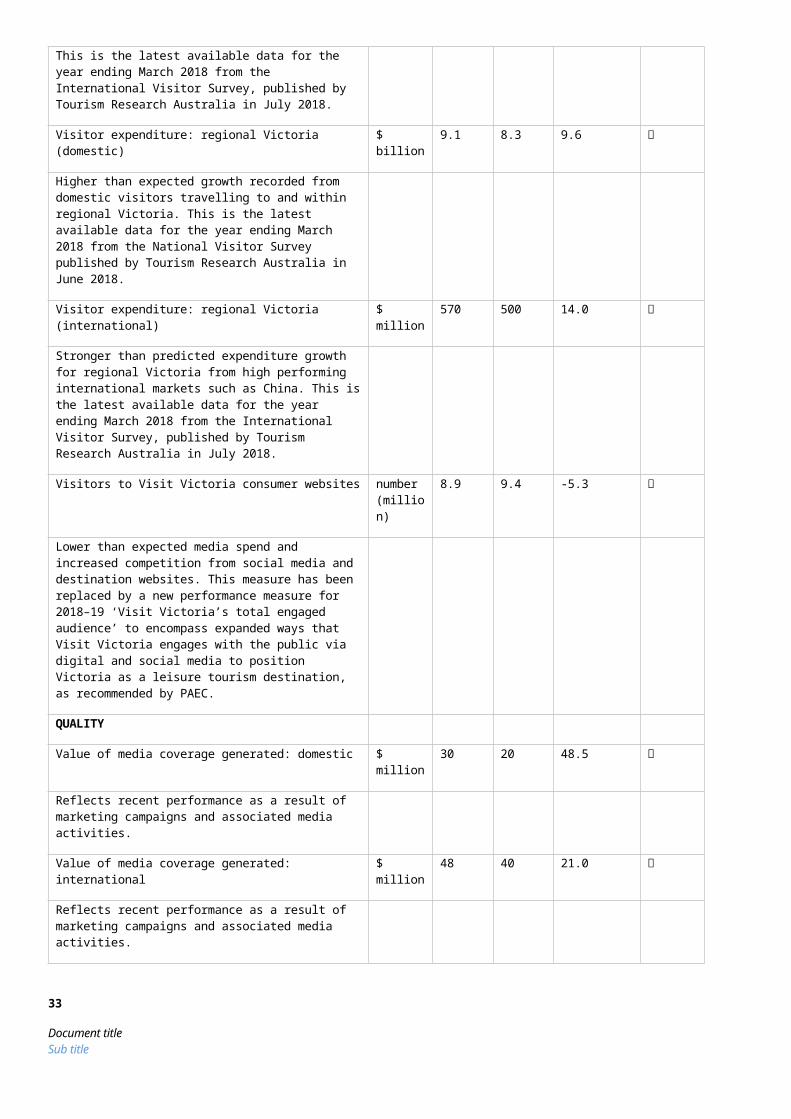
Visitor expenditure: regional Victoria (domestic) $ billion 9.1 8.3 9.6
Higher than expected growth recorded from domestic visitors travelling to and within regional Victoria. This is the latest available data for the year ending March 2018 from the National Visitor Survey published by Tourism Research
25
Document titleSub title
Australia in June 2018.
Visitor expenditure: regional Victoria (international) $ million 570 500 14.0
Stronger than predicted expenditure growth for regional Victoria from high performing international markets such as China. This is the latest available data for the year ending March 2018 from the International Visitor Survey, published by Tourism Research Australia in July 2018.
Visitors to Visit Victoria consumer websites number (million)
8.9 9.4 -5.3
Lower than expected media spend and increased competition from social media and destination websites. This measure has been replaced by a new performance measure for 2018–19 ‘Visit Victoria’s total engaged audience’ to encompass expanded ways that Visit Victoria engages with the public via digital and social media to position Victoria as a leisure tourism destination, as recommended by PAEC.
QUALITY
Value of media coverage generated: domestic $ million 30 20 48.5
Reflects recent performance as a result of marketing campaigns and associated media activities.
Value of media coverage generated: international $ million 48 40 21.0
Reflects recent performance as a result of marketing campaigns and associated media activities.
TIMELINESS
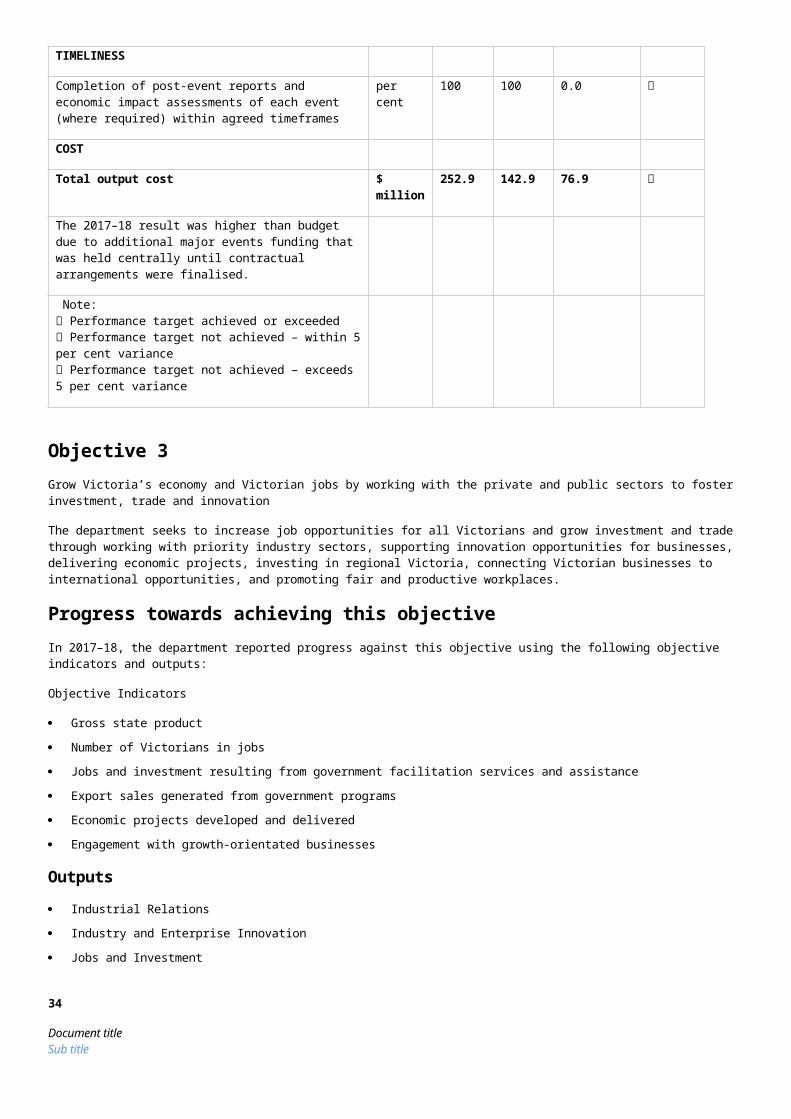
Completion of post-event reports and economic impact assessments of each event (where required) within agreed timeframes
per cent 100 100 0.0
COST
Total output cost $ million 252.9 142.9 76.9
The 2017–18 result was higher than budget due to additional major events funding that was held centrally until contractual arrangements were finalised.
Note: Performance target achieved or exceeded Performance target not achieved – within 5 per cent variance Performance target not achieved – exceeds 5 per cent variance
Objective 3Grow Victoria’s economy and Victorian jobs by working with the private and public sectors to foster investment, trade and innovation
The department seeks to increase job opportunities for all Victorians and grow investment and trade through working with priority industry sectors, supporting innovation opportunities for businesses, delivering economic projects, investing in regional Victoria, connecting Victorian businesses to international opportunities, and promoting fair and productive workplaces.
26
Document titleSub title
Progress towards achieving this objectiveIn 2017–18, the department reported progress against this objective using the following objective indicators and outputs:
Objective Indicators
Gross state product
Number of Victorians in jobs
Jobs and investment resulting from government facilitation services and assistance
Export sales generated from government programs
Economic projects developed and delivered
Engagement with growth-orientated businesses
Outputs Industrial Relations
Industry and Enterprise Innovation
Jobs and Investment
Major Projects
Regional Development
Trade
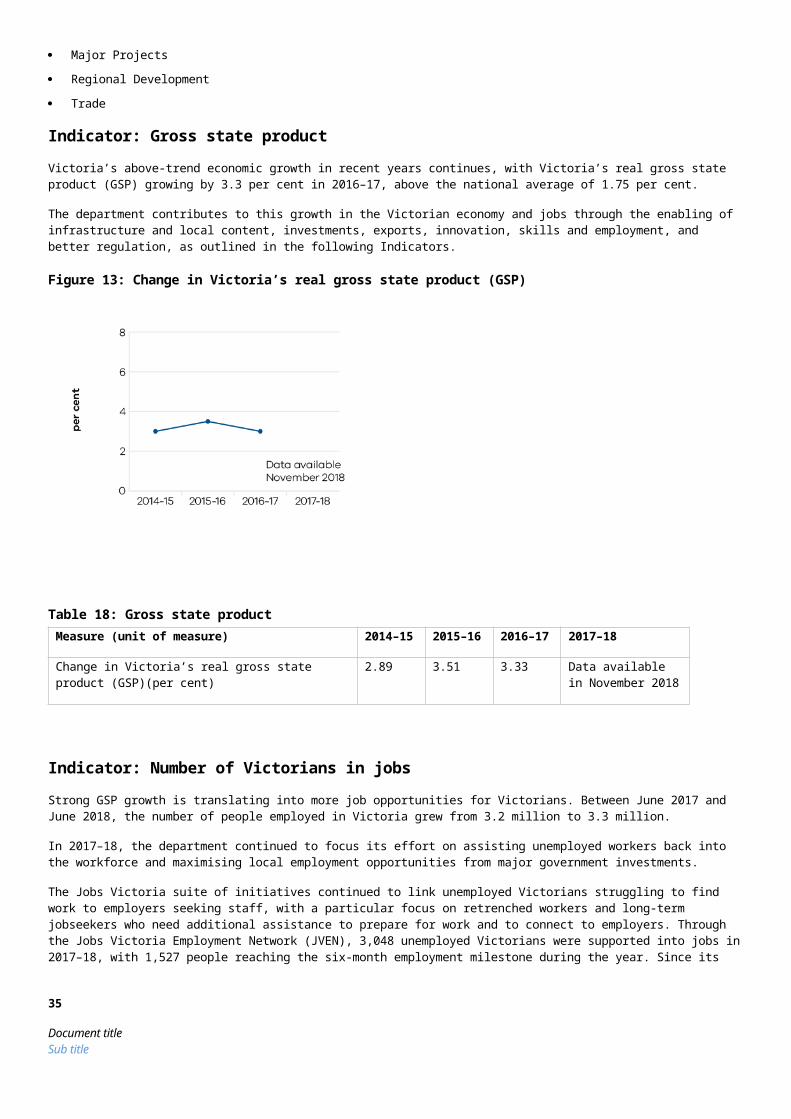
Indicator: Gross state productVictoria’s above-trend economic growth in recent years continues, with Victoria’s real gross state product (GSP) growing by 3.3 per cent in 2016–17, above the national average of 1.75 per cent.
The department contributes to this growth in the Victorian economy and jobs through the enabling of infrastructure and local content, investments, exports, innovation, skills and employment, and better regulation, as outlined in the following Indicators.
Figure 13: Change in Victoria’s real gross state product (GSP)
Table 18: Gross state productMeasure (unit of measure) 2014–15 2015–16 2016–17 2017–18
Change in Victoria’s real gross state product (GSP)(per cent)
2.89 3.51 3.33 Data available in November 2018
27
Document titleSub title
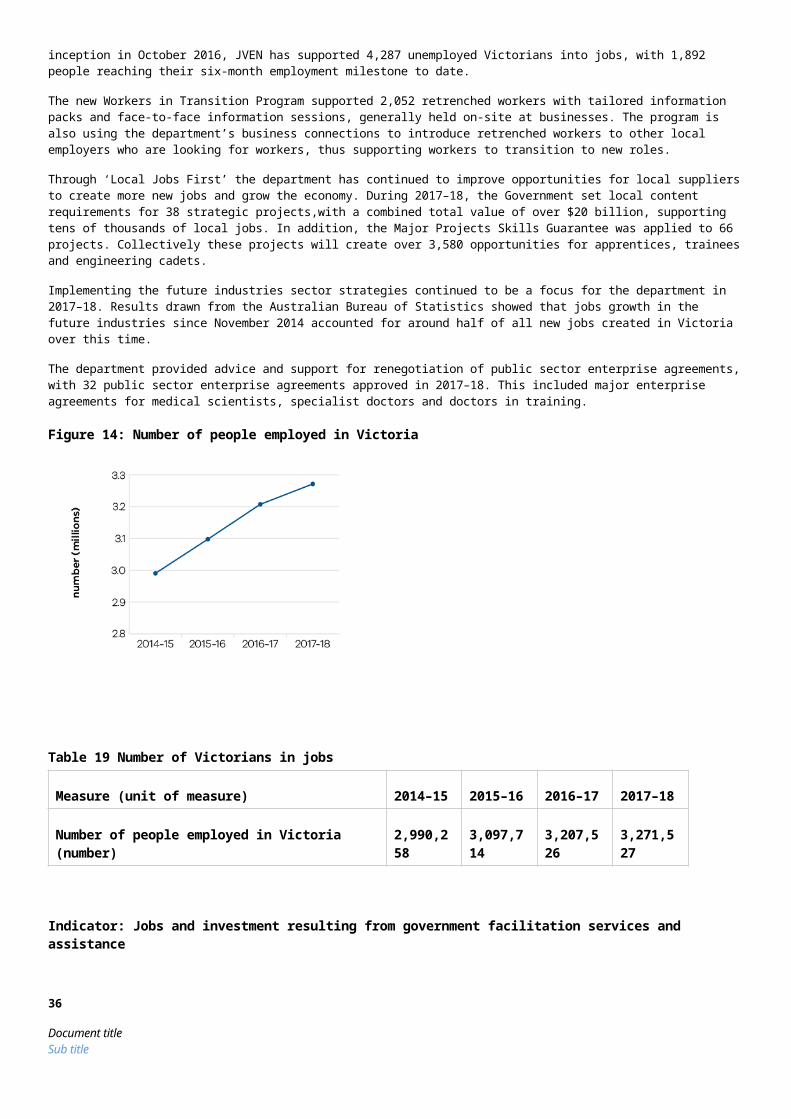
Indicator: Number of Victorians in jobsStrong GSP growth is translating into more job opportunities for Victorians. Between June 2017 and June 2018, the number of people employed in Victoria grew from 3.2 million to 3.3 million.
In 2017–18, the department continued to focus its effort on assisting unemployed workers back into the workforce and maximising local employment opportunities from major government investments.
The Jobs Victoria suite of initiatives continued to link unemployed Victorians struggling to find work to employers seeking staff, with a particular focus on retrenched workers and long-term jobseekers who need additional assistance to prepare for work and to connect to employers. Through the Jobs Victoria Employment Network (JVEN), 3,048 unemployed Victorians were supported into jobs in 2017–18, with 1,527 people reaching the six-month employment milestone during the year. Since its inception in October 2016, JVEN has supported 4,287 unemployed Victorians into jobs, with 1,892 people reaching their six-month employment milestone to date.
The new Workers in Transition Program supported 2,052 retrenched workers with tailored information packs and face-to-face information sessions, generally held on-site at businesses. The program is also using the department’s business connections to introduce retrenched workers to other local employers who are looking for workers, thus supporting workers to transition to new roles.
Through ‘Local Jobs First’ the department has continued to improve opportunities for local suppliers to create more new jobs and grow the economy. During 2017–18, the Government set local content requirements for 38 strategic projects,with a combined total value of over $20 billion, supporting tens of thousands of local jobs. In addition, the Major Projects Skills Guarantee was applied to 66 projects. Collectively these projects will create over 3,580 opportunities for apprentices, trainees and engineering cadets.
Implementing the future industries sector strategies continued to be a focus for the department in 2017–18. Results drawn from the Australian Bureau of Statistics showed that jobs growth in the future industries since November 2014 accounted for around half of all new jobs created in Victoria over this time.
The department provided advice and support for renegotiation of public sector enterprise agreements, with 32 public sector enterprise agreements approved in 2017–18. This included major enterprise agreements for medical scientists, specialist doctors and doctors in training.
Figure 14: Number of people employed in Victoria
Table 19 Number of Victorians in jobs
Measure (unit of measure) 2014–15 2015–16 2016–17 2017–18
Number of people employed in Victoria (number) 2,990,258 3,097,714 3,207,526 3,271,527
Indicator: Jobs and investment resulting from government facilitation services and assistance
28
Document titleSub title

In 2017–18, the department exceeded its investment and jobs targets by generating more than$2.4 billion in new capital investment (against a target of $2.3 billion) and by the creation of 6,510 full-time equivalent jobs (against a target of 5,000).
Figure 15: Jobs resulting from government investment facilitation services and assistance
This represents a 6.5 per cent increase in new capital investment since 2014–15, and a 6.4 per cent increase in the number of jobs created. Of the new jobs, 1,779 were created in regional Victoria. An increased focus on headquarters attraction activity resulted in 18 businesses establishing their Australian/International headquarters or research development centres in Victoria, including LiveTiles, Canopy Growth Corporation and JD.com.
Figure 16: New investment resulting from government facilitation services and assistance
Table 20 Jobs and investment resulting from government facilitation services and assistance
Measure (unit of measure) 2014–15 2015–16 2016–17 2017–18
Jobs resulting from government investment facilitation services and assistance (number)
6,120 5,523 6,280 6,510
New investment resulting from government facilitation services and assistance ($ million)
2,319 2,466 2,230 2,469
29
Document titleSub title
Indicator: Export sales generated from government programsVictorian Government programs resulted in over $807 million in actual export sales in 2017–18,an increase of 76 per cent since 2015–16.
The Government’s 2017–18 program of inbound and outbound trade missions and business delegations assisted more than 950 Victorian companies to connect with international business and government delegates. 2,783 clients participated in the department’s suite of export and trade programs.
In 2017–18 the Government launched Globally Connected: Victoria’s Trade Statement. The Statement articulates Victoria’s overarching trade strategy, sets out our vision for securing growth and prosperity through trade, and identifies four strategies to help Victorian businesses become globally connected, innovative and competitive. Each of the strategies includes a series of actions.
Victoria’s capacity to grow trade, investment and employment opportunities was further strengthened in 2017–18 with the expansion of the Victorian Government Trade and Investment network, with the formal opening of offices in Boston and Tel Aviv.
Figure 17: Actual export sales generated as a result of participation in government programs
Table 21 Export sales generated from government programs
Measure (unit of measure) 2014–15 2015–16 2016–17 2017–18
Actual export sales generated as a result of participation in government programs ($ million)
Data not available
459 648 807
Indicator: Economic projects developed and deliveredThrough Development Victoria and the Economic Projects division of the department, 15 major government economic projects were managed, including Melbourne Exhibition Centre Stage 2, Geelong Performing Arts Centre and the State Library Victoria Redevelopment. Once completed, these projects will contribute to growing economic activity and jobs within the State.
Figure 18: Number of economic projects in delivery
30
Document titleSub title

Table 22 Economic projects developed and delivered
Measure (unit of measure) 2014–15 2015–16 2016–17 2017–18
Number of economic projects in delivery (number) Data not available
20 14 15
Indicator: Engagement with growth-orientated businessesThe department engaged 14,401 times with businesses in 2017–18, through specific business engagement meetings and by leveraging Victoria’s major events. Engagements were deliberately focused towards growth-orientated firms, including high-growth exporters. One hundred and nine industry roundtables and forums were also held, to bring together a broader range of businesses and organisations on specific areas of interest.
Broader engagement with industry, local government and the community in regional Victoria was enabled through the Regional Partnerships. In the second year of operation, over 3,500 people attended 15 regional assemblies in 2017–18.
Figure 19: Engagements with businesses
Table 23 Engagement with growth-orientated businesses
31
Document titleSub title

Measure (unit of measure) 2014–15 2015–16 2016–17 2017–18
Engagements with businesses (number) 13,200 14,782 15,014 14,401
Performance against output performance measures
Table 24 represents performance against the Industrial Relations output. This output contributes to a positive industrial relations environment through provision of industrial relations policy and advice to Government. This includes oversight of enterprise bargaining across the Victorian public sector and support for Victoria’s participation in the national workplace relations system.
Table 24 Output: Industrial RelationsPerformance measures Unit of
measure2017–18 actual
2017–18 target
Performance variation (%)
Result
QUALITY
Public sector agreements renewed and approved within current enterprise bargaining framework
per cent 100 100 0.0
Victoria represented in major industrial relations cases and inquiries
per cent 100 100 0.0
TIMELINESS
Review and assessment of submitted public sector enterprise bargaining costings and proposed agreements completed and submitted for approval within four weeks
per cent 100 80 25.0
Implementation of a more streamlined agreement approval framework that provides timely and coordinated responses for departments.
COST
Total output cost $ million 6.3 4.8 30.3
The 2017–18 result is higher mainly due to additional funding for the Labour Hire Licensing and Portable Long Service Leave initiatives.
Note: Performance target achieved or exceeded Performance target not achieved – within 5 per cent variance Performance target not achieved – exceeds 5 per cent variance
Table 25 represents performance against the Industry and Enterprise Innovation output. This output provides access to information and connections, and builds the capacity of businesses and industry to develop and effectively use new practices and technologies to increase productivity and competitiveness in Victoria. It also helps businesses overcome barriers to competitiveness, with a focus on priority sectors.
Table 25 Output: Industry and Enterprise InnovationPerformance measures Unit of
measure2017–18 actual
2017–18 target
Performance variation (%)
Result
32
Document titleSub title
QUANTITY
Businesses whose growth and productivity issues are resolved by the Department
number 1,830 1,200 52.5
An increased number of employers were assisted with skilled workers.
Companies and Industry Associations supported by Future Industries Fund
number 110 100 10.0
Some Future Industries Fund (FIF) programs are maturing and reaching a greater number of organisations.
Engagements with businesses number 14,401 14,000 2.9
Industry roundtables and engagement forums number 109 100 9.0
A greater number of forums and roundtables were held to support the development of the Government’s space industry policy and launch of the Boost Your Business voucher programs.
New mobile base stations facilitated number 48 30 60.0
The Victorian mobile tower rollout is ahead of schedule. Efficient management of the program and learnings from the progressive rollout of towers have resulted in downstream efficiencies in tower delivery by the grant recipient.
Number of companies or new entrants supported through the LaunchVic initiative
number 122 120 1.7
Number of major research and evaluation projects completed
number 7 6 16.7
Additional research projects have been undertaken to scope future work and to inform policy decisions.
Participants engaged during the Small Business Festival number 27,339 29,000 -5.7
The cancellation of a number of externally run events that were featured in the program as well as an increase in the proportion of events held in regional Victoria.
Subscriptions to Small Business Victoria E-Newsletter number 30,246 38,000 -20.4
Changes in small business content preferences towards more contemporary channels including Facebook and Twitter.
QUALITY
Client satisfaction of small business information, referral, mentoring service and business programs
per cent 94 90 4.4
Client satisfaction with the Victorian Government Business Offices
per cent 91 80 14.1
Proactive engagement with businesses and successful outcomes from government supported interventions.
Client satisfaction with Victorian Small Business Commission mediation service
per cent 95 85 11.8
Reflects mediation participants’ positive view of the VSBC’s processes in arranging and conducting efficient, timely and
33
Document titleSub title
high-quality mediations.
Proportion of business disputes presented to the Small Business Commission successfully mediated
per cent 78 75 4.3
COST
Total output cost $ million 144.3 217.0 -33.5
The 2017–18 result was lower than budget primarily due to a rephase in the Future Industries Fund.
Note: Performance target achieved or exceeded Performance target not achieved – within 5 per cent variance Performance target not achieved – exceeds 5 per cent variance
Table 26 represents performance against the Jobs and Investment output. This output includes initiatives to support job growth and connect people to job opportunities. It also provides investment attraction and facilitation services to attract new investment and encourage additional investment by companies already operating in Victoria.
Table 26 Output: Jobs and InvestmentPerformance measures Unit of
measure2017–18 actual
2017–18 target
Performance variation (%)
Result
QUANTITY
Disadvantaged jobseekers who achieve sustainable employment (minimum number of 26 weeks)
number 1,527 1,500 1.8
Government Youth Employment Scheme traineeships commenced
number 289 280 3.2
Jobs resulting from government investment facilitation services and assistance
number 6,510 5,000 30.2
Reflects a number of projects with large employment outcomes such as Livetiles 500 jobs.
New Australian/International regional headquarters of firms and/or research development centres attracted to Victoria
number 18 7 157.1
A number of IT companies established their headquarters in Victoria.
New investment resulting from government facilitation services and assistance
$ million 2,469 2,300 7.3
A small number of projects had a larger capital investment than the standard project outcomes.
Retrenched workers supported with employment assistance number 2,052 2,000 2.6
Social enterprises assisted number 131 40 227.5
Higher than expected uptake of Boost Your Business Voucher Program - Social Enterprise Stream and number of social enterprises seeking certification.
34
Document titleSub title
Victoria’s market share of nominated investor and business migrants
per cent 45 50 -10.0
Other jurisdictions have increased their participation in this program.
Visits to the Invest Victoria website number 145,162 70,000 107.4
A range of factors contributed to an increase in website traffic, including an increase in LinkedIn followers and a significant increase in visits to the news section.
QUALITY
Client satisfaction with investor, business and skilled migration services provided
per cent 89 85 4.7
Client satisfaction with services delivered to support industry transition
per cent 93 85 9.4
The satisfaction of retrenched workers with support provided through the Workers in Transition information sessions was particularly high.
TIMELINESS
Average processing time for investor, business and skilled migration visa nomination applications
days 20 20 0.0
COST
Total output cost $ million 200.1 222.7 -10.2
The 2017–18 result was lower than budget primarily due to a rephase in the Premier’s Jobs and Investment Fund.
Note: Performance target achieved or exceeded Performance target not achieved – within 5 per cent variance Performance target not achieved – exceeds 5 per cent variance
Table 27 represents performance against the Major Projects output. This output facilitates growth and investment in the Victorian economy through the development, delivery and management of significant economic projects.
Table 27 Output: Major ProjectsPerformance measures Unit of
measure2017–18 actual
2017–18 target
Performance variation (%)
Result
QUANTITY
Number of economic projects in delivery number 15 15 0.0
QUALITY
Economic projects being delivered in accordance with contracted cost (within 5 per cent variation)
number 10 10 0.0
Economic projects being delivered in accordance with contracted scope
number 10 10 0.0
TIMELINESS
35
Document titleSub title
Economic projects being delivered in accordance with contracted timelines (within 5 per cent variation)
number 10 10 0.0
COST
Total output cost $ million 7.8 8.6 -9.6
The 2017–18 result was lower than budget primarily due to lower expenditure for the Princes Pier Restoration.
Note: Performance target achieved or exceeded Performance target not achieved – within 5 per cent variance Performance target not achieved – exceeds 5 per cent variance
Table 28 represents performance against the Regional Development output. This output guides engagement with industry and communities to identify and deliver priorities for managing growth and change in regional and rural Victoria. It provides support and services to create jobs and improve career opportunities for regional Victorians.
Table 28 Output: Regional DevelopmentPerformance measures Unit of
measure2017–18 actual
2017–18 target
Performance variation (%)
Result
QUANTITY
Actual export sales generated for regional businesses as a result of participation in government programs
$ million 58 50 16.3
Strong results from several long-term projects in the food and fibre sector.
Economic development and service delivery projects supported
number 218 120 81.7
Numerous smaller projects with a lower capital value.
Jobs in regional Victoria resulting from government investment facilitation services and assistance
number 1,779 1,200 48.3
A number of projects with large employment outcomes such as Livetiles 500 jobs.
New investment in regional Victoria resulting from government facilitation services and assistance
$ million 709 700 1.3
QUALITY
Participant satisfaction with implementation of Regional Development Victoria programs
per cent 92 90 2.2
COST
Total output cost $ million 201.6 230.7 -12.6
The 2017–18 result was lower than budget primarily due to the rephase of various programs into future years.
Note: Performance target achieved or exceeded Performance target not achieved – within 5 per cent variance Performance target not achieved – exceeds 5 per cent
36
Document titleSub title
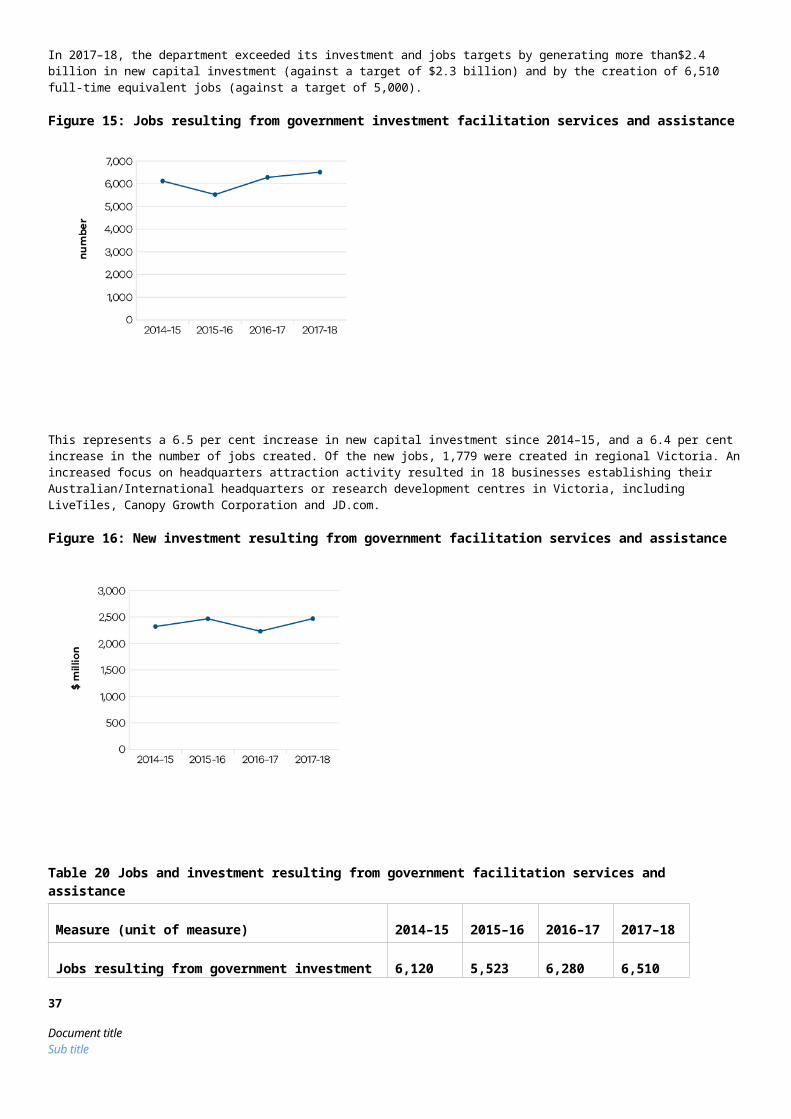
variance
Table 29 represents performance against the Trade output. This output promotes business growth opportunities by connecting organisations to global business opportunities in priority markets and supporting the establishment and deepening of strategic commercial partnerships.
Table 29 Output: TradePerformance measures Unit of
measure2017–18 actual
2017–18 target
Performance variation (%)
Result
QUANTITY
Actual export sales generated as a result of participation in government programs
$ million 807 450 79.3
Strong results were reported by companies assisted through Government trade and investment programs.
Clients engaged in export and trade programs number 2,783 2,500 11.3
Significantly higher than expected participation by Victorian organisations in International Mining and Resources Conference (IMARC) 2017 and strong interest from companies in the Victorian eCommerce network initiative.
International delegates participated in the inbound trade mission program
number 653 550 18.7
Higher than expected interest in the Government’s Victoria Invitation Program inbound missions (VIP Showcase, International Mining and Resources Conference (IMARC) 2017 and Food and Beverage Trade Week).
Significant interactions with Victorian agri-food companies and exporters, international customers and trading partners that facilitate export and investment outcomes for Victoria
number 269 250 7.6
Stronger than expected interest in the Government’s food and fibre inbound and outbound mission program.
QUALITY
Client satisfaction with export assistance offered per cent 95 90 5.6
High quality of service provided along with a focus on individualised service through Access and Trade Mission programs(Inbound and Outbound) have resulted in higher levels of satisfaction with companies participating in programs.
COST
Total output cost $ million 21.4 26.6 -19.5
The 2017–18 result was lower than budget primarily due to timing differences in expenditure.
Note: Performance target achieved or exceeded Performance target not achieved – within 5 per cent variance Performance target not achieved – exceeds 5 per cent variance
37
Document titleSub title
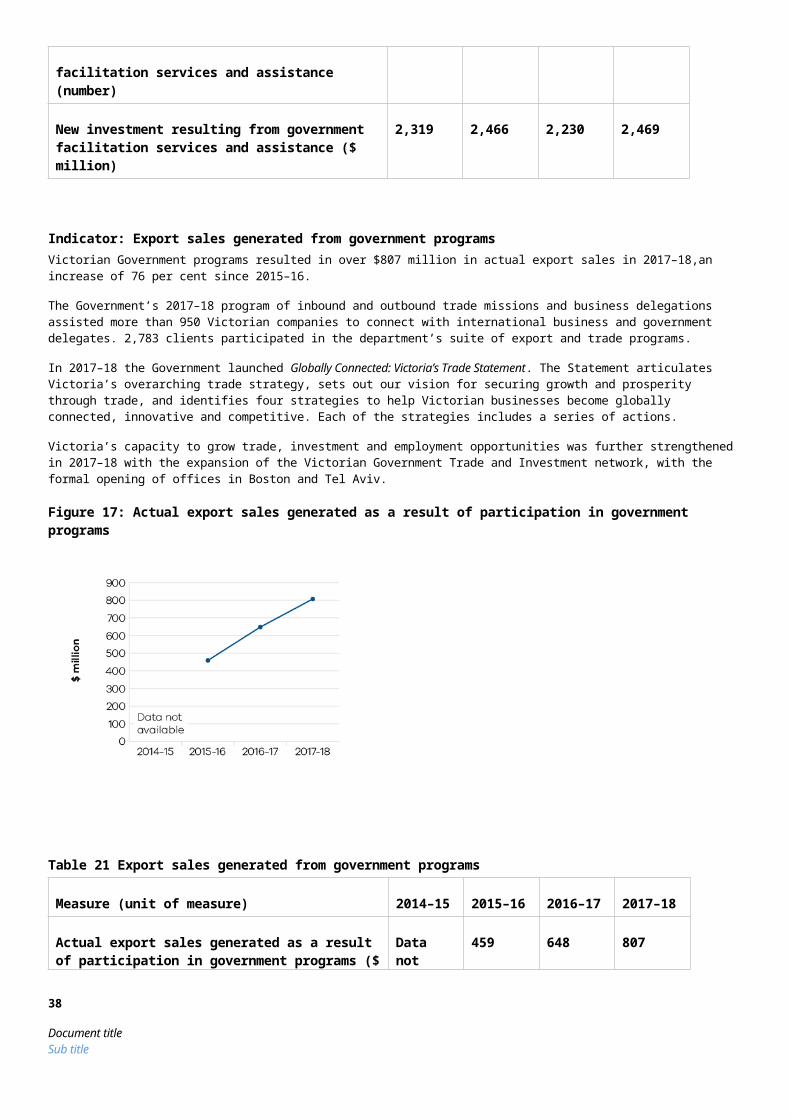
Objective 4More productive and liveable places, towns and cities through integrated and user-focused transport services and better infrastructure
The department seeks to enhance social and economic prosperity and liveability through integrating transport services focused on the needs of the user, together with better infrastructure. The department achieves this objective by providing safe, cost-effective, integrated and reliable transport, supported by improved infrastructure, through Transport for Victoria (TfV) and its portfolio agencies.
TfV was created in 2017 to provide a world-class integrated transport system that puts the user at the centre. TfV is responding to record population growth by providing additional infrastructure, extra services and smarter ways of managing the network to improve capacity and punctuality.
Progress towards achieving departmental objectives In 2017–18, the department reported progress against this objective using the following objective indicators and outputs:
Objective indicators Improved transport infrastructure
Safety of the transport system
User satisfaction with the transport system
Reliable travel
Outputs Bus Services
Integrated Transport
Port and Freight Network Access
Road Asset Management
Road Operations and Network Improvements
Taxi and Hire Vehicle Services
Train Services
Tram Services
Transport Safety, Security and Emergency Management
Indicator: Improved transport infrastructureWork is well underway to provide regional customers with access to more and better trains, with the first of 39 VLocity regional carriages announced in the 2017–18 Budget arriving in September 2018. Customers in Wyndham Vale and Seymour will receive more services. Funding has been provided for the next stage of the Shepparton Line Upgrade, including upgrades to level crossings and other infrastructure improvements to enable the introduction of VLocity trains to the line for the first time. This will provide customers with more modern trains and support improved services.
The level crossing removal program, now reaching its half way mark, is making communities all over Melbourne safer and less congested and will complement other major infrastructure upgrades, including the Metro Tunnel. These major infrastructure initiatives are delivering the transport system required to drive economic prosperity and keep communities connected.
A range of projects is also delivering improved transport infrastructure and connectivity. The Gippsland Rail Corridor Station Upgrade is progressing, with construction at Traralgon and Trafalgar stations nearing completion. Customers at several Gippsland stations will have access to additional parking spaces, improved disability access, waiting areas and bus facilities. Interchanging between train and bus will be easier for passengers in Ballarat when the upgrade to the bus interchange at Ballarat Station is completed. New or improved stations have also been opened at Southland and Frankston. Funding has also been provided as part of the 2018–19 Budget for pre-procurement activities for new regional trains and planning for the next generation tram.
In addition to the major public transport initiatives, in excess of $6 billion has been invested over the last four budgets in major new road projects to transform the road network, including the West Gate Tunnel, North East Link, M80 Ring Road Upgrade, CityLink Tulla Widening project, the Suburban Roads Upgrade and the Mordialloc Freeway Bypass.
38
Document titleSub title
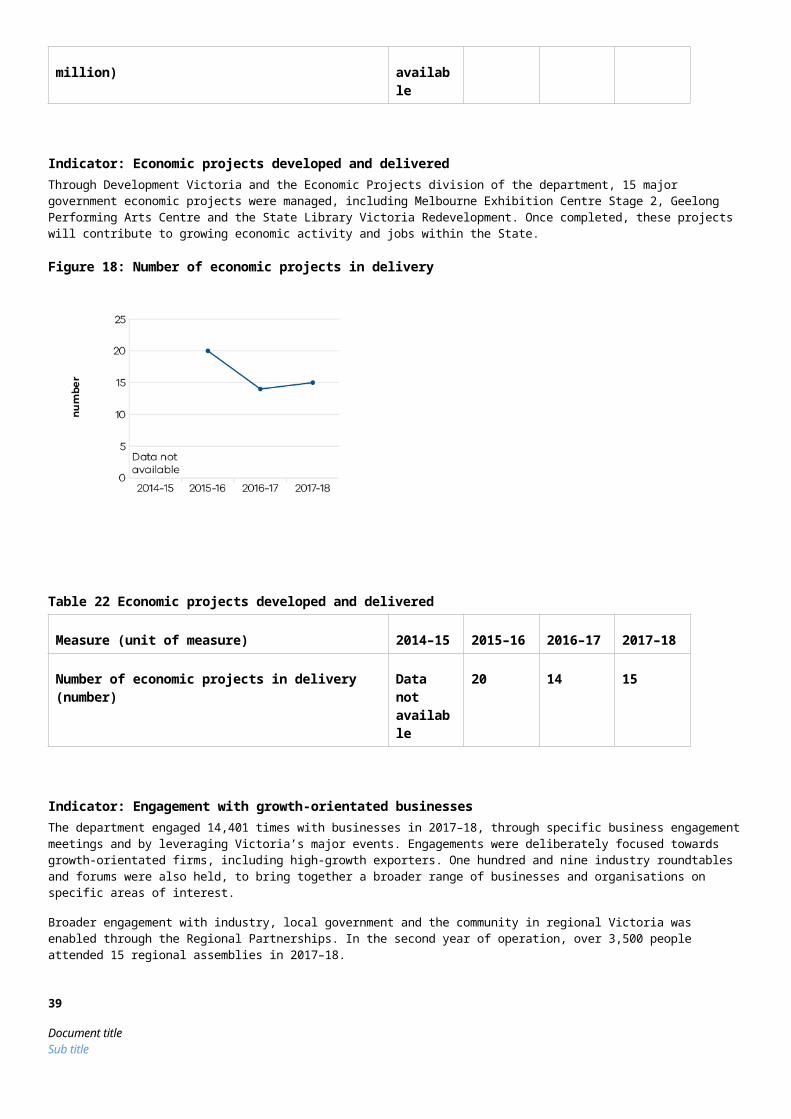
Population growth and a strong economy has also driven an increase in freight traffic through the Port of Melbourne during 2017–18, with full container trade for the 10 months of this financial year increasing by 8.4 per cent and non-containerised trade by 11 per cent. This may be attributed to more of the network being opened up for high productivity freight use and the Government’s commitment to support the efficient movement of freight across Victoria. Access to the port will be improved by standardising the regional rail network. In February 2018 the Murray Basin rail project achieved a key milestone with the first ever standard gauge train running from Mildura to the Port of Melbourne via Ararat. This is helping regional businesses get their goods to market more quickly.
The Government continues to invest a significant amount of resources to improve the condition of roads in metropolitan and regional Victoria. The new cracking, rutting and roughness measures provide more detail on the overall condition of roads.
Figure 20: Transport projects completed within agreed scope, timeframes and budget 1
1. All projects were completed in 2017–18 but the lower figure reflects the fact that several projects were completed later than the scheduled completion date.
Table 30: Improved transport infrastructure Measure (unit of measure) 2014–15 2015–16 2016–17 2017–18
Percentage length meeting cracking standard: metropolitan (per cent) Data not available
Data not available
Data not available
77.9
Percentage length meeting rutting standard: metropolitan (per cent) Data not available
Data not available
Data not available
96.4
Percentage length meeting roughness standard: metropolitan (per cent) Data not available
Data not available
Data not available
93.2
Percentage length meeting cracking standard: regional (per cent) Data not available
Data not available
Data not available
96.3
Percentage length meeting rutting standard: regional (per cent) Data not available
Data not available
Data not available
97.8
Percentage length meeting roughness standard: regional (per cent) Data not available
Data not available
Data not available
96.0
Transport projects completed within agreed scope, timeframes and budget (per cent)
Data not available
75 67 63
39
Document titleSub title
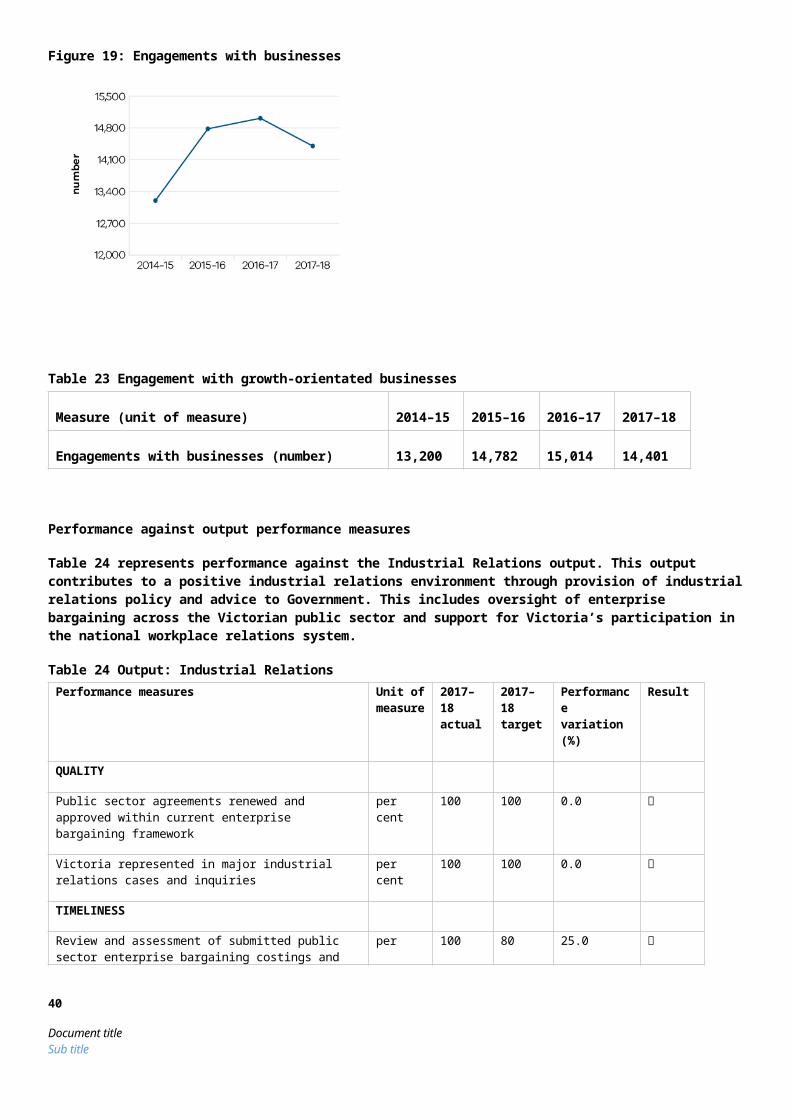
Indicator: Safety of the transport systemImproving the safety of train passengers is being pursued through rail safety projects. The Safer Country Crossings Program, which is ahead of schedule, saw 61 crossings completed by the end of 2017–18, including Warrnambool. Other projects commenced during the year included expansion of the Train Protection Warning System and reduction of train station platform gaps.
Safety, and improving the health of Victorians,has also been assisted by the completion of growing numbers of projects for cyclists and pedestrians. Active transport users are benefiting from the implementation of initiatives flowing from the $100 million Safer Cyclists and Pedestrians Fund. The Victorian Cycling Strategy 2018–28 will guide planning and investment in cycling for the next decade.
At the same time, the department continues to implement a broad range of safety initiatives, including the Towards Zero campaign, with its aim of reducing fatalities on the roads by 20 per cent in the next two to four years.
For the second year running, there was a decrease in the road fatality rate per 100,000 population.
Fatalities on the transport network have fallen in the past year to record the lowest figure in four years.
Table 31: Safety of the transport system Measure (unit of measure) 2014–
152015–16
2016–17
2017–18
Fatalities on the transport network1 (number) 256 270 271 242
Victorian road fatality rate per 100,000 population (number) 4.3 4.4 4.3 3.8
Serious injuries on the transport network2 (number) 5,035 4,790 4,479 Data available in January 2019
Victorian road serious injury rate per 100,000 population3 (number) 83.6 77.2 70.7 Data available in January 2019
1 The 2015–16 figure has been revised as a result of findings during the investigation process into road and rail fatalities. Data is subject to change as it is checked and validated over time.
2 The 2015–16 figures have been revised as a result of investigations leading to some serious injuries for roads and rail being reclassified as fatalities or other categories. Data is subject to change as it is checked and validated over time.
3 The 2014–15 and 2015–16 figures have been revised as a result of investigations leading to some serious injuries for roads being reclassified and population estimates adjusted.
Figure 21: Fatalities on the transport network
40
Document titleSub title
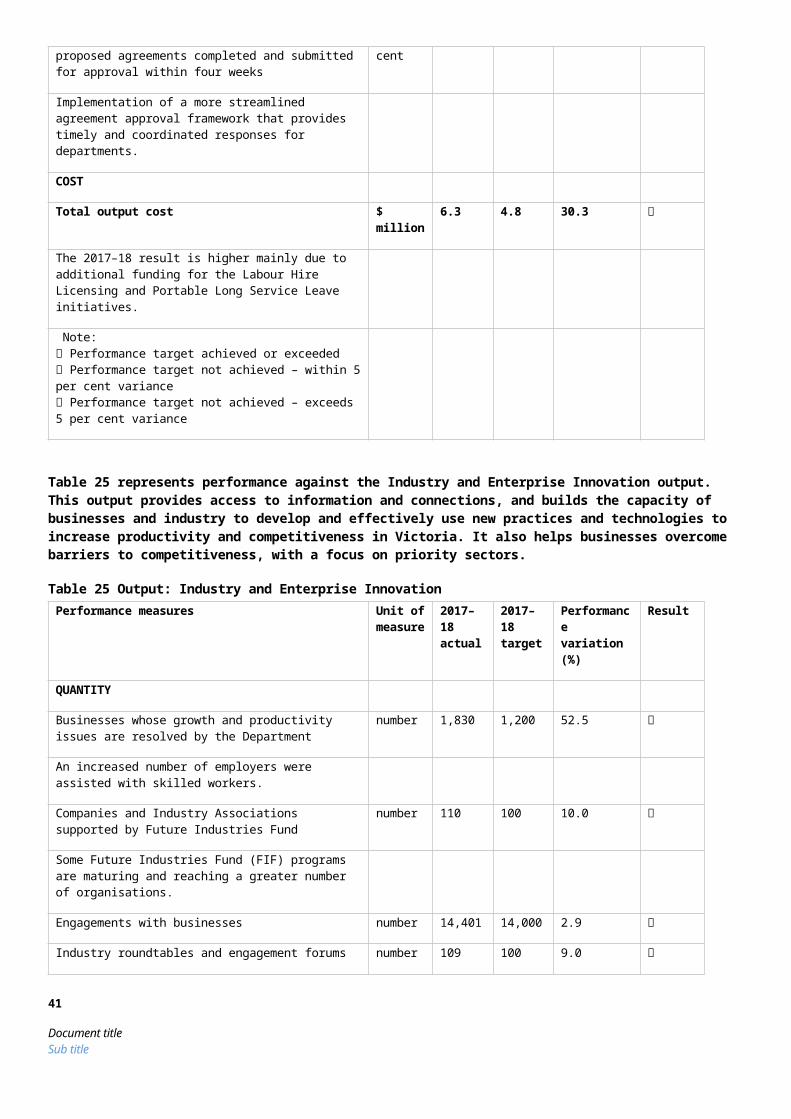
Figure 22: Victorian road fatality rate per 100,000 population
Figure 23: Serious injuries on the transport network
Figure 24: Victorian road serious injury rate per 100,000 population
41
Document titleSub title
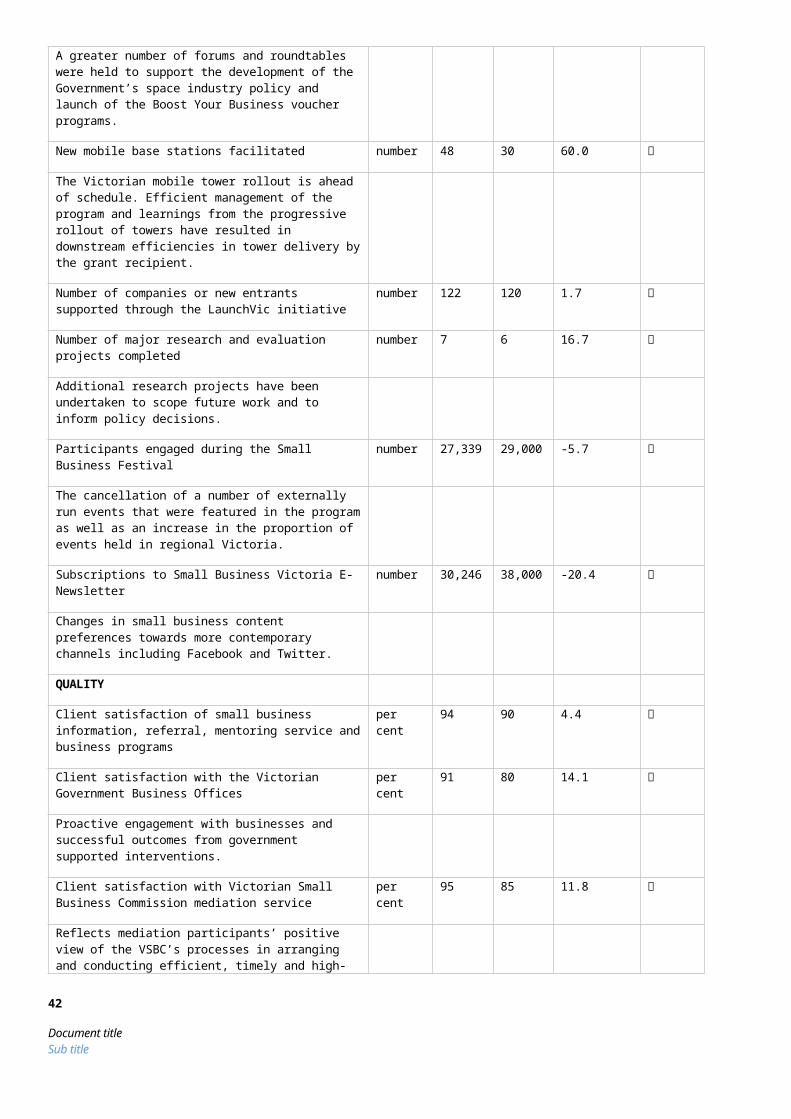
Indicator: User satisfaction with the transport systemThe growing population in the metropolitan area is enjoying the benefits of the growing fleet of E-class trams and nine more X’Trapolis trains, supporting the gradual rise in the uptake of public transport passenger numbers. The next steps to addressing overcrowding and improving travel times have commenced, with manufacturing of the first High Capacity Metro trains commencing at the Newport workshops in June 2018, and components also being produced in the regional towns of Bendigo, Hallam and Morwell. These trains will be able to carry 20 per cent more passengers and include new signalling capabilities that will enable them to run more frequently once Metro Tunnel opens.
Despite the necessary disruptions caused by Victoria’s Big Build, customer satisfaction remains high in our transport services, with improved customer satisfaction for metropolitan public transport services. Metropolitan train services in particular have shown consistent improvement in each of the last four years. TfV continues to address factors including train and infrastructure faults and heat related speed restrictions in the warmer months that have influenced regional customer satisfaction levels.
To further address the changes and growth in population, over the last three years, public transport users have benefited from almost 600 extra public transport services in regional Victoria and over 5,000 in Melbourne, including the introduction of five new bus routes in 2017–18. In 2017–18 alone, this has resulted in the scheduling of over 6 million kilometres of additional scheduled public transport services across the state.
User experience and safety are some of the key drivers in the transformation of the taxi and hire car industry. Legislation was passed in 2017 to facilitate the establishment of Commercial Passenger Vehicles Victoria (CPVV, formerly the Taxi Services Commission) to focus on ensuring a safe, accessible and user-focused commercial passenger vehicle industry. The Government has recognised world-wide changes in the taxi and hire car (including rideshare) industry by passing the Commercial Passenger Vehicle Industry Amendment (Further Reforms) Act 2017. The reforms and resulting competition will put people first, by providing more choice for consumers, lower fares and more wheelchair accessible vehicles. Current taxi performance measures show a small improvement in wait times for wheelchair-accessible services and a significant rise in wheelchair and scooter lifting fees paid as part of the Multi-Purpose Taxi Program, reflecting increased demand for services. Wait times for conventional taxis also showed a slight improvement.
Customer satisfaction has improved for most modes across the network despite customers facing delays due to infrastructure improvements.
Table 32: User satisfaction with the transport system Measure (unit of measure) 2014–15 2015–16 2016–17 2017–18
Customer satisfaction index: metropolitan train (score) 72 72 73 74
Customer satisfaction index: metropolitan bus (score) 76 77 76 77
Customer satisfaction index: tram (score) 75 76 76 77
Customer satisfaction index: regional train (score) 76 76 76 75
Customer satisfaction index: regional coach (score) 83 82 82 82
42
Document titleSub title
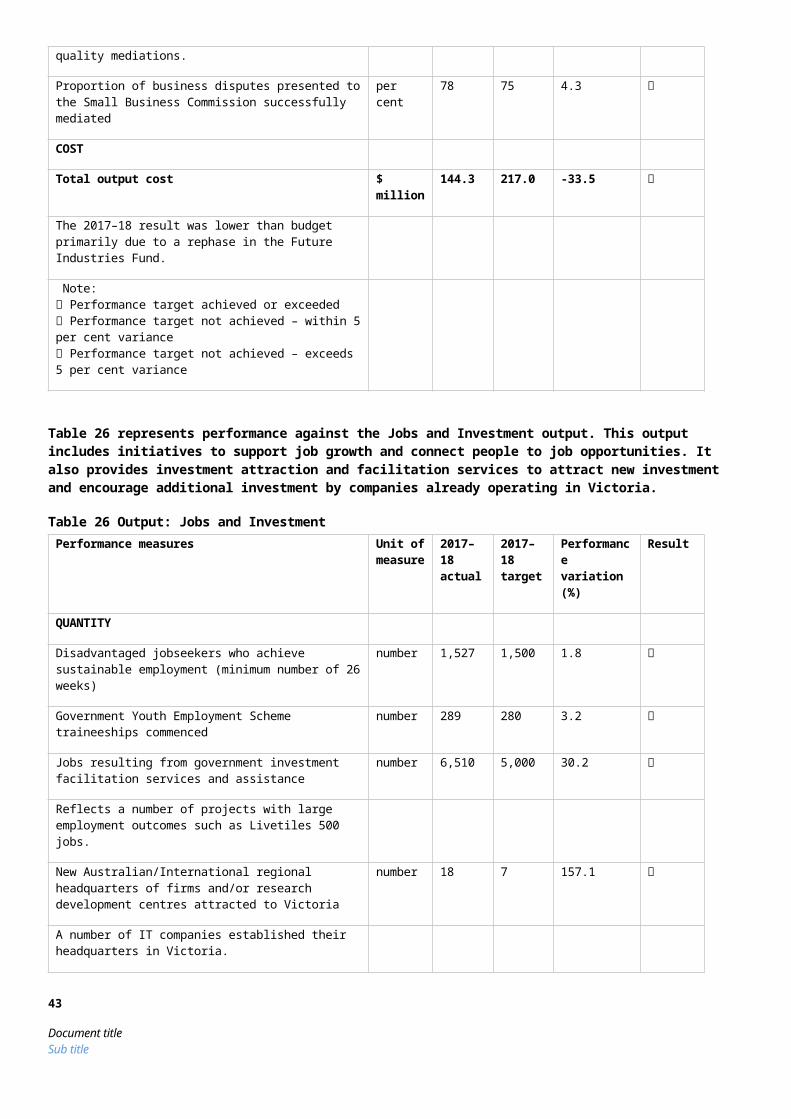
Figure 25: Customer satisfaction index: metropolitan and regional train
Figure 26: Customer satisfaction index: metropolitan bus and regional coach
Figure 27: Customer satisfaction index: tram
43
Document titleSub title
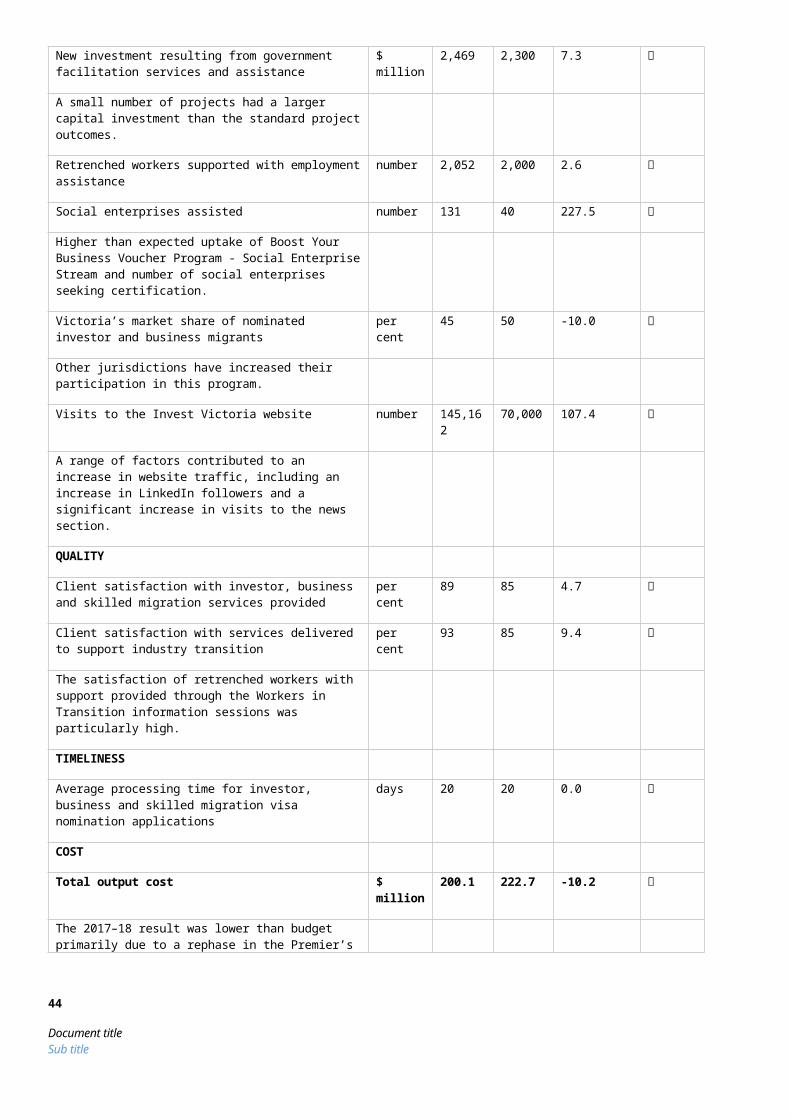
Indicator: Reliable travelThe focus on the user has seen tougher performance goals set for public transport operators under the new train and tram contracts which came into effect on 30 November 2017. Bus contract negotiations are also underway, paving the way for future route reform to improve outcomes for users. Those contracts already agreed include a new performance-based contract with Skybus which will see more flexibility and expanded services for Victorians living in the growing outer suburbs. Public transport users have received a better service, with more trains and fewer delays, with a minimum delivery of 99 per cent of metropolitan services.
Metropolitan road efficiency, as measured through travel time punctuality on roads, continued to decrease over the last year, due to congestion and the impact of disruptions arising from the major transport infrastructure projects currently in delivery. This underlines the need for the major projects now in progress, as well as the cycling, pedestrian and active transport initiatives being implemented to encourage people to think of alternatives to public transport and cars to reach their destination, where feasible to do so.
Service punctuality on the metropolitan train and tram networks has remained relatively steady, with minor improvements. A minor fall in performance was experienced in regional train punctuality due to heat-related speed restrictions, infrastructure and train faults.
Table 33: Reliable travelMeasure (unit of measure) 2014–15 2015–16 2016–17 2017–18
Service punctuality: metropolitan train (per cent) 92.7 92.5 91.8 91.9
Service punctuality: metropolitan bus1 (per cent) 93 79 81 81
Service punctuality: tram (per cent) 83.0 83.7 82.6 81.7
Service punctuality: regional train (per cent) 90 87 85 84
Service punctuality: regional bus (per cent) 95 95 95 94
Scheduled services delivered: metropolitan train (per cent) 99 99 99 99
Scheduled services delivered: metropolitan bus (per cent) 99.9 99.9 99.9 99.9
Scheduled services delivered: tram (per cent) 99.1 98.8 98.6 98.5
Scheduled services delivered: regional train (per cent) 98.6 96.6 97.8 97.0
Scheduled services delivered: regional bus (per cent) 99 100 99 100
Travel time punctuality: metropolitan roads (per cent) 83.1 80.3 75.9 74.1
1 In 2015–16 an electronic bus tracking system was introduced to more accurately record bus movements. Previous methodology consisted of self-reporting which only measured 5 per cent of services.
44
Document titleSub title
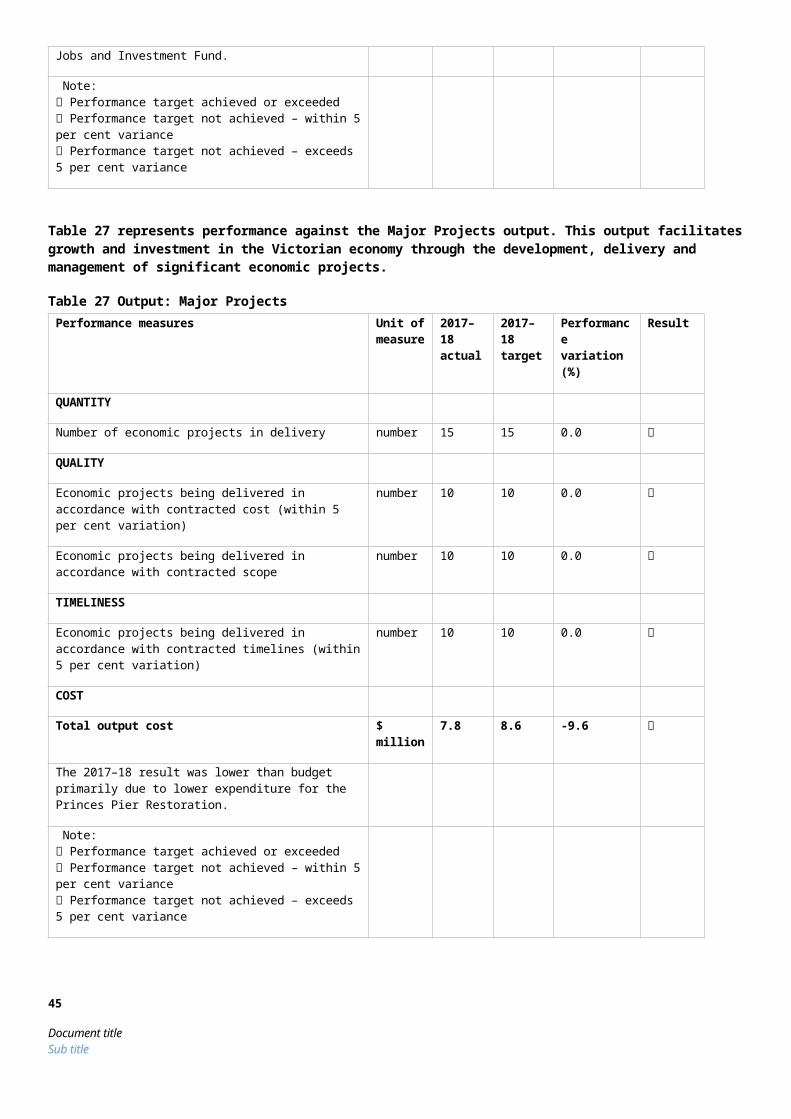
Figure 28: Service punctuality: metropolitan and regional train
Figure 29: Service punctuality: metropolitan and regional bus 1
1. In 2015–16 an electronic bus tracking system was introduced to more accurately record bus movements. Previous methodology consisted of self-reporting which only measured 5 per cent of services.
Figure 30: Service punctuality: tram
45
Document titleSub title
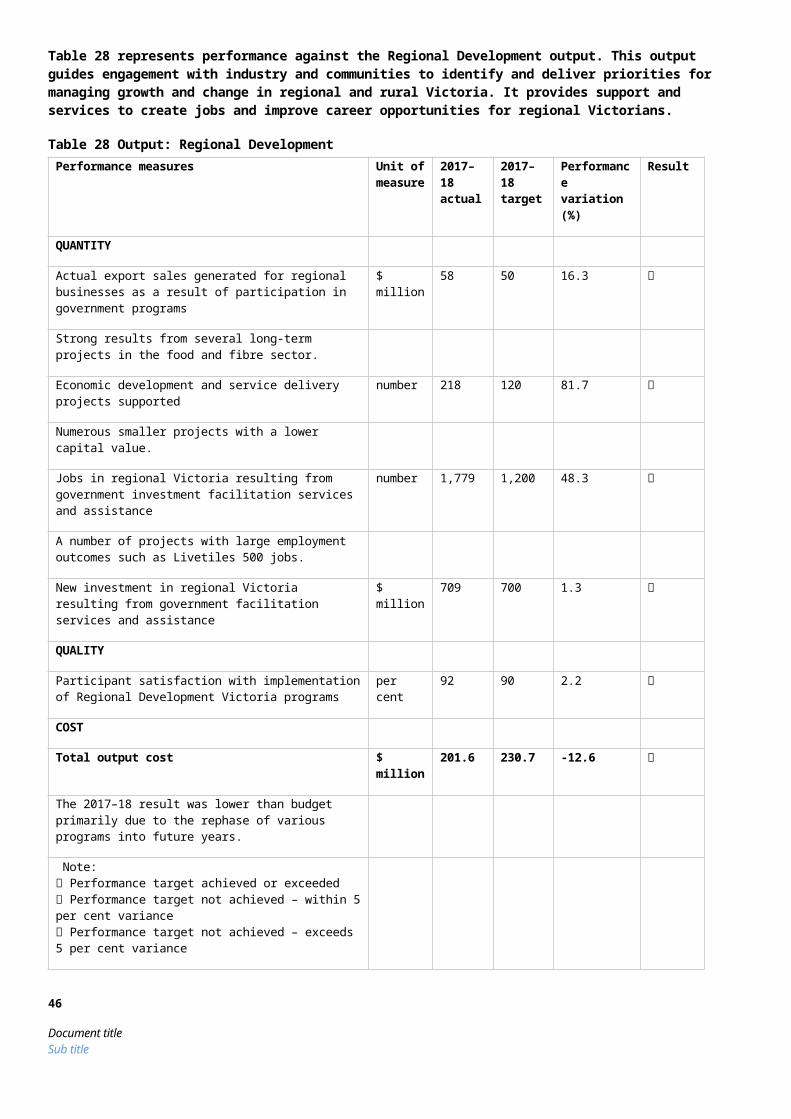
Figure 31: Scheduled services delivered: metropolitan and regional train
Figure 32: Scheduled services delivered: metropolitan and regional bus
46
Document titleSub title
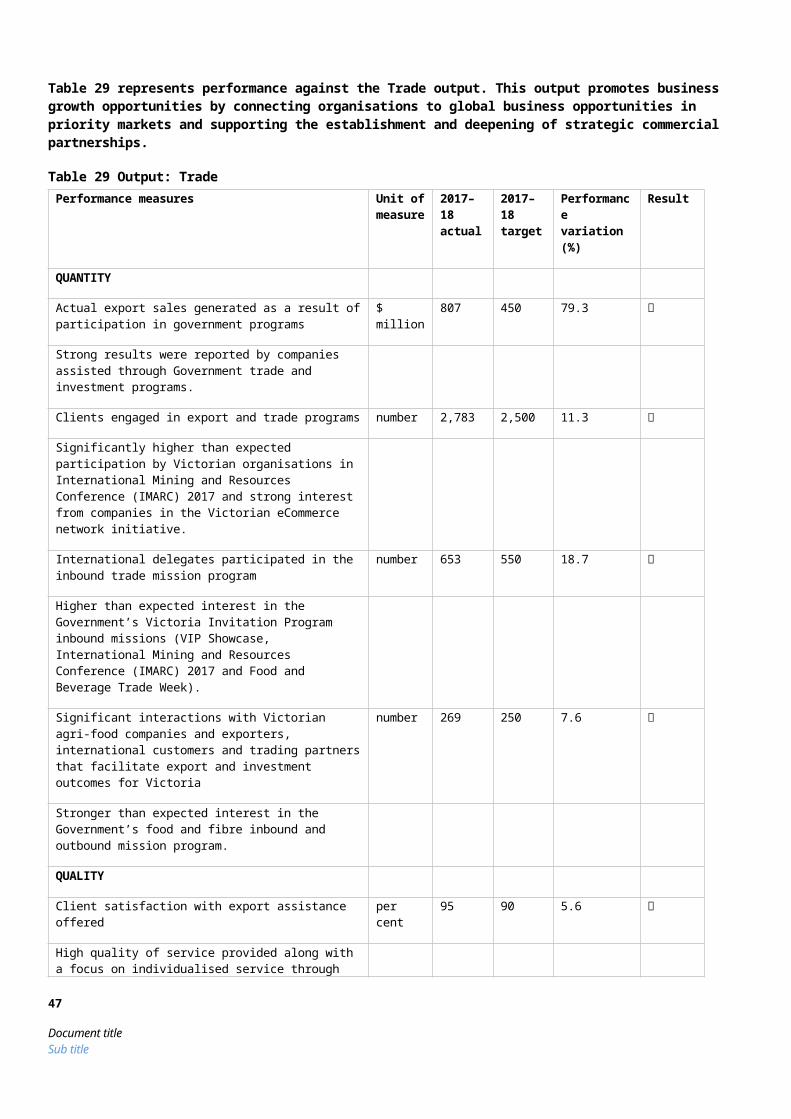
Figure 33: Scheduled services delivered: tram
Figure 34: Travel time punctuality: metropolitan roads
47
Document titleSub title

Performance against output performance measures
Table 34 represents performance against the Bus Services output. This output delivers reliable and cost effective statewide bus services and infrastructure investments, including services delivered through contractual arrangements with private operators.
Table 34 Output: Bus ServicesPerformance measures Unit of
measure2017–18 actual
2017–18 target
Performance variation (%)
Result
QUANTITY
Passengers carried: metropolitan bus services number (million)
117.8 126.4 -6.8
Lower than forecast growth in patronage and the impact of infrastructure upgrades. Soft metropolitan bus patronage of 2016–17 has continued into 2017–18 and is also compounded by the impact of network disruptions in 2017–18.
Passengers carried: regional bus services number (million)
12.5 15.1 -17.2
Implementation of a new, more accurate methodology for measuring regional bus patronage. The revised methodology incorporates myki-based survey data, following the extension of myki to regional bus town centres.
Payments made for: metropolitan bus services $ million 678 680 -0.4
Payments made for: regional bus services $ million 121 118 2.7
Public transport network improvement: minor projects completed – bus
number 6 3 100.0
Completion of three projects carried over from 2016–17. This performance measure records the number of minor projects that have a budget of $50 million or less.
Scheduled services delivered: metropolitan bus per cent 99.9 99.9 0.0
Scheduled services delivered: regional bus per cent 100 99 1.0
48
Document titleSub title
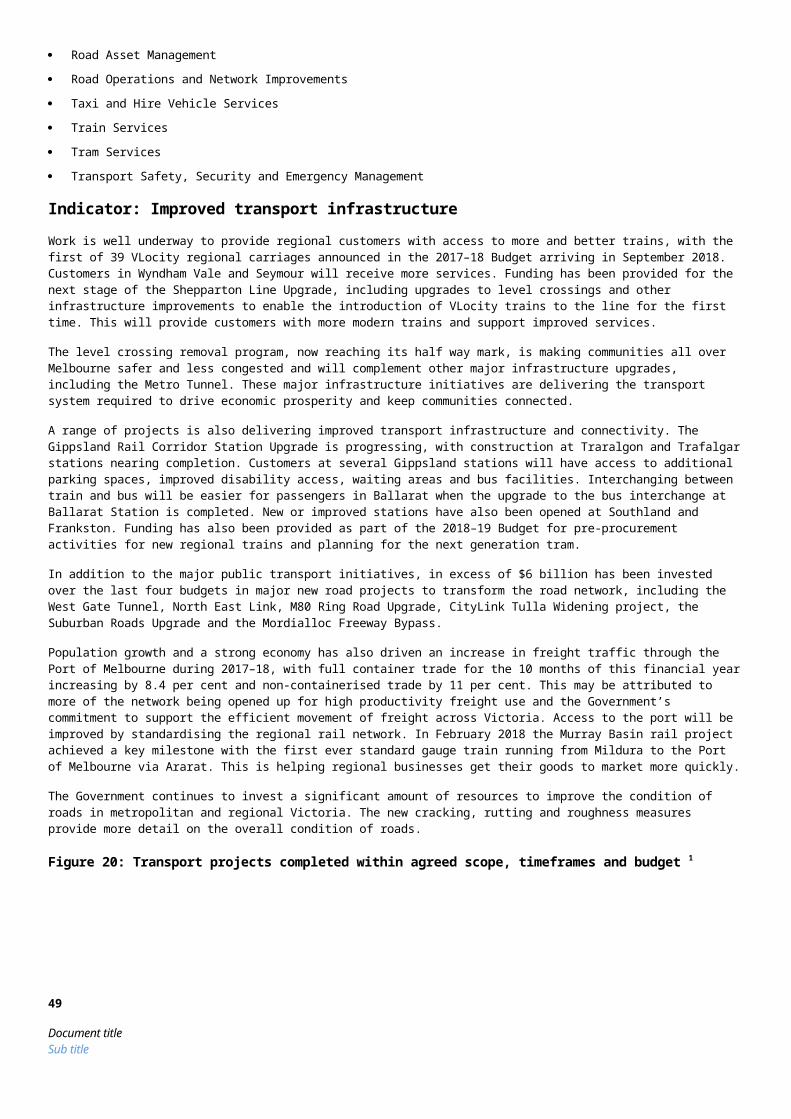
Scheduled services delivered: school bus per cent 98 99 -1.0
Total kilometres scheduled: metropolitan bus km (million)
119.8 119.9 -0.1
Total kilometres scheduled: regional bus km (million)
25.7 26.4 -2.7
Total kilometres scheduled: school bus km (million)
32.0 31.1 3.0
QUALITY
Customer satisfaction index: metropolitan bus services score 77 77 -0.1
Customer satisfaction index: regional coach services score 82 84 -1.9
TIMELINESS
Service punctuality for: metropolitan bus services per cent 81 82 -1.5
Metropolitan buses are on-time when services depart from timing points no more than 59 seconds early and no more than four minutes and 59 seconds late at key monitoring points.
Service punctuality for: regional bus services per cent 94 92 2.2
Regional buses are on-time when services depart from timing points no more than 59 seconds early and no more than four minutes and 59 seconds late at key monitoring points.
COST
Total output cost $ million 1,135.0 1,169.2 -2.9
Note: Performance target achieved or exceeded Performance target not achieved – within 5 per cent variance Performance target not achieved – exceeds 5 per cent variance
Table 35 represents performance against the Integrated Transport output. This output delivers strategic transport infrastructure activity to improve the transport system. The output contributes to the department’s objective to create more productive and liveable cities and regions through improved transport services and better infrastructure.
Table 35 Output: Integrated TransportPerformance measures Unit of
measure2017–18 actual
2017–18 target
Performance variation (%)
Result
QUANTITY
Integrated transport planning to support urban renewal projects
number 6 6 0.0
Level Crossing Removal Program: Milestones delivered in accordance with agreed budget and timelines
per cent 100 100 0.0
Planning projects for other major transport infrastructure number 5 5 0.0
49
Document titleSub title

QUALITY
Ballarat Line Upgrade – planning and development: Milestones delivered in accordance with agreed budget and timelines
per cent 100 100 0.0
Melbourne Metro Rail Project – planning and development: Milestones delivered in accordance with agreed budget and timelines
per cent 100 100 0.0
COST
Total output cost $ million 170.9 64.4 165.4
The 2017–18 result was higher than budget mainly due to a change in the accounting treatment for some major transport infrastructure expenditure.
Note: Performance target achieved or exceeded Performance target not achieved – within 5 per cent variance Performance target not achieved – exceeds 5 per cent variance
Table 36 represents performance against the Port and Freight Network Access output. This output delivers capital initiatives and programs to increase the capacity, efficiency and safety of the ports, freight and logistics network.
Table 36 Output: Port and Freight Network AccessPerformance measures Unit of
measure2017–18 actual
2017–18 target
Performance variation (%)
Result
QUANTITY
Annual Boating Safety and Facilities Grant Program funding committed
per cent 100 100 0.0
Containers transported by rail under the Mode Shift Incentive Scheme program
number 56,950 42,500 34.0
Success of the Scheme in promoting additional container movements beyond the target.
Number of months per year average channel depth at Lakes Entrance meets standards
number 12 9 33.3
A new, purpose-built dredge is permanently based at Lakes Entrance.
Road-based freight accessibility and reliability improvement projects completed
number 11 16 -31.3
Primarily due to revised project scope and delays with subcontractors.
QUALITY
Number of accessible local ports number 14 14 0.0
Road network permitted for use by high productivity freight vehicles
per cent 14 10 38.0
More of the network being opened up for high productivity freight use.
50
Document titleSub title
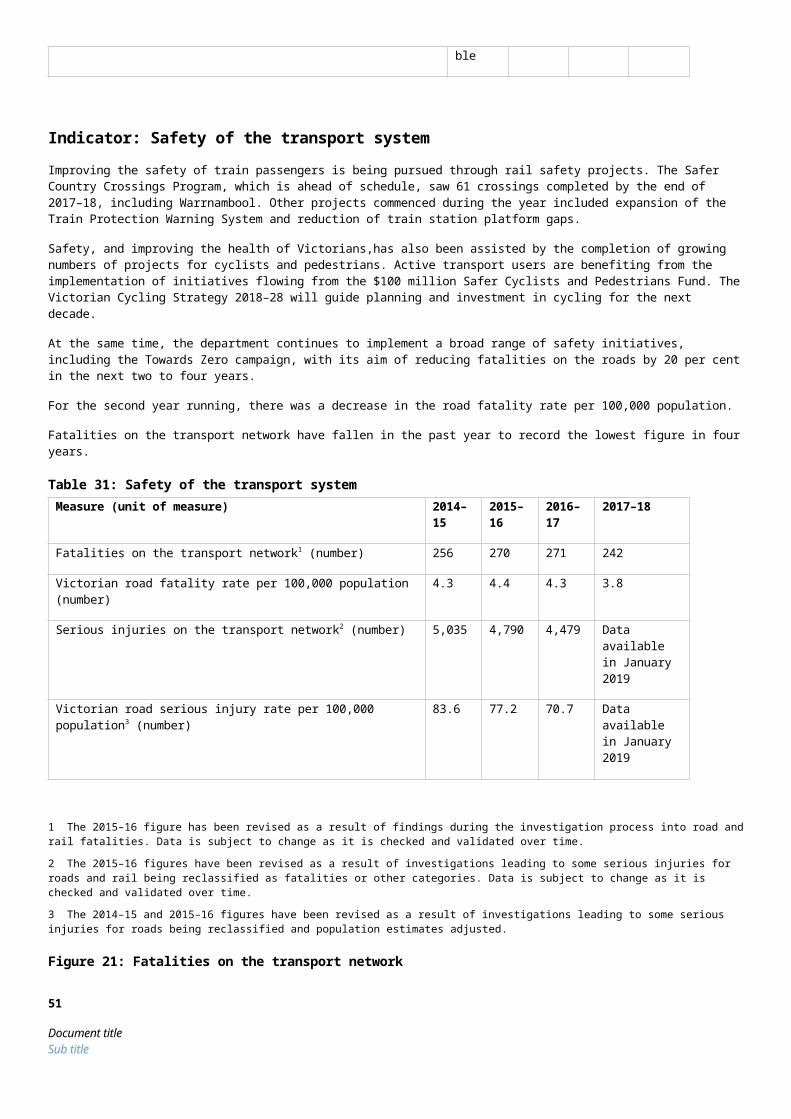
Road-based freight accessibility and reliability projects completed within specified scope and standards
per cent 100 100 0.0
TIMELINESS
Delivery of a Metropolitan Intermodal System – Market Engagement
date 20/06/18 TBC 0.0
Road-based freight accessibility and reliability projects completed within agreed timeframes
per cent 100 100 0.0
COST
Total output cost $ million 115.0 104.0 10.6
The 2017–18 result was higher than budget mainly due to increased funding for the National Heavy Vehicle Regulator, Echuca Moama Bridge and Boat and Safety Funding Program.
Note: Performance target achieved or exceeded Performance target not achieved – within 5 per cent variance Performance target not achieved – exceeds 5 per cent variance
Table 37 represents performance against the Road Asset Management output. This output group delivers programs and initiatives to maintain Victoria’s freeways and arterial road network. Activities support the safety and reliability of the network.
Table 37 Output: Road Asset ManagementPerformance measures Unit of
measure2017–18 actual
2017–18 target
Performance variation (%)
Result
QUANTITY
Bridges maintained: metropolitan number 964 927 4.0
Bridges maintained: regional number 2,270 2,255 0.7
Road area treated: high strategic priority roads m2 (000) 6,634 8,846 -25.0
New measure to provide greater transparency of investments in road treatments to maintain or extend the useful life of a road. Road treatments include pavement resurfacing and rehabilitation. Roads are allocated to road maintenance categories based on road connectivity, the number of vehicles using the road per day, and commercial vehicle usage. On-site inspections identified a lower area requiring treatment on high strategic priority roads.
Road area treated: low strategic priority roads m2 (000) 608 11 5,427.3
New measure to provide greater transparency of investments in road treatments to maintain or extend the useful life of a road. Road treatments include pavement resurfacing and rehabilitation. Roads are allocated to road maintenance categories based on road connectivity, the number of vehicles using the road per day, and commercial vehicle usage. Treatments to address safety concerns associated with roads with low skid resistance were prioritised.
51
Document titleSub title
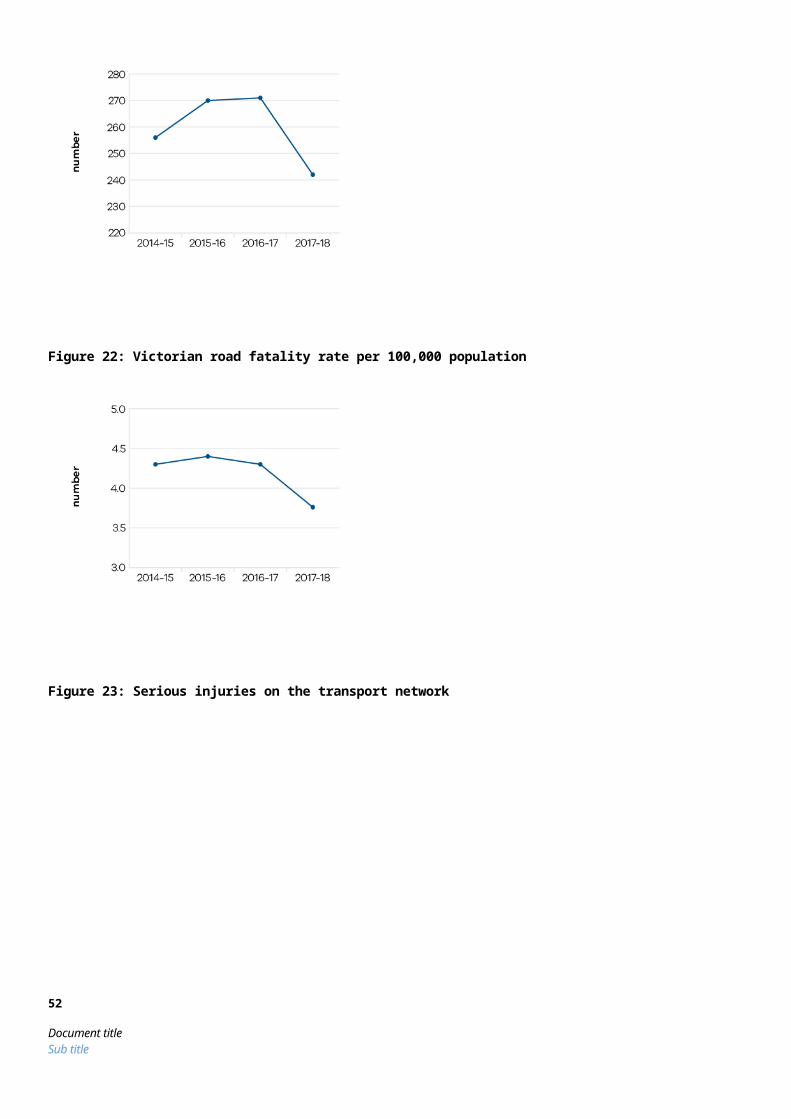
Road area treated: medium strategic priority roads m2 (000) 7,340 2,001 266.8
New measure to provide greater transparency of investments in road treatments to maintain or extend the useful life of a road. Road treatments include pavement resurfacing and rehabilitation. Roads are allocated to road maintenance categories based on road connectivity, the number of vehicles using the road per day, and commercial vehicle usage. Increased capacity and favourable weather conditions enabled additional resurfacing works to be undertaken.
Road network maintained: metropolitan lane - km 12,308 12,302 0.0
Road network maintained: regional lane - km 41,495 41,435 0.1
Traffic signal operational availability per cent 99.96 99.95 0.0
Traffic signal performance – communications (‘DA Alarm’): vehicle detector connectivity to signals
per cent 95 97 -1.8
Traffic signal performance – communications (‘Stop Talk’): connectivity between different traffic signals
per cent 99.7 99.6 0.1
QUALITY
Bridges that are acceptable for legal load vehicles: metropolitan
per cent 99.0 99.6 -0.6
Bridges that are acceptable for legal load vehicles: regional per cent 99.8 99.6 0.2
Road length meeting cracking standard: metropolitan per cent 77.9 97.7 -20.3
Reflects performance against the new measure adopted in 2017–18.
Road length meeting cracking standard: regional per cent 96.3 98.8 -2.5
Road length meeting roughness standard: metropolitan per cent 93.2 98.2 -5.1
Reflects performance against the new measure adopted in 2017–18.
Road length meeting roughness standard: regional per cent 96.0 96.4 -0.4
Road length meeting rutting standard: metropolitan per cent 96.4 98.9 -2.5
Road length meeting rutting standard: regional per cent 97.8 97.8 0.0
TIMELINESS
Annual road maintenance program completed within agreed timeframes: metropolitan
per cent 94 100 -6.0
Primarily due to some works being rescheduled to 2018–19.
Annual road maintenance program completed within agreed timeframes: regional
per cent 100 100 0.0
COST
Total output cost $ million 634.0 604.3 4.9
The 2017–18 result was higher than budget mainly due to increased funding for safety barrier maintenance, the Bridges Renewal Program and Heavy Vehicles Safety
52
Document titleSub title
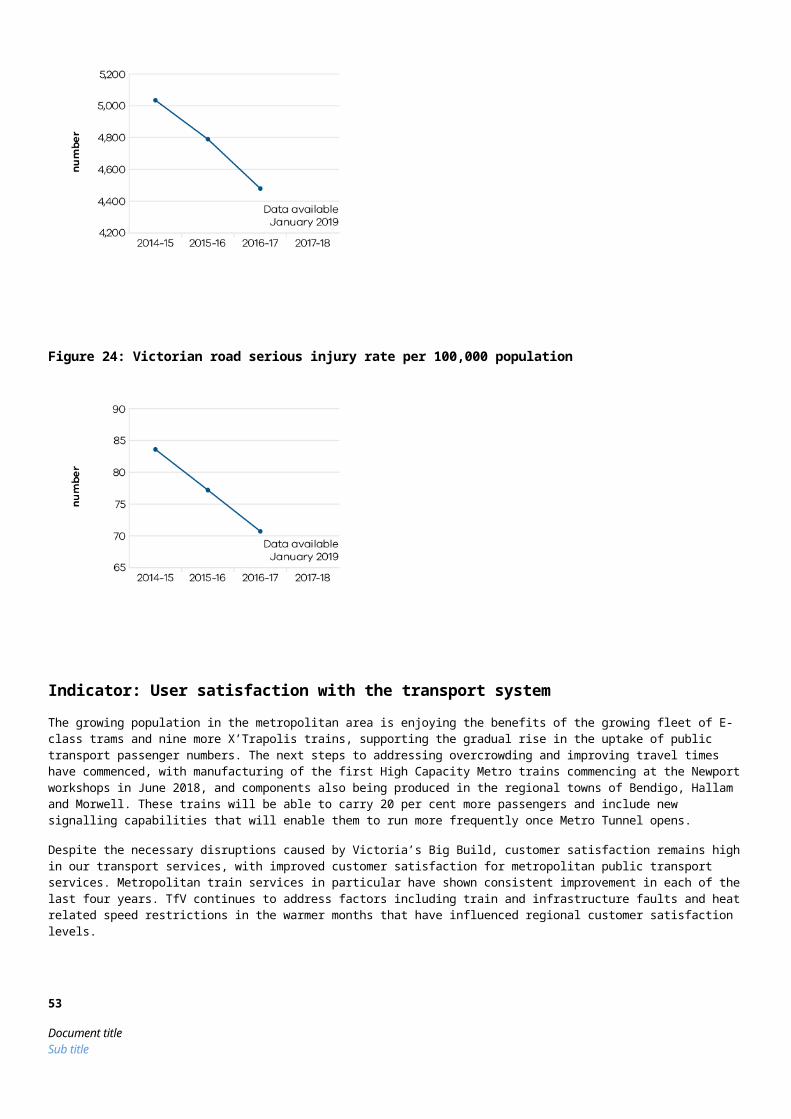
Productivity Program.
Note: Performance target achieved or exceeded Performance target not achieved – within 5 per cent variance Performance target not achieved – exceeds 5 per cent variance
Table 38 represents performance against the Road Operations and Network Improvements output. This output group delivers network improvement initiatives to enhance and develop Victoria’s freeways, arterial road network and strategic local road connections. Activities support improvements to the safety and reliability of the network.
Table 38 Output: Road Operations and Network ImprovementsPerformance measures Unit of
measure2017–18 actual
2017–18 target
Performance variation (%)
Result
QUANTITY
Bridge strengthening and replacement projects completed: metropolitan
number 2 2 0.0
Bridge strengthening and replacement projects completed: regional
number 10 9 11.1
Accelerated delivery of one project.
Congestion projects completed number 16 18 -11.1
Rescheduling of two projects to minimise traffic disruption.
Cycling projects completed number 2 4 -50.0
Two projects delayed as a result of further work requirements.
Major road improvement projects completed: metropolitan number 1 1 0.0
Major road improvement projects completed: regional number 1 1 0.0
Other road improvement projects completed: metropolitan number 2 10 -80.0
Projects delayed as a result of further work requirements.
Other road improvement projects completed: regional number 7 8 -12.5
Revised project scope for one project.
Pedestrian projects completed number 9 9 0.0
QUALITY
Road projects completed within agreed scope and standards: metropolitan
per cent 100 98 2.0
Road projects completed within agreed scope and standards: regional
per cent 100 98 2.0
Safer Cyclists and Pedestrians Fund allocated per cent 100 100 0.0
West Gate Tunnel Project – Milestones delivered in accordance with agreed budget and timelines
per cent 100 100 0.0
53
Document titleSub title
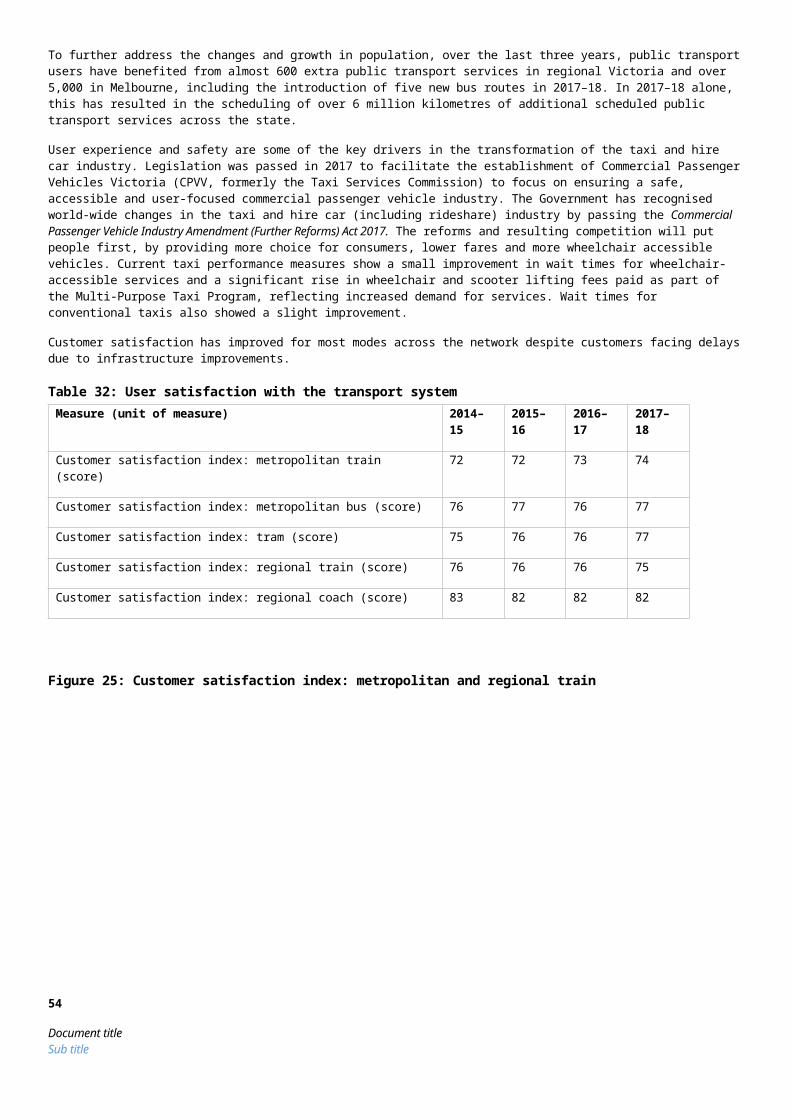
TIMELINESS
Programmed works completed within agreed timeframes: metropolitan
per cent 100 95 5.3
Successful delivery of projects on time.
Programmed works completed within agreed timeframes: regional
per cent 100 95 5.3
Successful delivery of projects on time.
COST
Total output cost $ million 1,035.4 1,037.6 -0.2
Note: Performance target achieved or exceeded Performance target not achieved – within 5 per cent variance Performance target not achieved – exceeds 5 per cent variance
Table 39 represents performance against the Taxi and Hire Vehicle Services output. This output delivers safe and accessible taxi and hire vehicle services in metropolitan and regional Victoria through the regulation of drivers and operators and promoting choices available to customers.
Table 39 Output: Taxi and Hire Vehicle ServicesPerformance measures Unit of
measure2017–18 actual
2017–18 target
Performance variation (%)
Result
QUANTITY
Average occupancy rate of metropolitan taxis in December (period of high service demand)
per cent 29 29 0.0
Average occupancy rate of metropolitan taxis in June (period of low service demand)
per cent 26 26 0.0
Multi-Purpose Taxi Program: trips subsidised number (000)
5,070 4,450 13.9
Higher demand for subsidised trips.
Multi-Purpose Taxi Program: wheelchair and scooter lifting fees paid
number (000)
1,120 950 17.9
Higher demand for trips involving wheelchairs and mobility scooters.
Taxi and hire vehicle compliance and enforcement interventions
number 19,605 19,200 2.1
QUALITY
Average wait time for conventional taxis booked to arrive at peak periods of demand
minutes 9.4 9.6 -2.1
Average wait time for wheelchair accessible taxis booked to arrive at peak periods of demand
minutes 27 28 -3.6
Taxi services online customer rating: overall satisfaction in metropolitan Melbourne
score 64.2 61.0 5.2
54
Document titleSub title
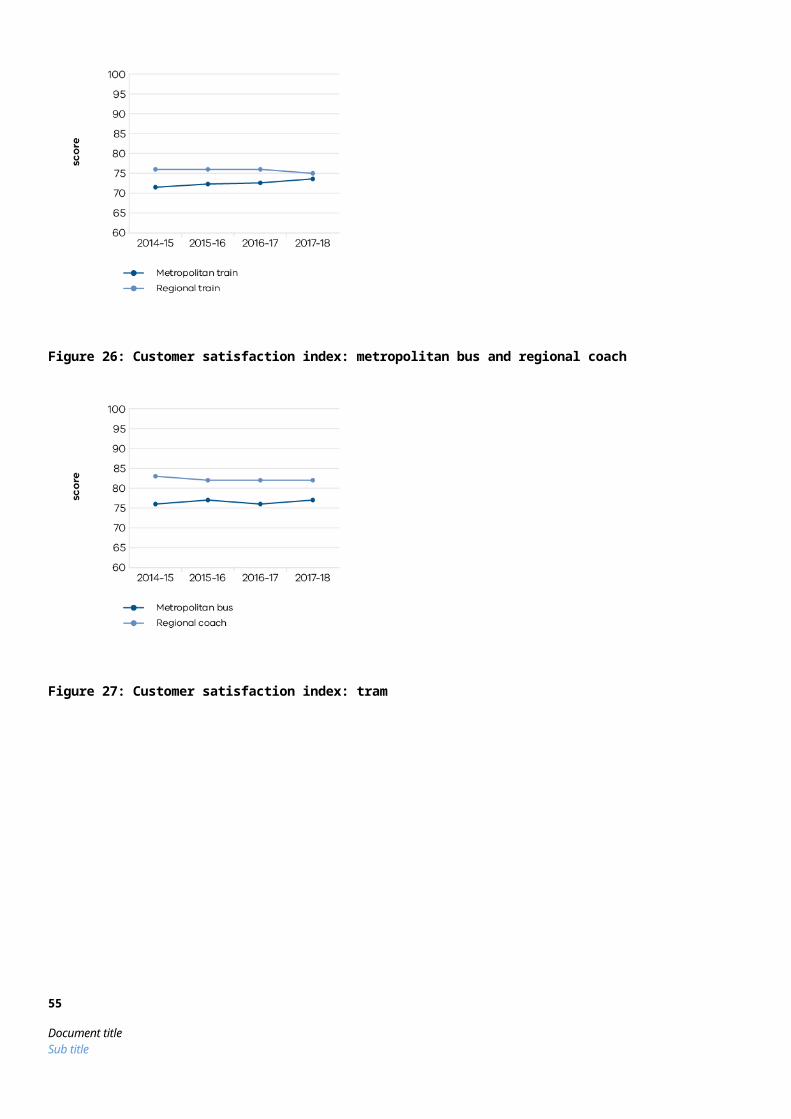
General improvement in the level of customer satisfaction with commercial passenger vehicle service options in metropolitan Melbourne.
Taxi services online customer rating: overall satisfaction in regional Victoria
score 75.9 72.8 4.3
Taxi services online customer rating: safety and comfort of journeys
score 71.1 69.7 2.0
Taxis and hire vehicles conform to safety and quality standards
per cent 85 83 2.4
TIMELINESS
Commercial passenger vehicle service complaints and intelligence reports investigated and closed within 45 days
per cent 86 85 1.2
Taxi and hire vehicle: calls to the Taxi Services Commission call centre answered within 20 seconds
per cent 45 56 -19.6
Higher than expected call volumes and complexity relating to regulatory changes to the commercial passenger vehicle industry.
COST
Total output cost $ million 162.9 269.4 -39.6
The 2017–18 result was lower than budget mainly due to the completion of the commercial passenger vehicle reform transition assistance payments program.
Note: Performance target achieved or exceeded Performance target not achieved – within 5 per cent variance Performance target not achieved – exceeds 5 per cent variance
Table 40 represents performance against the Train Services output. This output delivers reliable and cost-effective train services and infrastructure investments across the Victorian rail network, including services delivered through contractual arrangements with private operators.
Table 40 Output: Train ServicesPerformance measures Unit of
measure2017–18 actual
2017–18 target
Performance variation (%)
Result
QUANTITY
Passengers carried: metropolitan train services number (million)
240.9 239.6 0.5
Passengers carried: regional train and coach services number (million)
20.8 20.6 1.0
Payments made for: metropolitan train services $ million 892 784 13.8
The new metropolitan rail contract that commenced on 30 November 2017 requires the operator to meet new standards with improvements to operational service delivery and passenger experience, and greater emphasis on investment in operational control systems and an enhanced
55
Document titleSub title

asset maintenance and renewals program.
Payments made for: regional train and coach services $ million 534 516 3.6
Public railway crossings upgraded number 69 32 115.6
Accelerated delivery of the Safer Country Crossings Program.
Public transport network improvement: minor projects completed – train
number 3 3 0.0
This performance measure records the number of minor projects that have a budget of $50 million or less.
Public transport network improvement: multimodal projects completed
number 2 2 0.0
Scheduled services delivered: metropolitan train per cent 99 99 -0.2
Scheduled services delivered: regional train per cent 97.0 98.5 -1.5
Total kilometres scheduled: metropolitan train km (million)
23.1 23.0 0.4
Total kilometres scheduled: regional train and coach km (million)
26.0 24.8 4.8
QUALITY
Availability of rolling stock: metropolitan trains per cent 93 94 -1.1
Availability of rolling stock: VLocity fleet per cent 90.4 92.5 -2.3
Calls to the Public Transport Victoria call centre answered within 30 seconds
per cent 81 80 1.3
Customer satisfaction index: metropolitan train services score 74 73 0.8
Customer satisfaction index: regional train services score 75 78 -3.7
Metropolitan fare compliance rate across all public transport modes
per cent 95.3 96.5 -1.2
Public transport network improvement: performance against master project schedule
per cent 90 90 0.0
TIMELINESS
Major periodic maintenance works completed against plan: metropolitan train network
per cent 92 100 -8.0
Maintenance works rescheduled to align with approved major project schedules to reduce passenger impact.
Major periodic maintenance works completed against plan: regional train network
per cent 96 100 -3.6
Service punctuality for metropolitan train services per cent 91.9 92.5 -0.6
Metropolitan trains are considered on time if they arrive no more than four minutes and 59 seconds after the scheduled time in the timetable.
Service punctuality for regional train services per cent 84 92 -8.8
A range of factors including heat-related speed restrictions,
56
Document titleSub title
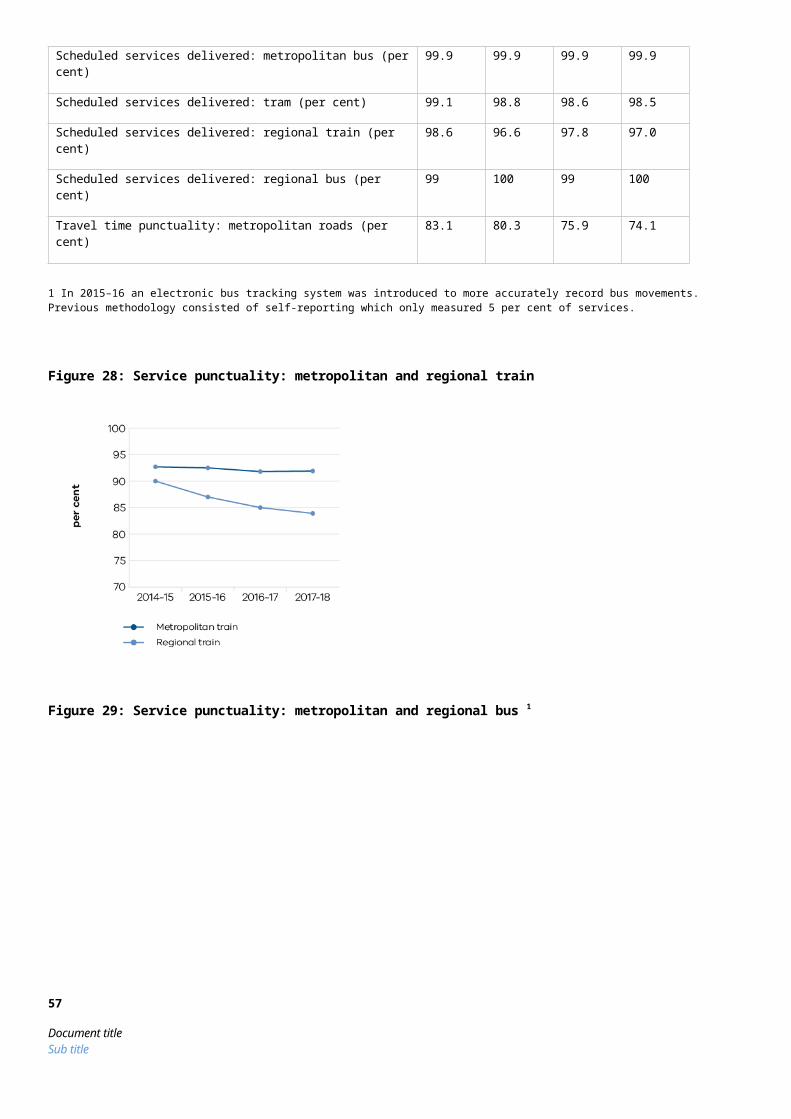
infrastructure and train faults. Long-distance regional trains are considered on time if they arrive no more than 10 minutes and 59 seconds late at their destination. Short-distance regional trains are considered on time if they arrive no more than five minutes and 59 seconds late at their destination.
COST
Total output cost $ million 3,349.7 3,143.9 6.5
The 2017–18 result was higher than budget mainly due to increased expenditure associated with the new franchise agreement for metropolitan trains and a change in the accounting treatment of rolling stock lease payments.
Note: Performance target achieved or exceeded Performance target not achieved – within 5 per cent variance Performance target not achieved – exceeds 5 per cent variance
Table 41 represents performance against the Tram Services output. This output delivers reliable and cost-effective tram services and infrastructure investments, including public transport services delivered through contractual arrangements with private operators.
Table 41 Output: Tram ServicesPerformance measures Unit of
measure2017–18 actual
2017–18 target
Performance variation (%)
Result
QUANTITY
Level access tram stop upgraded number 6 12 -50.0
Additional site works required, community consultation and the impact of scheduling tram works within the network-wide infrastructure program.
Passengers carried: tram services number (million)
206.3 212.9 -3.1
Payments made for: tram services $ million 369 200 84.4
The new metropolitan rail contract that commenced on 30 November 2017 requires the operator to meet new standards with improvements to operational service delivery and passenger experience, and greater emphasis on investment in operational control systems and an enhanced asset maintenance and renewals program.
Progress of tram procurement and supporting infrastructure – cumulative project expenditure
per cent 85 93 -8.6
Delayed infrastructure works.
Public transport network improvement: minor projects completed – tram
number 2 1 100.0
Completion of a project carried over from 2016–17. This performance measure records the number of minor projects that have a budget of $50 million or less.
Scheduled services delivered: tram per cent 98.5 99.2 -0.7
57
Document titleSub title
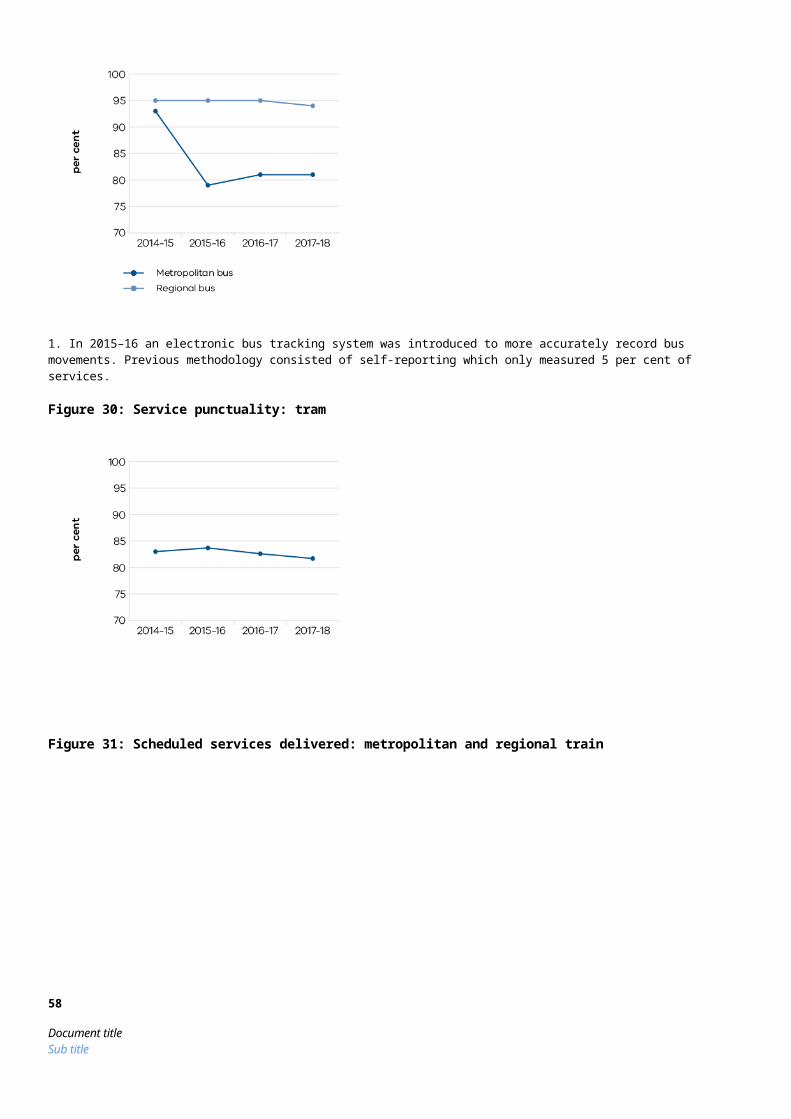
Total kilometres scheduled: tram km (million)
24.5 24.0 2.1
W-Class trams fully restored number 2 2 0.0
QUALITY
Availability of rolling stock: trams per cent 90 94 -4.8
Customer satisfaction index: tram services score 77 76 0.8
TIMELINESS
Major periodic maintenance works completed against plan: tram network
per cent 70 100 -30.0
Maintenance works rescheduled to later periods.
Service punctuality for: tram services per cent 81.7 82.9 -1.4
Trams are on-time when services are no more than 59 seconds early or no more than four minutes 59 seconds late when passing key monitoring locations.
COST
Total output cost $ million 799.1 685.9 16.5
The 2017–18 result was higher than budget mainly due to increased expenditures associated with the new franchise agreement for metropolitan trams and maintenance and renewal works.
Note: Performance target achieved or exceeded Performance target not achieved – within 5 per cent variance Performance target not achieved – exceeds 5 per cent variance
Table 42 represents performance against the Transport Safety, Security and Emergency Management output. This output delivers initiatives and regulatory activities that will improve safety and security and strengthen resilience.
Table 42 Output: Transport Safety, Security and Emergency ManagementPerformance measures Unit of
measure2017–18 actual
2017–18 target
Performance variation (%)
Result
QUANTITY
Accredited State maritime training providers audited in accordance with annual audit plan
number 22 20 10.0
Increase in the number of accredited state maritime training providers.
Regulatory interventions conducted on high-risk or accredited rail transport operators
number 142 100 42.0
Additional audits and compliance inspections undertaken in accordance with the Office of the National Rail Safety Regulator (ONRSR) work program for 2017–18.
58
Document titleSub title

Risk-based recreational vessel inspections undertaken in accordance with state legislative requirements
number 508 500 1.6
Road safety projects/initiatives completed: safe road users number 3 2 50.0
Completion of one additional project.
Road safety projects/initiatives completed: safe roads number 137 93 47.3
Early completion of four projects and new projects being added to the Safer System Roads Infrastructure Program throughout the year.
Road safety projects/initiatives completed: safe vehicles number 0 0 0.0
Road vehicle and driver regulation: driver licences renewed number (000)
628 648 -3.1
Road vehicle and driver regulation: new driver licences issued
number (000)
180 190 -5.3
Continuous decline in new motorcycle licences issued since the Motorcycle Graduated Licensing Scheme (GLS) introduced new safety restrictions and training requirements.
Road vehicle and driver regulation: new vehicle registrations issued
number (000)
616 610 1.0
Road vehicle and driver regulation: vehicle and driver information requests, including toll operator and council requests, processed
number (000)
3,959 3,940 0.5
Road vehicle and driver regulation: vehicle registration transfers
number (000)
930 930 0.0
Road vehicle and driver regulation: vehicle registrations renewed
number (000)
6,016 5,725 5.1
The introduction of the Government’s Short Term Registration initiative from January 2018. Short Term Registration allows a vehicle to be registered for shorter periods which has resulted in more vehicle registrations across the financial year.
Safety audits of bus operators conducted in accordance with Bus Safety Act 2009 (Vic) requirements
number 560 560 0.0
Sector Resilience Plans endorsed by State Crisis and Resilience Council
number 3 3 0.0
Security and emergency management exercises coordinated or contributed to by the Department
number 8 8 0.0
Transport and marine safety investigations: proportion of notified accidents with passenger fatalities and/or multiple serious passenger injuries investigated
per cent 100 100 0.0
Transport safety regulation: rail safety audits/compliance inspections conducted in accordance with legislative requirements
number 142 100 42.0
Additional audits and compliance inspections undertaken in accordance with the Office of the National Rail Safety Regulator (ONRSR) work program for 2017–18.
QUALITY
59
Document titleSub title
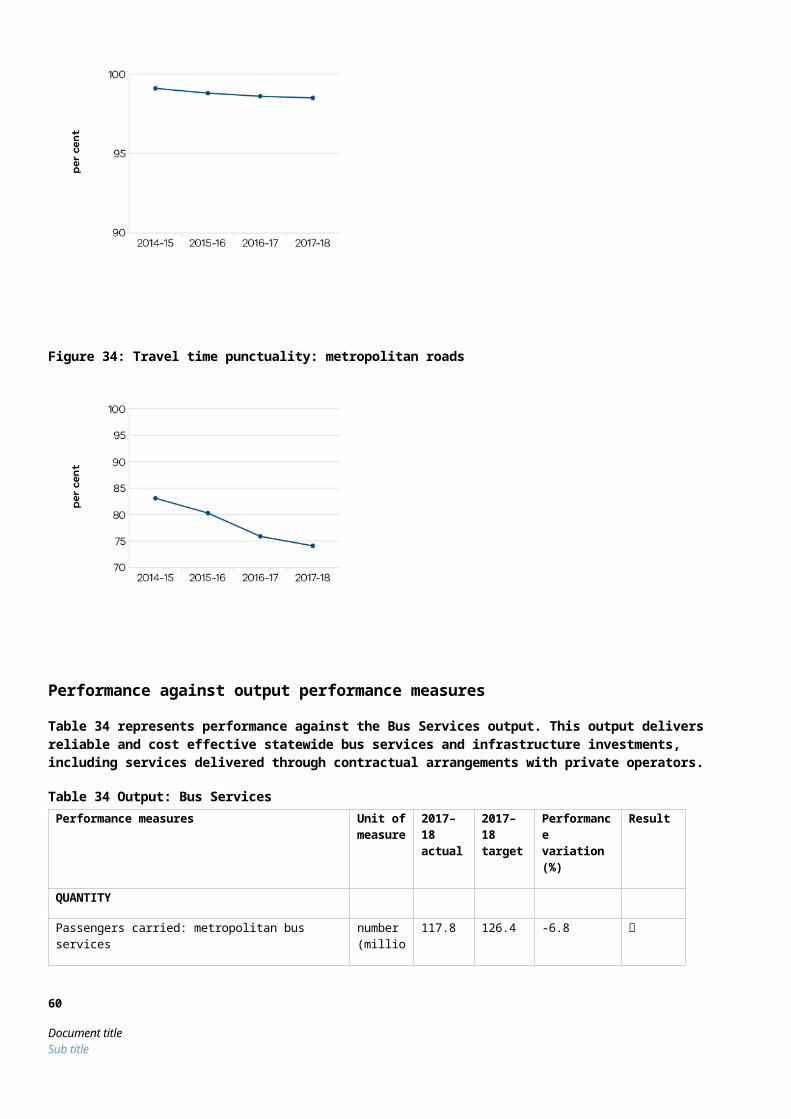
Commercial maritime duty holders other than vessel owners and operators audited in accordance with legislative requirements and timelines
per cent 100 100 0.0
Compliance inspections of managed and unmanaged Victorian waterways in accordance with risk-based plan
per cent 100 100 0.0
Deliver regulatory services under delegation of the Australian Maritime Safety Authority (AMSA) for domestic commercial vessel actions undertaken in accordance with national regulation, timelines and transition plan
per cent 100 100 0.0
Rail safety audits, compliance inspections and investigations conducted in accordance with state and national legislative requirements and timelines
per cent 100 100 0.0
Road safety projects completed within agreed scope and standards
per cent 100 100 0.0
Road vehicle and driver regulation: currency of vehicle registration and driver licensing records
per cent 99 99 0.0
Road vehicle and driver regulation: user satisfaction with vehicle registration and driver licensing
per cent 87 85 2.4
TIMELINESS
Applications for bus operator registration and safety accreditation processed on time in accordance with Bus Safety Act 2009 (Vic) requirements
per cent 100 100 0.0
Applications for rail accreditation and variations to accreditation processed within state and national legislative requirements and timelines
per cent 100 100 0.0
Initiate marine pollution response action within 60 minutes of incident notification
per cent 100 100 0.0
Multi-Purpose Taxi Program: applications assessed and completed within 14 days
per cent 97 97 0.0
New and renewed taxi, hire vehicle and bus driver accreditation applications processed within 14 days
per cent 78 85 -8.2
Changes to the Commercial Passenger Vehicle Industry and passing of legislation in Victoria resulting in unprecedented volume of new applications.
Road safety programmed works completed within agreed timeframes
per cent 100 100 0.0
Road vehicle and driver regulation: average speed of calls answered in VicRoads’ call centres
seconds 394 240 64.2
The introduction of short-term registrations increased call volumes and the introduction of the Payment Card Industry Data Security Standard increased call handling time.
Road vehicle and driver regulation: customers served within 10 minutes in VicRoads’ Customer Service Centres
per cent 74 80 -7.5
Increase in customer transaction volumes received into the Customer Service Centre network following the introduction of the Short Term Registration initiative.
Road vehicle and driver regulation: new and renewed driving instructor authority applications processed within 14 days
per cent 90 85 5.9
60
Document titleSub title
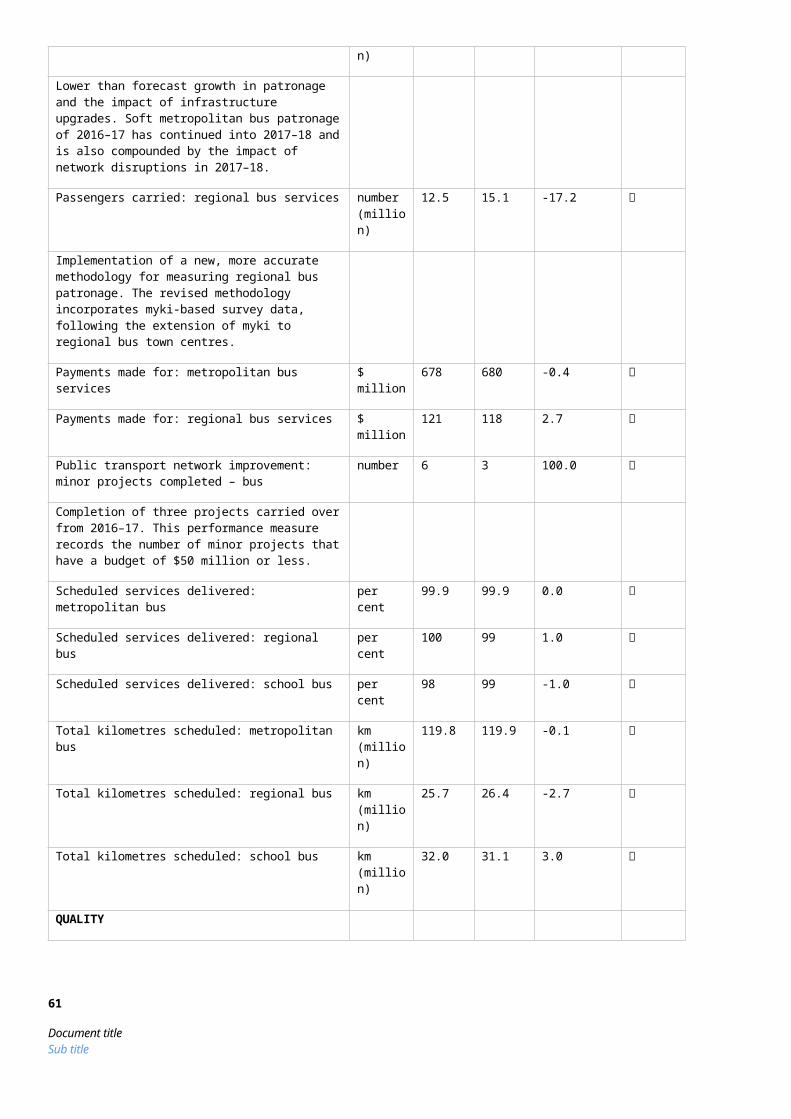
Adaptable workforce planning and resource management that enabled efficient processing of application volumes.
Taxi, hire vehicles and other commercial passenger vehicle licence applications processed within 14 days
per cent 90 85 5.9
Technology and process improvements.
Transport and marine safety investigations: accidents/incidents assessed within two days of notification to determine need for detailed investigation
per cent 100 100 0.0
Transport and marine safety investigations: average time taken to complete investigations
months 17 12 41.7
Three investigations being delayed by new information supplied late in the investigation process.
COST
Total output cost $ million 324.1 363.9 -10.9
The 2017–18 result was lower than budget mainly due to timing of expenditure deferred to 2018–19 for the Blackspot Program and Road Safety Towards Zero Program.
Note: Performance target achieved or exceeded Performance target not achieved – within 5 per cent variance Performance target not achieved – exceeds 5 per cent variance
61
Document titleSub title