contextual activity visualization from long-term...
TRANSCRIPT
50 1541-1672/10/$26.00 © 2010 IEEE IEEE INTELLIGENT SYSTEMSPublished by the IEEE Computer Society
I n t e l l I g e n t M o n I t o r I n g
Contextual Activity Visualization from Long-Term Video ObservationsBrendan Tran Morris and Mohan Manubhai Trivedi, University of California, San Diego
The Contextual
Activity Notification
Visualization
Analysis System
(Canvas) provides
a user interaction
interface for
instantaneous
feedback of
contextual
processing units that
enable high-level
semantic extraction
and understanding.
enabled the use of multiple cameras in more varied spaces. Vast amounts of data can be transmitted efficiently because of high- quality video-compression techniques and improved wireless communication, which facilitates flexible setup and configura-tion. Most importantly, the research com-munity has made great strides in providing intelligence to these spaces. Low-level prob-lems such as object detection and tracking are possible in real time, making common surveillance tasks straightforward, such as monitoring a sensitive area for unauthorized entry. Intelligent monitoring now seeks to provide situational awareness for a semanti-cally meaningful understanding of environ-ment activity.
The key to accurately understanding an environment is incorporating the needs of the monitoring system’s user. A human must be included in the analysis loop for critical decisions because these decisions must be based on a deep understanding of the environment and monitoring situation.
Unfortunately, due to vast amounts of streaming information, limited attention, and distributed awareness, human opera-tors cannot accurately and effectively moni-tor large areas and networks. Automated computational techniques are vital for the monitoring process to help highlight and guide user attention to relevant areas, thus relieving tedious concentration on noncriti-cal information. The challenge is to dis-till the volumes of monitoring information into a manageable quantity and present it to users so they can make appropriate deci-sions in a sufficient amount of time.
In this article, we present the Contextual Activity-Notification Visualization Analysis System (Canvas), which is used to develop advanced monitoring techniques, integrate cameras installed around the University of California, San Diego (UCSD) campus and centralize information.2 Our work focuses on building an upgradeable framework for simple user interaction through an acces-sible visualization. Rather than present a
Intelligent monitoring of environments has progressed rapidly in the past
10 years.1 Major technological advancements have pushed the field toward
ever-more complex environments. The decreased price of video cameras, a pri-
mary sensor for surveillance applications, along with improved quality has
IS-25-03-Morr.indd 50 14/05/10 11:45 AMAuthorized licensed use limited to: Univ of Calif San Diego. Downloaded on July 23,2010 at 16:30:30 UTC from IEEE Xplore. Restrictions apply.
MaY/juNE 2010 www.computer.org/intelligent 51
user with raw sensor data from the physical world, we introduce visual-ization layers to abstract the inter-nals of monitoring algorithms and provide a clean consumable compu-tational output. Canvas provides a flexible backbone that lets us improve vision algorithms while providing a seamless visualization interface. This ulti mately improves the effectiveness of the monitoring by focusing atten-tion and presenting only the most rel-evant information. The visualization is built on Web technology to make the information available anywhere, anytime.
System Description, Framework, and FunctionalitiesThe block diagram in Figure 1 de-picts Canvas’s major components. The system’s central goal is to pro-vide users with ubiquitous access. This is reflected by the archival block located in the center of the diagram. A database collects and stores data that is accessible through a standard Internet connection for quick re-trieval. Most of the database storage is devoted to data collection from the connected sensors. Any number of sensors can be hooked into the data-base. Typical sensors are video and audio devices that each have special-ized data-extraction techniques, such as position estimates via tracking or object descriptors.
The archive data is used to train computational modules in the learn-ing block. Example modules can dis-tinguish different types of objects (such as pedestrians from vehicles), model highway traffic flow, and com-pactly represent activity through trajectory learning. The models are archived and used for live analy-sis, where current sensor readings are used in conjunction with the trained models to describe the scene’s
current state. The results of live analy-sis can be wired back into the database as added supplementary features— for example, a trajectory has posi-tion and velocity as well as an ob-ject description. Finally, the database contents are made available to users through the visualization module. Users can query the database to re-trieve relevant information and have the display updated in real time.
All the modules except data collec-tion pass information in both direc-tions from the archival block, which lets the system dynamically change over time. Models developed through learning techniques can query more recent data to update and refine re-sults, which in turn modifies the live-analysis output. Modification is even possible through the visualiza-tion module. In this case, users can customize results to present the most relevant information for their task.
These end user goals can help dictate which types of analysis are necessary.
Information ArchiveThe heart of Canvas is the database archival system. We implemented a MySQL relational database system to provide access to organized infor-mation tables to multiple users. The widespread use of MySQL has led to the development of many libraries to connect with the database from dif-ferent programming languages and operating systems. This operational flexibility allows virtually any ma-chine with a network connection to communicate with the database and access its data.
The archival block’s main goal is to timestamp and store sensor data that provides measurements about the state of the monitored world. As the database is updated, a histori-cal context emerges that is necessary
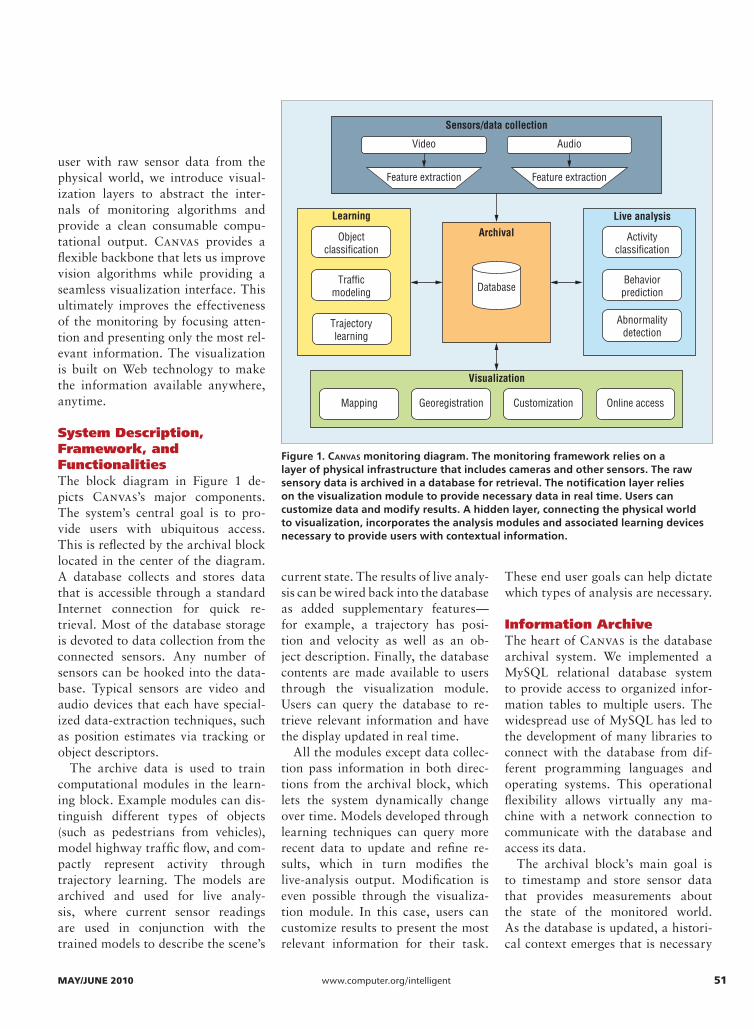
Figure 1. Canvas monitoring diagram. The monitoring framework relies on a layer of physical infrastructure that includes cameras and other sensors. The raw sensory data is archived in a database for retrieval. The notification layer relies on the visualization module to provide necessary data in real time. Users can customize data and modify results. A hidden layer, connecting the physical world to visualization, incorporates the analysis modules and associated learning devices necessary to provide users with contextual information.
Sensors/data collection
Learning Live analysisArchival
Database
Visualization
Video Audio
Trafficmodeling
Objectclassification
Behaviorprediction
Activityclassification
Abnormalitydetection
Mapping Georegistration
Trajectorylearning
Customization
Feature extraction Feature extraction
Online access
IS-25-03-Morr.indd 51 14/05/10 11:46 AMAuthorized licensed use limited to: Univ of Calif San Diego. Downloaded on July 23,2010 at 16:30:30 UTC from IEEE Xplore. Restrictions apply.

52 www.computer.org/intelligent IEEE INTELLIGENT SYSTEMS
I n t e l l I g e n t M o n I t o r I n g
for accurate scene understanding. The centralized database allows for a fluid design because it can grow and adapt to new information types and requests as necessary. Training data-bases, used for learning, can be sep-arated and maintained as subsets of the full database. New information and measurement types can be in-cluded with the addition of new sen-sors or computational modules. This adaptation is necessary for long-term use because monitoring needs can change over time.
We split the database into three main partitions: sensors, models, and data. The first partition holds infor-mation about all the connected sen-sors. Each camera sensor is denoted by its type (such as pan-tilt-zoom [PTZ] or omnidirectional), location (latitude and longitude), and infor-mation for mapping (PTZ setting and conversion from image to world co-ordinates). We can quickly integrate new cameras into the Canvas sys-tem by including this sensor infor-mation. The model partition main-tains the learning results used during
live analysis. This partition denotes the model functionality and the parameters necessary for analysis. The last database partition deals with the raw sensor data.
A set of secondary databases are populated by video processing for use by the learning modules. The mea-surement database holds information describing the appearance of each detected object for type classifica-tion. Tracking information, including location, speed, and acceleration, is stored in the tracks database for tra-jectory learning. The traffic-modeling module relies on information stored in the highway statistics database, which includes vehicle flow, density, and speed logged every 30 seconds. Finally, the live database is automat-ically updated using current data to provide information for visualization.
Data Collection and SensorsThe data collection front end pro-vides Canvas with meaningful and useful signals. All the low-level data generation and extraction hap-pens within this block. We designed
sensor-specific filters to extract mea-surements or features from raw sen-sors. Some filters are simple and merely pass the raw measurement onto the database (such as inductive loop sensors), while more complicated fil-ters require processing (such as track-ing for motion description and mea-surements of object size and shape).
Video cameras are our primary sensors. Figure 2 shows a map of UCSD along with a few of the many camera nodes situated around cam-pus. A variety of environments, both indoor and outdoor, as well as differ-ent coverage and different objects of interest are present. Using the prin-ciple of distributed interactive video arrays (DIVAs),2 we monitor high-way traffic along Interstate 5, human- vehicle interactions on campus roads, and people indoors using both PTZ controllable and wide-area-covering omnidirectional cameras. The net-worked cameras stream video for re-mote processing, while nonstreaming cameras require a local machine to capture and send analysis data along a network link.
Figure 2. University of California, San Diego video network. A network of video cameras around campus provides coverage of different environments. Both rectilinear pan-tilt-zoom (PTZ) and omnidirectional cameras monitor highway vehicle traffic and the close interactions of people and vehicles on campus.
IS-25-03-Morr.indd 52 14/05/10 11:46 AMAuthorized licensed use limited to: Univ of Calif San Diego. Downloaded on July 23,2010 at 16:30:30 UTC from IEEE Xplore. Restrictions apply.

MaY/juNE 2010 www.computer.org/intelligent 53
Learning and AnalysisAlthough the learning module usu-ally operates as an offl ine process and analysis is needed in real time, the two modules are closely linked. Live analysis relies on the learned models to make sense of sensor data and understand the monitor-ing scene. This section describes a number of learning techniques and the questions that can be answered during live analysis using the model database.
For each learning module, we cre-ated a training database by extract-ing the needed information from the archival database. A training data-base is accumulated by collecting the appropriate signals over a suffi cient time period. Analysis models can be created by applying learning algo-rithms to the compiled data. Data-base maintenance updates training data for adaptive models, which more accurately represent the monitoring scene’s current confi guration.
Analysis modules are essential for effective monitoring because they ease the cognitive load on human observers. Multiple analysis tasks can be run in parallel on multiple video feeds, which is diffi cult for humans.
Object Classifi cationClassifi cation identifi es the type of detected object based on its visual signature. Using the 2001 US De-partment of Transportation National Household Travel Survey for guid-ance, we identifi ed the seven most of-ten occurring vehicle types in high-way streams: sedan, pickup, SUV, van, semi, truck, and bike. This de-tailed real-time fl eet composition is a missing management component essential for estimating emissions or infrastructure load assessment.3 On campus, detected objects are marked as either a car, pedestrian, biker,
skateboarder, or a group of peo-ple. This classifi cation helps identify critical situations when vehicles and people interact in close proximity.
An object’s similarity to examples in the training database determines its unique type identifi cation.4 Each object has measurements mi taken and transformed into comparable features using linear discriminant analysis (LDA): oi = Wmi.
An object’s appearance oi is sum-marized after applying the feature transformation matrix W, learned during the training phase, to the raw measurement mi. The class similarity
wc, computed using a weighted K-nearest neighbor (wKNN) tech-nique, assesses how similar object i is to class type c. The similarity metric,
wo oci cd
K
od Dc
=−=
∈
∑ 1
1
,
compares the object example to its Kclosest training examples in the train-ing set Dc for object type c. The ob-ject type is labeled as the class c that has the highest weight over the extent of tracking for T frames:
L lnw
wT
c t
Tct
c ct
==∑ ∑
argmax .1
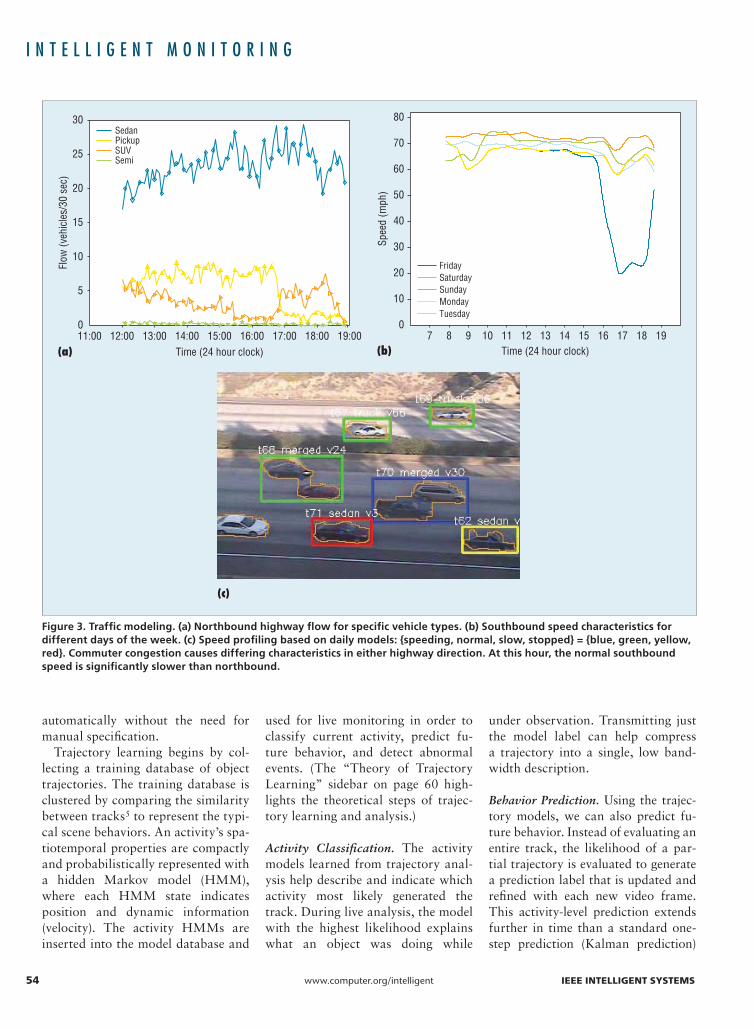
Traffi c ModelingHighway management relies on knowledge of the location and num-ber of vehicles in the transportation network. The essential measures of fl ow (number of vehicles/time), den-sity (number of vehicles/distance), and speed (miles per hour) estimates are generated in 30-second intervals by visual vehicle tracking. Traffi c models emerge through aggregation over time and location that describe varying highway conditions. Un-like loop detectors, we can also com-pile the statistics based on vehicle type because of object classifi cation, as Figure 3a shows. This allows for fi ne-grained analysis of the effects of commercial and private vehicles on highway control, environmental emissions impact studies, and road wear and tear.
We can track daily speed variations using historical measurements. Fig-ure 3b shows the speed fl uctuations over the course of a week. Notice the signifi cant slowdown during the Fri-day evening commute not seen on other days. These daily speed profi les are used to indicate the motion state of vehicles during online tracking by the bounding-box color: {speeding, normal, slow, stopped} = {blue, green, yellow, red} (see Figure 3c). Rather than relying on posted speed lim-its, speeding vehicles are recognized based on the historical driving condi-tions. For example, during congestion situations, dangerous speeds are sig-nifi cantly lower than the posted limit.
Trajectory LearningRecently, one of the most popular techniques for automated surveillance and monitoring is trajectory learn-ing (see the “Trajectory Learning for Intelligent Monitoring” sidebar on page 59). This technique makes it eas-ier to monitor larger video networks because activity models are learned
Analysis modules are
essential for effective
monitoring because they
ease the cognitive load on
human observers.
IS-25-03-Morr.indd 53 14/05/10 11:46 AMAuthorized licensed use limited to: Univ of Calif San Diego. Downloaded on July 23,2010 at 16:30:30 UTC from IEEE Xplore. Restrictions apply.
54 www.computer.org/intelligent IEEE INTELLIGENT SYSTEMS
I n t e l l I g e n t M o n I t o r I n g
automatically without the need for manual specification.
Trajectory learning begins by col-lecting a training database of object trajectories. The training database is clustered by comparing the similarity between tracks5 to represent the typi-cal scene behaviors. An activity’s spa-tiotemporal properties are compactly and probabilistically represented with a hidden Markov model (HMM), where each HMM state indicates position and dynamic information (velocity). The activity HMMs are inserted into the model database and
used for live monitoring in order to classify current activity, predict fu-ture behavior, and detect abnormal events. (The “Theory of Trajectory Learning” sidebar on page 60 high-lights the theoretical steps of trajec-tory learning and analysis.)
Activity Classification. The activity models learned from trajectory anal-ysis help describe and indicate which activity most likely generated the track. During live analysis, the model with the highest likelihood explains what an object was doing while
under observation. Transmitting just the model label can help compress a trajectory into a single, low band-width description.
Behavior Prediction. Using the trajec-tory models, we can also predict fu-ture behavior. Instead of evaluating an entire track, the likelihood of a par-tial trajectory is evaluated to generate a prediction label that is updated and refined with each new video frame. This activity-level prediction extends further in time than a standard one-step prediction (Kalman prediction)
Figure 3. Traffic modeling. (a) Northbound highway flow for specific vehicle types. (b) Southbound speed characteristics for different days of the week. (c) Speed profiling based on daily models: {speeding, normal, slow, stopped} = {blue, green, yellow, red}. Commuter congestion causes differing characteristics in either highway direction. At this hour, the normal southbound speed is significantly slower than northbound.
11:00 12:00 13:00 14:00 15:00 16:00 17:00 18:00 19:000
5
10
15
20
25
30
Time (24 hour clock)
Flow
(veh
icle
s/30
sec
)
SedanPickupSUVSemi
7 8 9 10 11 12 13 14 15 16 17 18 190
10
20
30
40
50
60
70
80
Time (24 hour clock)(a) (b)
(c)
Spee
d (m
ph)
FridaySaturdaySundayMondayTuesday
IS-25-03-Morr.indd 54 14/05/10 11:46 AMAuthorized licensed use limited to: Univ of Calif San Diego. Downloaded on July 23,2010 at 16:30:30 UTC from IEEE Xplore. Restrictions apply.

MaY/juNE 2010 www.computer.org/intelligent 55
because it leverages acceptable behav-iors rather than relying on a simple motion model, which can drift.
Figure 4 displays a predication ex-ample, showing the three most-likely activities with their associated con-fidence. As more data is collected, a better picture of future behavior is formed, as denoted by the adjusted path confidences.
Abnormality Detection. In many monitoring situations, the most inter-esting events are unexpected. These atypical occurrences indicate unex-plained activities that require further
examination. A trajectory is deemed to be anomalous if it does not fit any of the activity models well (low likelihood).
During live tracking, an incom-plete trajectory can be evaluated for its current abnormality state in or-der to promptly detect when an un-usual deviation occurs. The image sequence in Figure 5 shows the set of activities at an intersection and marks a typical behavior with a green box. When the person cuts across the lawn, the anomaly is noted immedi-ately as a red bounding box. Figure 6 illustrates the typical vehicle routes
and examples of anomalous tra-jectories extracted from automatic postprocessing.
VisualizationThe visualization block’s main goal is to provide a common environ-ment for displaying the live analysis modules. The visualization environ-ment presents an immersive and in-teractive display that preserves the context of the information sources. Simultaneous access to different data sources lets the user control the area, scale, and information of interest without changing the surrounding
Figure 4. Historically relevant long-term activity prediction. The best three predicted paths are displayed with an associated confidence. (a) Initial estimates of future action. (b, c) Path probabilities change based on local measurements and as more tracking data is accumulated. (d) The final path indicates movement seconds into the future, which could not be accurately estimated using just local motion models.
10%
80%
10%
1%
84%
15%
41%
7%
52%
100%
0%
0%
(a) (b)
(c) (d)
IS-25-03-Morr.indd 55 14/05/10 11:46 AMAuthorized licensed use limited to: Univ of Calif San Diego. Downloaded on July 23,2010 at 16:30:30 UTC from IEEE Xplore. Restrictions apply.

56 www.computer.org/intelligent IEEE INTELLIGENT SYSTEMS
I n t e l l I g e n t M o n I t o r I n g
environmental context, enabling a co-hesive picture that provides the user with complete situational awareness.6 Awareness is realized through func-tional display layers built for each analysis module, where each addi-tional visualization layer provides a more detailed picture of the monitor-ing state.
While providing expansive environ-mental context, we take care to avoid distractions that can detract from the principle monitoring task.7 Instead of overloading the display with many annotations, we distill informa-tion and visualize it using icons and avatars (see Figure 7a). This filtered view uses automatic highlighting to
limit the cognitive load on users and help focus their attention on the lo-cations most likely to be interesting.8
The visualization block indicates the location of sensors with respect to one another, gives access to raw video feeds, presents pertinent analysis re-sults, and provides a user interface to navigate, query, and customize the display.
MappingAlthough the real world is 3D, we do not contextualize information in a 3D environment because this would limit usage to locations with com-plete 3D graphic models.9 Instead, we use a 2D map representation of the
environment. A map provides sur-rounding environmental context, which helps users comprehend spa-tial relationships between objects, in-creasing situational awareness.10 We built the user display using the Google Maps API because it is a familiar in-terface (often used for directions) and its wide coverage makes it applica-ble to most outdoor locations. The environmental context is available through different modalities, such as aerial imagery or through geographi-cal information system (GIS) type lay-ers depicting structures and areas of interest. The API also supports user interaction with the use of draggable markers and other line-drawing tools.
Figure 5. Real-time detection of abnormal activities. (a) The set of all typical motion routes for a crosswalk. (b) Detected man in green starting a turn at the intersection. (c) When the man leaves the path, the anomaly is marked by the red bounding box.
99%
1%
(a) (b)
90%
3%
(c)
IS-25-03-Morr.indd 56 14/05/10 11:46 AMAuthorized licensed use limited to: Univ of Calif San Diego. Downloaded on July 23,2010 at 16:30:30 UTC from IEEE Xplore. Restrictions apply.

MaY/juNE 2010 www.computer.org/intelligent 57
GeoregistrationTo properly visualize analysis re-sults on the map, the outputs must be properly aligned to the map coordi-nates. Therefore, we transform sen-sor coordinates into GPS latitude and longitude coordinates using a geo-registration process, which requires calibration between the sensor and map spaces. Image-based calibration is learned through a homography trans-formation H, mapping the image-pixel locations on the ground plane (such as the road) xim to its corresponding lati-tude and longitude coordinates on the map XGPS: XGPS = H xim.
A camera’s homography can be found by using a GPS receiver to
collect the latitude and longitude coordinates of specific image points. H can be estimated using the corre-sponding coordinates with the four-point algorithm for a planar scene.11
CustomizationAnother design principle of the visu-alization module is to present infor-mation to a user only when needed. Complex environments are filled with activities and events that might be irrelevant for most users. A suc-cessful service will provide user- specific information to answer the most-relevant questions. An example of this design paradigm is person-alized traffic reports that generate
travel estimates given a user-specific commuter route.12
This design paradigm called for a simple interface that would abstract the database connection and com-munication from a user. The Canvas display customization is available through buttons that overlay results onto the map. In this way, the appro-priate SQL commands are generated by the Web page rather than by the op-erator, removing the need for training.
The user interface presents click-able controls to select camera feeds, change environmental context (see map layer in Figure 7a and aerial im-agery in Figure 7b), and display anal-ysis results.
Figure 6. Example showing typical behaviors learned from trajectories and abnormal activities that were automatically detected. (a) Training trajectories are in blue and the learned activities are overlayed in red. (b) A vehicle stops in the bus turnout. (c) A loop is performed through the bus turnout. The red hashed blue lines show example abnormalities.
(b)
(c)
(a)
IS-25-03-Morr.indd 57 14/05/10 11:46 AMAuthorized licensed use limited to: Univ of Calif San Diego. Downloaded on July 23,2010 at 16:30:30 UTC from IEEE Xplore. Restrictions apply.

58 www.computer.org/intelligent IEEE INTELLIGENT SYSTEMS
I n t e l l I g e n t M o n I t o r I n g
Figure 7. Canvas visualization page. (a) A campus street is monitored using two slightly overlapping cameras. The output of object classification and tracking is marked on the map. Icons indicate the object type and are placed on the map based on camera georegistration information that converts image coordinates to GPS latitude and longitude. (b) Environmental context is presented using an aerial highway image. The detected vehicles are marked with car icons, which appear in the different lanes.
(a)
(b)
IS-25-03-Morr.indd 58 14/05/10 11:46 AMAuthorized licensed use limited to: Univ of Calif San Diego. Downloaded on July 23,2010 at 16:30:30 UTC from IEEE Xplore. Restrictions apply.
MaY/juNE 2010 www.computer.org/intelligent 59
The two major user customization/selection modalities are video-feed selection and map layers. Video-feed selection is used to initialize raw video streams from up to two live feeds. The map layers provide the common map-based visualization of results. Map scale and naviga-tion is controlled through the Google Map API, and computational layers are created for the analysis modules (traffic flow, classification results, and trajectory analysis). We created a layer for each analysis type and camera pair. Figure 7 shows two dif-ferent classification layers. Figure 7a shows a classification layer denot-ing humans and vehicles on cam-pus, while Figure 7b shows vehicle tracking.
Further customization is possible with advanced users who design spe-cialized computational layers. Simi-lar to GIS software, a user would de-fine the queries necessary to extract
pertinent information as well as define any visualization layers. An exam-ple is a zone alert to monitor a sensi-tive region. The advanced user would specify a polygon in the image and search the tracks database for objects within this region.
Online, Mobile accessThe visualization block’s final goal is to provide access to informa-tion wherever it is needed through remote access. This allows more convenient monitoring because it does not have to occur on site. The Canvas visualization was built on Web technology to be platform inde-pendent and portable, relieving the need to design or compile different versions of the code for specific plat-forms. Besides remote availability, design in Web-based technologies makes it possible to realize mobile, portable access and help fulfill the promise of a ubiquitous age where
the rapid developments in mobile handset and network technologies can bring customized management services to all people.13 The increas-ing popularity of mobile applica-tions on cellular phones indicates the desire for instant connectivity and functionality.
EvaluationOver a single day the total accuracy for classification of eight different vehicle types was 78 percent for the Interstate 5 scene (see Figure 3c). Table 1 presents the accuracy for each hour of the day with sufficient lighting for vehicle detection. The performance degraded due to shad-ows cast during the mid-morning hours, but this could be amelio-rated using shadow-suppression techniques.
The highway traffic statistics mod-ule, named Vector,4 performed quite well. Comparison of the Vector
Technological advances in hardware, compression, and wireless transmission coupled with greater societal ac-ceptance has led to widespread deployment of video
cameras. These cameras stream vast amounts of information that need to be analyzed continually. Without computer-assistive technologies, such data would be impossible for human operators to process without errors or omissions of critical events due to inattention, fatigue, or boredom.
Trajectory learning is one of the key techniques for auto-matic activity analysis in surveillance systems. Trajectory de-scriptors have been used successfully for video indexing and retrieval and are used increasingly along with data-mining and machine-learning techniques to understand activity.1–3 Rather than define activities of interest, models are built in an unsupervised fashion based on observed data. Through careful observation of motion, typical actions reveal an un-derlying scene structure, which can be extracted in three basic steps.4 First, objects are tracked and trajectories col-lected. The trajectories are compared and then grouped by clustering. Finally, each cluster of trajectories is compactly summarized by a modeling technique and stored for future comparison.
The advantages of automatic surveillance based on tra-jectory learning are as follows:
• Increasedflexibility. Motion is a low-level feature that can be extracted in a variety of indoor or outdoor sur-veillance environments.
• Reducedrelianceonexpertoperators. Activities are not defined by hand but by data.
• Principledmethodsfordeterminingatypicalactivities. Anomalies are statistically determined and data-driven.
• Real-timeimplementation. Activity models are typically simple for fast comparison and can be evaluated as data arrives.
Using the trajectory models, it is possible to classify observed activities, detect abnormal activities, and make better long-term predictions on future activities by lever-aging historical data. In addition, all this analysis can be performed in real time, which ensures a timely detection response.
References 1. N. Anjum and A. Cavallaro, “Multifeature Object Trajectory
Clustering for Video Analysis,” IEEETrans.CircuitsSystemsVideoTechnologies, vol. 18, no. 11, 2008, pp. 1555–1564.
2. L. Patino et al., “Extraction of Activity Patterns on Large Video Recordings,” ComputerVision, vol. 2, no. 2, 2008, pp. 108–128.
3. C. Piciarelli, C. Micheloni, and G. Luca Foresti, “Trajectory-Based Anomalous Event Detection,” IEEETrans.CircuitsSys-temsVideoTechnolology, vol. 18, no. 11, 2008, pp. 1544–1554.
4. B.T. Morris and M.M. Trivedi, “A Survey of Vision-Based Trajectory Learning and Analysis for Surveillance,” IEEETrans.CircuitsSystemsVideoTechnolology, vol. 18, no. 8, 2008, pp. 1114–1127.
trajectory learning for Intelligent Monitoring
IS-25-03-Morr.indd 59 14/05/10 11:46 AMAuthorized licensed use limited to: Univ of Calif San Diego. Downloaded on July 23,2010 at 16:30:30 UTC from IEEE Xplore. Restrictions apply.

60 www.computer.org/intelligent IEEE INTELLIGENT SYSTEMS
I n t e l l I g e n t M o n I t o r I n g
statistics module with hand-counted flow shows an error count of less than two vehicles over a 30- minute period (see Figure 8a). Longer- term comparison with Berkeley’s Performance Measurement System (PeMS) shows strong correla-tion with loop detectors, the stan-dard traffic management sensor (see Figure 8b). Notice the large flow disturbance at 18:00 that is closely tracked.
The HMM-based trajectory model-ing procedure was able to accurately classify vehicles into the correct lane on either side of the Interstate 5 scene.
Table 2 shows the performance in each lane in either direction. The northbound direction has slightly lower performance because the lanes appear closer in the image due to pro-jective distortion.
Table 3 displays further results for prediction and abnormality detec-tion. The Cross experiment consid-ered a traffic intersection similar to the scene shown in Figure 5 but view-ing cars. The accuracy is lower in this situation because of more complex behaviors and also a larger number of activities, but it still achieves a high level of performance.
Future work will provide custom-ized feedback to users. Feedback
can be provided to users through in-frastructure communication. The proliferation of GPS-enabled de-vices provides a new way of detect-ing people and vehicles on much larger scale. We can improve track-ing by fusing GPS and visual tracks and using them for more advanced situational assessments. Connecting Canvas to other devices could allow, for example, warnings to be issued to a pedestrian’s phone or notifications to drivers in potentially dangerous situations.
Trajectory dynamics analysis provides low-level situ-ational awareness to a range of surveillance applica-tions. Typical motion is repetitive, which allows event
analysis in the context of historically meaningful motions.1,2
LearningLearning activities include the following:
• Tracking. Objects are tracked and trajectories, Fi, are collected into a training database. F = {f1, …, ft}, where ft = [x,y,u,v] (note that xy is the position and the associ-ated velocities are uv).
• Clustering. Trajectories are clustered into similar groups, where each grouping is indicative of a typical activity. Similarity is measured using trajectory-specific distance measures D(Fi,Fj) that are designed to handle the vary-ing lengths of trajectories.3
• Clustervalidation. The number of activities in a scene is unknown a priori and must be estimated based on the similarity of clusters.1
• Modeling. Each activity cluster is probabilistically mod-eled for inference. A trajectory’s spatiotemporal proper-ties are encoded in a hidden Markov model (HMM) l = (A,B, p). The likelihood P(F |li) of a trajectory being a realization of activity li can be computed using the forward-backward algorithm.4
AnalysisUsing the automatically learned models, we can describe the current activity in a scene in real time.
• Activityclassification. A trajectory is classified based on the most likely model to generate it:
λ λ
λ λ
∗ =
=
argmax ( | )
argmax ( | ) ( )k
k
kk k
p F
p F p
• Pathprediction. Long-term predication is made based on expected activities. The predicted activity changes based on the amount of data available at the current time: ˆ argmax ( | ˆ )λ λ= +
jj t t kp w F
wherewtis a windowing function and F̂t k+ is the trajectory up to the current time t as well as k predicted future tracking states.
• Abnormalitydetection. An atypical trajectory is identified because it does not fit any learned model well. The detection sensitivity is controlled by an adjustable threshold L
λ∗ that can be learned during training:
p F L( | ˆ )λ
λ∗ < ∗
References 1. W. Hu et al., “A System for Learning Statistical Motion Pat-
terns,” IEEETrans.PatternAnalysisandMachineIntelligence, vol. 28, no. 9, 2006, pp. 1450–1464.
2. B.T. Morris and M.M. Trivedi, “Learning, Modeling, and Classification of Vehicle Track Patterns from Live Video,” IEEETrans.IntelligentTransportationSystems, vol. 9, no. 3, 2008, pp. 425–437.
3. B. Morris and M.M. Trivedi, “Learning Trajectory Patterns by Clustering: Experimental Studies and Comparative Evalua-tion,” Proc.IEEEConf.ComputerVisionandPatternRecogni-tion, IEEE CS Press, 2009, pp. 312–319.
4. L.R. Rabiner, “A Tutorial on Hidden Markov Models and Se-lected Applications in Speech Recognition,” Proc.IEEE, vol. 77, no. 2, 1989, pp. 257–286.
theory of trajectory learning
IS-25-03-Morr.indd 60 14/05/10 11:46 AMAuthorized licensed use limited to: Univ of Calif San Diego. Downloaded on July 23,2010 at 16:30:30 UTC from IEEE Xplore. Restrictions apply.

MaY/juNE 2010 www.computer.org/intelligent 61
Table 1. Percentage accuracy for hourly test clips.
Time Sedan Pickup SUV Van Semi Truck Bike Other Total
No. of trajectories evaluated
06:21 94.9 59.5 81.9 31.6 50.0 33.3 0 97.5 81.5 405
07:19 96.2 32.5 83.2 06.7 66.7 25.0 100 98.0 84.7 497
08:17 61.2 33.3 91.9 14.3 50.0 50.0 100 96.7 97.6 530
09:15 53.2 38.7 82.3 53.9 37.5 23.1 100 96.8 63.7 444
10:13 36.8 26.7 77.3 26.7 71.4 40.0 0 93.9 51.0 357
11:11 63.4 47.2 90.4 28.0 66.7 33.3 – 89.6 68.6 417
12:09 86.0 71.7 82.6 48.0 50.0 37.5 100 96.9 80.0 432
13:08 95.6 76.3 83.5 39.1 100 50.0 – 97.9 87.0 393
14:06 96.9 77.8 84.2 18.2 – 66.7 100 94.9 86.2 449
15:04 96.0 76.4 81.9 23.1 100 09.1 100 100 85.4 492
16:02 97.1 66.2 76.0 24.0 100 55.6 100 100 85.7 553
17:00 99.1 65.5 62.0 03.6 – 0 100 94.5 83.0 630
17:45 89.0 75.9 52.8 10.0 – 100 67.0 97.7 76.0 297
18:45 96.0 57.9 73.9 10.5 – 100 50.0 97.9 84.6 382
19:43 95.0 77.8 78.5 0 100 100 – 100 86.5 222
Figure 8. Evaluation results. (a) Comparison with true lane flow over 30 minutes. (b) Flow comparison with PeMS loop detector data.
16:30 16:36 16:42 16:48 16:54 17:000
2
4
6
8
10
12
14
16
Time (24 hour clock)(a)
Flow
(veh
icle
s/30
sec
)
True 5 min averageVectorError
7 8 9 10 11 12 13 14 15 16 17 18 190
100
200
300
400
500
600
700
Time (24 hour clock)
Flow
(veh
icle
s/5
min
)
(b)
PeMSVectorError
Table 2. Interstate 5 lane classification performance.
Interstate direction Lane 1 (%) Lane 2 (%) Lane 3 (%) Lane 4 (%) Total (%)
South 98.7 100 96.2 97.6 98.0
North 100 91.7 84.4 94.6 93.0
IS-25-03-Morr.indd 61 14/05/10 11:46 AMAuthorized licensed use limited to: Univ of Calif San Diego. Downloaded on July 23,2010 at 16:30:30 UTC from IEEE Xplore. Restrictions apply.

62 www.computer.org/intelligent IEEE INTELLIGENT SYSTEMS
I n t e l l I g e n t M o n I t o r I n g
AcknowledgmentsThis research is supported by research grants from the University of California Transportation Center (US Department of Transportation Center of Excellence) and the UC Discovery Program. We acknowl-edge the contributions of Diego Villaseñor of the University of California, Riverside, under the UC LEADS research scholar pro-gram; Jeff Ploetner; and other colleagues from the Computer Vision and Robotics Re-search (CVRR) Laboratory. We also thank the reviewers and guest editors for their constructive comments.
References1. H.M. Dee and S.A. Velastin,
“How Close Are We to Solving
the Problem of Automated Visual
Surveillance?” Machine Vision and
Applications, vol. 19, no. 5, 2008,
pp. 329–343.
2. M.M. Trivedi, T.L. Gandhi, and
K.S. Huang, “Distributed Interactive
Video Arrays for Event Capture and
Enhanced Situational Awareness,”
IEEE Intelligent Systems, vol. 20,
no. 5, 2005, pp. 58–66.
3. “Traffic Monitoring Guide,” Office of
Highway Policy Information, US Dept.
of Transportation, 2008, www.fhwa.
dot.gov/ohim/tmguide/.
4. B.T. Morris and M.M. Trivedi,
“Learning, Modeling, and Classifica-
tion of Vehicle Track Patterns from Live
Video,” IEEE Trans. Intelligent Trans-
portation Systems, vol. 9, no. 3, 2008,
pp. 425–437.
5. B. Morris and M.M. Trivedi,
“Learning Trajectory Patterns by
Clustering: Experimental Studies and
Comparative Evaluation,” Proc. IEEE
Conf. Computer Vision and Pattern
Recognition, IEEE CS Press, 2009,
pp. 312–319.
6. T.B. Hall and M.M. Trivedi, “A Novel
Interactivity Environment for Inte-
grated Intelligent Transportation and
Telematic Systems,” Proc. IEEE Conf.
Intelligent Transportation Systems,
IEEE Intelligent Transportation Soc.,
2002, pp. 396–401.
7. S.J. Landry, T.B. Sheridan, and
Y.M. Yufik, “A Methodology for
Studying Cognitive Groupings in a
Target-Tracking Task,” IEEE Trans.
Intelligent Transportation Systems,
vol. 2, no. 2, 2001, pp. 92–100.
8. M.A. Goodrich et al., “Supporting
Wilderness Search and Rescue using a
Camera-Equipped Mini UAV,” J. Field
Robotics, vol. 25, nos. 1–2, 2008,
pp. 89–110.
9. A. Calbi, C.S. Regazzoni, and
L. Marcenaro, “Dynamic Scene
Reconstruction for Efficient Remote
Surveillance,” Proc. IEEE Int’l Conf.
Advanced Video and Signal-Based
Surveillance, IEEE CS Press, 2006,
pp. 99–104.
10. J.L. Drury et al., Comparing Situa-
tion Awareness for Two Unmanned
Aerial Vehicle Human Interface
Approaches, tech. report 06-0692,
Mitre, 2006.
11. Y. Ma et al., An Invitation to 3-D
Vision: From Images to Geometric
Models, Springer, 2005.
12. G. Chockalingam, “California Wireless
Traffic Report,” 2009, http://traffic.
calit2.net/.
13. E.-S. Ryu and C. Yoo, “Towards Build-
ing Large Scale Live Media Streaming
Framework for a U-City,” Multimedia
Tools and Applications, vol. 37, no. 3,
2008, pp. 319–338.
Table 3. Trajectory learning experimental results.
Experiment Nlanes
Lane assignmentAbnormality
detection Lane assignment Live predictionUnusual event
detection
R/N*Accuracy
(%) R/N*Accuracy
(%) R/N*Accuracy
(%) R/N*Accuracy
(%) R/N*Accuracy
(%)
Cross 19 9,191/ 9,500 96.7 168/
200 84 35,197/ 41,871 84.1 35,077/
41,871 83.8 830/ 999 83.1
Interstate 5 8 879/ 923 95.0 – – 14,045/
14,876 94.4 13,859/ 14,876 93.2 – –
*R is the correctly numbered examples, and N is the total number of test examples.
Selected CS articles and columns are also available for free at
http://ComputingNow.computer.org.
t h e A u t h o r sBrendan Tran Morris is a postdoctoral researcher with the Computer Vision and Robotics Research Laboratory at the University of California, San Diego. His research interests in-clude intelligent surveillance systems, recognizing and understanding activities in video through machine learning, and in-vehicle behavior prediction for driver assistance and safety. Morris has a PhD in electrical and computer engineering from UCSD. Contact him at [email protected].
Mohan Manubhai Trivedi is a professor of electrical and computer engineering and the founding director of the Computer Vision and Robotics Research Laboratory at the University of California, San Diego. His research interests include machine and human perception, distributed video systems, multimodal affect and gesture analysis, human- centered interfaces, intelligent driver assistance, and transportation systems. He is a fel-low of IEEE and the Society of Photo-Optical Instrumentation Engineers (SPIE). Contact him at [email protected].
IS-25-03-Morr.indd 62 14/05/10 11:46 AMAuthorized licensed use limited to: Univ of Calif San Diego. Downloaded on July 23,2010 at 16:30:30 UTC from IEEE Xplore. Restrictions apply.