continental airlines, inc. 1999 annual report - · pdf filecontinental airlines, inc. 1600...
TRANSCRIPT

“ f ive years ofworking together”1 9 9 9 A n n u a l R e p o r t
C o n t i n e n t a l A i r l i n e s

S T O C K H O L D E R I N F O R M A T I O N
Headquart er s
Continental Airlines, Inc.
1600 Smith Street
Houston, TX 77002
Tel. (713) 324-5000
Inve s tor Informat ion
To obtain a Form 10-K or other
financial information, visit the company’s
website at: www.continental.com
or write:
Investor Relations
Continental Airlines, Inc.
P.O. Box 4607
Houston, TX 77210-4607
Transfer Agen t and Reg i s t rar
Harris Trust and Savings Bank
311 West Monroe
P.O. Box A3504
Chicago, IL 60690-3504
Attn: Shareholder Services
Tel. (800) 846-2914
Independen t Accoun tan t s
Ernst & Young LLP
One Houston Center
1221 McKinney
Houston, TX 77010-2007
Common Stock
Continental’s Class B and Class A common stock trade on the New
York Stock Exchange under the symbols CAL and CAL.A. As of
February 16, 2000, there were 52,001,821 shares of Class B and
11,262,949 shares of Class A common stock outstanding, with
approximately 14,668 holders of record of Class B and 2,884 hold-
ers of record of Class A.
Holders of Class B common stock are entitled to one vote per
share, and holders of Class A common stock are entitled to ten
votes per share, on all matters submitted to a vote of common
stockholders, subject to restrictions governing voting rights of
holders who are not United States citizens. Shares of Class A
common stock are convertible at any time into an equal number
of shares of Class B common stock. The Company has not paid
cash dividends on its common stock and has no current inten-
tion to do so. Certain of the Company’s credit agreements and
indentures limit the ability of the Company and certain of its
subsidiaries to pay cash dividends.
Below are the high and low sale prices for the Class B and
Class A common stock as reported on the New York Stock Exchange
for 1999 and 1998:
Class B and Class A Stock Prices for 1999 and 1998
Class B Class A
1999 1998 1999 1998
High Low High Low High Low High Low
First Quarter $4111⁄16 $30 $621⁄16 $44 $4415⁄16 $341⁄8 $641⁄4 $473⁄4
Second Quarter $48 $367⁄16 $64 $541⁄16 $48 $3613⁄16 $641⁄2 $553⁄4
Third Quarter $449⁄16 $315⁄8 $651⁄8 $353⁄4 $443⁄8 $3113⁄16 $643⁄4 $361⁄2
Fourth Quarter $443⁄8 $323⁄8 $4213⁄16 $287⁄8 $4411⁄16 $323⁄16 $435⁄16 $307⁄8
1999 Accomplishments
Fly to Win
■ Added four destinations in Europe and the Middle East, giving us more transatlantic routes from New York than any other carrier
■ Continued to enjoy domestic length-of-haul adjusted RASM premium to the industry
■ Joined with dozens of other airlines to create the leading Internet portal for booking travel, to be launched in 2000
■ Continued our profitable growth from our underdeveloped hubs
■ Drove up on-line bookings on Continental’s website by 173 percent, with E-Ticket sales rising to 47 percent of total sales by the end of
the year
Fund the Future
■ Ended fourth consecutive year with more than $1 billion in cash and short-term investments ($1.6 billion)
■ Took delivery of 58 new Boeing jets and retired 61 older planes, giving Continental one of the youngest jet fleets in the industry, just
7.4 years
■ Continued stock buy-backs, spending $751 million through December 31, 1999 of an authorized $1.2 billion share repurchase program
■ Started operations at a third Newark terminal and updated facilities throughout our franchise hubs
■ Achieved significant income from the sale of non-strategic assets, including our interest in Amadeus and a portion of Equant N.V.
Make Reliability a Reality
■ Implemented Customer First, putting our service promises into plain English for our customers
■ Expanded our Presidents Clubs by adding three lounges
■ Added larger bins to permit our customers to carry on their bags
■ Working to convince Congress to modernize and privatize the air traffic control system
Working Together
■ Paid fifth consecutive year of profit sharing
■ Delivered on our compensation promises and pay for performance
■ Negotiated “Best in Market” health care plans, reducing the cost of health care to most employees
■ Gave away 16 more new Ford Explorers for perfect attendance
■ Signed Continental and Continental Express mechanic contracts
Awards and Recognition
■ Named to Fortune’s “100 Best Companies to Work For in America” list for second consecutive year, moving up to the No. 23 position
■ Ranked as the No. 2 most admired global airline by Fortune magazine
■ Ranked as the No. 2 most admired U.S. airline by Fortune magazine
■ Called the “best airline in the U.S.” by Fortune magazine
■ Named the top-rated U.S. airline for business travel by The Wall Street Journal’s Smart Money magazine
■ Frequent Flyer/J.D. Power and Associates - No. 1 in customer satisfaction on long-haul flights (ranked No. 1 or No. 2 for four
consecutive years)
■ InsideFlyer’s Freddie Awards - OnePass won four awards, including “Program of the Year” and “Best Elite-Level Program”
■ Forrester PowerRankings, Gomez Advisors and NPD Research - No. 1 website
■ OAG Awards - Best Short Haul Executive/Business Class and Best Frequent Flyer Program, only U.S. carrier to win an OAG award
■ Nikkei Business Magazine - Best foreign-flag carrier to North America
■ Travel Trade Gazette Europa - Top airline to North America
■ Inflight Research Services - Top U.S. airline
■ Condé Nast Traveler - Best Transatlantic and Transpacific Business Class among U.S. airlines
■ Hispanic magazine - one of the 100 Best Companies providing the most opportunities for Hispanics
■ National Airline Quality Rating Study -Ranked No. 2 (up from No. 3 last year and last three years ago)

F I N A N C I A L H I G H L I G H T S A N D O P E R A T I N G S T A T I S T I C S
(In millions of dollars, except per share data)
Year Ended December 31,1999 1998 1997 1996 1995
Operating Revenue . . . . . . . . . . . . . . . . . . . . . . . . . $ 8,639 $ 7,927 $ 7,194 $ 6,347 $ 5,816
Total Operating Expenses . . . . . . . . . . . . . . . . . . . . 8,039 7,226 6,478 5,822 5,431
Operating Income . . . . . . . . . . . . . . . . . . . . . . . . . . 600 701 716 525 385
Income Before Income Taxes,
Minority Interest, Cumulative Effect of
Accounting Changes, Extraordinary
Charge and Special Items1 . . . . . . . . . . . . . . . . . . 553 770 640 556 202
Income Before Cumulative Effect of
Accounting Changes and Extraordinary Charge . . . 488 387 389 325 224
Net Income . . . . . . . . . . . . . . . . . . . . . . . . . . . . . . . 455 383 385 319 224
Income Applicable to Common Shares . . . . . . . . . . $ 455 $ 383 $ 383 $ 314 $ 215
Earnings per Common Share . . . . . . . . . . . . . . . . . . $ 6.54 $ 6.34 $ 6.65 $ 5.75 $ 4.07
Earnings per Common Share
Assuming Full Dilution . . . . . . . . . . . . . . . . . . . . $ 6.20 $ 5.02 $ 4.99 $ 4.17 $ 3.37
1 Special items include a fleet disposition/impairment loss of $81 million and a net gain on the sale of non-strategic assets of $326 million in 1999, a fleet disposition/impairment loss of $122 million in 1998, a fleet disposition charge of $128 million in 1996 and a gain on the sale of System One of $108 million in 1995.
O P E R A T I N G S T A T I S T I C S
(Jet operations only, excluding regional jets operated by Continental Express)
1999 1998 1997 1996 1995
Revenue passengers (thousands) . . . . . . . . . . . . . . . 45,540 43,625 41,210 38,332 37,575
Revenue passenger miles (millions) (a) . . . . . . . . . . 60,022 53,910 47,906 41,914 40,023
Available seat miles (millions) (b) . . . . . . . . . . . . . . 81,946 74,727 67,576 61,515 61,006
Passenger load factor (c) . . . . . . . . . . . . . . . . . . . . . 73.2% 72.1% 70.9% 68.1% 65.6%
Breakeven passenger load factor (d), (e) . . . . . . . . . 65.6% 61.6% 60.1% 60.7% 60.8%
Passenger revenue per available seat mile . . . . . . . . 9.06¢ 9.23¢ 9.29¢ 9.01¢ 8.26¢
Operating cost per available seat mile (e) . . . . . . . . 9.03¢ 8.89¢ 9.04¢ 8.75¢ 8.35¢
Average yield per revenue passenger mile (f) . . . . . . 12.37¢ 12.79¢ 13.11¢ 13.22¢ 12.59¢
Average price per gallon of fuel . . . . . . . . . . . . . . . . 47.31¢ 46.83¢ 62.91¢ 60.92¢ 55.02¢
Fuel gallons consumed (millions) . . . . . . . . . . . . . . 1,542 1,487 1,357 1,228 1,203
Actual aircraft in fleet at end of period (g) . . . . . . . . 363 363 337 317 309
(a) The number of scheduled miles flown by revenue passengers.(b) The number of seats available for passengers multiplied by the number of scheduled miles those seats are flown.(c) Revenue passenger miles divided by available seat miles.(d) The percentage of seats that must be occupied by revenue passengers in order for the airline to breakeven on income before income taxes, excluding non-
recurring charges, nonoperating items and other special items.(e) 1999, 1998 and 1996 exclude a fleet disposition/impairment loss totaling $81 million, $122 million and $128 million, respectively.(f) The average revenue received for each mile a revenue passenger is carried.(g) 1999 excludes four all-cargo 727 CMI aircraft and one A300, three 747, three DC-9-30, three DC-10-30 and two 727 Continental aircraft that have been
removed from service. 1998 excludes six all-cargo 727 CMI aircraft and one A300 and one 747 Continental aircraft that were removed from service. 1997excludes six all-cargo 727 CMI aircraft and two 737-100s that were removed from service in 1997 and three DC-10-30 Continental aircraft that were deliv-ered in 1997, but were not placed into service until 1998. 1996 excludes four all-cargo 727 aircraft at CMI, three A300 and one 747 Continental aircraftthat were removed from service in 1995 and four DC-10-30 Continental aircraft that were delivered in 1996, but were not placed into service until 1997.

2
T O O U R C O - W O R K E R S , C U S T O M E R S A N D S T O C K H O L D E R S
1999 was our fifth straight banner year!
The highlight of the year was once again being recognized as an airline that has the
essential elements for long term success - a consistent, high-quality product proudly
delivered by people who enjoy coming to work every day.
In January 2000, we again appeared as one of Fortune magazine’s “100 Best
Companies to Work For in America,” moving up to number 23 on the list. In 1999,
which was our first year ever to even be invited for consideration, we ranked number
40, so we climbed 17 spots while 35 other companies on the same list dropped off as
others passed them for this coveted award. Many of our competitors have expressed
their ambition to be on this prestigious list, but in both years only one managed
to make it. We are proud that Fortune and our co-workers once again recognized
Continental in this manner.
In addition, customers again voted us as the top customer satisfaction airline in
1999, awarding us the Frequent Flyer magazine/J.D. Power Award. We now have won
this highly regarded award three times in the last four years. No other airline has man-
aged to show this level of consistent, award-winning performance.
In fact, our trophy case is bursting at the seams with awards. We won the prestigious
1999 Freddie Award for the third straight year for delivering the best frequent flyer pro-
gram, and we’ve received multiple accolades recognizing Continental’s BusinessFirst
product as best in class across the Atlantic and the Pacific from highly regarded pub-
lications such as The Wall Street Journal, Nikkei Business, and Condé Nast Traveler.
We also had a stellar year financially. In 1999, we delivered our fifth straight year
of profitability and led the industry in stock price appreciation. Our stock price
increased 32.5 percent over the course of the year. We finished the year with $1.6 bil-
lion of cash and short-term investments while financing all of our new aircraft at an
average rate under 7 percent and our new hub facilities under 6.5 percent.
No matter how you measure us - as a co-worker, customer or stockholder - we can
say unequivocally that Continental is one of the best companies anywhere in the world.
The Go Forward Plan1995-1999
Five years ago, we told you we
needed to act like a real air-
line. We started with the basic
understanding that “what gets
measured and rewarded gets
done.” This led to the develop-
ment of the Go Forward Plan.
Its four cornerstones are Fly to
Win (our market plan), Fund
the Future (our financial plan),
Make Reliability A Reality (our
product plan), and Working
Together (our people plan).
Each of these is practical,
measurable, flexible and, most
importantly, makes sense to
our co-workers.
The Go Forward Plan is
more relevant than ever as
we face new opportunities
and challenges.

“Over 50 thousand co-workers , in 40 countr ies , working together to make the plan succeed”


We entered the new millennium with lots of momentum and big plans. Over the past
five years, the world’s greatest employees have done the near-impossible and taken
Continental from “Worst to First.” As we look at the opportunities of the next five
years, we are confident our team can soar to even greater heights.
Our airline had a pre-tax loss excluding special charges of $204 million in 1994 and
radical surgery was required. We hired the best managers in the world and stopped
doing things that lost money. We canceled unprofitable routes, and reduced the pur-
chase price and financing costs of expensive airplanes. We returned needed amenities
to the product that our customers were willing to pay for, made our flights clean, safe,
and reliable, and began treating employees fairly. Well … it worked! We made $202
million in pre-tax income in 1995, $556 million in 1996, $640 million in 1997, $770
million in 1998, and $553 million this year (all special gains and charges excluded) -
a total of $2.7 billion over the last five years.
Once we stabilized the operation and became profitable, we began growing. We
grew our capacity 10 percent in both 1997 and 1998 while maintaining a 10 percent
operating margin (a first in the airline industry). In 1999, we also grew at 10 percent
while maintaining an operating margin slightly below our 10 percent target (8 percent),
due in large part to weak European yields and higher oil prices. In addition, we have
turned our domestic unit revenue (RASM) deficit to the industry (79 percent in 1994)
into a premium (107 percent in 1999) over the past five years.
We accomplished these record-setting results by continuing to build and expand
our underdeveloped franchise hubs in New York, Houston, Cleveland, and Guam. The
impact on our route structure over the past five years has been amazing, including:
■ Growing revenue out of our hubs from $4 billion to $8 billion
■ Increasing destinations served out of our hubs from 142 to 213
F ly T o W i n - T h e L a s t F i v e Y e a r s
1995-1999Fly to Win
1995 Domestic Revenue per
Available Seat Mile, load
factor and yield exceed
industr y average — a first
for Continental
1995 Continental starts jet service
to 10 cities, and they’re all
cash positive
1995 Continental restores First
Class seating on all airplanes
and restores its award-winning
frequent flyer program to for-
mer award levels
1995 Continental introduces new
financial concept: profitability
1996 Productivity improves in every
Continental work group
1997 23.6 percent international
growth leads the industr y as
Continental capitalizes on its
New York and Houston hubs
1997 70.9 percent load factor is an
all-time record
5

6
■ Entering 54 new destinations out of New York - 29 domestic, 13 European,
11 Latin, and one Pacific, including Amsterdam, Brussels, Zurich and Tel
Aviv, which we added in mid-1999
■ Increasing the destinations served out of Houston from 84 to 139, including
Tokyo and Sao Paulo, which we added in 1999
■ Doubling the cities served out of Cleveland while making it the fastest growing
hub in the United States, and now featuring daily non-stop service to London.
In addition, we now offer more transatlantic departures from New York than any
other carrier and we firmly have established Continental as the number two carrier to
Latin America.
Our franchise hubs still are undersized relative to competing hubs and, while we will
be slowing our growth in 2000 to help allow our operating margins to return to our 10
percent target, we will continue to grow our hubs profitably. Over the next five years,
our team will focus on maintaining 10 percent operating margins while:
■ Growing revenue out of our franchise hubs from $8 billion to over $12 billion
■ Growing destinations served out of our franchise hubs from 213 to 241
■ Increasing service from New York to Europe, the Caribbean, and the
transcontinental U.S.
■ Increasing service from Houston to Mexico, Europe, and the southeastern U.S.
■ Building regional jet service in Cleveland to feed additional larger jet service
into more long-haul markets
As the Internet dramatically changes the landscape of every industry, we are
positioning Continental to lead the way for airlines on the Internet. We recognize that the
web is changing how customers want to buy their tickets and manage their travel expens-
es, and we’re aggressively pursuing opportunities that the Internet makes available to us.
F ly t o W i n - T h e N e x t F i v e Y e a r s
1995-1999Fly to Win
1997 The awards start flowing
as OnePass wins six
of nine Freddie Awards,
including Program of
the Year and Best
Elite-Level Program
1998 The regional jet is suc-
cessfully integrated into
the fleet, producing stel-
lar profits and marking
the “beginning of the
end” of turboprops at
Continental Express
1998Work Hard. Fly Right. A
new advertising slogan
sums up the Continental
story in just four words
1998 E-Ticket begins interna-
tional roll-out, helping
to make automated self-
service a universally
accepted process
1999Growth in New York
makes Continental the
area’s leader in transat-
lantic destinations
1999Continental joins with
dozens of other airlines
to create the leading
internet portal for
booking travel


Both Continental and our customers can save money as hundreds of millions of dollars
of non-value-added costs can be removed from the current distribution system.
Each type of customer approaches the Internet differently, and we are developing
web-based solutions for every customer. For example, strictly price-sensitive cus-
tomers are moving away from the exclusive use of wholesalers and consolidators to
take advantage of the weekly web specials on our award-winning website, www.conti-
nental.com, and other airline-sponsored web sites. Loyal Continental customers soon
will be able to visit our website and get the guaranteed lowest available published fare
we have to offer. Finally, customers who want to access all the published inventory
available throughout the industry will be able to go to an expansive website we are
building with our alliance partner Northwest, and Delta and United.
Continental is also working hard to develop a global alliance network in order to
give our customers great service and OnePass frequent flyer mileage credit no matter
where they fly. These alliances also give our exclusive Presidents Club members the
opportunity to enjoy an expanding network of clubs worldwide.
Our alliance with Northwest is off to a great start. By the end of the first year of oper-
ation, more than 2,000 customers a day connected between Continental and Northwest.
We also expanded our long-standing relationship with Alitalia, and we are working with
KLM on a codeshare that we hope will pave the way for a global alliance called “Wings”
to be launched later this year. Our existing alliances with America West, Gulfstream,
Alaska/Horizon, COPA of Panama, Avant of Chile, Aserca/Air Aruba of Venezuela, CSA
Czech, Virgin Atlantic, EVA, and Air China round out our growing global network.
When we arrived five years ago, we were uncertain of our ability to meet all of our
financial obligations. Since that time, our team not only has delivered a record
five years of profit, but it also has generated significant cash flow. We ended 1999 with
$1.6 billion in cash and short-term investments, up from 1996, 1997 and 1998 year
end balances of $1.1 billion, $1 billion and $1.4 billion, respectively. We clearly have
the financial strength to weather the challenges ahead.
F u n d t h e F u t u r e - T h e L a s t F i v e Y e a r s
1995-1999Fund The Future
1995 Business Week’s NYSE
“Stock of the Year”
1996 Five-Year Flexible Fleet Plan
is developed, and orders for
757s and various 737 models
began to make Continental’s
fleet one of the youngest in
the industr y
1996 Go Forward Plan focuses on
growing underdeveloped hubs
1996 Year-end cash balance:
$1.1 billion
1997 Continental places orders for
new-generation 737s, 767s
and 777s
1997 $2.7 billion of new financings for
airplanes and facilities at an
average interest rate of 7 percent
1997 Year-end cash balance:
$1 billion
9

10
Since 1995, we have used our credibility in the financial markets to competitively
finance new airplanes and new facilities in our hubs. We have financed/refinanced
$10.9 billion in debt at an average interest rate of 7 percent versus the sky-high inter-
est rates we used to pay.
During 1999, we successfully opened new terminal facilities in our franchise hubs.
In Houston, Terminal B and the TerminaLink between Terminals B and C became fully
operational. In Cleveland, we opened the brand-new “best in industry” regional jet
passenger terminal. In Newark, we transitioned to new gates in Terminal A and added
to the gates we use in Terminals B and C. We also continued to add many new support
facilities - such as longer runways, more taxiways, maintenance hangars, parts ware-
houses, cargo buildings, training centers and simulators, and new crew lounges and
breakrooms - to provide our co-workers with the proper tools to do their jobs well.
Our long-term goal is to maintain a cash balance of $1 billion, and we have been very
aggressive in returning excess cash to our shareholders. During 1999, we announced
an increase of $900 million in planned stock buybacks, bringing the total program
to $1.2 billion. We plan to use the $449 million remaining in the program as of
December 31, 1999, to continue to repurchase our common stock. Shareholders also
should look for us to repurchase stock with half our future net income as well as the
net cash proceeds generated from future sales of non-strategic assets. For example, we
sold over $460 million worth of non-strategic assets in 1999 including our stakes in
Amadeus and a portion of our stake in Equant.
We would like to acquire our Class A common stock, including all the shares held
by Northwest Airlines. While we are very happy with the alliance with Northwest, and
committed to its continued performance, we do not believe it’s necessary for them to
hold our equity, as a simplification of our ownership structure would benefit both com-
panies and all shareholders.
F u n d t h e F u t u r e - T h e N e x t F i v e Y e a r s
1995-1999Fund The Future
1998 Continental completes
$2.9 billion of financing
at an average rate of
6.6 percent
1998 Year-end cash balance:
$1.4 billion
1998Continental repurchases
$223 million of its stock
1999 Continental repurchases
$528 million of
its stock
1999 Continental ends the
year with $1.6 billion in
cash and short-term
investments
1999 Continental grows into a
third Newark terminal
and starts work on a
third major concourse
for Terminal C
1999 Continental takes
delivery of 58 new
Boeing jets and retires
61 older aircraft,
dropping the jet fleet
age to just 7.4 years


In the meantime, as a result of our new financial strength and fleet modernization
program, we’ve reduced Continental’s average jet fleet age to only 7.4 years, one of the
youngest in the industry. The net effect is that our customers now get a much better
product at an overall lower cost to Continental. Our fleet orders, coupled with lease
expirations and extensions, have been designed to drive fleet commonality and allow
us to grow anywhere from 0 to 8 percent annually. These new airplanes all are Boeing
and include the 737-500 (104 seats); the newer, faster 737-700 (124 seats); 737-800
(155 seats); 737-900 (167 seats); 757 (183 seats); and the new “Queen of the Skies,”
the 777 (283 seats). In 2000, we will retire over a third of our DC10-30s and replace
them with brand new 767-200s (174 seats) and the all new 767-400s (235 seats). The
remainder of our DC10-30s will be retired by 2003. Continental Express continues to
move toward its goal of having a common all-jet fleet utilizing the fast, quiet Embraer
145 (50 seats) and 135 (37 seats) aircraft. Today, over half of Continental Express
capacity is on regional jets.
Over the next few years, our customers can look forward to a new international ter-
minal with up to 15 new gates and an expanded TerminaLink in Houston, and completion
of the New York Global Gateway project. The New York project includes implementing
train service from New York’s Penn Station and World Trade Center to Newark Airport,
beginning airplane-to-high-speed-train connections to many cities within a two-hour
train ride of Newark; a three-level parking garage in front of Terminal C and expanding
the roadway from three to eight lanes; a new terminal that can handle 12 widebody or
20 narrowbody aircraft, including a new customs clearance facility; a new bag delivery
system to handle the increased volume; and many other improvements.
We have focused for the last five years on the basics of our business. This means get-
ting you to your destination safely, on time and with your bags; serving you good food
at meal times; installing comfortable new seats with headrests and GTE phones; and
providing you with the largest closets and overhead bins allowable to safely store your
M a k e R e l i a b i l i t y a R e a l i t y - T h e l a s t f i v e y e a r s
1995-1999Make ReliabilityA Reality
1995 For the first time in more than
a decade, all aircraft and
airport facilities carr y a
common corporate identity
1995 Continental gets serious about
DOT performance statistics,
ranking No. 1 in on-time
arrivals and baggage in the
fourth quarter
1996 We could get used to this:
Continental wins its first J.D.
Power Award
1996 Continental wins
Air Transpor t World’s
“Airline of the Year” award
1996 Continental gets taste as a
gourmet coffee, a microbrew
and Coca-Cola all get
on board
1997Continental wins an unprece-
dented, second consecutive
J.D. Power Award
13

14
bags. We also show you movies and videos on most of our longer flights. In addition,
we’ve expanded our Presidents Club network from 12 clubs in 1994 to 24 clubs in
1999. While we constantly are working hard to make the product better, we don’t see
any need to change the way we think: Our customers’ and co-workers’ preferences
come first, not as an afterthought. It is this focus that has won us so many awards in
the past and will continue to win us awards in the future.
We’ve worked hard to serve our customers even when we make a mistake. For
instance, we added a customer service hotline (1-800-WECARE2), a baggage hotline
to help locate lost bags (1-800-335-BAGS) and a 1-800 employee hotline so that report-
ed problems can be fixed right away. In 1999, we wrote down the promises we have
been delivering on for the past five years in a Customer First document that is avail-
able on-line and filed with the U.S. Department of Transportation. These promises
serve as a measuring stick for what we strive to live up to every day.
But, as always, we do need our customers’ help. Continental can serve customers bet-
ter if they include their name and address on the inside of their bag, instead of only
on an outside bag tag. Though we have one of the best baggage delivery rates in our
industry, occasionally bag tags are lost or torn from bags. Without a tag, we cannot
identify the owner of the luggage. Simply including contact information inside the bag
will allow us to return many bags to their rightful owners. You’ll be glad you did.
We also need help in convincing Congress to invest the necessary money and create
the right structure to modernize the air traffic control system and run it efficiently. The
system is outdated and, in spite of the hard work of the thousands of men and women
who serve as air traffic controllers, it is near gridlock. It now takes much longer than it
M a k e R e l i a b i l i t y a R e a l i t y - T h e N e x t F i v e Y e a r s
1995-1999Make Reliability
A Reality
1997Most improved company
of the 1990s on For tune
magazine’s annual Most
Admired Companies list
1997 Continental says “hello”
to GTE airfones through-
out the fleet
1998 Continental integrates
new Boeing 737-700,
737-800 and 777 air-
craft into its fleet
1999 Customer First puts
service promises into
plain English for
customer reference
1999 Employees earn the
on-time arrival bonus for
seven out of 12 months
1999 Continental wins
J.D. Power award for
third time, more than
any other airline ever

“Our customers ’ and co-workers ’ preferencescome f i rs t … I t i s thisfocus that will continue to win us awards.”


did a decade ago to make many popular trips. Customers currently pay billions of dol-
lars each year in ticket taxes, but precious little of this money is spent to improve the
flow of air traffic. Our air traffic control system needs to be put in private hands, as has
been done in Canada and other countries, so that the funds can be spent and incentives
can be put in place to solve this problem before customer delays get any worse.
Continental has proven beyond a shadow of a doubt that Working Together works!
Making Fortune magazine’s “100 Best Companies to Work For in America” list two
years in a row says it all. Our focus has remained on setting direction and then letting
everyone do their job without interference from management. We’ve encouraged our
co-workers to make decisions based on what benefits the customer and the Company.
This focus, along with treating everyone with the dignity and respect they deserve and
holding frequent forums where we can get feedback from our co-workers, is what has
made Continental a truly great place to work.
We also have delivered on our compensation promises and pay for performance. By
July 2000, all of our co-workers will be at industry average pay, just as we promised
three years ago. We made this promise because it was the right thing to do, as we sim-
ply refused to allow our Company to be financed on the backs of our co-workers. In
addition, we rewarded everyone with on-time bonuses and profit sharing so when our
customers and investors win, we all win.
We have continued to work to improve benefits, as well. We used our buying power
to negotiate “Best in Market” health care plans that actually have reduced the costs of
health care to most of our employees at a time when the cost of health care at other
companies is increasing dramatically. We added an additional holiday for everyone
and an extra week of vacation for our most senior employees.
W or k i ng T o g e t h e r - T h e C ata ly s t of O u r S u c c e s s
1995-1999Working Together
1995 Profit-sharing program
makes largest-ever payment
to employees
1995 Continental reaches a contract
with pilots for the first time in
12 years
1996 Continental reaches
agreement with all work
groups, including flight
attendants (IAM),
mechanics, airport agents,
ramp agents, reservations
agents,material specialists
and clerical staff
1997 Sick time, employee turnover
and on-the-job injuries
continue to drop
1998 Continental moves to new
downtown headquarters
1998 Continental signs a five-year
pilot contract, and a
three-year extension to
dispatcher contract
17

18
In 2000, now that we are at industry-average pay, we plan to benchmark all of our ben-
efits against our industry competitors so that we can make the appropriate improvements.
It is not surprising that everyone wants to work at Continental these days and no one
really wants to leave. In 1999, we had more than 120,000 applications for approxi-
mately 8,400 jobs and turnover was at an all-time low rate of 7 percent.
Working Together has given us careers, not just jobs, at the best airline in the world.
We are proud to be on the Continental team!
Five years ago, we told you we needed to act like a real airline. We had no momen-
tum and had barely avoided a total financial collapse. Today we can look forward to
the next five years with a profitable route structure that has room for significant growth,
a healthy balance sheet with more than enough cash, a brand-new aircraft fleet pur-
chased and financed at best-in-market rates and the world’s greatest co-workers. We
have all the momentum in the world. Our job isn’t done; it has barely begun.
We’re a successful team with a winning culture, and we’re going no place but up in
the years ahead.
Stick with us. You’ll be glad you did.
W or k i ng T o g e t h e r - T h e N e x t F i v e Y e a r s
Gordon Bethune
Chairman of the Board and Chief Executive Officer
Greg Brenneman
President and Chief Operating Officer
1995-1999Working Together
1998 Continental wins place
on For tune’s “100 Best
Companies to Work For
in America” list
1998 Aviation Week and
Space Technology says
Continental is “Best
Managed” among
U.S. carriers
1999 For a second year in a
row, Continental is voted
as one of For tune’s “100
Best Companies to Work
For in America,” moving
up to the No. 23 slot
1999 Over 120,000 people
apply for approximately
8,400 jobs
1999 Continental gives away
another 16 Ford
Explorers for Perfect
Attendance, bringing the
total to 66 cars
1999 Continental signs
mechanic contract

“For the second year in a
row, Cont inental was named
one of the ‘100 Best Companies
to Work For in America’ by
Fortune magazine.”

4:00Pacific
StandardTime
5:00MountainStandard
Time
6:00Central
StandardTime 7:00
EasternStandard
Time
To Anchorage
To Fairbanks,Juneau andKetchikan
To Anchorage
To Fairbanks and Anchorage
To Anchorage
To Honolulu
To Honolulu
To Honolulu
To�Honolulu
To�Honolulu
To Honolulu
To Honolulu
P A C I F I C
O C E A N
A T L A N T I C
O C E A N
G U L F O F
M E X I C O
Fayetteville
Columbus
Owensboro
Meridian
Columbus
Treasure Cay
Marsh Harbour
North Eleuthera
Nassau
Grand Forks
SpokaneWenatchee
Eugene
PortAngeles
Moses Lake
Yakima
Medford
North Bend
Eureka
Bozeman
Rapid City
Aspen
Sioux�Falls
SiouxCity
Kalispell
La�Crosse
GreatFalls
Bismarck
Aberdeen St. Cloud
Minot
Fargo
Pierre
Moline
Missoula
Pullman/�Moscow
LewistonWallaWalla
Bellingham
Pasco
Pendleton
Redmond
BoiseKlamath Falls
Redding
Billings
Palm Springs
Duluth
Ely
InternationalFalls
Knoxville
Traverse City
Alpena
Youngstown
Sault Ste. Marie
Hancock
Rhinelander
Rochester
Madison
Marquette
CedarRapids
Green Bay
Appleton
Dubuque
Rockford
Peoria Lafayette
Evansville
Springfield
Dothan
Mason City
Waterloo
Lincoln
Ft.Smith
Joplin
Greenville
Tupelo
EauClaire
Wausau
Des Moines
Freeport
GainesvilleTallahassee
Hattiesburg
Ft. Walton Beach
Chattanooga
HuntsvilleMuscleShoals
Jackson
Key West
Long Beach
Oakland�
Sacramento
Reno/Lake Tahoe
Burbank-Glendale-Pasadena
StateCollege
Seattle/Tacoma
Portland
SanFrancisco
San�Jose
Salt LakeCity
DenverEagle/Vail/Beaver Creek/Aspen Valley
Montrose/Telluride
Hayden/SteamboatSprings
ColoradoSprings
LasVegas
Los Angeles
Orange County(John Wayne)
Ontario
San Diego Phoenix
Tucson
Albuquerque
Kansas City
Wichita
Omaha
St.�Louis
Chicago(Midway)
Chicago(O’Hare)
Kalamazoo
GrandRapids
Milwaukee
Minneapolis/St. Paul
LansingDetroit
Flint
Saginaw
Cleveland
Erie
Columbus
Raleigh/Durham
Greensboro
Charlotte
Myrtle Beach
Ft. Wayne
Toledo
SouthBend
Indianapolis Dayton
Cincinnati
Lexington
Louisville
Akron/Canton
Baltimore
Philadelphia
Norfolk
RichmondCharleston
Washington, D.C.(Dulles)
Washington, D.C.(National)
New York (John F. Kennedy)
New York (La Guardia)
White�Plains
Allentown
HarrisburgPittsburgh
Newark
Scranton/Wilkes-Barre
Albany
Buffalo
Rochester
Syracuse
Hartford
Boston
Manchester
Portland
ProvidenceNantucket
Islip
Martha’s Vineyard
Burlington
Atlanta
Columbia
Greenville/Spartanburg
Charleston
Birmingham
New�Orleans
Gulfport/Biloxi
BatonRouge
Dallas/Ft. Worth
Tyler
Alexandria
Shreveport Monroe
LittleRock
Jackson
Mobile
PensacolaLakeCharles
Lafayette
Abilene
Waco
Lubbock
Midland/Odessa
Austin
Laredo
El Paso
College Station
Corpus Christi
Amarillo
Houston(Intercontinental)
Houston(Hobby) Houston
(Ellington)
Killeen
Harlingen
Brownsville
McAllen
Beaumont/Port Arthur
San Antonio
Victoria
Nashville
MemphisOklahoma
City
Tulsa
Orlando
Daytona Beach
Jacksonville
Savannah
Miami
Fort Lauderdale
WestPalmBeach
Fort Myers
Tampa
Sarasota
Dallas(Love)
SanAngelo
U n i t e d S tat e s R ou t e S y s t e mContinental Route Future Service Seasonal Service Codeshare Service Continental
DestinationPartner Airline
Destination
Destination

8:30 am
8:00
10:00
11:00
9:00 am
2:00
6:00
2:30
12:45
11:30
1:00
10:30
9:30
2:00
8:00
9:00
2:00
7:00 9:00 10:00 11:00 1:00 2:00 3:00 4:00 5:00 6:00 7:00 9:00 Noon12:00
1:00 2:00
8:007:00 9:00 10:00 11:00Midnight
12:00 12:00 1:00 2:00 3:00 4:00 5:00 6:00 7:00 8:00 9:00 10:00 11:00Noon12:00 1:00 2:00
MONDAY
SUNDAY
ASIA
AUSTRALIA
NORTHAMERICA
SOUTHAMERICA
AFRICA
EUROPE
P A C I F I C
O C E A N
P A C I F I C
O C E A N
A T L A N T I C
O C E A NIn
tern
atio
nal D
ate
Lin
eM
ON
DAY
SUN
DAY
Midnight12:00
Calgary
Puerto VallartaMexico City
Guadalajara
Aguascalientes
San Luis Potosí
Los Cabos
León/Guanajuato
Tampico
Ixtapa/Zihuatanejo
Honolulu
Los Angeles
Vancouver
MontrealOttawa
Quebec
Toronto
ClevelandDetroit
Hamilton
Newark
Bermuda
Halifax
Cancún
CozumelBelize City
Mérida
VeracruzPuebla
Guatemala City
San Salvador
CaracasSan José
Belo�Horizonte
PanamaCity
Managua
TegucigalpaSan Pedro Sula
Bogotá
QuitoGuayaquil
Lima
Santa Cruz
Nassau
SantoDomingo
PuertoPlata
Aruba
SanJuan
St. Maarten
St. Thomas
Antigua
Manchester
Glasgow
Birmingham
London(Gatwick) Brussels
DublinShannon
Frankfurt
Zurich
Düsseldorf
Paris
MadridRome
Milan
NagoyaOkayama
OsakaFukuoka
Taipei
Koror
Denpasar/Bali
Yap Truk Pohnpei
KosraeMajuro
Cairns
Kwajalein
Johnston IslandSaipan
HongKong
Guam
Manila
Tokyo
SendaiNiigata
Sapporo
Lisbon
Acapulco
MonterreyTorreonMazatlán
Saltillo
Minneapolis/St. Paul
HoustonSan�AntonioChihuahua
São�Paulo
Santiago
Rio deJaneiro
London�(Heathrow)
Tel Aviv
Amsterdam
Seattle/Tacoma
Regina
Victoria
Kelowna
San�FranciscoSeoul
Bangkok
Singapore
Saskatoon
Portland
Winnipeg
Cabo San Lucas
Edmonton
NewYork
Boston
Thunder BayKenora
Washington,D.C. (Dulles)
London
Prague
GrandCayman
St.�Kitts
Tortola/Virgin Gorda
St.�Croix
Miami
MontegoBay
OrlandoTampa
FOLD
FOLD
I n t e r nat iona l R ou t e S y s t e m Continental Route Future Service Seasonal Service Codeshare Service ContinentalDestination
Partner Airline
Destination
Destination

C O N T I N E N T A L A T A G L A N C E
95
$202
$556
$640
$770
$553
96 97 98 99 95
65.6%
50%$0 5 years
$0 0%35.0%
68.1%
70.9%72.1%
73.2%
96 97 98 99 95
14.4
13.7
10.7
7.6 7.4
96 97 98 99
95
38.3%
42.8%
43.8%44.3%
45.0%
96 97 98 99 95
$68
$639
$1,303
$2,413
$3,921
96 97 98 99 95
11.7%
18.0%
22.6%
33.9%
47.7%
96 97 98 99
Pre-Tax Income Load Factor Improvement Average Jet Fleet Age
Revenue Derived from Business Travelers E-T icket Sales Percent of Fleet with V ideo
Millions of dollars, excluding special items and gains
Millions of dollars Including CMI
At year end, including CMI and CO Express
20

C o n t i n e n t a l A i r l i n e s 1 9 9 9 A n n u a l R e p o r t 2 5
Financial Information
Management’s Discussion and Analysis
of Financial Condition and Results of Operations . . . . . . . . . . . . . . . . . . . . . . . . . . . . . . . . . . . . . . . . . . . . . . . . . . . . . . . . . . . . . . . . 26
Consolidated Statements of Operations for each of the
Three Years in the Period Ended December 31, 1999 . . . . . . . . . . . . . . . . . . . . . . . . . . . . . . . . . . . . . . . . . . . . . . . . . . . . . . . . . . . . 37
Consolidated Balance Sheets as of December 31, 1999 and 1998 . . . . . . . . . . . . . . . . . . . . . . . . . . . . . . . . . . . . . . . . . . . . . . . . . . . . . 38
Consolidated Statements of Cash Flows for each of the
Three Years in the Period Ended December 31, 1999 . . . . . . . . . . . . . . . . . . . . . . . . . . . . . . . . . . . . . . . . . . . . . . . . . . . . . . . . . . . . 40
Consolidated Statements of Redeemable Preferred Stock
and Common Stockholders’ Equity for each of the
Three Years in the Period Ended December 31, 1999 . . . . . . . . . . . . . . . . . . . . . . . . . . . . . . . . . . . . . . . . . . . . . . . . . . . . . . . . . . . . 42
Notes to Consolidated Financial Statements . . . . . . . . . . . . . . . . . . . . . . . . . . . . . . . . . . . . . . . . . . . . . . . . . . . . . . . . . . . . . . . . . . . . . . 44
Report of Independent Auditors . . . . . . . . . . . . . . . . . . . . . . . . . . . . . . . . . . . . . . . . . . . . . . . . . . . . . . . . . . . . . . . . . . . . . . . . . . . . . . . . 65
Report of Management . . . . . . . . . . . . . . . . . . . . . . . . . . . . . . . . . . . . . . . . . . . . . . . . . . . . . . . . . . . . . . . . . . . . . . . . . . . . . . . . . . . . . . . . 65
2 6 C o n t i n e n t a l A i r l i n e s 1 9 9 9 A n n u a l R e p o r t
The following discussion may contain forward-looking statements.
In connection therewith, please see the cautionary statements con-
tained in Continental Airlines, Inc.’s Annual Report on Form 10-K
for the year ended December 31, 1999, which identifies important
factors that could cause actual results to differ materially from
those in the forward-looking statements. Hereinafter, the terms
“Continental” and the “Company” refer to Continental Airlines,
Inc. and its subsidiaries, unless the context indicates otherwise.
Continental’s results of operations are impacted by seasonal-
ity (the second and third quarters are generally stronger than the
first and fourth quarters) as well as numerous other factors that
are not necessarily seasonal, including the extent and nature of
competition from other airlines, employee job actions (including
at other airlines), fare sale activities, excise and similar taxes,
changing levels of operations and capacity, fuel prices, weather,
air traffic control delays, foreign currency exchange rates, changes
in regulations and aviation treaties and general economic condi-
tions. Recently, jet fuel prices have increased dramatically. If
high fuel costs continue without an improvement in the revenue
environment, the Company may not post a profit in the first quar-
ter of 2000. In addition, industry capacity and growth in the
transatlantic markets (including block space arrangements where
Continental is obligated to purchase capacity at a fixed price)
have resulted in lower yields and revenue per available seat mile
in those markets, which trend is expected to continue in 2000.
Although the results in Asia of Continental Micronesia, Inc.
(“CMI”), a wholly owned subsidiary of the Company, have
declined in recent years, the Company successfully redeployed
CMI capacity into stronger domestic markets and CMI’s recent
results continue to improve. Continental will continue to criti-
cally review its growth plans in light of industry conditions and
will adjust or redeploy resources, including aircraft capacity, as
necessary, similar to its recent decision to accelerate the retire-
ment of certain DC-10-30 aircraft and replace them with
narrowbody aircraft on certain transatlantic routes. In addition,
management believes the Company is well positioned to respond
to market conditions in the event of a sustained economic
downturn for the following reasons: underdeveloped hubs with
strong local traffic, a flexible fleet plan, a strong cash balance,
a $225 million unused revolving credit facility and a well devel-
oped alliance network.
Results of Operations
The following discussion provides an analysis of the Company’s
results of operations and reasons for material changes therein for
the three years ended December 31, 1999.
Comparison of 1999 to 1998. The Company recorded consol-
idated net income of $455 million and $383 million for the years
ended December 31, 1999 and 1998, respectively. Net income in
1999 was significantly impacted by several non-recurring items,
including a $182 million gain on the sale of the Company’s inter-
est in AMADEUS Global Travel Distribution S.A. (“AMADEUS”)
($297 million pre-tax), a $50 million fleet disposition/impairment
loss ($81 million pre-tax) related to the early retirement of sever-
al DC-10-30’s and other items, the cumulative effect of accounting
changes ($33 million, net of taxes) related to the write-off of pilot
training costs and a change in the method of accounting for the sale
of mileage credits to participating partners in the Company’s fre-
quent flyer program, a $20 million gain ($33 million pre-tax) on
the sale of a portion of the Company’s interest in Equant N.V.
(“Equant”) and a $3 million loss ($4 million pre-tax) on the sale
of the Company’s warrants to purchase common stock of price-
line.com, Inc. (“Priceline”). Net income in 1998 was significantly
impacted by a $77 million ($122 million pre-tax) fleet disposi-
tion/ impairment loss resulting from the Company’s decision to
accelerate the retirement of certain jet and turboprop aircraft.
Passenger revenue increased 8.9%, $660 million, during 1999
as compared to 1998. The increase was due to an 11.3% increase
in revenue passenger miles, partially offset by a 3.3% decrease in
yield. Both yield pressures in the transatlantic markets and a 6.7%
increase in average stage length negatively impacted yield.
Cargo and mail revenue increased 10.2%, $28 million, in 1999
as compared to 1998 due to increased domestic and internation-
al volumes and new markets added in 1999.
Other operating revenue increased 12.2%, $24 million, in
1999 compared to the prior year primarily due to an increase in
fees charged to customers to change advance purchase tickets and
also due to an increase in Presidents Club revenue as a result of
a larger number of these airport private clubs.
M A N A G E M E N T ’ S D I S C U S S I O N A N D A N A L Y S I S O F F I N A N C I A L C O N D I T I O N
A N D R E S U L T S O F O P E R A T I O N S .

C o n t i n e n t a l A i r l i n e s 1 9 9 9 A n n u a l R e p o r t 2 7
Wages, salaries and related costs increased 13.2%, $292 mil-
lion, during 1999 as compared to 1998, primarily due to an 8.3%
increase in average full-time equivalent employees to support
increased flying and higher wage rates resulting from the
Company’s decision to increase employee wages to industry stan-
dard by the year 2000.
Aircraft fuel expense increased 6.1%, $44 million, in 1999
as compared to the prior year. The average price per gallon
increased 1.0% from 46.83 cents in 1998 to 47.31 cents in 1999.
This increase is net of gains of approximately $105 million rec-
ognized during 1999 related to the Company’s fuel hedging
program. See “Fuel Hedging” below. In addition, the quantity of
jet fuel used increased 3.7% principally reflecting increased
capacity offset in part by the increased fuel efficiency of the
Company’s younger fleet.
Aircraft rentals increased 17.0%, $112 million, during 1999 as
compared to 1998, due to the delivery of new aircraft.
Commissions expense decreased 1.2%, $7 million, during
1999 as compared to 1998 due to lower rates resulting from inter-
national commission caps and a lower volume of commissionable
sales, partially offset by increased passenger revenue.
Other rentals and landing fees increased 20.0%, $83 million,
primarily due to higher facilities rent due to increased rates and vol-
ume and higher landing fees resulting from increased operations.
Depreciation and amortization expense increased 22.4%, $66
million, in 1999 compared to 1998 primarily due to the addition
of new aircraft and related spare parts. These increases were par-
tially offset by approximately a $5 million reduction in the
amortization of routes, gates and slots resulting from the recogni-
tion of previously unbenefitted net operating losses (“NOLs”)
during 1998.
During the fourth quarter of 1999, the Company made the deci-
sion to accelerate the retirement of six DC-10-30 aircraft and other
items in 1999 and the first half of 2000 and to dispose of related
excess inventory. The DC-10-30’s will be replaced by Boeing 757
and Boeing 737-800 aircraft on certain routes, and by Boeing 777
aircraft on other routes. In addition, the market value of certain
Boeing 747 aircraft no longer operated by the Company has
declined. As a result of these items and certain other fleet-relat-
ed items, the Company recorded a fleet disposition/impairment
loss of $81 million in the fourth quarter of 1999.
Approximately $52 million of the $81 million charge relates
to the impairment of owned or capital leased aircraft and related
inventory held for disposal with a carrying amount of $77 million.
The remaining $29 million of the charge relates primarily to costs
expected to be incurred related to the return of leased aircraft. As
of December 31, 1999, the remaining accrual for the 1999 fleet
disposition/impairment loss totaled $12 million. The Company
expects to finance the cash outlays primarily with internally gen-
erated funds.
Other operating expense increased 14.9%, $243 million, in
1999 as compared to the prior year, primarily as a result of increas-
es in passenger services expense, aircraft servicing expense,
reservations and sales expense and other miscellaneous expense,
principally due to a 9.7% increase in available seat miles.
Interest expense increased 30.9%, $55 million, due to an
increase in long-term debt resulting from the purchase of new air-
craft and $200 million of 8% unsecured senior notes issued in
December 1998, partially offset by interest savings of $9 million
due to the conversion of the Company’s 6-3/4% Convertible
Subordinated Notes into Class B common stock.
Interest income increased 20.3%, $12 million, due to higher
average balances of cash, cash equivalents and short-term invest-
ments and due to higher rates.
The Company’s other nonoperating income (expense) in 1999
includes a $33 million gain on the sale of a portion of the
Company’s interest in Equant, partially offset by foreign cur-
rency losses of $13 million, losses on equity investments of $7
million and a $4 million loss on the sale of the Company’s war-
rants to purchase common stock of Priceline. Other nonoperating
income (expense) in 1998 included a $6 million gain on the sale
of certain stock of America West Holdings Corporation
(“America West Holdings”).
Comparison of 1998 to 1997. The Company recorded consol-
idated net income of $383 million and $385 million for the years
ended December 31, 1998 and 1997 (including special charges),
respectively. Net income in 1998 was significantly impacted by a
$77 million ($122 million pre-tax) fleet disposition/impairment
loss resulting from the Company’s decision to accelerate the retire-
ment of certain jet and turboprop aircraft. Management believes
that the Company benefitted in the first quarter of 1997 from the
expiration of the aviation trust fund tax (the “ticket tax”). The tick-
et tax was reinstated on March 7, 1997. Management believes that

2 8 C o n t i n e n t a l A i r l i n e s 1 9 9 9 A n n u a l R e p o r t
the ticket tax has a negative impact on the Company, although nei-
ther the amount of such negative impact directly resulting from the
reimposition of the ticket tax, nor the benefit realized by its pre-
vious expiration, can be precisely determined.
Passenger revenue increased 10.7%, $723 million, during
1998 as compared to 1997. The increase was due to a 12.5%
increase in revenue passenger miles, partially offset by a 2.4%
decrease in yield. The decrease in yield was due to lower indus-
try-wide fare levels and an 8% increase in average stage length.
Cargo and mail increased 6.6%, $17 million, due to an increase
in freight revenue resulting from strong international volumes and
strong growth in Continental’s express delivery service.
Wages, salaries and related costs increased 22.3%, $404 mil-
lion, during 1998 as compared to 1997, primarily due to an 11.2%
increase in average full-time equivalent employees to support
increased flying and higher wage rates resulting from the
Company’s decision to increase employee wages to industry stan-
dards by the year 2000.
Aircraft fuel expense decreased 17.9%, $158 million, in 1998
as compared to the prior year. The average price per gallon
decreased 25.6% from 62.91 cents in 1997 to 46.83 cents in 1998.
This reduction was partially offset by a 9.6% increase in the quan-
tity of jet fuel used principally reflecting increased capacity.
Aircraft rentals increased 19.6%, $108 million, during
1998 as compared to 1997, due primarily to the delivery of new
leased aircraft.
Maintenance, materials and repairs increased 8.4%, $45 mil-
lion, during 1998 as compared to 1997. Aircraft maintenance
expense in the second quarter of 1997 was reduced by $16 mil-
lion due to the reversal of reserves that were no longer required as
a result of the acquisition of 10 aircraft previously leased by the
Company. In addition, maintenance expense increased due to the
overall increase in flight operations offset by newer aircraft and the
volume and timing of engine overhauls as part of the Company’s
ongoing maintenance program.
Depreciation and amortization expense increased 15.7%, $40
million, in 1998 compared to 1997 primarily due to the addition
of new aircraft and related spare parts. These increases were par-
tially offset by an approximate $18 million reduction in the
amortization of reorganization value in excess of amounts alloca-
ble to identifiable assets and routes, gates and slots resulting from
the recognition of previously unbenefitted NOLs.
In August 1998, Continental announced that CMI would accel-
erate the retirement of its four Boeing 747 aircraft by April 1999 and
its remaining thirteen Boeing 727 aircraft by December 2000. The
Boeing 747s were replaced by DC-10-30 aircraft and the Boeing
727 aircraft were replaced with a reduced number of Boeing 737 air-
craft. In addition, Continental Express, Inc. (“Express”), a wholly
owned subsidiary of the Company, announced that it would accel-
erate the retirement of certain turboprop aircraft by December 2000,
including its fleet of 32 Embraer 120 turboprop aircraft, as region-
al jets are acquired to replace turboprops. As a result of its decision
to accelerate the retirement of these aircraft, Continental recorded
a fleet disposition/impairment loss of $77 million ($122 million pre-
tax) in the third quarter of 1998.
Other operating expense increased 10.3%, $152 million, in
1998 as compared to the prior year, primarily as a result of increas-
es in passenger and aircraft servicing expense, reservations and
sales expense and other miscellaneous expense, primarily due to
the 10.6% increase in available seat miles.
Interest expense increased 7.2%, $12 million, due to an increase
in long-term debt resulting from the purchase of new aircraft.
Interest capitalized increased 57.1%, $20 million, due to
increased capital spending and a higher average balance of pur-
chase deposits for flight equipment.
The Company’s other nonoperating income (expense) in
1998 included a $6 million gain on the sale of America West
Holdings stock.

C o n t i n e n t a l A i r l i n e s 1 9 9 9 A n n u a l R e p o r t 2 9
Certain Statistical Information
An analysis of statistical information for Continental’s jet operations, excluding regional jets operated by Express, for each of the three
years in the period ended December 31, 1999 is as follows:
Net Increase/ Net Increase/(Decrease) (Decrease)
1999 1999-1998 1998 1998-1997 1997
Revenue passenger miles (millions) (1) . . . . . . . . . . . . . . . . 60,022 11.3% 53,910 12.5 % 47,906
Available seat miles (millions) (2) . . . . . . . . . . . . . . . . . . . . 81,946 9.7% 74,727 10.6 % 67,576
Passenger load factor (3) . . . . . . . . . . . . . . . . . . . . . . . . . . . 73.2% 1.1 pts 72.1% 1.2 pts. 70.9%
Breakeven passenger load factor (4), (5) . . . . . . . . . . . . . . . 65.6% 4.0 pts 61.6% 1.5 pts. 60.1%
Passenger revenue per available seat mile (cents) . . . . . . . . 9.06 (1.8)% 9.23 (0.6)% 9.29
Total revenue per available seat mile (cents) . . . . . . . . . . . . 9.81 (1.4)% 9.95 (1.1)% 10.06
Operating cost per available seat mile (cents) (5) . . . . . . . . . 9.03 1.6% 8.89 (1.7)% 9.04
Average yield per revenue passenger mile (cents) (6) . . . . . . 12.37 (3.3)% 12.79 (2.4)% 13.11
Average fare per revenue passenger . . . . . . . . . . . . . . . . . . $163.07 3.2% $158.02 3.7% $152.40
Revenue passengers (thousands) . . . . . . . . . . . . . . . . . . . . . 45,540 4.4% 43,625 5.9% 41,210
Average length of aircraft flight (miles) . . . . . . . . . . . . . . . . 1,114 6.7% 1,044 8.0% 967
Average daily utilization of each aircraft (hours) (7) . . . . . . . 10:29 2.6% 10:13 0.0% 10:13
Actual aircraft in fleet at end of period (8) . . . . . . . . . . . . . . 363 — 363 7.7% 337
Continental has entered into block space arrangements with certain other carriers whereby one or both of the carriers is obligated to pur-
chase capacity on the other. The table above excludes 2.6 billion, 1.9 billion and 738 million available seat miles, together with related
revenue passenger miles and enplanements, operated by Continental but purchased and marketed by the other carriers in 1999, 1998
and 1997, respectively, and includes 1.0 billion and 358 million available seat miles, together with related revenue passenger miles and
enplanements, operated by other carriers but purchased and marketed by Continental in 1999 and 1998, respectively.
(1) The number of scheduled miles flown by revenue passengers.
(2) The number of seats available for passengers multiplied by the number of scheduled miles those seats are flown.
(3) Revenue passenger miles divided by available seat miles.
(4) The percentage of seats that must be occupied by revenue passengers in order for the airline to break even on an income before income taxes basis,excluding nonrecurring charges, nonoperating items and other special items.
(5) 1999 and 1998 exclude fleet disposition/impairment losses totaling $81 million and $122 million, respectively.
(6) The average revenue received for each mile a revenue passenger is carried.
(7) The average number of hours per day that an aircraft flown in revenue service is operated (from gate departure to gate arrival).
(8) Excludes all-cargo 727 aircraft (four in 1999 and six in 1998 and 1997) at CMI.
3 0 C o n t i n e n t a l A i r l i n e s 1 9 9 9 A n n u a l R e p o r t
Liquidity and Capital Resources
During 1999, the Company completed a number of transac-
tions intended to strengthen its long-term financial position and
enhance earnings:
In February 1999, the Company completed an offering of $806
million of pass-through certificates used to finance (either through
leveraged leases or secured debt financings) the debt portion of the
acquisition cost of 22 aircraft delivered in 1999.
In March 1999, the Company completed a $160 million Credit
Facility, with a maturity date of March 2001, to finance pre-deliv-
ery deposits for certain new Boeing aircraft to be delivered between
March 1999 and March 2002.
In April 1999, the Company exercised its right and called for
redemption in May 1999, all $230 million of its 6-3/4%
Convertible Subordinated Notes due 2006. The notes were con-
verted into 7.6 million shares of Class B common stock during
May 1999.
Also, in June 1999, the Company completed an offering of
$742 million of pass-through certificates used to finance (either
through leveraged leases or secured debt financings) the debt
portion of the acquisition cost of 21 new Boeing aircraft delivered
in 1999.
In October 1999, Continental sold its interest in AMADEUS
for $409 million, including a special dividend.
During 1999, the Company’s Board of Directors increased the
size of its common stock repurchase program by $900 million,
bringing the total size of the program to $1.2 billion. As of January
21, 2000, the Company has repurchased 18,853,600 Class B com-
mon shares for $804 million since the inception of the program in
March of 1998.
As of December 31, 1999, Continental had approximately $3.4
billion (including current maturities) of long-term debt and capi-
tal lease obligations, and had approximately $1.6 billion of
common stockholders’ equity, a ratio of 2.1 to 1, at both December
31, 1999 and 1998.
As of December 31, 1999, the Company had $1.6 billion in
cash and cash equivalents and short-term investments, compared
to $1.4 billion as of December 31, 1998. Net cash provided by
operating activities decreased $100 million during the year ended
December 31, 1999 compared to the same period in the prior year
primarily due to a decrease in operating income. Net cash used by
investing activities for the year ended December 31, 1999 com-
pared to the same period in the prior year decreased $39 million,
primarily due to proceeds received from the sale of AMADEUS
and increased proceeds received from the sale of equipment off-
set by the purchase of short-term investments in 1999. Net cash
used by financing activities increased $514 million primarily due
to an increase in the purchase of the Company’s Class B common
stock and a decrease in proceeds received from the issuance of
long-term debt.
Continental has unused lines of credit totaling $225 million.
A significant amount of Continental’s assets are encumbered.
Deferred Tax Assets. As of December 31, 1999, the Company
had deferred tax assets aggregating $611 million, including $266
million of NOLs, and a valuation allowance of $263 million.
As a result of NOLs, the Company will not pay United States
federal income taxes (other than alternative minimum tax) until
it has recorded approximately an additional $700 million of tax-
able income following December 31, 1999. Section 382 of the
Internal Revenue Code (“Section 382”) imposes limitations on a
corporation’s ability to utilize NOLs if it experiences an “owner-
ship change”. In general terms, an ownership change may result
from transactions increasing the ownership of certain stockhold-
ers in the stock of a corporation by more than 50 percentage points
over a three-year period. In the event that an ownership change
should occur, utilization of Continental’s NOLs would be subject
to an annual limitation under Section 382 determined by multi-
plying the value of the Company’s stock at the time of the
ownership change by the applicable long-term tax exempt rate
(which was 5.72% for December 1999). Any unused annual lim-
itation may be carried over to later years, and the amount of the
limitation may under certain circumstances be increased by the
built-in gains in assets held by the Company at the time of the
change that are recognized in the five-year period after the

C o n t i n e n t a l A i r l i n e s 1 9 9 9 A n n u a l R e p o r t 3 1
change. Under current conditions, if an ownership change were
to occur, Continental’s annual NOL utilization would be limited
to approximately $172 million per year other than through the
recognition of future built-in gain transactions.
On November 20, 1998, an affiliate of Northwest Airlines, Inc.
completed its acquisition of certain equity of the Company previ-
ously held by Air Partners, L.P. and its affiliates, together with
certain Class A common stock of the Company held by certain
other investors, totaling 8,661,224 shares of the Class A common
stock (the “Air Partners Transaction”). The Company does not
believe that the Air Partners Transaction resulted in an owner-
ship change for purposes of Section 382.
Purchase Commitments. Continental has substantial commit-
ments for capital expenditures, including for the acquisition of
new aircraft. As of January 14, 2000, Continental had agreed to
acquire a total of 74 Boeing jet aircraft through 2005. The
Company anticipates taking delivery of 28 Boeing jet aircraft in
2000. Continental also has options for an additional 118 aircraft
(exercisable subject to certain conditions). The estimated aggre-
gate cost of the Company’s firm commitments for Boeing aircraft
is approximately $4 billion. Continental currently plans to finance
its new Boeing aircraft with a combination of enhanced pass
through trust certificates, lease equity and other third-party financ-
ing, subject to availability and market conditions. Continental has
commitments or letters of intent for backstop financing for approx-
imately 18% of the anticipated remaining acquisition cost of future
Boeing deliveries. In addition, at January 14, 2000, Continental
has firm commitments to purchase 34 spare engines related to the
new Boeing aircraft for approximately $219 million which will be
deliverable through March 2005. However, further financing will
be needed to satisfy the Company’s capital commitments for other
aircraft and aircraft-related expenditures such as engines, spare
parts, simulators and related items. There can be no assurance
that sufficient financing will be available for all aircraft and other
capital expenditures not covered by firm financing commitments.
Deliveries of new Boeing aircraft are expected to increase aircraft
rental, depreciation and interest costs while generating cost sav-
ings in the areas of maintenance, fuel and pilot training.
As of January 14, 2000, Express had firm commitments for 43
Embraer ERJ-145 (“ERJ-145”) regional jets and 19 Embraer ERJ-
135 (“ERJ-135”) regional jets, with options for an additional 100
ERJ-145 and 50 ERJ-135 aircraft exercisable through 2008.
Express anticipates taking delivery of 15 ERJ-145 and 12 ERJ-135
regional jets in 2000. Neither Express nor Continental will have
any obligation to take any of the firm ERJ-145 or ERJ-135 aircraft
that are not financed by a third party and leased to Continental.
Continental expects its cash outlays for 2000 capital expen-
ditures, exclusive of fleet plan requirements, to aggregate $207
million, primarily relating to software application and automation
infrastructure projects, aircraft modifications and mandatory main-
tenance projects, passenger terminal facility improvements and
office, maintenance, telecommunications and ground equipment.
Continental’s capital expenditures during 1999 aggregated $213
million, exclusive of fleet plan requirements.
The Company expects to fund its future capital commitments
through internally generated funds together with general Company
financings and aircraft financing transactions. However, there can
be no assurance that sufficient financing will be available for all
aircraft and other capital expenditures not covered by firm financ-
ing commitments.
Continental has certain block-space arrangements whereby it
is committed to purchase capacity on other carriers at an aggre-
gate cost of approximately $159 million per year. These
arrangements are currently scheduled to expire over the next eight
years. Pursuant to other block-space arrangements, other carriers
are committed to purchase capacity at a cost of approximately $95
million per year on Continental.

3 2 C o n t i n e n t a l A i r l i n e s 1 9 9 9 A n n u a l R e p o r t
Year 2000. The Year 2000 issue arose as a result of computer
programs having been written using two digits (rather than four)
to define the applicable year, among other problems. Any infor-
mation technology (“IT”) systems with time-sensitive software
might recognize a date using “00” as the year 1900 rather than the
year 2000, which could result in miscalculations and system fail-
ures. The problem could also extend to many “non-IT” systems;
that is, operating and control systems that rely on embedded chip
systems. In addition, the Company was at risk from Year 2000
failures on the part of third party-suppliers and governmental
agencies with which the Company interacts.
The Company uses a significant number of computer software
programs and embedded operating systems that are essential to its
operations. For this reason, the Company implemented a Year 2000
project in late 1995 so that the Company’s computer systems would
function properly in the year 2000 and thereafter. The Company’s
Year 2000 project involved the review of a number of internal and
third-party systems. Each system was subjected to the project’s
five phases which consisted of systems inventory, evaluation and
analysis, modification implementation, user testing and integra-
tion compliance. The Company completed its system review and
made certain modifications to its existing software and systems
and/or conversions to new software. As a result, the Year 2000 issue
did not pose any operational problems.
The Company completed its extensive communications and
on-site visits with its significant suppliers, vendors and govern-
mental agencies with which its systems interface and exchange
data or upon which its business depends. The Company coordi-
nated efforts with these parties to minimize the extent to which its
business would be vulnerable to their failure to remediate their own
Year 2000 problems. The Company’s business is dependent upon
certain domestic and foreign governmental organizations or enti-
ties such as the Federal Aviation Administration that provide
essential aviation industry infrastructure. The systems of such
third parties on which Continental relies did not pose significant
operational problems for the Company. Management updated its
day-to-day operational contingency plans for possible Year 2000-
specific operational requirements. Although passenger travel was
lower in the latter part of December and early January due in part,
the Company believes, to Year 2000 concerns, the Company does
not believe that it has continued exposure to the Year 2000 issue.
The total cost of the Company’s Year 2000 project (excluding
internal payroll) was $20 million and was funded through cash
from operations. In addition, the Company estimates that the neg-
ative revenue impact in the latter part of December and early
January attributable to the Year 2000 concerns approximated
$20 million and $10 million, respectively. The cost of the Year
2000 project was limited by the substantial outsourcing of the
Company’s systems and the significant implementation of new
systems since 1993.
Bond Financings. In July 1996, the Company announced plans
to expand its gates and related facilities into Terminal B at Bush
Intercontinental Airport, as well as planned improvements at
Terminal C and the construction of a new automated people mover
system linking Terminal B and Terminal C. The majority of the
Company’s expansion project has been completed. In April 1997
and January 1999, the City of Houston completed the offering of
$190 million and $46 million, respectively, aggregate principal
amount of tax-exempt special facilities revenue bonds (the “IAH
Bonds”) to finance such expansion and improvements. The IAH
Bonds are unconditionally guaranteed by Continental. In con-
nection therewith, the Company has entered into long-term leases
(or amendments to existing leases) with the City of Houston pro-
viding for the Company to make rental payments sufficient to
service the related tax-exempt bonds, which have a term no longer
than 30 years.
Continental substantially completed the expansion of its
facilities at its Hopkins International Airport hub in Cleveland
in the third quarter of 1999. The expansion, which included a
new jet concourse for the regional jet service offered by Express,
as well as other facility improvements, cost approximately $156
million and was funded principally by a combination of tax-
exempt special facilities revenue bonds (issued in March 1998)
and general airport revenue bonds (issued in December 1997) by
the City of Cleveland, Ohio (the “City of Cleveland”). Continental
has unconditionally guaranteed the special facilities revenue
bonds and has entered into a long-term lease with the City of
Cleveland under which rental payments will be sufficient to serv-
ice the related bonds.

C o n t i n e n t a l A i r l i n e s 1 9 9 9 A n n u a l R e p o r t 3 3
In September 1999, the City of Cleveland completed the
issuance of $71 million aggregate principal amount of tax-exempt
bonds. The bond proceeds were used to refinance $75 million
aggregate principal amount in bonds originally issued by the City
of Cleveland in 1990 for the purpose of constructing certain ter-
minal and other improvements at Cleveland Hopkins International
Airport. Continental has unconditionally guaranteed the bonds
and has a long-term lease with the City of Cleveland under which
rental payments will be sufficient to service the related bonds,
which have a term of 20 years. Continental estimates that it will
save approximately $44 million in debt service payments over the
20-year term as a result of the refinancing.
Also, in September 1999, the New Jersey Economic
Development Authority completed the offering of $730 million
aggregate principal amount of tax-exempt special facility revenue
bonds to finance a portion of Continental’s Global Gateway
Program at Newark International Airport. Major construction
began in the third quarter of 1999 and is scheduled to be com-
pleted in 2002. The program includes construction of a new
concourse in Terminal C and other facility improvements.
Continental has unconditionally guaranteed the bonds and has
entered into a long-term lease with the New Jersey Economic
Development Authority under which rental payments will be suf-
ficient to service the related bonds, which have a term of 30 years.
Employees. In September 1997, the Company announced a
plan to bring all employees to industry standard wages no later
than the end of the year 2000. Wage increases began in 1997, and
will continue to be phased in through 2000. The Company is in
the process of formulating a plan to bring employees to industry
standard benefits over a multi-year period.
The following is a table of the Company’s, Express’s and CMI’s
principal collective bargaining agreements, and their respective
amendable dates:
ApproximateNumber ofFull-time Contract
Employee Equivalent Representing AmendableGroup Employees Union Date
Continental Pilots 5,000 Independent October 2002
Association of
Continental
Pilots (“IACP”)
Express Pilots 1,350 IACP October 2002
Dispatchers 150 Transport Workers October 2003
Union of America
Continental 3,300 International January 2002
Mechanics Brotherhood of
Teamsters
(“Teamsters”)
Express 350 Teamsters January 2003
Mechanics
CMI Mechanics 150 Teamsters March 2001
Continental 7,800 International (Negotiations
Flight Attendants Association of for amended
Machinists and contract
Aerospace Workers ongoing)
(“IAM”)
Express 500 IAM (Negotiations
Flight Attendants for amended
contract
ongoing)
CMI 350 IAM June 2000
Flight Attendants
CMI Fleet and 475 Teamsters March 2001
Passenger Service
Employees

3 4 C o n t i n e n t a l A i r l i n e s 1 9 9 9 A n n u a l R e p o r t
In February 2000, the Company announced a 54-month ten-
tative collective bargaining agreement with its Continental Airlines
flight attendants. The agreement is subject to ratification by the
Continental Airlines flight attendants. In September 1999, Express
and the IAM began collective bargaining negotiations to amend the
Express flight attendants’ contract (which became amendable in
November 1999). The Company believes that mutually accept-
able agreements can be reached with such employees, although the
ultimate outcome of the negotiations is unknown at this time.
The other employees of Continental, Express and CMI are not
covered by collective bargaining agreements.
Other. The Department of Transportation has proposed the
elimination of slot restrictions at high density airports other than
Ronald Reagan Washington National Airport in Washington, D.C.
Legislation containing a similar proposal, which could eliminate
slots as early as 2002 at O’Hare International Airport in Chicago
and 2007 at LaGuardia Airport and John F. Kennedy International
Airport in New York has passed the full House of Representatives
and the full Senate and is currently being considered by a con-
ference committee. The Company cannot predict whether any of
these proposals will be adopted. However, if legislation or regu-
lation eliminating slots were adopted, the value of such slots could
be deemed to be permanently impaired, resulting in a loss being
charged to earnings for the relevant period. Moreover, the elimi-
nation of slots could have an adverse effect upon future results of
operations of the Company. At December 31, 1999, the net book
value of slots at these three airports was $64 million.
Management believes that the Company’s costs are likely to be
affected in the future by (i) higher aircraft ownership costs as new
aircraft are delivered, (ii) higher wages, salaries, benefits and relat-
ed costs as the Company compensates its employees comparable
to industry average, (iii) changes in the costs of materials and serv-
ices (in particular, the cost of fuel, which can fluctuate significantly
in response to global market conditions), (iv) changes in distribu-
tion costs and structure, (v) changes in governmental regulations
and taxes affecting air transportation and the costs charged for
airport access, including new security requirements, (vi) changes
in the Company’s fleet and related capacity and (vii) the Company’s
continuing efforts to reduce costs throughout its operations, includ-
ing reduced maintenance costs for new aircraft, reduced
distribution expense from using Continental’s electronic ticket
product, E-Ticket and the internet for bookings, and reduced inter-
est expense.

C o n t i n e n t a l A i r l i n e s 1 9 9 9 A n n u a l R e p o r t 3 5
Market Risk Sensitive Instruments and Positions
The Company is subject to certain market risks, including com-
modity price risk (i.e., aircraft fuel prices), interest rate risk, foreign
currency risk and price changes related to investments in equity
securities. The adverse effects of potential changes in these mar-
ket risks are discussed below. The sensitivity analyses presented
do not consider the effects that such adverse changes may have on
overall economic activity nor do they consider additional actions
management may take to mitigate the Company’s exposure to such
changes. Actual results may differ. See the notes to the consoli-
dated financial statements for a description of the Company’s
accounting policies and other information related to these finan-
cial instruments.
Aircraft Fuel. The Company’s results of operations are signifi-
cantly impacted by changes in the price of aircraft fuel. During
1999 and 1998, aircraft fuel accounted for 9.7% and 10.2%,
respectively, of the Company’s operating expenses (excluding fleet
disposition/impairment losses). In order to provide short-term pro-
tection (generally three to six months) against a sharp increase in
jet fuel prices, the Company from time to time enters into petrole-
um call options, petroleum swap contracts and jet fuel purchase
commitments. The Company’s fuel hedging strategy could result in
the Company not fully benefiting from certain fuel price declines.
As of December 31, 1999, the Company had hedged approximately
24% of its projected 2000 fuel requirements, including 93% relat-
ed to the first quarter and 8% related to the second quarter using
petroleum call options, compared to approximately 25% of its pro-
jected 1999 fuel requirements hedged at December 31, 1998 using
petroleum swap contracts and purchase commitments. The
Company estimates that at December 31, 1999, a ten percent
increase in the price per gallon of aircraft fuel would not have a
material impact on the fair value of the existing petroleum call
options, as compared to an $8 million increase in the fair value of
the petroleum swap contracts existing at December 31, 1998.
Foreign Currency. The Company is exposed to the effect of
exchange rate fluctuations on the U.S. dollar value of foreign cur-
rency denominated operating revenue and expenses. The
Company’s largest exposure comes from the Japanese yen.
However, the Company is attempting to mitigate the effect of cer-
tain potential foreign currency losses by entering into forward
contracts that effectively enable it to sell Japanese yen expected
to be received from yen-denominated net cash flows over the next
twelve months at specified exchange rates. As of December 31,
1999, the Company had entered into forward contracts to hedge
approximately 95% of its 2000 projected yen-denominated net
cash flows, as compared to having in place average rate options and
forward contracts to hedge 69% of its 1999 projected yen-denom-
inated net cash flows at December 31, 1998. The Company
estimates that at December 31, 1999, a 10% strengthening in the
value of the U.S. dollar relative to the yen would have increased
the fair value of the existing forward contracts by $18 million as
compared to a $7 million increase in the fair value of existing aver-
age rate options and forward contracts at December 31, 1998.
Interest Rates. The Company’s results of operations are affect-
ed by fluctuations in interest rates (e.g., interest expense on debt
and interest income earned on short-term investments).
The Company had approximately $690 million and $599 mil-
lion of variable-rate debt as of December 31, 1999 and 1998,
respectively. The Company has mitigated its exposure on certain
variable-rate debt by entering into an interest rate cap (notional
amount of $106 million and $125 million as of December 31, 1999
and 1998, respectively) which expires in July 2001. The interest
rate cap limits the amount of potential increase in the LIBOR rate
component of the floating rate to a maximum of 9% over the term
of the contract.
Q U A N T I T A T I V E A N D Q U A L I T A T I V E D I S C L O S U R E S A B O U T M A R K E T R I S K

3 6 C o n t i n e n t a l A i r l i n e s 1 9 9 9 A n n u a l R e p o r t
If average interest rates increased by 100 basis points during 2000
as compared to 1999, the Company’s projected 2000 interest
expense would increase by approximately $6 million. At December
31, 1998, an interest rate increase of 100 basis points during 1999
and compared to 1998 was projected to increase 1999 interest
expense by approximately $5 million. The interest rate cap does
not mitigate this increase in interest expense materially given the
current level of such floating rates.
As of December 31, 1999 and 1998, the fair value of $2.2 bil-
lion and $1.5 billion (carrying value) of the Company’s fixed-rate
debt was estimated to be $2.2 billion and $1.5 billion, respec-
tively, based upon discounted future cash flows using current
incremental borrowing rates for similar types of instruments or
market prices. Market risk, estimated as the potential increase in
fair value resulting from a hypothetical 100 basis points decrease
in interest rates, was approximately $91 million and $70 million
as of December 31, 1999 and 1998, respectively. The fair value
of the remaining fixed-rate debt at December 31, 1999 and 1998,
(with a carrying value of $248 million and $287 million, respec-
tively, and primarily relates to aircraft modification notes and
various loans with immaterial balances) was not practicable to
estimate due to the large number and small dollar amounts of
these notes.
If 2000 average short-term interest rates decreased by 100
basis points over 1999 average rates, the Company’s projected
interest income from cash, cash equivalents and short-term invest-
ments would decrease by approximately $11 million during 2000,
compared to an estimated $13 million decrease during 1999 meas-
ured at December 31, 1998.
Investments in Equity Securities. The Company has a 49% equi-
ty investment in Compania Panamena de Aviacion, S.A. (“COPA”)
and a 28% equity investment in Gulfstream International Airlines,
Inc. (“Gulfstream”) which are also subject to price risk. However,
since a readily determinable market value does not exist for either
COPA or Gulfstream (each is privately held), the Company is
unable to quantify the amount of price risk sensitivity inherent in
these investments. At December 31, 1999 and 1998, the carrying
value of COPA was $49 million and $53 million, respectively.
At December 31, 1999, the Company owned approximately
357,000 depository certificates convertible, subject to certain
restrictions, into the common stock of Equant, which completed
an initial public offering in July 1998. As of December 31, 1999,
the estimated fair value of these depository certificates was approx-
imately $40 million, based upon the publicly traded market value
of Equant common stock. Since the fair value of the Company’s
investment in the depository certificates is not readily deter-
minable (i.e., the depository certificates are not traded on a
securities exchange), the investment is carried at cost, which was
not material as of December 31, 1999 or 1998.

C o n t i n e n t a l A i r l i n e s 1 9 9 9 A n n u a l R e p o r t 3 7
Year Ended December 31,1999 1998 1997
Operating Revenue:Passenger . . . . . . . . . . . . . . . . . . . . . . . . . . . . . . . . . . . . . . . . . . . . . . . . . . . . . . . . . . . . $ 8,116 $ 7,456 $ 6,733Cargo and mail . . . . . . . . . . . . . . . . . . . . . . . . . . . . . . . . . . . . . . . . . . . . . . . . . . . . . . . 303 275 258Other . . . . . . . . . . . . . . . . . . . . . . . . . . . . . . . . . . . . . . . . . . . . . . . . . . . . . . . . . . . . . . . 220 196 203
8,639 7,927 7,194Operating Expenses:
Wages, salaries and related costs . . . . . . . . . . . . . . . . . . . . . . . . . . . . . . . . . . . . . . . . . 2,510 2,218 1,814Aircraft fuel . . . . . . . . . . . . . . . . . . . . . . . . . . . . . . . . . . . . . . . . . . . . . . . . . . . . . . . . . . 771 727 885Aircraft rentals . . . . . . . . . . . . . . . . . . . . . . . . . . . . . . . . . . . . . . . . . . . . . . . . . . . . . . . 771 659 551Maintenance, materials and repairs . . . . . . . . . . . . . . . . . . . . . . . . . . . . . . . . . . . . . . 603 582 537Commissions . . . . . . . . . . . . . . . . . . . . . . . . . . . . . . . . . . . . . . . . . . . . . . . . . . . . . . . . . 576 583 567Other rentals and landing fees . . . . . . . . . . . . . . . . . . . . . . . . . . . . . . . . . . . . . . . . . . . 497 414 395Depreciation and amortization . . . . . . . . . . . . . . . . . . . . . . . . . . . . . . . . . . . . . . . . . . . 360 294 254Fleet disposition/impairment losses . . . . . . . . . . . . . . . . . . . . . . . . . . . . . . . . . . . . . . 81 122 —Other . . . . . . . . . . . . . . . . . . . . . . . . . . . . . . . . . . . . . . . . . . . . . . . . . . . . . . . . . . . . . . . 1,870 1,627 1,475
8,039 7,226 6,478Operating Income . . . . . . . . . . . . . . . . . . . . . . . . . . . . . . . . . . . . . . . . . . . . . . . . . . . . . . . . 600 701 716Nonoperating Income (Expense):
Interest expense . . . . . . . . . . . . . . . . . . . . . . . . . . . . . . . . . . . . . . . . . . . . . . . . . . . . . . (233) (178) (166)Interest income . . . . . . . . . . . . . . . . . . . . . . . . . . . . . . . . . . . . . . . . . . . . . . . . . . . . . . . 71 59 56Interest capitalized . . . . . . . . . . . . . . . . . . . . . . . . . . . . . . . . . . . . . . . . . . . . . . . . . . . . 55 55 35Gain on sale of AMADEUS . . . . . . . . . . . . . . . . . . . . . . . . . . . . . . . . . . . . . . . . . . . . . 297 — —Other, net . . . . . . . . . . . . . . . . . . . . . . . . . . . . . . . . . . . . . . . . . . . . . . . . . . . . . . . . . . . . 8 11 (1)
198 (53) (76)Income before Income Taxes, Cumulative Effect of
Accounting Changes and Extraordinary Charge . . . . . . . . . . . . . . . . . . . . . . . . . . . . . 798 648 640Income Tax Provision . . . . . . . . . . . . . . . . . . . . . . . . . . . . . . . . . . . . . . . . . . . . . . . . . . . . . (310) (248) (237)Distributions on Preferred Securities of Trust, net of
applicable income taxes of $7 and $8 in 1998 and 1997, respectively . . . . . . . . . . . — (13) (14)Income before Cumulative Effect of Accounting Changes and
Extraordinary Charge . . . . . . . . . . . . . . . . . . . . . . . . . . . . . . . . . . . . . . . . . . . . . . . . . . 488 387 389Cumulative Effect of Accounting Changes, Net of
Applicable Income Taxes of $19 (1) . . . . . . . . . . . . . . . . . . . . . . . . . . . . . . . . . . . . . . (33) — —Extraordinary Charge, net of applicable income taxes of $2 in 1998 and 1997 . . . . . . . . — (4) (4)Net Income . . . . . . . . . . . . . . . . . . . . . . . . . . . . . . . . . . . . . . . . . . . . . . . . . . . . . . . . . . . . . 455 383 385Preferred Dividend Requirements and Accretion to Liquidation Value . . . . . . . . . . . . . — — (2)Income Applicable to Common Shares . . . . . . . . . . . . . . . . . . . . . . . . . . . . . . . . . . . . . . . $ 455 $ 383 $ 383Earnings per Common Share:
Income before Cumulative Effect of Accounting Changes and Extraordinary Charge . . . . . . . . . . . . . . . . . . . . . . . . . . . . . . . . . . . . . . . . . . . $ 7.02 $ 6.40 $ 6.72
Cumulative Effect of Accounting Changes . . . . . . . . . . . . . . . . . . . . . . . . . . . . . . . . . (0.48) — —Extraordinary Charge . . . . . . . . . . . . . . . . . . . . . . . . . . . . . . . . . . . . . . . . . . . . . . . . . . — (0.06) (0.07)Net Income . . . . . . . . . . . . . . . . . . . . . . . . . . . . . . . . . . . . . . . . . . . . . . . . . . . . . . . . . . $ 6.54 $ 6.34 $ 6.65
Earnings per Common Share Assuming Dilution:Income before Cumulative Effect of Accounting Changes
and Extraordinary Charge . . . . . . . . . . . . . . . . . . . . . . . . . . . . . . . . . . . . . . . . . . . $ 6.64 $ 5.06 $ 5.03Cumulative Effect of Accounting Changes . . . . . . . . . . . . . . . . . . . . . . . . . . . . . . . . . (0.44) — —Extraordinary Charge . . . . . . . . . . . . . . . . . . . . . . . . . . . . . . . . . . . . . . . . . . . . . . . . . . — (0.04) (0.04)Net Income . . . . . . . . . . . . . . . . . . . . . . . . . . . . . . . . . . . . . . . . . . . . . . . . . . . . . . . . . . $ 6.20 $ 5.02 $ 4.99
(1) See Note 1(I) for the proforma effect of retroactive application of the accounting change.
The accompanying Notes to Consolidated Financial Statements are an integral part of these statements.
C O N S O L I D A T E D S T A T E M E N T S O F O P E R A T I O N S
(In millions, except per share data)

3 8 C o n t i n e n t a l A i r l i n e s 1 9 9 9 A n n u a l R e p o r t
C O N S O L I D A T E D B A L A N C E S H E E T S
(In millions, except for share data)
December 31, December 31,Assets 1999 1998
Current Assets:Cash and cash equivalents . . . . . . . . . . . . . . . . . . . . . . . . . . . . . . . . . . . . . . . . . . . . . . . . . . . . . . . . . . . . $ 1,198 $ 1,399Short-term investments . . . . . . . . . . . . . . . . . . . . . . . . . . . . . . . . . . . . . . . . . . . . . . . . . . . . . . . . . . . . . . . 392 —Accounts receivable, net of allowance for doubtful receivables
of $20 and $22, respectively . . . . . . . . . . . . . . . . . . . . . . . . . . . . . . . . . . . . . . . . . . . . . . . . . . . . . . . 506 449Spare parts and supplies, net of allowance for obsolescence
of $59 and $46, respectively . . . . . . . . . . . . . . . . . . . . . . . . . . . . . . . . . . . . . . . . . . . . . . . . . . . . . . . 236 166Deferred income taxes . . . . . . . . . . . . . . . . . . . . . . . . . . . . . . . . . . . . . . . . . . . . . . . . . . . . . . . . . . . . . . . 145 234Prepayments and other assets . . . . . . . . . . . . . . . . . . . . . . . . . . . . . . . . . . . . . . . . . . . . . . . . . . . . . . . . . 129 106
Total current assets . . . . . . . . . . . . . . . . . . . . . . . . . . . . . . . . . . . . . . . . . . . . . . . . . . . . . . . . . . . . 2,606 2,354Property and Equipment:
Owned property and equipment:Flight equipment . . . . . . . . . . . . . . . . . . . . . . . . . . . . . . . . . . . . . . . . . . . . . . . . . . . . . . . . . . . . . . . . . 3,593 2,459Other . . . . . . . . . . . . . . . . . . . . . . . . . . . . . . . . . . . . . . . . . . . . . . . . . . . . . . . . . . . . . . . . . . . . . . . . . . 814 582
4,407 3,041Less: Accumulated depreciation . . . . . . . . . . . . . . . . . . . . . . . . . . . . . . . . . . . . . . . . . . . . . . . . . . . 808 625
3,599 2,416Purchase deposits for flight equipment . . . . . . . . . . . . . . . . . . . . . . . . . . . . . . . . . . . . . . . . . . . . . . . . . . 366 410Capital leases:
Flight equipment . . . . . . . . . . . . . . . . . . . . . . . . . . . . . . . . . . . . . . . . . . . . . . . . . . . . . . . . . . . . . . . . . 300 361Other . . . . . . . . . . . . . . . . . . . . . . . . . . . . . . . . . . . . . . . . . . . . . . . . . . . . . . . . . . . . . . . . . . . . . . . . . . 88 56
388 417Less: Accumulated amortization . . . . . . . . . . . . . . . . . . . . . . . . . . . . . . . . . . . . . . . . . . . . . . . . . . . . 180 178
208 239Total property and equipment . . . . . . . . . . . . . . . . . . . . . . . . . . . . . . . . . . . . . . . . . . . . . . . . . . . 4,173 3,065
Other Assets:Routes, gates and slots, net of accumulated amortization
of $345 and $295, respectively. . . . . . . . . . . . . . . . . . . . . . . . . . . . . . . . . . . . . . . . . . . . . . . . . . . . . . 1,131 1,181Investments . . . . . . . . . . . . . . . . . . . . . . . . . . . . . . . . . . . . . . . . . . . . . . . . . . . . . . . . . . . . . . . . . . . . . . . . 71 151Other assets, net . . . . . . . . . . . . . . . . . . . . . . . . . . . . . . . . . . . . . . . . . . . . . . . . . . . . . . . . . . . . . . . . . . . . 242 335
Total other assets . . . . . . . . . . . . . . . . . . . . . . . . . . . . . . . . . . . . . . . . . . . . . . . . . . . . . . . . . . . . . . 1,444 1,667Total Assets . . . . . . . . . . . . . . . . . . . . . . . . . . . . . . . . . . . . . . . . . . . . . . . . . . . . . . . . . . . . . . . . $ 8,223 $ 7,086

C o n t i n e n t a l A i r l i n e s 1 9 9 9 A n n u a l R e p o r t 3 9
December 31, December 31,Liabilities and Stockholders’ Equity 1999 1998
Current Liabilities:Current maturities of long-term debt . . . . . . . . . . . . . . . . . . . . . . . . . . . . . . . . . . . . . . . . . . . . . . . . . . . . $ 278 $ 184Current maturities of capital leases . . . . . . . . . . . . . . . . . . . . . . . . . . . . . . . . . . . . . . . . . . . . . . . . . . . . . 43 47Accounts payable . . . . . . . . . . . . . . . . . . . . . . . . . . . . . . . . . . . . . . . . . . . . . . . . . . . . . . . . . . . . . . . . . . . 856 843Air traffic liability . . . . . . . . . . . . . . . . . . . . . . . . . . . . . . . . . . . . . . . . . . . . . . . . . . . . . . . . . . . . . . . . . . . 962 854Accrued payroll and pensions . . . . . . . . . . . . . . . . . . . . . . . . . . . . . . . . . . . . . . . . . . . . . . . . . . . . . . . . . 299 265Accrued other liabilities . . . . . . . . . . . . . . . . . . . . . . . . . . . . . . . . . . . . . . . . . . . . . . . . . . . . . . . . . . . . . . 337 249
Total current liabilities . . . . . . . . . . . . . . . . . . . . . . . . . . . . . . . . . . . . . . . . . . . . . . . . . . . . . . . . . . . . 2,775 2,442Long-Term Debt . . . . . . . . . . . . . . . . . . . . . . . . . . . . . . . . . . . . . . . . . . . . . . . . . . . . . . . . . . . . . . . . . . . . . . . 2,855 2,267Capital Leases . . . . . . . . . . . . . . . . . . . . . . . . . . . . . . . . . . . . . . . . . . . . . . . . . . . . . . . . . . . . . . . . . . . . . . . . . 200 213Other Long-Term Liabilities:
Deferred income taxes . . . . . . . . . . . . . . . . . . . . . . . . . . . . . . . . . . . . . . . . . . . . . . . . . . . . . . . . . . . . . . . 590 372Accruals for aircraft retirements and excess facilities . . . . . . . . . . . . . . . . . . . . . . . . . . . . . . . . . . . . . . 69 95Other . . . . . . . . . . . . . . . . . . . . . . . . . . . . . . . . . . . . . . . . . . . . . . . . . . . . . . . . . . . . . . . . . . . . . . . . . . . . . 141 393
Total other long-term liabilities . . . . . . . . . . . . . . . . . . . . . . . . . . . . . . . . . . . . . . . . . . . . . . . . . . . . . 800 860
Commitments and Contingencies
Continental-Obligated Mandatorily Redeemable Preferred Securitiesof Subsidiary Trust Holding Solely Convertible Subordinated Debentures . . . . . . . . . . . . . . . . . . . . . — 111
Common Stockholders’ Equity:Class A common stock - $.01 par, 50,000,000 shares authorized; 11,320,849 shares issued
and outstanding in 1999 and 11,406,732 shares issued and outstanding in 1998 . . . . . . . . . . . . — —Class B common stock - $.01 par, 200,000,000 shares authorized; 63,923,431 shares
issued in 1999 and 53,370,741 shares issued in 1998 . . . . . . . . . . . . . . . . . . . . . . . . . . . . . . . . . . 1 1Additional paid-in capital . . . . . . . . . . . . . . . . . . . . . . . . . . . . . . . . . . . . . . . . . . . . . . . . . . . . . . . . . . . . 871 634Retained earnings . . . . . . . . . . . . . . . . . . . . . . . . . . . . . . . . . . . . . . . . . . . . . . . . . . . . . . . . . . . . . . . . . . . 1,114 659Accumulated other comprehensive income . . . . . . . . . . . . . . . . . . . . . . . . . . . . . . . . . . . . . . . . . . . . . . (1) (88)Treasury Stock - 9,763,684 and 399,524 Class B shares, respectively, at cost . . . . . . . . . . . . . . . . . . (392) (13)
Total common stockholders’ equity . . . . . . . . . . . . . . . . . . . . . . . . . . . . . . . . . . . . . . . . . . . . . . . . . . 1,593 1,193Total Liabilities and Stockholders’ Equity . . . . . . . . . . . . . . . . . . . . . . . . . . . . . . . . . . . . . . . . . $ 8,223 $ 7,086
The accompanying Notes to Consolidated Financial Statements are an integral part of these statements.

4 0 C o n t i n e n t a l A i r l i n e s 1 9 9 9 A n n u a l R e p o r t
C O N S O L I D A T E D S T A T E M E N T S O F C A S H F L O W S
(In millions)
Year Ended December 31,1999 1998 1997
Cash Flows From Operating Activities:Net income . . . . . . . . . . . . . . . . . . . . . . . . . . . . . . . . . . . . . . . . . . . . . . . . . . . . . . . . . . . $ 455 $ 383 $ 385Adjustments to reconcile net income to net cash
provided by operating activities:Deferred income taxes . . . . . . . . . . . . . . . . . . . . . . . . . . . . . . . . . . . . . . . . . . . 293 224 212Depreciation . . . . . . . . . . . . . . . . . . . . . . . . . . . . . . . . . . . . . . . . . . . . . . . . . . . 284 211 162Amortization . . . . . . . . . . . . . . . . . . . . . . . . . . . . . . . . . . . . . . . . . . . . . . . . . . . 76 83 92Fleet disposition/impairment losses . . . . . . . . . . . . . . . . . . . . . . . . . . . . . . . . 81 122 —Gain on sale of AMADEUS . . . . . . . . . . . . . . . . . . . . . . . . . . . . . . . . . . . . . . . (297) — —Gain on sale of other investments . . . . . . . . . . . . . . . . . . . . . . . . . . . . . . . . . . (29) (6) —Cumulative effect of change in accounting principles . . . . . . . . . . . . . . . . . . 33 — —Other, net . . . . . . . . . . . . . . . . . . . . . . . . . . . . . . . . . . . . . . . . . . . . . . . . . . . . . . (83) (4) 34Changes in operating assets and liabilities:
Increase in accounts receivable . . . . . . . . . . . . . . . . . . . . . . . . . . . . . . . . . . (53) (102) (1)Increase in spare parts and supplies . . . . . . . . . . . . . . . . . . . . . . . . . . . . . . (99) (71) (38)Increase in accounts payable . . . . . . . . . . . . . . . . . . . . . . . . . . . . . . . . . . . . 8 59 71Increase in air traffic liability . . . . . . . . . . . . . . . . . . . . . . . . . . . . . . . . . . . 110 108 85Other . . . . . . . . . . . . . . . . . . . . . . . . . . . . . . . . . . . . . . . . . . . . . . . . . . . . . . . (3) (131) (103)
Net cash provided by operating activities . . . . . . . . . . . . . . . . . . . . . . . . . . . . . . . 776 876 899Cash Flows from Investing Activities:
Purchase deposits paid in connection with future aircraft deliveries . . . . . . . . . . . . (1,174) (818) (409)Purchase deposits refunded in connection with aircraft delivered . . . . . . . . . . . . . . 1,139 758 141Capital expenditures . . . . . . . . . . . . . . . . . . . . . . . . . . . . . . . . . . . . . . . . . . . . . . . . . . . (706) (610) (417)Purchase of short-term investments . . . . . . . . . . . . . . . . . . . . . . . . . . . . . . . . . . . . . . . (392) — —Proceeds from sale of AMADEUS, net . . . . . . . . . . . . . . . . . . . . . . . . . . . . . . . . . . . . 391 — —Proceeds from disposition of property and equipment . . . . . . . . . . . . . . . . . . . . . . . . 77 46 29Proceeds from sale of other investments . . . . . . . . . . . . . . . . . . . . . . . . . . . . . . . . . . . 35 9 —Investment in and advances to partner airlines . . . . . . . . . . . . . . . . . . . . . . . . . . . . . (23) (53) —Other . . . . . . . . . . . . . . . . . . . . . . . . . . . . . . . . . . . . . . . . . . . . . . . . . . . . . . . . . . . . . . . (6) (30) (1)
Net cash used by investing activities . . . . . . . . . . . . . . . . . . . . . . . . . . . . . . . . . . . (659) (698) (657)Cash Flows From Financing Activities:
Proceeds from issuance of long-term debt, net . . . . . . . . . . . . . . . . . . . . . . . . . . . . . . 453 737 517Purchase of Class B common stock . . . . . . . . . . . . . . . . . . . . . . . . . . . . . . . . . . . . . . . (528) (223) —Payments on long-term debt and capital lease obligations . . . . . . . . . . . . . . . . . . . . (295) (423) (676)Proceeds from issuance of common stock . . . . . . . . . . . . . . . . . . . . . . . . . . . . . . . . . . 38 56 24Proceeds from sale-leaseback transactions . . . . . . . . . . . . . . . . . . . . . . . . . . . . . . . . . 14 71 39Dividends paid on preferred securities of trust . . . . . . . . . . . . . . . . . . . . . . . . . . . . . . — (22) (22)Purchase of warrants to purchase Class B common stock . . . . . . . . . . . . . . . . . . . . . — — (94)Redemption of redeemable preferred stock . . . . . . . . . . . . . . . . . . . . . . . . . . . . . . . . — — (48)Other . . . . . . . . . . . . . . . . . . . . . . . . . . . . . . . . . . . . . . . . . . . . . . . . . . . . . . . . . . . . . . . — — (18)
Net cash (used) provided by financing activities . . . . . . . . . . . . . . . . . . . . . . . . . (318) 196 (278)Net (Decrease) Increase in Cash and Cash Equivalents . . . . . . . . . . . . . . . . . . . . . . . . . (201) 374 (36)Cash and Cash Equivalents Beginning of Period . . . . . . . . . . . . . . . . . . . . . . . . . . . . . . . 1,399 1,025 1,061Cash and Cash Equivalents End of Period . . . . . . . . . . . . . . . . . . . . . . . . . . . . . . . . . . . . $ 1,198 $ 1,399 $ 1,025

C o n t i n e n t a l A i r l i n e s 1 9 9 9 A n n u a l R e p o r t 4 1
Year Ended December 31,1999 1998 1997
Supplemental Cash Flows Information:Interest paid . . . . . . . . . . . . . . . . . . . . . . . . . . . . . . . . . . . . . . . . . . . . . . . . . . . . . . . . . $ 221 $ 157 $ 156Income taxes paid . . . . . . . . . . . . . . . . . . . . . . . . . . . . . . . . . . . . . . . . . . . . . . . . . . . . . $ 18 $ 25 $ 12
Investing and Financing Activities Not Affecting Cash:
Property and equipment acquired through the issuance of debt . . . . . . . . . . . . . . . . $ 774 $ 425 $ 207
Conversion of 6-3/4% Convertible Subordinated Notes . . . . . . . . . . . . . . . . . . . . . . $ 230 $ — $ —
Conversion of trust originated preferred securities . . . . . . . . . . . . . . . . . . . . . . . . . . . $ 111 $ 134 $ —
Capital lease obligations incurred . . . . . . . . . . . . . . . . . . . . . . . . . . . . . . . . . . . . . . . . $ 50 $ 124 $ 22
Sale-leaseback of Beech 1900-D aircraft . . . . . . . . . . . . . . . . . . . . . . . . . . . . . . . . . . $ 81 $ — $ —
The accompanying Notes to Consolidated Financial Statements are an integral part of these statements.

4 2 C o n t i n e n t a l A i r l i n e s 1 9 9 9 A n n u a l R e p o r t
C O N S O L I D A T E D S T A T E M E N T S O F R E D E E M A B L E P R E F E R R E D S T O C K
A N D C O M M O N S T O C K H O L D E R S ’ E Q U I T Y
(In millions)
Retained Accumulated
Redeemable Additional Earnings Other Treasury
Preferred Paid-In (Accumulated Comprehensive Comprehensive Stock,
Stock Capital Deficit) Income Income at Cost
Balance, December 31, 1996 . . . . . . . . . . . . . . . . . . . . $ 46 $ 688 $ (109) $ 2 $ 329 $ —
Net Income . . . . . . . . . . . . . . . . . . . . . . . . . . . . . . . . . . — — 385 — 385 —Purchase of Warrants . . . . . . . . . . . . . . . . . . . . . . . . . . — (94) — — — —Accumulated Dividends on Series A 12%
Cumulative Preferred Stock . . . . . . . . . . . . . . . . . . . 2 (2) — — — —Redemption of Series A 12% Cumulative
Preferred Stock . . . . . . . . . . . . . . . . . . . . . . . . . . . . (48) — — — — —Additional Minimum Pension Liability,
net of applicable income taxes of $2 . . . . . . . . . . . . — — — (4) (4) —Other . . . . . . . . . . . . . . . . . . . . . . . . . . . . . . . . . . . . . . — 49 — — — —
Balance, December 31, 1997 . . . . . . . . . . . . . . . . . . . . — 641 276 (2) 381 —
Net Income . . . . . . . . . . . . . . . . . . . . . . . . . . . . . . . — — 383 — 383 —Cumulative Effect of Adopting SFAS 133
(see Note 5) as of October 1, 1998, net of applicable income taxes of $1 . . . . . . . . . . . . — — — 1 1 —
Net loss on derivative instruments designated and qualifying as cash flow hedging instruments, net of applicable income taxes of $4 . . . . . . . . . . . . — — — (7) (7) —
Additional Minimum Pension Liability, net of applicable income taxes of $41 . . . . . . . . . . . — — — (76) (76) —
Unrealized loss on Marketable Equity Securities, net of applicable income taxes of $1 . . . . . . . . . . . . — — — (4) (4) —
Purchase of Common Stock . . . . . . . . . . . . . . . . . . . . . . — — — — — (223)Reissuance of Treasury Stock
pursuant to Stock Plans . . . . . . . . . . . . . . . . . . . . . . — — — — — 50Issuance of Common Stock
pursuant to Stock Plans . . . . . . . . . . . . . . . . . . . . . . — 19 — — — —Conversion of Trust Originated Preferred
Securities into Common Stock . . . . . . . . . . . . . . . . . — (32) — — — 160Other . . . . . . . . . . . . . . . . . . . . . . . . . . . . . . . . . . . . . . — 6 — — — —
Balance, December 31, 1998 . . . . . . . . . . . . . . . . . . . . — 634 659 (88) 297 (13)
Net Income . . . . . . . . . . . . . . . . . . . . . . . . . . . . . . . — — 455 — 455 —Net gain on derivative instruments designated
and qualifying as cash flow hedging instruments, net of reclassification adjustments and applicable income taxes of $2 . . . . . . . . . . . . . . . . . — — — 4 4 —
Unrealized gain on marketable equity securities, net of applicable income taxes . . . . . . . . . . . . . . . . . — — — 1 1 —
Reduction in additional minimum pension liability,net of applicable income taxes of $43 . . . . . . . . . . . — — — 82 82 —
Purchase of Common Stock . . . . . . . . . . . . . . . . . . . . . . — — — — — (528)Reissuance of Treasury Stock
pursuant to Stock Plans . . . . . . . . . . . . . . . . . . . . . . — (18) — — — 69Conversion of 63⁄4% Convertible Subordinated
Notes into Common Stock . . . . . . . . . . . . . . . . . . . . — 161 — — — 66Conversion of Trust Originated Preferred Securities
into Common Stock . . . . . . . . . . . . . . . . . . . . . . . . . — 100 — — — 11Conversion of Class A Common Stock to
Class B Common Stock . . . . . . . . . . . . . . . . . . . . . . — (3) — — — 3Other . . . . . . . . . . . . . . . . . . . . . . . . . . . . . . . . . . . . . . — (3) — — — —
Balance, December 31, 1999 . . . . . . . . . . . . . . . . . . . . $ — $ 871 $ 1,114 $ (1) $ 542 $ (392)

C o n t i n e n t a l A i r l i n e s 1 9 9 9 A n n u a l R e p o r t 4 3
Redeemable Class A Class BPreferred Common Common Treasury
Stock Stock Stock Stock
Balance, December 31, 1996 . . . . . . . . . . . . . . . . . . . . . . . . . . . . . . . . . 447,082 9,280,000 47,943,343 —Conversion of Class A to Class B Common Stock . . . . . . . . . . . . . . . . . . — (900,536) 900,536 —Purchase of Common Stock . . . . . . . . . . . . . . . . . . . . . . . . . . . . . . . . . . — — (154,882) 154,882Reissuance of Treasury Stock pursuant to Stock Plans . . . . . . . . . . . . . . — — 154,882 (154,882)Issuance of Preferred Stock Dividends on Series A 12%
Cumulative Preferred Stock . . . . . . . . . . . . . . . . . . . . . . . . . . . . . . . . 13,165 — — —Redemption of Series A 12% Cumulative Preferred Stock . . . . . . . . . . . . (460,247) — — —Issuance of Common Stock pursuant to Stock Plans . . . . . . . . . . . . . . . . — — 1,646,419 —Conversion of Trust Originated Preferred Securities
into Common Stock . . . . . . . . . . . . . . . . . . . . . . . . . . . . . . . . . . . . . . — — 21,712 —
Balance, December 31, 1997 . . . . . . . . . . . . . . . . . . . . . . . . . . . . . . . . . — 8,379,464 50,512,010 —Purchase of Common Stock . . . . . . . . . . . . . . . . . . . . . . . . . . . . . . . . . . — — (4,452,700) 4,452,700Reissuance of Treasury Stock pursuant to Stock Plans . . . . . . . . . . . . . . — — 859,080 (859,080)Reissuance of Treasury Stock pursuant to Conversion
of Trust Originated Preferred Securities . . . . . . . . . . . . . . . . . . . . . . . — — 3,181,896 (3,181,896)Conversion of Class A to Class B Common Stock . . . . . . . . . . . . . . . . . . — (12,200) 12,200 (12,200)Issuance of Common Stock pursuant to Stock Plans . . . . . . . . . . . . . . . . — — 235,290 —Conversion of Trust Originated Preferred Securities
into Common Stock . . . . . . . . . . . . . . . . . . . . . . . . . . . . . . . . . . . . . . — — 2,376,753 —Exercise of warrants . . . . . . . . . . . . . . . . . . . . . . . . . . . . . . . . . . . . . . . . — 3,039,468 246,688 —
Balance, December 31, 1998 . . . . . . . . . . . . . . . . . . . . . . . . . . . . . . . . . — 11,406,732 52,971,217 399,524Purchase of Common Stock . . . . . . . . . . . . . . . . . . . . . . . . . . . . . . . . . . — — (13,133,700) 13,133,700Reissuance of Treasury Stock pursuant to Stock Plans . . . . . . . . . . . . . . — — 1,853,478 (1,853,478)Reissuance of Treasury Stock pursuant to Conversion of
Class A to Class B Common Stock . . . . . . . . . . . . . . . . . . . . . . . . . . . — (85,883) 85,883 (85,883)Issuance of Common Stock pursuant to Stock Plans . . . . . . . . . . . . . . . . — — 13,227 —Conversion of 63⁄4% Convertible Subordinated Notes
into Common Stock . . . . . . . . . . . . . . . . . . . . . . . . . . . . . . . . . . . . . . — — 6,132,055 —Reissuance of Treasury Stock pursuant to Conversion
of 63⁄4% Convertible Subordinated Notes . . . . . . . . . . . . . . . . . . . . . . . — — 1,485,065 (1,485,065)Conversion of Trust Originated Preferred Securities
into Common Stock . . . . . . . . . . . . . . . . . . . . . . . . . . . . . . . . . . . . . . — — 4,407,408 —Reissuance of Treasury Stock pursuant to Conversion of
Trust Originated Preferred Securities . . . . . . . . . . . . . . . . . . . . . . . . . — — 345,114 (345,114)
Balance, December 31, 1999 . . . . . . . . . . . . . . . . . . . . . . . . . . . . . . . . . — 11,320,849 54,159,747 9,763,684
The accompanying Notes to Consolidated Financial Statements are an integral part of these statements.
C O N S O L I D A T E D S T A T E M E N T S O F R E D E E M A B L E P R E F E R R E D S T O C K
A N D C O M M O N S T O C K H O L D E R S ’ E Q U I T Y
(Number of Shares)

4 4 C o n t i n e n t a l A i r l i n e s 1 9 9 9 A n n u a l R e p o r t
N O T E S T O C O N S O L I D A T E D F I N A N C I A L S T A T E M E N T S
Continental Airlines, Inc. (the “Company” or “Continental”) is a
major United States air carrier engaged in the business of trans-
porting passengers, cargo and mail. Continental is the fifth largest
United States airline (as measured by 1999 revenue passenger
miles) and, together with its wholly owned subsidiaries,
Continental Express, Inc. (“Express”), and Continental
Micronesia, Inc. (“CMI”), each a Delaware corporation, serves
219 airports worldwide at January 17, 2000. As of December 31,
1999, Continental flies to 132 domestic and 87 international des-
tinations and offers additional connecting service through alliances
with domestic and foreign carriers. Continental directly serves 16
European cities, eight South American cities, Tel Aviv and Tokyo
and is one of the leading airlines providing service to Mexico and
Central America, serving more destinations there than any other
United States airline. Through its Guam hub, CMI provides exten-
sive service in the western Pacific, including service to more
Japanese cities than any other United States carrier.
As used in these Notes to Consolidated Financial Statements,
the terms “Continental” and “Company” refer to Continental
Airlines, Inc. and, unless the context indicates otherwise, its sub-
sidiaries.
Note 1 - Summary of Significant Accounting Policies
( a ) Pr inc i ple s of Consol idat ion —
The consolidated financial statements of the Company include
the accounts of Continental and its operating subsidiaries, Express
and CMI. All significant intercompany transactions have been
eliminated in consolidation.
(b ) Use of E s t imat e s —
The preparation of financial statements in conformity with gener-
ally accepted accounting principles requires management to make
estimates and assumptions that affect the amounts reported in the
financial statements and accompanying notes. Actual results could
differ from those estimates.
(c ) Ca sh and Cash Equ ivalen t s —
Cash and cash equivalents consist of cash and short-term,
highly liquid investments which are readily convertible into
cash and have a maturity of three months or less when pur-
chased.
(d ) Short -Term Inve s t men t s —
The Company invests in commercial paper with original maturi-
ties in excess of 90 days but less than 270 days. These investments
are classified as short-term investments in the accompanying con-
solidated balance sheet. Short-term investments are stated at cost,
which approximates market value.
( e ) Spare Part s and Suppl i e s —
Inventories, expendable parts and supplies relating to flight equip-
ment are carried at average acquisition cost and are expensed
when incurred in operations. An allowance for obsolescence is
provided over the remaining estimated useful life of the related air-
craft, for spare parts expected to be on hand the date the aircraft
are retired from service, plus allowances for spare parts current-
ly identified as excess. These allowances are based on
management estimates, which are subject to change.
( f ) Propert y and Equ i pmen t —
Property and equipment are recorded at cost and are depreciated
to estimated residual values over their estimated useful lives using
the straight-line method. The estimated useful lives and residual
values for the Company’s property and equipment are as follows:
Estimated EstimatedUseful Life Residual Value
Jet aircraft . . . . . . . . . . . 25 to 30 years 10-15%Turboprop aircraft . . . . . . 18 years 10%Ground property and equipment . . . . . . . 2 to 30 years 0%
Capital lease - flight and ground . . . . . . Lease Term 0%

C o n t i n e n t a l A i r l i n e s 1 9 9 9 A n n u a l R e p o r t 4 5
(g ) Rou t e s , Gat e s and Slot s —
Routes are amortized on a straight-line basis over 40 years, gates
over the stated term of the related lease and slots over 20 years.
Routes, gates and slots are comprised of the following (in mil-
lions):
Balance at Accumulated AmortizationDecember 31, 1999 at December 31, 1999
Routes . . . . . . . . . . $ 732 $ 157Gates . . . . . . . . . . . 306 141Slots . . . . . . . . . . . 93 47
$ 1,131 $ 345
(h) A ir Traff ic L i ab i l i t y —
Passenger revenue is recognized when transportation is provid-
ed rather than when a ticket is sold. The amount of passenger
ticket sales not yet recognized as revenue is reflected in the
accompanying Consolidated Balance Sheets as air traffic liabil-
ity. The Company performs periodic evaluations of this estimated
liability, and any adjustments resulting therefrom, which can be
significant, are included in results of operations for the periods
in which the evaluations are completed.
( i ) Frequen t Flyer Program —
Continental sponsors a frequent flyer program (“OnePass”)
and records an estimated liability for the incremental cost asso-
ciated with providing the related free transportation at the time a
free travel award is earned. The liability is adjusted periodically
based on awards earned, awards redeemed and changes in the
OnePass program.
The Company also sells mileage credits in the OnePass pro-
gram to participating partners, such as hotels, car rental agencies
and credit card companies. During 1999, as a result of the recent-
ly issued Staff Accounting Bulletin No. 101 - “Revenue
Recognition in Financial Statements,” the Company changed the
method it uses to account for the sale of these mileage credits. This
change, which totaled $27 million, net of tax, was applied retroac-
tively to January 1, 1999. Under the new accounting method,
revenue from the sale of mileage credits is deferred and recognized
when transportation is provided. Previously, the resulting revenue,
net of the incremental cost of providing future air travel, was record-
ed in the period in which the credits were sold. This change reduced
net income for the year ended December 31, 1999 by $21 million
($32 million pre-tax). The Company believes the new method is
preferable as it results in a better matching of revenues with the
period in which services are provided.
The pro forma results, assuming the accounting change is
applied retroactively, is shown below (in millions except per share
data):
1999 1998 1997
Income before Cumulative Effect of Accounting Change and Extraordinary Charge . . . . . . . . . $ 488 $ 382 $ 385
Earnings per Common Share . . . . . $7.02 $ 6.32 $6.65
Earnings per Common Share Assuming Dilution . . . . . . . . . . . $6.64 $ 5.00 $4.98
Net Income . . . . . . . . . . . . . . . . . . $ 482 $ 378 $ 381
Earnings per Common Share . . . . . $6.93 $ 6.26 $6.58
Earnings per Common Share Assuming Dilution . . . . . . . . . . . $6.57 $ 4.95 $4.93
Actual per share amounts are shown below for comparative
purposes.
Income before Cumulative Effect of Accounting Change and Extraordinary Charge . . . . . . . . . $ 488 $ 387 $ 389
Earnings per Common Share . . . . . $7.02 $ 6.40 $6.72
Earnings per Common Share Assuming Dilution . . . . . . . . . . . $6.64 $ 5.06 $5.03
Net Income . . . . . . . . . . . . . . . . . . $ 455 $ 383 $ 385
Earnings per Common Share . . . . . $6.54 $ 6.34 $6.65
Earnings per Common Share Assuming Dilution . . . . . . . . . . . $6.20 $ 5.02 $4.99

4 6 C o n t i n e n t a l A i r l i n e s 1 9 9 9 A n n u a l R e p o r t
( j ) Pa s senger Traff ic Commi s s ions -
Passenger traffic commissions are recognized as expense when the
transportation is provided and the related revenue is recognized.
The amount of passenger traffic commissions not yet recognized
as expense is included in Prepayments and other assets in the
accompanying Consolidated Balance Sheets.
(k ) Deferred Income Taxe s -
Deferred income taxes are provided under the liability method
and reflect the net tax effects of temporary differences between
the tax basis of assets and liabilities and their reported amounts
in the financial statements.
( l ) Ma in t enance and Repa i r Cos t s -
Maintenance and repair costs for owned and leased flight equip-
ment, including the overhaul of aircraft components, are charged
to operating expense as incurred, except engine overhaul costs
covered by power by the hour agreements, which are accrued on
the basis of hours flown.
(m) Advert i s ing Cost s -
The Company expenses the costs of advertising as incurred.
Advertising expense was $82 million, $78 million and
$78 million for the years ended December 31, 1999, 1998
and 1997, respectively.
(n ) S tock Pl ans and Awards -
Continental has elected to follow Accounting Principles Board
Opinion No. 25 - “Accounting for Stock Issued to Employees”
(“APB 25”) in accounting for its employee stock options and its
stock purchase plans because the alternative fair value account-
ing provided for under Statement of Financial Accounting
Standards No. 123 - “Accounting for Stock-Based Compensation”
(“SFAS 123”) requires use of option valuation models that were not
developed for use in valuing employee stock options or purchase
rights. Under APB 25, since the exercise price of the Company’s
employee stock options equals the market price of the underlying
stock on the date of grant, generally no compensation expense is
recognized. Furthermore, under APB 25, since the stock purchase
plans are considered noncompensatory plans, no compensation
expense is recognized.
(o ) Measuremen t of Impa irmen t -
In accordance with Statement of Financial Accounting Standards
No. 121, “Accounting for the Impairment of Long-Lived Assets
and for Long-Lived Assets to be Disposed Of” (“SFAS 121”), the
Company records impairment losses on long-lived assets used in
operations when events and circumstances indicate that the assets
might be impaired and the undiscounted cash flows estimated to
be generated by those assets are less than the carrying amount of
those assets.
( p ) S tar t - Up Cost s -
Statement of Position 98-5, “Reporting on the Costs of Start-Up
Activities” (“SOP 98-5”), requires start-up costs to be expensed
as incurred. Continental adopted SOP 98-5 in the first quarter of
1999. This statement requires all unamortized start up costs (e.g.,
pilot training costs related to induction of new aircraft) to be
expensed upon adoption, resulting in a $6 million cumulative
effect of a change in accounting principle, net of tax, in the first
quarter of 1999.
(q ) Recl a s s i f icat ions -
Certain reclassifications have been made in the prior years’
financial statements to conform to the current year presentation.
Note 2 - Earnings Per Share
Basic earnings per common share (“EPS”) excludes dilution and
is computed by dividing net income available to common stock-
holders by the weighted average number of common shares
outstanding for the period. Diluted EPS reflects the potential dilu-
tion that could occur if securities or other obligations to issue
common stock were exercised or converted into common stock or
resulted in the issuance of common stock that then shared in the
earnings of the Company. The following table sets forth the com-
putation of basic and diluted earnings per share (in millions):

C o n t i n e n t a l A i r l i n e s 1 9 9 9 A n n u a l R e p o r t 4 7
1999 1998 1997
Numerator:Income before cumulative effect of accounting changes and extraordinary charge . . . . . . $ 488 $ 387 $ 389
Cumulative effect of accounting changes . . . . . . . . . . (33) — —
Extraordinary charge, net of applicable income taxes . . . . . — (4) (4)
Net income . . . . . . . . . . . . . . . . . 455 383 385Preferred stock dividends . . . . . . — — (2)
Numerator for basic earnings per share — income available to common stockholders . . . . . . . 455 383 383
Effect of dilutive securities:Preferred Securities of Trust . . . . — 11 1463⁄4% convertible subordinated notes . . . . . . . . . . 4 9 11
4 20 25
Other . . . . . . . . . . . . . . . . . . . . . — — (4)
Numerator for diluted earnings per share — income available to common stockholders after assumed conversions . . . . . . . . $ 459 $ 403 $ 404
Denominator:Denominator for basic earnings per share - weighted-average shares . . . . . . . . . . . . . . 69.5 60.3 57.6
Effect of dilutive securities:Employee stock options . . . . . . . 1.4 1.7 1.6Warrants . . . . . . . . . . . . . . . . . . — 0.9 3.5Preferred Securities of Trust . . . . 0.1 9.8 10.363⁄4% convertible subordinated notes . . . . . . . . . . 2.9 7.6 7.6
Restricted Class B common stock . . . . . . . . . . . . . — — 0.4
Dilutive potential common shares . . . . . . . . . . . . . 4.4 20.0 23.4
Denominator for diluted earnings per share - adjusted weighted-average and assumed conversions . . . . . . . . . . . . . . . 73.9 80.3 81.0
Approximately 1.1 million in 1999 and 1.4 million in 1998 of
weighted average options to purchase shares of the Company’s
Class B common stock, par value $.01 per share (“Class B com-
mon stock”), were not included in the computation of diluted
earnings per share because the options’ exercise price was greater
than the average market price of the common shares and, there-
fore, the effect would have been antidilutive.
Note 3 - Long-Term Debt
Long-term debt as of December 31 is summarized as follows (in
millions):
1999 1998
SecuredNotes payable, interest rates of 5.00% to 7.73%, payable through 2019 . . . . . . . . $ 1,817 $ 886
Floating rate notes, interest rates of LIBOR plus 0.75% to 1.25%, Eurodollar plus 1.0%, or Commercial Paper, payable through 2009 . . . . . . . . . . . . . . . . . . . . . . 241 223
Revolving credit facility totaling $160 million, floating interest rates of LIBOR or Eurodollar plus 1.125% to 1.375%, payable through 2001 . . . . . . . 160 57
Notes payable, interest rates of 8.49% to 9.46%, payable through 2008 . . . . . . . . 51 66
Notes payable, interest rates of 7.13% to 7.15%, payable through 1999 . . . . . . . . — 86
UnsecuredSenior notes payable, 9.5%, payable through 2001 . . . . . . . . . . . . . . . 242 250
Credit facility, floating interest rate of LIBOR or Eurodollar plus 1.0%, payable through 2002 . . . . . . . . . . . . . . . 215 245
Senior notes payable, interest rate of 8.0%, payable through 2005 . . . . . . . . . 200 200
Notes payable, interest rate of 8.125%, payable through 2008 . . . . . . . . . . . . . . . 110 110
Floating rate note, interest rate of LIBOR or Eurodollar plus 1.25%, payable through 2004 . . . . . . . . . . . . . . . 74 74
Convertible subordinated notes, interest rate of 6.75% . . . . . . . . . . . . . . . . — 230
Other . . . . . . . . . . . . . . . . . . . . . . . . . . . 23 24
3,133 2,451Less: current maturities . . . . . . . . . . . . . . . 278 184
Total . . . . . . . . . . . . . . . . . . . . . . . . . . . . . $ 2,855 $ 2,267

4 8 C o n t i n e n t a l A i r l i n e s 1 9 9 9 A n n u a l R e p o r t
At December 31, 1999 and 1998, the LIBOR and Eurodollar
rates associated with Continental’s indebtedness approximated
6.0% and 5.1% and 6.0% and 5.1%, respectively. The
Commercial Paper rate was 6.1% and 5.5% as of December 31,
1999 and 1998, respectively.
A majority of Continental’s property and equipment is subject
to agreements securing indebtedness of Continental.
In July 1997, Continental entered into a $575 million credit
facility (the “Credit Facility”), including a $275 million term loan,
the proceeds of which were loaned to CMI to repay its existing
$320 million secured term loan. In connection with this prepay-
ment, Continental recorded a $4 million after tax extraordinary
charge relating to early extinguishment of debt. The Credit Facility
also includes a $225 million revolving credit facility with a com-
mitment fee of 0.225% per annum on the unused portion, and a
$75 million term loan commitment with a current floating inter-
est rate of Libor or Eurodollar plus 1.25%. At December 31, 1999
and 1998, no borrowings were outstanding under the $225 million
revolving credit facility. During 1998, the Credit Facility became
unsecured due to an upgrade of Continental’s credit rating by
Standard and Poor’s Corporation.
The Credit Facility does not contain any financial covenants
relating to CMI other than covenants restricting CMI’s incurrence
of certain indebtedness and pledge or sale of assets. In addition,
the Credit Facility contains certain financial covenants applica-
ble to Continental and prohibits Continental from granting a
security interest on certain of its international route authorities
and its stock in Air Micronesia, Inc., CMI’s parent company.
In April 1998, the Company completed an offering of $187 mil-
lion of pass-through certificates to be used to refinance the debt
related to 14 aircraft currently owned by Continental. In connec-
tion with this refinancing, Continental recorded a $4 million after
tax extraordinary charge to consolidated earnings in the second
quarter of 1998 related to the early extinguishment of such debt.
At December 31, 1999, under the most restrictive provisions
of the Company’s debt and credit facility agreements, the Company
had a minimum cash balance requirement of $600 million, a min-
imum net worth requirement of $972 million and was restricted
from paying cash dividends in excess of $576 million.
On April 15, 1999, the Company exercised its right and called
for redemption on May 25, 1999, all $230 million of its 6-3/4%
Convertible Subordinated Notes due 2006. The notes were con-
verted into 7.6 million shares of Class B common stock during
May 1999.
Maturities of long-term debt due over the next five years are as
follows (in millions):
Year ending December 31,
2000 . . . . . . . . . . . . . . . . . . . . . . . . . . . . . . . . . . $ 2782001 . . . . . . . . . . . . . . . . . . . . . . . . . . . . . . . . . . 5922002 . . . . . . . . . . . . . . . . . . . . . . . . . . . . . . . . . . 2662003 . . . . . . . . . . . . . . . . . . . . . . . . . . . . . . . . . . 1702004 . . . . . . . . . . . . . . . . . . . . . . . . . . . . . . . . . . 239
Note 4 - Leases
Continental leases certain aircraft and other assets under long-
term lease arrangements. Other leased assets include real
property, airport and terminal facilities, sales offices, mainte-
nance facilities, training centers and general offices. Most
leases also include both renewal options and purchase options.

C o n t i n e n t a l A i r l i n e s 1 9 9 9 A n n u a l R e p o r t 4 9
At December 31, 1999, the scheduled future minimum lease
payments under capital leases and the scheduled future minimum
lease rental payments required under aircraft and engine operat-
ing leases, that have initial or remaining noncancellable lease
terms in excess of one year, are as follows (in millions):
Capital OperatingLeases Leases
Year ending December 31,2000 . . . . . . . . . . . . . . . . . . . . . . . . . $ 59 $ 8512001 . . . . . . . . . . . . . . . . . . . . . . . . . 50 8232002 . . . . . . . . . . . . . . . . . . . . . . . . . 46 7532003 . . . . . . . . . . . . . . . . . . . . . . . . . 28 7002004 . . . . . . . . . . . . . . . . . . . . . . . . . 26 652Later years . . . . . . . . . . . . . . . . . . . . 96 6,080
Total minimum lease payments . . . . . . . 305 $9,859
Less: amount representing interest . . . . 62
Present value of capital leases . . . . . . . . 243Less: current maturities of capital leases 43
Long-term capital leases . . . . . . . . . . . . $ 200
Not included in the above operating lease table is approxi-
mately $493 million of annual average minimum lease payments
for each of the next five years relating to non-aircraft leases, prin-
cipally airport and terminal facilities and related equipment.
Continental is the guarantor of $1.2 billion aggregate princi-
pal amount of tax-exempt special facilities revenue bonds. These
bonds, issued by various airport municipalities, are payable sole-
ly from rentals paid by Continental under long-term agreements
with the respective governing bodies.
At December 31, 1999, the Company, including Express, had
382 and 19 aircraft under operating and capital leases, respec-
tively. These leases have remaining lease terms ranging from one
month to 22 years.
The Company’s total rental expense for all operating leases,
net of sublease rentals, was $1.1 billion, $922 million and $787
million in 1999, 1998 and 1997, respectively.
Note 5 - Financial Instruments and Risk Management
As part of the Company’s risk management program, Continental
uses or used a variety of financial instruments, including petro-
leum call options, petroleum swaps, jet fuel purchase
commitments, foreign currency average rate options, foreign
currency forward contracts and interest rate cap agreements. The
Company does not hold or issue derivative financial instruments
for trading purposes.
Effective October 1, 1998, the Company adopted Statement
of Financial Accounting Standards No. 133 - “Accounting for
Derivative Instruments and Hedging Activities” (“SFAS 133”).
SFAS 133 requires the Company to recognize all derivatives on
the balance sheet at fair value. Derivatives that are not hedges
must be adjusted to fair value through income. If the derivative
is a hedge, depending on the nature of the hedge, changes in the
fair value of derivatives are either offset against the change in
fair value of assets, liabilities, or firm commitments through earn-
ings or recognized in other comprehensive income until the
hedged item is recognized in earnings. The ineffective portion of
a derivative’s change in fair value is immediately recognized in
earnings. The adoption of SFAS 133 on October 1, 1998 did not
have a material impact on results of operations but resulted in
the cumulative effect of an accounting change of $2 million pre-
tax being recognized as income in other comprehensive income.
Not ional Amoun t s and Credi t Exposure
of Der i vat i ve s
The notional amounts of derivative financial instruments sum-
marized below do not represent amounts exchanged between
parties and, therefore, are not a measure of the Company’s expo-
sure resulting from its use of derivatives. The amounts exchanged
are calculated based upon the notional amounts as well as other
terms of the instruments, which relate to interest rates, exchange
rates or other indices.

5 0 C o n t i n e n t a l A i r l i n e s 1 9 9 9 A n n u a l R e p o r t
The Company is exposed to credit losses in the event of non-
performance by counterparties to these financial instruments, but
it does not expect any of the counterparties to fail to meet their
obligations. To manage credit risks, the Company selects coun-
terparties based on credit ratings, limits its exposure to a single
counterparty under defined Company guidelines, and monitors
the market position with each counterparty.
Fuel Pr ice R i sk Managemen t
The Company uses a combination of petroleum call options,
petroleum swap contracts, and jet fuel purchase commitments to
provide some short-term protection against a sharp increase in
jet fuel prices. These instruments generally cover the Company’s
forecasted jet fuel needs for three to six months.
The Company accounts for the call options and swap contracts
as cash flow hedges. In accordance with SFAS 133, such financial
instruments are marked-to-market using forward prices and fair
market value quotes with the offset to other comprehensive income,
net of applicable income taxes and hedge ineffectiveness and then
subsequently recognized as a component of fuel expense when
the underlying fuel being hedged is used. The ineffective portion
of these call options and swap agreements is determined based
on the correlation between West Texas Intermediate Crude Oil
prices and jet fuel prices, which was not material for the years
ended December 31, 1999 and 1998. For the year ended
December 31, 1999, the Company recognized approximately a
$105 million net gain on its fuel hedging program. The gain is
included in fuel expense in the accompanying consolidated state-
ment of operations.
At December 31, 1999, the Company had petroleum call
options outstanding with an aggregate notional amount of approx-
imately $310 million and an immaterial fair value. The notional
value of the Company’s petroleum swap contracts outstanding at
December 31, 1998 was $82 million with a fair value of $6 mil-
lion loss, which was recorded in other current liabilities with the
offset to other comprehensive income, net of applicable income
taxes and hedge ineffectiveness. The loss was recognized in earn-
ings during 1999.
Fore ign Currency Exchange R i sk Managemen t
The Company uses a combination of foreign currency average rate
options and forward contracts to hedge against the currency risk
associated with Japanese yen-denominated net cash flows for the
next nine to twelve months. The average rate options and forward
contracts have only nominal intrinsic value at the time of purchase.
The Company accounts for these instruments as cash flow
hedges. In accordance with SFAS 133, such financial instruments
are marked-to-market using forward prices and fair market value
quotes with the offset to other comprehensive income, net of appli-
cable income taxes and hedge ineffectiveness and then
subsequently recognized as a component of other revenue when
the underlying net cash flows are realized. The Company measures
hedge effectiveness of average rate options and forward contracts
based on the forward price of the underlying commodity. Hedge
ineffectiveness was not material during 1999 or 1998.
At December 31, 1999, the Company had yen forward con-
tracts outstanding with an aggregate notional amount of $197
million and a fair value loss of $5 million. The notional amount of
the Company’s yen average rate options and forward contracts out-
standing at December 31, 1998 was $78 million and $76 million,
respectively, with a total fair value loss of $3 million. Unrealized
losses are recorded in other current liabilities with the offset to
other comprehensive income, net of applicable income taxes and
hedge ineffectiveness. The unrealized loss at December 31, 1999
will be recognized in earnings within the next twelve months.
In t ere s t Rat e R i sk Managemen t
The Company entered into an interest rate cap agreement to reduce
the impact of potential increases on floating rate debt. The inter-
est rate cap had a notional amount of $106 million and $125
million as of December 31, 1999 and 1998, respectively, and is
effective through July 31, 2001. The Company accounts for the
interest rate cap as a cash flow hedge whereby the fair value of
the interest rate cap is reflected as an asset in the accompanying
consolidated balance sheet with the offset, net of any hedge inef-
fectiveness (which is not material) recorded as interest expense and
net of applicable income taxes, to other comprehensive income.
The fair value of the interest rate cap was not material as of
December 31, 1999 or 1998. As interest expense on the underly-
ing hedged debt is recognized, corresponding amounts are
removed from other comprehensive income and charged to inter-
est expense. Such amounts were not material during 1999 or 1998.

C o n t i n e n t a l A i r l i n e s 1 9 9 9 A n n u a l R e p o r t 5 1
Accumul at ed Der i vat i ve Ga ins or Los se s
The following table summarizes activity in other comprehensive
income related to derivatives classified as cash flow hedges held
by the Company during the period October 1 (the date of the
Company’s adoption of SFAS 133) through December 31, 1998
and for the year ended December 31, 1999 (in millions):
1999 1998
Accumulated derivative loss included in other comprehensive income at beginning of period . . . . . . . . . . . . . . . $ (6) $ —
Cumulative effect of adopting SFAS 133 as of October 1, 1998, net . . . . . . . . . . . . — 1
(Gains)/losses reclassified into earnings from other comprehensive income, net . . . . . . . . . . . . . . . . . . . . . . . (63) —
Change in fair value of derivatives, net . . . . 67 (7)
Accumulated loss included in other comprehensive income, net . . . . . . . . . . . $ (2) $ (6)
Ot her F inanc i al In s t rumen t s
(a) Cash equivalents —
Cash equivalents consist primarily of commercial paper with orig-
inal maturities of three months or less and approximate fair value
due to their short maturity.
(b) Short-term Investments —
Short-term investments consist primarily of commercial paper
with original maturities in excess of 90 days but less than 270
days and approximate fair value due to their short maturity.
(c) Investment in Equity Securities —
Continental’s investment in America West Holdings Corporation
is classified as available-for-sale and carried at an aggregate mar-
ket value of approximately $3 million at both December 31, 1999
and 1998. Included in stockholders’ equity at both December 31,
1999 and 1998 are net unrealized gains of $1 million.
In May 1998, the Company acquired a 49% interest in
Compania Panamena de Aviacion, S.A. (“COPA”) for $53 mil-
lion. The investment is accounted for under the equity method of
accounting. As of December 31, 1999 and 1998, the excess of
the amount at which the investment is carried and the amount of
underlying equity in the net assets was $40 million and $43 mil-
lion, respectively. This difference is being amortized over 40 years.
On October 20, 1999, Continental sold its interest in
AMADEUS Global Travel Distribution, S.A. (“AMADEUS”) for
$409 million, including a special dividend. The sale, which
occurred as part of AMADEUS’s initial public offering resulted in
a gain of approximately $297 million. As of December 31, 1998,
Continental’s investment in AMADEUS was carried at cost ($95
million), since a readily determinable market value did not exist.
At December 31, 1999, the Company owned approximately
357,000 depository certificates convertible, subject to certain
restrictions, into the common stock of Equant N.V. (“Equant”),
which completed an initial public offering in July 1998. As of
December 31, 1999, the estimated fair value of these depository
certificates was approximately $40 million, based upon the pub-
licly traded market value of Equant common stock. Since the fair
value of the Company’s investment in the depository certificates
is not readily determinable (i.e., the depository certificates are not
traded on a securities exchange), the investment is carried at cost,
which was not material as of December 31, 1999 or 1998.
In December 1999, the Company acquired a 28% interest in
Gulfstream International Airlines, Inc. (“Gulfstream”). The invest-
ment is accounted for under the equity method of accounting.

5 2 C o n t i n e n t a l A i r l i n e s 1 9 9 9 A n n u a l R e p o r t
In 1999, Continental received 1,500,000 warrants to purchase
common stock of priceline.com, Inc. (“Priceline”) at an exercise
price of $59.93 per share (the “Warrants”). In the fourth quarter
of 1999, the Company sold the Warrants for $18 million, resulting
in a loss of approximately $4 million.
(d) Debt —
The fair value of the Company’s debt with a carrying value of $2.75
billion and $1.98 billion at December 31, 1999 and 1998, respec-
tively, estimated based on the discounted amount of future cash
flows using the current incremental rate of borrowing for a simi-
lar liability or market prices, approximate $2.53 billion and $1.88
billion, respectively. The fair value of the remaining debt (with a
carrying value of $383 million and $473 million, respectively, and
primarily relating to aircraft modification notes and various loans
with immaterial balances) was not practicable to estimate due to
the large number and small dollar amounts of these notes.
Note 6 - Preferred Securities of Trust
Continental Airlines Finance Trust, a Delaware statutory busi-
ness trust (the “Trust”) with respect to which the Company owned
all of the common trust securities, had 2,298,327 8-1/2%
Convertible Trust Originated Preferred Securities (“TOPrS”) out-
standing at December 31, 1998. In November 1998, the Company
exercised its right and called for redemption approximately half
of its outstanding TOPrS. The TOPrS were convertible into shares
of Class B common stock at a conversion price of $24.18 per share
of Class B common stock. As a result of the call for redemption,
2,688,173 TOPrS were converted into 5,558,649 shares of Class
B common stock. In December 1998, the Company called for
redemption the remaining outstanding TOPrS. As a result of the
second call, the remaining 2,298,327 TOPrS were converted into
4,752,522 shares of Class B common stock during January 1999.
Distributions on the preferred securities were payable by the
Trust at the annual rate of 8-1/2% of the liquidation value of $50
per preferred security and are included in Distributions on
Preferred Securities of Trust in the accompanying Consolidated
Statements of Operations. At December 31, 1998, outstanding
TOPrS totaling $111 million are included in Continental-Obligated
Mandatorily Redeemable Preferred Securities of Subsidiary Trust
Holding Solely Convertible Subordinated Debentures in the
accompanying Consolidated Balance Sheets.
The sole assets of the trust were 8-1/2% Convertible
Subordinated Deferrable Interest Debentures (“Convertible
Subordinated Debentures”) with an aggregate principal amount of
$115 million at December 31, 1998.
The Convertible Subordinated Debentures and related income
statement effects are eliminated in the Company’s consolidated
financial statements.
Note 7 - Preferred, Common and Treasury Stock
Preferred S tock
Continental has 10 million shares of authorized preferred stock,
none of which was outstanding as of December 31, 1999 or 1998.
Common Stock
Continental has two classes of common stock issued and
outstanding, Class A common stock, par value $.01 per share
(“Class A common stock”) and Class B common stock. Each share
of Class A common stock is entitled to 10 votes per share and each
share of Class B common stock is entitled to one vote per share.
In addition, Continental has authorized 50 million shares of
Class D common stock, par value $.01 per share, none of which
is outstanding.
The Company’s Certificate of Incorporation permits shares of
the Company’s Class A common stock to be converted into an equal
number of shares of Class B common stock. During 1999 and 1998,
85,883 and 12,200 shares of the Company’s Class A common stock,
respectively, were so converted.

C o n t i n e n t a l A i r l i n e s 1 9 9 9 A n n u a l R e p o r t 5 3
Trea sury S tock
The Company’s Board of Directors has authorized the expendi-
ture of up to $1.2 billion to repurchase shares of the Company’s
Class A common stock and Class B common stock or securities
convertible into Class B common stock. The Company’s Board of
Directors also authorized the Company to use up to one-half of its
2000 and later adjusted net income, and all of the net proceeds of
future sales of non-strategic assets, for additional stock repur-
chases. Subject to applicable securities law, such purchases occur
at times and in amounts that the Company deems appropriate. No
time limit was placed on the duration of the repurchase program.
As of December 31, 1999, the Company had repurchased
17,586,400 shares of Class B common stock for $751 million since
the inception of the repurchase program in March 1998.
Stockholder R igh t s Pl an
Effective November 20, 1998, the Company adopted a stockholder
rights plan (the “Rights Plan”) in connection with the disposition
by Air Partners, L.P. (“Air Partners”) of its interest in the Company
to an affiliate of Northwest Airlines, Inc. (together with such affil-
iate, “Northwest”).
The rights become exercisable upon the earlier of (i) the tenth
day following a public announcement or public disclosure of facts
indicating that a person or group of affiliated or associated persons
has acquired beneficial ownership of 15% or more of the total
number of votes entitled to be cast generally by the holders of the
common stock of the Company then outstanding, voting together
as a single class (such person or group being an “Acquiring
Person”), or (ii) the tenth business day (or such later date as may
be determined by action of the Board of Directors prior to such
time as any person becomes an Acquiring Person) following the
commencement of, or announcement of an intention to make, a
tender offer or exchange offer the consummation of which would
result in any person becoming an Acquiring Person. Certain per-
sons and entities related to the Company, Air Partners or Northwest
at the time the Rights Plan was adopted are exempt from the def-
inition of “Acquiring Person.”
The rights will expire on November 20, 2008 unless extend-
ed or unless the rights are earlier redeemed or exchanged by
the Company.
Subject to certain adjustments, if any person becomes an
Acquiring Person, each holder of a right, other than rights bene-
ficially owned by the Acquiring Person and its affiliates and
associates (which rights will thereafter be void), will thereafter
have the right to receive, upon exercise thereof, that number of
Class B Common Shares having a market value of two times the
exercise price ($200, subject to adjustment) of the right.
If at any time after a person becomes an Acquiring Person, (i)
the Company merges into any other person, (ii) any person merges
into the Company and all of the outstanding common stock does
not remain outstanding after such merger, or (iii) the Company
sells 50% or more of its consolidated assets or earning power, each
holder of a right (other than the Acquiring Person and its affiliates
and associates) will have the right to receive, upon the exercise
thereof, that number of shares of common stock of the acquiring
corporation (including the Company as successor thereto or as the
surviving corporation) which at the time of such transaction will
have a market value of two times the exercise price of the right.
At any time after any person becomes an Acquiring Person,
and prior to the acquisition by any person or group of a majority
of the Company’s voting power, the Board of Directors may
exchange the rights (other than rights owned by such Acquiring
Person which have become void), in whole or in part, at an
exchange ratio of one share of Class B common stock per right
(subject to adjustment).
At any time prior to any person becoming an Acquiring
Person, the Board of Directors may redeem the rights at a price
of $.001 per right. The Rights Plan may be amended by the Board
of Directors without the consent of the holders of the rights,
except that from and after such time as any person becomes an
Acquiring Person no such amendment may adversely affect the
interests of the holders of the rights (other than the Acquiring
Person and its affiliates and associates). Until a right is exer-
cised, the holder thereof, as such, will have no rights as a
stockholder of the Company, including, without limitation, the
right to vote or to receive dividends.

5 4 C o n t i n e n t a l A i r l i n e s 1 9 9 9 A n n u a l R e p o r t
Note 8 - Stock Plans and Awards
Stock Opt ions
On October 4, 1999, the Board of Directors adopted the
Continental Airlines, Inc. Incentive Plan 2000 (the “2000
Incentive Plan”), subject to approval by the stockholders of
the Company at the annual stockholders meeting in May 2000.
The 2000 Incentive Plan provides that the Company may grant
awards (options, restricted stock awards, performance awards
or incentive awards) to non-employee directors of the Company
or employees of the Company or its subsidiaries. Subject to
adjustment as provided in the Incentive Plan, the aggregate
number of shares of Class B common stock that may be issued
under the Incentive Plan may not exceed 3,000,000 shares,
which may be originally issued or treasury shares or a combi-
nation thereof.
The stockholders of the Company have approved the
Company’s 1998 Stock Incentive Plan, 1997 Stock Incentive
Plan and 1994 Incentive Equity Plan (collectively, the “Plans”)
under which the Company may issue shares of restricted
Class B common stock or grant options to purchase shares of
Class B common stock to non-employee directors and employ-
ees of the Company or its subsidiaries. Subject to adjustment as
provided in the Plans, the aggregate number of shares of Class
B common stock that may be issued may not exceed 16,500,000
shares, which may be originally issued or treasury shares or a
combination thereof. Options granted under the Plans are award-
ed with an exercise price equal to the fair market value of the
stock on the date of grant. The total shares remaining available
for grant under the Plans at December 31, 1999 was 969,327. No
options may be awarded under the 1994 Incentive Equity Plan
after December 31, 1999. Stock options granted under the Plans
generally vest over a period of three to four years and have a
term of five years.
Under the terms of the Plans, a change of control would result
in all outstanding options under these plans becoming exercis-
able in full and restrictions on restricted shares being terminated.
The following table summarizes stock option transactions pursuant to the Company’s Plans (share data in thousands):
1999 1998 1997
Weighted- Weighted- Weighted-Average Average Average
Options Exercise Price Options Exercise Price Options Exercise Price
Outstanding at Beginning of Year . . . . . . . . . . . . 9,683 $ 30.31 5,998 $ 22.62 5,809 $ 17.37Granted . . . . . . . . . . . . . . . . . . . . . . . . . . . . . . . 1,055 $ 33.38 6,504 $ 43.75 1,968 $ 29.34Exercised . . . . . . . . . . . . . . . . . . . . . . . . . . . . . (1,464) $ 16.54 (807) $ 19.53 (1,582) $ 11.72Cancelled . . . . . . . . . . . . . . . . . . . . . . . . . . . . . (269) $ 37.41 (2,012) $ 55.18 (197) $ 22.49
Outstanding at End of Year . . . . . . . . . . . . . . . . 9,005 $ 32.69 9,683 $ 30.31 5,998 $ 22.62
Options exercisable at end of year (1) . . . . . . . . . 4,845 $ 29.13 5,174 $ 23.56 1,229 $ 20.61
(1) On November 20, 1998, Air Partners disposed of its interest in the Company to Northwest, resulting in a change of control under the terms of the Plans. As a result,
all options and restricted stock then outstanding under these plans became exercisable and fully vested, respectively.

C o n t i n e n t a l A i r l i n e s 1 9 9 9 A n n u a l R e p o r t 5 5
The following tables summarize the range of exercise prices
and the weighted average remaining contractual life of the options
outstanding and the range of exercise prices for the options exer-
cisable at December 31, 1999 (share data in thousands):
Options Outstanding
WeightedAverage
RemainingRange of Contractual Weighted Average
Exercise Prices Outstanding Life Exercise Price
$4.56-$8.00 208 0.68 $7.80$8.19-$22.13 183 2.03 $16.64$22.38-$28.63 2,468 1.76 $26.12$28.75-$32.13 2,616 3.45 $30.31$32.25-$56.81 3,530 3.92 $41.35
$4.56-$56.81 9,005 3.08 $32.69
Options Exercisable
Range of Weighted AverageExercise Prices Exercisable Exercise Price
$4.56-$8.00 208 $ 7.80$8.19-$22.13 183 $16.64$22.38-$28.63 2,468 $26.12$28.75-$32.13 917 $29.71$32.25-$56.81 1,069 $41.90
$4.56-$56.81 4,845 $29.13
Employee S tock Purchase Pl ans
All employees of the Company are eligible to participate in the
Company’s stock purchase program under which they may pur-
chase shares of Class B common stock of the Company at 85% of
the lower of the fair market value on the first day of the option
period or the last day of the option period. During 1999 and 1998,
526,729 and 305,978 shares, respectively, of Class B common
stock were issued at prices ranging from $27.84 to $49.41 in 1999
and $29.33 to $49.41 in 1998. During 1997, 218,892 shares of
Class B common stock were issued at prices ranging from $19.55
to $29.33.
Pro Forma S FAS 1 2 3 Re sult s
Pro forma information regarding net income and earnings per share
has been determined as if the Company had accounted for its
employee stock options and purchase rights under the fair value
method of SFAS 123. The fair value for these options was esti-
mated at the date of grant using a Black-Scholes option pricing
model with the following weighted-average assumptions for 1999,
1998 and 1997, respectively: risk-free interest rates of 4.9%, 4.9%
and 6.1%; dividend yields of 0%; volatility factors of the expect-
ed market price of the Company’s common stock of 43% for 1999,
40% for 1998 and 34% for 1997; and a weighted-average expect-
ed life of the option of 3.1 years, 3.0 years and 2.5 years. The
weighted average grant date fair value of the stock options grant-
ed in 1999, 1998 and 1997 was $11.13, $13.84 and $7.87 per
option, respectively.
The fair value of the purchase rights under the stock purchase
plans was also estimated using the Black-Scholes model with the
following weighted-average assumptions for 1999, 1998 and 1997,
respectively: risk free interest rates of 4.7%, 4.7% and 5.2%; div-
idend yields of 0%; expected volatility of 43% for 1999, 40% for
1998 and 34% for 1997; and an expected life of .25 years for 1999,
.25 years for 1998 and .33 years for 1997. The weighted-average
fair value of the purchase rights granted in 1999, 1998 and 1997
was $7.72, $9.10 and $7.38, respectively.
The Black-Scholes option valuation model was developed for
use in estimating the fair value of traded options which have no
vesting restrictions and are fully transferrable. In addition, option
valuation models require the input of highly subjective assump-
tions including the expected stock price volatility. Because the
Company’s employee stock options and purchase rights have char-
acteristics significantly different from those of traded options,
and because changes in the subjective input assumptions can
materially affect the fair value estimate, in management’s opin-
ion, the existing models do not necessarily provide a reliable
single measure of the fair value of its employee stock options and
purchase rights.

5 6 C o n t i n e n t a l A i r l i n e s 1 9 9 9 A n n u a l R e p o r t
Assuming that the Company had accounted for its employee
stock options and purchase rights using the fair value method and
amortized the resulting amount to expense over the options’ vest-
ing period, net income would have been reduced by $24 million,
$18 million and $11 million for the years ended December 31,
1999, 1998 and 1997, respectively. Basic EPS would have been
reduced by 35 cents, 30 cents and 18 cents for the years ended
December 31, 1999, 1998 and 1997, respectively, and diluted EPS
would have been reduced by 33 cents, 23 cents and 14 cents for the
same periods, respectively. The pro forma effect on net income is
not representative of the pro forma effects on net income in future
years because it did not take into consideration pro forma com-
pensation expense related to grants made prior to 1995.
Note 10 - Employee Benefit Plans
The Company has noncontributory defined benefit pension and
defined contribution (including 401(k) savings) plans.
Substantially all domestic employees of the Company are covered
by one or more of these plans. The benefits under the active defined
benefit pension plan are based on years of service and an employ-
ee’s final average compensation. For the years ended December
31, 1999, 1998 and 1997, total expense for the defined contribu-
tion plan was $14 million, $8 million and $6 million, respectively.
The following table sets forth the defined benefit pension
plans’ change in projected benefit obligation for 1999 and 1998:
1999 1998(in millions)
Projected benefit obligation at beginning of year . . . . . . . . . . . . . . . . . . $ 1,230 $ 846
Service cost . . . . . . . . . . . . . . . . . . . . . . . . 66 55Interest cost . . . . . . . . . . . . . . . . . . . . . . . . 90 69Plan amendments . . . . . . . . . . . . . . . . . . . . 54 110Actuarial (gains) losses . . . . . . . . . . . . . . . (47) 178Benefits paid . . . . . . . . . . . . . . . . . . . . . . . (93) (28)
Projected benefit obligation at end of year . . . . . . . . . . . . . . . . . . . . . $ 1,300 $ 1,230
Note 9 - Accumulated Other Comprehensive Income
The components of accumulated other comprehensive income are as follows (in millions):
UnrealizedMinimum Unrealized Gain/(Loss)Pension Gain/(Loss) on DerivativeLiability on Investments Instruments Total
Balance at December 31, 1996 . . . . . . . . . . . . . . . . . . . . . . . . . . . . . . . . . . . . . . . . . . . . . $ (2) $ 4 $ — $ 2
Current year net change in other comprehensive income . . . . . . . . . . . . . . . . . . . . . . . . . (4) — — (4)
Balance at December 31, 1997 . . . . . . . . . . . . . . . . . . . . . . . . . . . . . . . . . . . . . . . . . . . . . (6) 4 — (2)
Current year net change in other comprehensive income . . . . . . . . . . . . . . . . . . . . . . . . . (76) (4) (6) (86)
Balance at December 31, 1998 . . . . . . . . . . . . . . . . . . . . . . . . . . . . . . . . . . . . . . . . . . . . . (82) — (6) (88)
Current year net change in other comprehensive income . . . . . . . . . . . . . . . . . . . . . . . . . 82 1 4 87
Balance at December 31, 1999 . . . . . . . . . . . . . . . . . . . . . . . . . . . . . . . . . . . . . . . . . . . . . $ — $ 1 $ (2) $ (1)

C o n t i n e n t a l A i r l i n e s 1 9 9 9 A n n u a l R e p o r t 5 7
The following table sets forth the defined benefit pension
plans’ change in the fair value of plan assets for 1999 and 1998:
1999 1998(in millions)
Fair value of plan assets at beginning of year . . . . . . . . . . . . . . . . . . $ 781 $ 633
Actual return on plan assets . . . . . . . . . . . . 138 75Employer contributions . . . . . . . . . . . . . . . 187 101Benefits paid . . . . . . . . . . . . . . . . . . . . . . . (93) (28)
Fair value of plan assets at end of year . . . . . . . . . . . . . . . . . . . . . . . $ 1,013 $ 781
Pension cost recognized in the accompanying consolidated
balance sheets is computed as follows:
1999 1998(in millions)
Funded status of the plans — net underfunded . . . . . . . . . . . . . . . . . . . $ (287) $ (449)
Unrecognized net actuarial loss . . . . . . . . . 152 256Unrecognized prior service cost . . . . . . . . . 143 113
Net amount recognized . . . . . . . . . . . . . . . . 8 (80)
Prepaid benefit cost . . . . . . . . . . . . . . . . . . 12 2Accrued benefit liability . . . . . . . . . . . . . . (78) (320)Intangible asset . . . . . . . . . . . . . . . . . . . . . 74 113Accumulated other
comprehensive income . . . . . . . . . . . . . . — 125
Net amount recognized . . . . . . . . . . . . . . . . $ 8 $ (80)
The $125 million charge to other comprehensive income in
1998 was reversed in 1999 due to favorable asset performance
and an increase in the weighted average assumed discount rate.
Net periodic defined benefit pension cost for 1999, 1998 and
1997 included the following components:
1999 1998 1997(in millions)
Service cost . . . . . . . . . . . . . . . . . . $ 66 $ 55 $ 38Interest cost . . . . . . . . . . . . . . . . . 90 69 51Expected return on
plan assets . . . . . . . . . . . . . . . . (84) (64) (49)Amortization of
prior service cost . . . . . . . . . . . . 13 6 1Amortization of unrecognized
net actuarial loss . . . . . . . . . . . . 13 4 —
Net periodic benefit cost . . . . . . . . $ 98 $ 70 $ 41
The following actuarial assumptions were used to determine
the actuarial present value of the Company’s projected benefit
obligation:
1999 1998 1997
Weighted average assumed discount rate . . . . 8.25% 7.0% 7.25%
Expected long-term rate of return on plan assets . . . 9.50% 9.50% 9.25%
Weighted average rate of compensation increase . . . . 4.98%-5.27% 5.30% 4.90%
The projected benefit obligation, accumulated benefit obliga-
tion and the fair value of plan assets for the pension plans with
projected benefit obligations and accumulated benefit obligations
in excess of plan assets were $1.3 billion, $1.1 billion and $1.0 bil-
lion, respectively, as of December 31, 1999, and $1.2 billion, $1.1
billion and $771 million, respectively, as of December 31, 1998.
During 1999 and 1998, the Company amended its benefit plan
as a result of changes in benefits pursuant to new collective bar-
gaining agreements.
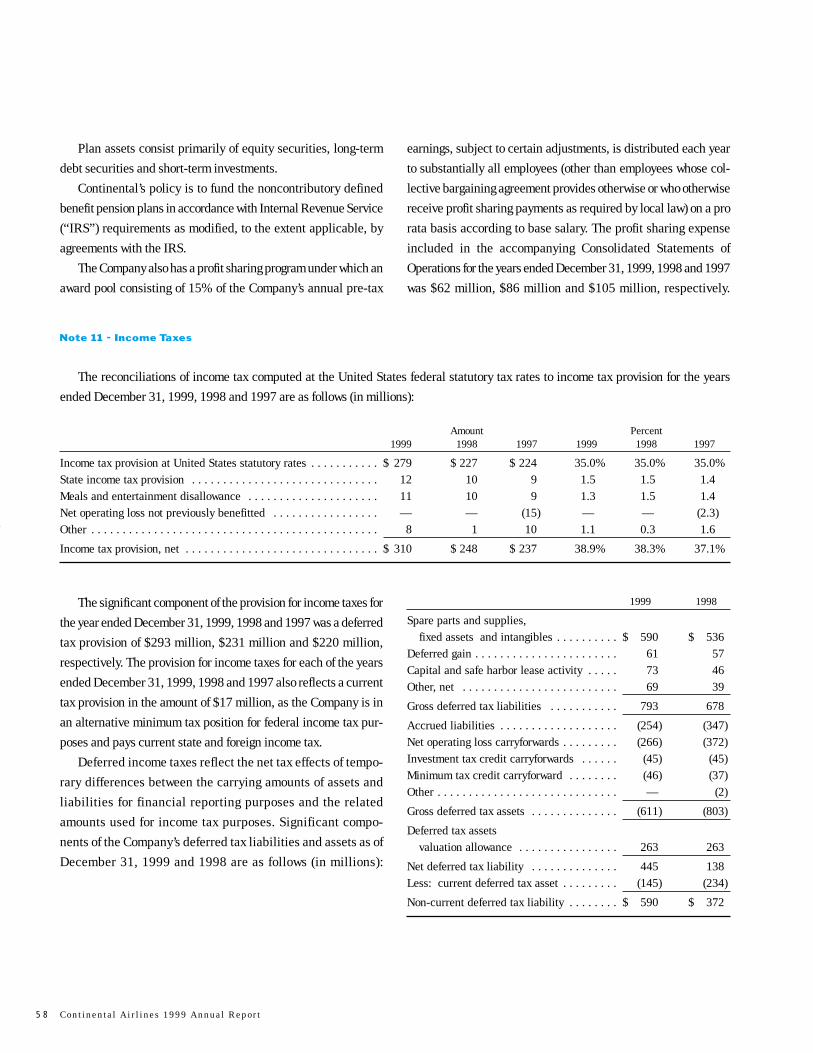
5 8 C o n t i n e n t a l A i r l i n e s 1 9 9 9 A n n u a l R e p o r t
Note 11 - Income Taxes
The reconciliations of income tax computed at the United States federal statutory tax rates to income tax provision for the years
ended December 31, 1999, 1998 and 1997 are as follows (in millions):
Amount Percent1999 1998 1997 1999 1998 1997
Income tax provision at United States statutory rates . . . . . . . . . . . $ 279 $ 227 $ 224 35.0% 35.0% 35.0%State income tax provision . . . . . . . . . . . . . . . . . . . . . . . . . . . . . . 12 10 9 1.5 1.5 1.4Meals and entertainment disallowance . . . . . . . . . . . . . . . . . . . . . 11 10 9 1.3 1.5 1.4Net operating loss not previously benefitted . . . . . . . . . . . . . . . . . — — (15) — — (2.3)Other . . . . . . . . . . . . . . . . . . . . . . . . . . . . . . . . . . . . . . . . . . . . . . 8 1 10 1.1 0.3 1.6
Income tax provision, net . . . . . . . . . . . . . . . . . . . . . . . . . . . . . . . $ 310 $ 248 $ 237 38.9% 38.3% 37.1%
Plan assets consist primarily of equity securities, long-term
debt securities and short-term investments.
Continental’s policy is to fund the noncontributory defined
benefit pension plans in accordance with Internal Revenue Service
(“IRS”) requirements as modified, to the extent applicable, by
agreements with the IRS.
The Company also has a profit sharing program under which an
award pool consisting of 15% of the Company’s annual pre-tax
earnings, subject to certain adjustments, is distributed each year
to substantially all employees (other than employees whose col-
lective bargaining agreement provides otherwise or who otherwise
receive profit sharing payments as required by local law) on a pro
rata basis according to base salary. The profit sharing expense
included in the accompanying Consolidated Statements of
Operations for the years ended December 31, 1999, 1998 and 1997
was $62 million, $86 million and $105 million, respectively.
The significant component of the provision for income taxes for
the year ended December 31, 1999, 1998 and 1997 was a deferred
tax provision of $293 million, $231 million and $220 million,
respectively. The provision for income taxes for each of the years
ended December 31, 1999, 1998 and 1997 also reflects a current
tax provision in the amount of $17 million, as the Company is in
an alternative minimum tax position for federal income tax pur-
poses and pays current state and foreign income tax.
Deferred income taxes reflect the net tax effects of tempo-
rary differences between the carrying amounts of assets and
liabilities for financial reporting purposes and the related
amounts used for income tax purposes. Significant compo-
nents of the Company’s deferred tax liabilities and assets as of
December 31, 1999 and 1998 are as follows (in millions):
1999 1998
Spare parts and supplies, fixed assets and intangibles . . . . . . . . . . $ 590 $ 536
Deferred gain . . . . . . . . . . . . . . . . . . . . . . . 61 57Capital and safe harbor lease activity . . . . . 73 46Other, net . . . . . . . . . . . . . . . . . . . . . . . . . 69 39
Gross deferred tax liabilities . . . . . . . . . . . 793 678
Accrued liabilities . . . . . . . . . . . . . . . . . . . (254) (347)Net operating loss carryforwards . . . . . . . . . (266) (372)Investment tax credit carryforwards . . . . . . (45) (45)Minimum tax credit carryforward . . . . . . . . (46) (37)Other . . . . . . . . . . . . . . . . . . . . . . . . . . . . . — (2)
Gross deferred tax assets . . . . . . . . . . . . . . (611) (803)
Deferred tax assets valuation allowance . . . . . . . . . . . . . . . . 263 263
Net deferred tax liability . . . . . . . . . . . . . . 445 138Less: current deferred tax asset . . . . . . . . . (145) (234)
Non-current deferred tax liability . . . . . . . . $ 590 $ 372

C o n t i n e n t a l A i r l i n e s 1 9 9 9 A n n u a l R e p o r t 5 9
At December 31, 1999, the Company had estimated tax net
operating losses (“NOLs”) of $700 million for federal income tax
purposes that will expire through 2009 and federal investment tax
credit carryforwards of $45 million that will expire through 2001.
As a result of the change in ownership of the Company on April
27, 1993, the ultimate utilization of the Company’s net operating
losses and investment tax credits may be limited. Reflecting this
limitation, the Company had a valuation allowance of $263 mil-
lion at December 31, 1999 and 1998.
The Company has consummated several transactions which
resulted in the recognition of NOLs of the Company’s predecessor.
To the extent the Company were to determine in the future that
additional NOLs of the Company’s predecessor could be recog-
nized in the accompanying consolidated financial statements, such
benefit would reduce the value ascribed to routes, gates and slots.
Note 12 - Accruals for Aircraft Retirements
and Excess Facilities
During the fourth quarter of 1999, the Company made the decision
to accelerate the retirement of six DC-10-30 aircraft and other
items in 1999 and the first half of 2000 and to dispose of related
excess inventory. The DC-10-30’s will be replaced by Boeing 757
and Boeing 737-800 aircraft on certain routes, and by Boeing 777
aircraft on other routes. In addition, the market value of certain
Boeing 747 aircraft no longer operated by the Company has
declined. As a result of these items and certain other fleet-relat-
ed items, the Company recorded a fleet disposition/impairment
loss of $81 million in the fourth quarter of 1999.
Approximately $52 million of the $81 million charge relates
to the impairment of owned or capital leased aircraft and related
inventory held for disposal with a carrying amount of $77 million.
The remaining $29 million of the charge relates primarily to costs
expected to be incurred related to the return of leased aircraft. As
of December 31, 1999, the remaining accrual for the 1999 fleet
disposition/impairment loss totaled $12 million.
In August 1998, the Company announced that CMI planned
to accelerate the retirement of its four Boeing 747 aircraft by April
1999 and its remaining thirteen Boeing 727 aircraft by December
2000. The Boeing 747s have been replaced by DC-10-30 aircraft
and the Boeing 727 aircraft will be replaced with a reduced num-
ber of Boeing 737 aircraft. In addition, Express accelerated the
retirement of certain turboprop aircraft to the year 2000, includ-
ing its fleet of 32 EMB-120 turboprop aircraft, as regional jets are
acquired to replace turboprops. In connection with its decision to
accelerate the replacement of these aircraft, the Company per-
formed evaluations to determine, in accordance with SFAS 121,
whether future cash flows (undiscounted and without interest
charges) expected to result from the use and eventual disposition
of these aircraft would be less than the aggregate carrying amount
of these aircraft and the related assets. As a result of the evalua-
tion, management determined that the estimated future cash flows
expected to be generated by these aircraft would be less than their
carrying amount, and therefore these aircraft are impaired as
defined by SFAS 121. Consequently, the original cost basis of
these aircraft and related items was reduced to reflect the fair mar-
ket value at the date the decision was made, resulting in a $59
million fleet disposition/impairment loss. In determining the fair
market value of these assets, the Company considered recent
transactions involving sales of similar aircraft and market trends
in aircraft dispositions. The remaining $63 million of the fleet dis-
position/impairment loss includes cash and non-cash costs related
primarily to future commitments on leased aircraft past the dates
they will be removed from service and the write-down of related
inventory to its estimated fair market value. The combined charge
of $122 million was recorded in the third quarter of 1998. As of
December 31, 1999, the remaining accrual for the 1998 fleet dis-
position/impairment loss totaled $40 million.
The remaining balance of accruals for aircraft retirements and
excess facilities at December 31, 1999 relates to the 1996 fleet dis-
position/impairment loss accrual of $21 million and the 1994
accrual for fleet disposition/impairment loss and underutilized
facilities of $47 million.

6 0 C o n t i n e n t a l A i r l i n e s 1 9 9 9 A n n u a l R e p o r t
The following represents the activity within these accruals dur-
ing the three years ended December 31, 1999 (in millions):
1999 1998 1997
Total accruals at beginning of year . . . . . . . . . . . . $ 155 $ 151 $ 205
Net cash payments:Aircraft related . . . . . . . . . . . . . (32) (34) (27)Underutilized facilities
and other . . . . . . . . . . . . . . . . (20) (30) (13)Increase/(decrease) in accrual
for grounded aircraft . . . . . . . . . — — (16)Fleet disposition/impairment
loss for costs of return of leased aircraft . . . . . . . . . . . . . . 20 — —
Fleet disposition/impairment loss for the retirement of aircraft . . . . . . . . . . . . . . . . . — 63 —
Other . . . . . . . . . . . . . . . . . . . . . . (3) 5 2
Total accruals at end of year . . . . . 120 155 151Portion included in accrued
other liabilities . . . . . . . . . . . . . (51) (60) (28)
Accrual for aircraft retirements and excess facilities . . . . . . . . . . $ 69 $ 95 $ 123
The remaining accruals relate primarily to anticipated cash
outlays associated with (i) underutilized airport facilities (pri-
marily associated with Denver International Airport), (ii) the
return of leased aircraft and (iii) the remaining liability associat-
ed with the grounded aircraft. The Company has assumed certain
sublease rental income for these closed and underutilized facil-
ities and grounded aircraft in determining the accrual at each
balance sheet date. However, should actual sublease rental
income be different from the Company’s estimates, the actual
charge could be different from the amount estimated. The remain-
ing accrual represents cash outlays to be incurred over the
remaining lease terms (from one to 19 years). The Company
expects to finance the cash outlays primarily with internally gen-
erated funds.
Note 13 - Commitments and Contingencies
Continental has substantial commitments for capital expenditures,
including for the acquisition of new aircraft. As of January 14,
2000, Continental had agreed to acquire a total of 74 Boeing jet
aircraft through 2005. The Company anticipates taking delivery
of 28 Boeing jet aircraft in 2000. Continental also has options for
an additional 118 aircraft (exercisable subject to certain condi-
tions). The estimated aggregate cost of the Company’s firm
commitments for Boeing aircraft is approximately $4 billion.
Continental currently plans to finance its new Boeing aircraft with
a combination of enhanced pass through trust certificates, lease
equity and other third-party financing, subject to availability and
market conditions. Continental has commitments or letters of intent
for backstop financing for approximately 18% of the anticipated
remaining acquisition cost of future Boeing deliveries. In addition,
at January 14, 2000, Continental has firm commitments to pur-
chase 34 spare engines related to the new Boeing aircraft for
approximately $219 million, which will be deliverable through
March 2005. However, further financing will be needed to satis-
fy the Company’s capital commitments for other aircraft and
aircraft-related expenditures such as engines, spare parts, simu-
lators and related items. There can be no assurance that sufficient
financing will be available for all aircraft and other capital expen-
ditures not covered by firm financing commitments. Deliveries of
new Boeing aircraft are expected to increase aircraft rental, depre-
ciation and interest costs while generating cost savings in the areas
of maintenance, fuel and pilot training.
As of January 14, 2000, Express had firm commitments for 43
Embraer ERJ-145 (“ERJ-145”) 50-seat regional jets and 19
Embraer ERJ-135 (“ERJ-135”) 37-seat regional jets, with options
for an additional 100 ERJ-145 and 50 ERJ-135 aircraft exercisable
through 2008. Express anticipates taking delivery of 15 ERJ-145
and 12 ERJ-135 regional jets in 2000. Neither Express nor
Continental will have any obligation to take any of the firm ERJ-
145 or ERJ-135 aircraft that are not financed by a third party and
leased to Continental.

C o n t i n e n t a l A i r l i n e s 1 9 9 9 A n n u a l R e p o r t 6 1
Continental expects its cash outlays for 2000 capital expen-
ditures, exclusive of fleet plan requirements, to aggregate $207
million primarily relating to software application and automation
infrastructure projects, aircraft modifications and mandatory main-
tenance projects, passenger terminal facility improvements and
office, maintenance, telecommunications and ground equipment.
Continental remains contingently liable until December 1,
2015, on $202 million of long-term lease obligations of US
Airways, Inc. (“US Airways”) related to the East End Terminal at
LaGuardia Airport in New York. If US Airways defaulted on these
obligations, Continental could be required to cure the default, at
which time it would have the right to occupy the terminal.
Continental has certain block space arrangements whereby it
is committed to purchase capacity on other carriers at an aggre-
gate cost of approximately $159 million per year. These
arrangements are currently scheduled to expire over the next eight
years. Pursuant to other block-space arrangements, other carriers
are committed to purchase capacity at a cost of approximately $95
million per year on Continental.
Approximately 42% of the Company’s employees are covered
by collective bargaining agreements. The Company’s collective
bargaining agreements with its Express flight attendants and
Continental Airlines flight attendants (representing approximate-
ly 18% of the Company’s employees) became amendable in
November and December 1999, respectively. Negotiations began
in September 1999 to amend these contracts. The Company
believes that mutually acceptable agreements can be reached with
such employees, although the ultimate outcome of the Company’s
negotiations is unknown at this time.
Legal Proceedings
United States of America v. Northwest Airlines Corp. & Continental
Airlines, Inc.: The Antitrust Division of the Department of Justice
is challenging under Section 7 of the Clayton Act and Section 1 of
the Sherman Act the acquisition by Northwest of shares of
Continental’s Class A common stock bearing, together with certain
shares for which Northwest has a limited proxy, more than 50% of
the fully diluted voting power of all Continental stock. The gov-
ernment’s position is that, notwithstanding various agreements
that restrict Northwest’s ability to exercise voting control over
Continental and are designed to assure Continental’s competitive
independence, Northwest’s control of the Class A common stock
will reduce actual and potential competition in various ways and
in a variety of markets. The government seeks an order requiring
Northwest to divest all voting stock in Continental on terms and
conditions as may be agreed to by the government and the Court.
No specific relief is sought against Continental. Trial is currently
set for October 2000.
The Company and/or certain of its subsidiaries are defendants
in various lawsuits, including suits relating to certain environ-
mental claims, the Company’s consolidated Plan of Reorganization
under Chapter 11 of the federal bankruptcy code which became
effective on April 27, 1993, and proceedings arising in the normal
course of business. While the outcome of these lawsuits and pro-
ceedings cannot be predicted with certainty and could have a
material adverse effect on the Company’s financial position, results
of operations and cash flows, it is the opinion of management, after
consulting with counsel, that the ultimate disposition of such suits
will not have a material adverse effect on the Company’s financial
position, results of operations or cash flows.

6 2 C o n t i n e n t a l A i r l i n e s 1 9 9 9 A n n u a l R e p o r t
Note 14 - Related Party Transactions
The following is a summary of significant related party transactions
that occurred during 1999, 1998 and 1997, other than those dis-
cussed elsewhere in the Notes to Consolidated Financial Statements.
The Company and America West Airlines, Inc. (“America
West”), a subsidiary of America West Holdings Corporation, in
which David Bonderman holds a significant interest, entered into
a series of agreements during 1994 related to code-sharing and
ground handling that have created substantial benefits for both
airlines. Mr. Bonderman is a director and stockholder of the
Company. The services provided are considered normal to the
daily operations of both airlines. As a result of these agreements,
Continental paid America West $25 million, $20 million and $16
million in 1999, 1998 and 1997, respectively, and America West
paid Continental $31 million, $27 million and $23 million in 1999,
1998 and 1997, respectively.
In November 1998, the Company and Northwest, a significant
stockholder of the Company, began implementing a long-term
global alliance involving extensive code-sharing, frequent flyer
reciprocity and other cooperative activities. The services provid-
ed are considered normal to the daily operations of both airlines.
As a result of these activities, Continental paid Northwest $7 mil-
lion in 1999, and Northwest paid Continental $9 million in 1999.
During December 1999, Continental entered into an equip-
ment sales agreement with COPA for $8 million. The resulting note
receivable is payable in quarterly installments through October
2002. During 1999, COPA paid Continental $4 million for servic-
es considered normal to the daily operations of both airlines.
In connection with Continental’s investment in Gulfstream,
Continental purchased from Gulfstream, a ten-year $10 million
convertible note, payable in quarterly installments of principal
and interest totaling $0.4 million. Continental also purchased a six
month $3 million secured note, with interest paid quarterly and
principal due at the end of the six months. During 1999,
Continental paid Gulfstream $1 million and Gulfstream paid
Continental $13 million for services considered normal to the daily
operations of both airlines.
Also during December 1999, under a sale and leaseback
agreement with Gulfstream, Express sold 25 Beech 1900-D air-
craft to Gulfstream in exchange for Gulfstream’s assumption of
$81 million in debt. Express is leasing these aircraft from
Gulfstream for periods ranging from eight to 23 months.
Note 15 - Segment Reporting
Information concerning principal geographic areas is as follows
(in millions):
1999 1998 1997
Operating Operating Operating
Revenue Revenue Revenue
Domestic (U.S.) . . . . . . . . . . . . . . $6,066 $5,596 $5,196Atlantic . . . . . . . . . . . . . . . . . . . . 1,102 995 778Latin America . . . . . . . . . . . . . . . 860 769 572Pacific . . . . . . . . . . . . . . . . . . . . . 611 567 648
$8,639 $7,927 $7,194
The Company attributes revenue among the geographical areas
based upon the origin and destination of each flight segment. The
Company’s tangible assets consist primarily of flight equipment
which is mobile across geographic markets and, therefore, has not
been allocated. Continental has one reportable operating segment
(air transportation).

C o n t i n e n t a l A i r l i n e s 1 9 9 9 A n n u a l R e p o r t 6 3
Note 16 - Quarterly Financial Data (Unaudited)
Unaudited summarized financial data by quarter for 1999 and 1998 is as follows (in millions, except per share data):
Three Months Ended
March 31 June 30 September 30 December 31
1999 (a)Operating revenue . . . . . . . . . . . . . . . . . . . . . . . . . . $ 2,042 $ 2,181 $ 2,264 $ 2,152Operating income (loss) . . . . . . . . . . . . . . . . . . . . . . 153 247 202 (2)Income before cumulative effect of
accounting changes . . . . . . . . . . . . . . . . . . . . . . . 85 132 104 167Cumulative effect of accounting changes:
Start-up costs . . . . . . . . . . . . . . . . . . . . . . . . . . . (6) — — —Sale of frequent flyer miles . . . . . . . . . . . . . . . . . (27) — — —
Net income . . . . . . . . . . . . . . . . . . . . . . . . . . . . . . . 52 132 104 167Earnings per common share:
Income before cumulative effect of accounting changes (b) . . . . . . . . . . . . . . . . . . $ 1.25 $ 1.85 $ 1.47 $ 2.46
Cumulative effect of accounting changes, net of tax . . . . . . . . . . . . . . . . . . . . . . . . . . . . . (0.48) — — —
Net income (b) . . . . . . . . . . . . . . . . . . . . . . . . . . $ 0.77 $ 1.85 $ 1.47 $ 2.46Earnings per common share assuming dilution:
Income before cumulative effect of accounting changes (b) . . . . . . . . . . . . . . . . . . $ 1.13 $ 1.73 $ 1.44 $ 2.42
Cumulative effect of accounting changes, net of tax . . . . . . . . . . . . . . . . . . . . . . . . . . . . . (0.42) — — —
Net income (b) . . . . . . . . . . . . . . . . . . . . . . . . . . $ 0.71 $ 1.73 $ 1.44 $ 2.421998
Operating revenue . . . . . . . . . . . . . . . . . . . . . . . . . . $ 1,848 $ 2,030 $ 2,110 $ 1,939Operating income . . . . . . . . . . . . . . . . . . . . . . . . . . 150 280 143 128Nonoperating income (expense), net . . . . . . . . . . . . . (13) (5) (18) (17)Net income . . . . . . . . . . . . . . . . . . . . . . . . . . . . . . . 81 163 73 66Earnings per common share:
Income before extraordinary charge . . . . . . . . . . . $ 1.38 $ 2.74 $ 1.21 $ 1.08Extraordinary charge, net of tax . . . . . . . . . . . . . . — (0.06) — —Net income (b) . . . . . . . . . . . . . . . . . . . . . . . . . . $ 1.38 $ 2.68 $ 1.21 $ 1.08
Earnings per common share assuming dilution:Income before extraordinary charge . . . . . . . . . . . $ 1.06 $ 2.11 $ 0.97 $ 0.91Extraordinary charge, net of tax . . . . . . . . . . . . . . — (0.05) — —Net income (b) . . . . . . . . . . . . . . . . . . . . . . . . . . $ 1.06 $ 2.06 $ 0.97 $ 0.91
Proforma Effect Assuming Accounting Change – Sale of Frequent Flyer Miles – is Applied Retroactively:
Income before Extraordinary Charge . . . . . . . . $ 79 $ 166 $ 71 $ 66Earnings per Common Share (b) . . . . . . . . . . . . $ 1.34 $ 2.72 $ 1.18 $ 1.07Earnings per Common Share
Assuming Dilution (b) . . . . . . . . . . . . . . . . . $ 1.04 $ 2.09 $ 0.96 $ 0.90Net Income . . . . . . . . . . . . . . . . . . . . . . . . . . . $ 79 $ 162 $ 71 $ 66Earnings per Common Share (b) . . . . . . . . . . . . $ 1.34 $ 2.66 $ 1.18 $ 1.07Earnings per Common Share
Assuming Dilution (b) . . . . . . . . . . . . . . . . . $ 1.04 $ 2.05 $ 0.96 $ 0.90
(a) During the fourth quarter of 1999, the Company changed its method of accounting for the sale of mileage credits under its frequent flyer program.Therefore, effective January 1, 1999, the Company recorded a $27 million cumulative effect of a change in accounting principle, net of tax, and hasrestated the quarterly information for 1999 presented herein.
(b) The sum of the four quarterly earnings per share amounts does not agree with the earnings per share as calculated for the full year due to the fact that thefull year calculation uses a weighted average number of shares based on the sum of the four quarterly weighted average shares divided by four quarters.

6 4 C o n t i n e n t a l A i r l i n e s 1 9 9 9 A n n u a l R e p o r t
During the first quarter of 1999, Continental recorded a $6
million cumulative effect of a change in accounting principle, net
of tax, related to the write-off of pilot training costs.
In addition, during the first quarter of 1999, Continental
recorded a $12 million gain ($20 million pre-tax) on the sale of a
portion of the Company’s interest in Equant.
During the fourth quarter of 1999, the Company changed its
method of accounting for the sale of mileage credits under its fre-
quent flyer program. Therefore, effective January 1, 1999, the
Company recorded a $27 million cumulative effect of this change
in accounting principle, net of tax.
During the fourth quarter of 1999, Continental recorded a $182
million gain ($297 million pre-tax) on the sale of its interest in
AMADEUS and a $6 million net gain ($9 million pre-tax) on other
asset sales, including a portion of its interest in Equant.
Also during the fourth quarter of 1999, Continental recorded
a fleet disposition/impairment loss of $50 million ($81 million
pre-tax).
During the second quarter of 1998, Continental recorded a $4
million after tax extraordinary charge relating to prepayment of debt.
During the third quarter of 1998, Continental recorded a fleet
disposition/impairment loss of $77 million ($122 million pre-tax)
relating to its decision to accelerate the retirement of certain jet
and turboprop aircraft.

C o n t i n e n t a l A i r l i n e s 1 9 9 9 A n n u a l R e p o r t 6 5
R E P O R T O F I N D E P E N D E N T A U D I T O R S
We have audited the accompanying consolidated balance sheets of
Continental Airlines, Inc. (the “Company”) as of December 31,
1999 and 1998, and the related consolidated statements of opera-
tions, redeemable preferred stock and common stockholders’ equity
and cash flows for each of the three years in the period ended
December 31, 1999. These financial statements are the responsi-
bility of the Company’s management. Our responsibility is to express
an opinion on these financial statements based on our audits.
We conducted our audits in accordance with auditing standards
generally accepted in the United States. Those standards require
that we plan and perform the audit to obtain reasonable assurance
about whether the financial statements are free of material mis-
statement. An audit includes examining, on a test basis, evidence
supporting the amounts and disclosures in the financial statements.
An audit also includes assessing the accounting principles used and
significant estimates made by management, as well as evaluating
the overall financial statement presentation. We believe that our
audits provide a reasonable basis for our opinion.
In our opinion, the consolidated financial statements referred
to above present fairly, in all material respects, the consolidated
financial position of the Company at December 31, 1999 and 1998,
and the consolidated results of its operations and its cash flows for
each of the three years in the period ended December 31, 1999, in
conformity with accounting principles generally accepted in the
United States.
As discussed in Note 1 to the consolidated financial state-
ments, effective January 1, 1999, the Company changed its method
of accounting for the sale of mileage credits to participating part-
ners in its frequent flyer program.
Houston, Texas
January 17, 2000
R E P O R T O F M A N A G E M E N T
Continental Airlines, Inc. is responsible for the preparation and
integrity of the financial information presented in this Annual Report.
The accompanying financial statements have been prepared in accor-
dance with accounting principles generally accepted in the United
States and reflect certain judgments and estimates of management.
The Company maintains a system of internal controls to pro-
vide reasonable assurance that its financial records can be relied
upon in the preparation of financial statements and that its assets
are safeguarded against loss or unauthorized use. The Company’s
internal audit program monitors the effectiveness of the internal
controls and recommends possible improvements to management
and the Board of Directors. Ernst & Young LLP, independent audi-
tors, are engaged to audit the Company’s financial statements.
Ernst & Young obtains an understanding of the internal control
structure and conducts the tests and other auditing procedures
they consider necessary to render an opinion on the financial state-
ments being audited. The Audit Committee of the Board of
Directors, composed entirely of directors not employed by the
Company and who meet the independence criteria now required
by the New York Stock Exchange, provides oversight of the finan-
cial reporting process through regular meetings with management,
the Company’s internal auditors and Ernst & Young.
There are inherent limitations in the effectiveness of any internal
control system, including the possibility of human error and the cir-
cumvention or overriding of controls. Accordingly, even an effective
internal control system can provide only reasonable assurance with
respect to financial statement preparation. Furthermore, the effec-
tiveness of an internal control system can change with circumstances.
Gordon M. Bethune
Chairman and Chief Executive Officer
Lawrence W. Kellner
Executive Vice President and Chief Financial Officer
The Board of Directors and Stockholders
Continental Airlines, Inc.


E X E C U T I V E O F F I C E R S
Lawrence W. Kellner
Executive Vice President andChief Financial Officer
C.D. McLean
Executive Vice President —Operations
Jeffery A. Smisek
Executive Vice President,General Counsel and Secretary
Michael H. Campbell
Senior Vice President —Human Resources and Labor Relations
Mark A. Erwin
Senior Vice President —Airport Services
Bonnie S. Reitz
Senior Vice President —Sales and Distribution
Barry P. Simon
Senior Vice President —International
Kuniaki Tsuruta
Senior Vice President —Purchasing and Material Services
Janet P. Wejman
Senior Vice President andChief Information Officer
J. David Grizzle
Senior Vice President —Corporate Development
Gerald Laderman
Senior Vice President —Finance
George L. Mason
Senior Vice President —Technical Operations
Deborah L. McCoy
Senior Vice President —Flight Operations
James B. Ream
President, Continental Express, Inc.
C o n t i n e n t a l A i r l i n e s 1 9 9 9 A n n u a l R e p o r t 6 7

B O A R D O F D I R E C T O R S
Thomas J. Barrack, Jr.
Chairman and ChiefExecutive Officer, ColonyAdvisors, Inc.
Gordon M. Bethune
Chairman and ChiefExecutive Officer, ContinentalAirlines, Inc.
David Bonderman
Managing Partner, TexasPacific Group
Gregory D. Brenneman
President and ChiefOperating Officer,Continental Airlines, Inc.
Kirbyjon H. Caldwell
Reverend, The WindsorVillage–St. John’s UnitedMethodist Church
Donald L. Sturm
Chairman and ChiefExecutive Officer, SturmGroup, Inc.
Karen Hastie Williams
Partner, Crowell & Moring
Charles A. Yamarone
Executive Vice President, U.S.Bancorp Libra
Patrick Foley
Chairman, Eventsource.com
DouglasH.McCorkindale
Vice Chairman andPresident, Gannett Co., Inc.
George G. C. Parker
Assoc. Dean for AcademicAffairs and Dir. of the MBAProgram, Graduate School ofBusiness, Stanford University
Richard W. Pogue
Senior Advisor, Dix & Eaton
William S. Price III
Managing Partner, TexasPacific Group
6 8 C o n t i n e n t a l A i r l i n e s 1 9 9 9 A n n u a l R e p o r t

S T O C K H O L D E R I N F O R M A T I O N
Headquart er s
Continental Airlines, Inc.
1600 Smith Street
Houston, TX 77002
Tel. (713) 324-5000
Inve s tor Informat ion
To obtain a Form 10-K or other
financial information, visit the company’s
website at: www.continental.com
or write:
Investor Relations
Continental Airlines, Inc.
P.O. Box 4607
Houston, TX 77210-4607
Transfer Agen t and Reg i s t rar
Harris Trust and Savings Bank
311 West Monroe
P.O. Box A3504
Chicago, IL 60690-3504
Attn: Shareholder Services
Tel. (800) 846-2914
Independen t Accoun tan t s
Ernst & Young LLP
One Houston Center
1221 McKinney
Houston, TX 77010-2007
Common Stock
Continental’s Class B and Class A common stock trade on the New
York Stock Exchange under the symbols CAL and CAL.A. As of
February 16, 2000, there were 52,001,821 shares of Class B and
11,262,949 shares of Class A common stock outstanding, with
approximately 14,668 holders of record of Class B and 2,884 hold-
ers of record of Class A.
Holders of Class B common stock are entitled to one vote per
share, and holders of Class A common stock are entitled to ten
votes per share, on all matters submitted to a vote of common
stockholders, subject to restrictions governing voting rights of
holders who are not United States citizens. Shares of Class A
common stock are convertible at any time into an equal number
of shares of Class B common stock. The Company has not paid
cash dividends on its common stock and has no current inten-
tion to do so. Certain of the Company’s credit agreements and
indentures limit the ability of the Company and certain of its
subsidiaries to pay cash dividends.
Below are the high and low sale prices for the Class B and
Class A common stock as reported on the New York Stock Exchange
for 1999 and 1998:
Class B and Class A Stock Prices for 1999 and 1998
Class B Class A
1999 1998 1999 1998
High Low High Low High Low High Low
First Quarter $4111⁄16 $30 $621⁄16 $44 $4415⁄16 $341⁄8 $641⁄4 $473⁄4
Second Quarter $48 $367⁄16 $64 $541⁄16 $48 $3613⁄16 $641⁄2 $553⁄4
Third Quarter $449⁄16 $315⁄8 $651⁄8 $353⁄4 $443⁄8 $3113⁄16 $643⁄4 $361⁄2
Fourth Quarter $443⁄8 $323⁄8 $4213⁄16 $287⁄8 $4411⁄16 $323⁄16 $435⁄16 $307⁄8
1999 Accomplishments
Fly to Win
■ Added four destinations in Europe and the Middle East, giving us more transatlantic routes from New York than any other carrier
■ Continued to enjoy domestic length-of-haul adjusted RASM premium to the industry
■ Joined with dozens of other airlines to create the leading Internet portal for booking travel, to be launched in 2000
■ Continued our profitable growth from our underdeveloped hubs
■ Drove up on-line bookings on Continental’s website by 173 percent, with E-Ticket sales rising to 47 percent of total sales by the end of
the year
Fund the Future
■ Ended fourth consecutive year with more than $1 billion in cash and short-term investments ($1.6 billion)
■ Took delivery of 58 new Boeing jets and retired 61 older planes, giving Continental one of the youngest jet fleets in the industry, just
7.4 years
■ Continued stock buy-backs, spending $751 million through December 31, 1999 of an authorized $1.2 billion share repurchase program
■ Started operations at a third Newark terminal and updated facilities throughout our franchise hubs
■ Achieved significant income from the sale of non-strategic assets, including our interest in Amadeus and a portion of Equant N.V.
Make Reliability a Reality
■ Implemented Customer First, putting our service promises into plain English for our customers
■ Expanded our Presidents Clubs by adding three lounges
■ Added larger bins to permit our customers to carry on their bags
■ Working to convince Congress to modernize and privatize the air traffic control system
Working Together
■ Paid fifth consecutive year of profit sharing
■ Delivered on our compensation promises and pay for performance
■ Negotiated “Best in Market” health care plans, reducing the cost of health care to most employees
■ Gave away 16 more new Ford Explorers for perfect attendance
■ Signed Continental and Continental Express mechanic contracts
Awards and Recognition
■ Named to Fortune’s “100 Best Companies to Work For in America” list for second consecutive year, moving up to the No. 23 position
■ Ranked as the No. 2 most admired global airline by Fortune magazine
■ Ranked as the No. 2 most admired U.S. airline by Fortune magazine
■ Called the “best airline in the U.S.” by Fortune magazine
■ Named the top-rated U.S. airline for business travel by The Wall Street Journal’s Smart Money magazine
■ Frequent Flyer/J.D. Power and Associates - No. 1 in customer satisfaction on long-haul flights (ranked No. 1 or No. 2 for four
consecutive years)
■ InsideFlyer’s Freddie Awards - OnePass won four awards, including “Program of the Year” and “Best Elite-Level Program”
■ Forrester PowerRankings, Gomez Advisors and NPD Research - No. 1 website
■ OAG Awards - Best Short Haul Executive/Business Class and Best Frequent Flyer Program, only U.S. carrier to win an OAG award
■ Nikkei Business Magazine - Best foreign-flag carrier to North America
■ Travel Trade Gazette Europa - Top airline to North America
■ Inflight Research Services - Top U.S. airline
■ Condé Nast Traveler - Best Transatlantic and Transpacific Business Class among U.S. airlines
■ Hispanic magazine - one of the 100 Best Companies providing the most opportunities for Hispanics
■ National Airline Quality Rating Study -Ranked No. 2 (up from No. 3 last year and last three years ago)

“ f ive years ofworking together”1 9 9 9 A n n u a l R e p o r t
C o n t i n e n t a l A i r l i n e s